Abstract
Grass pea is recognized as one of the most resilient and versatile crops, thriving in extreme environments. It has also high protein content and suitable for forage production. These abilities make the crop a superior product for guaranteeing food security in changing climate conditions. To address this concern, a total of 94 accessions were assessed in relation to three qualitative and 19 quantitative traits in lowland (Antalya, Turkey) and highland (Isparta, Turkey) conditions. There were significant differences among genotypes for all agronomic traits in lowland location. The maximum biological yield was detected in GP104 and GP145 with values of 22.5 and 82.4 g in lowland and highland, respectively. The t-test of significance for mean values indicated that there were significant differences between the growing areas for all agronomic traits except for number of pods. Principal component analysis using the 11 agronomic traits including maturity, yield and yield related-traits showed that 76.4% and 72.2% variability were accounted for the first four principal components (PCs) with eigenvalues ≥ 1 in collection grown in highland and lowland, respectively. The data on variations in agronomic, quality and forage traits detected in this research provided useful genetic resources. The parental genotypes which have desired traits can be used in grass pea improvement programs to develop new cultivars.
1. Introduction
The impact of climate change on agriculture varies depending on the region [1]. The environmental effects on plants can emerge as reduced water availability, rising temperatures, the pest and disease epidemics and an increase in the frequency of different extreme events [2]. Alternative varieties/types or new crops are required to provide a steady food supply under changing environmental conditions [3]. Most of agricultural systems in different countries, therefore, have re-designed their breeding approaches based on growing population and climate change. Increasing research focused on developing and improving plants that are underutilized or neglected should be one of the important parts of new breeding studies. Lathyrus sativus L. is a legume crop that belongs to the Lathyrus genus, which includes 187 different species and subspecies [4,5]. Grass pea is recognized as one of the most resilient and versatile crops, thriving in extreme environments and climatic conditions such as cold, heat, drought, salinity-affected soils, and flooding, and is resistant to insect attacks, when compared to other legume crops [4,6]. These characteristics make it a superior product for guaranteeing food security, particularly in the face of anticipated climate challenges [3]. Its seeds contain about 8.6–34.6% protein content, which is higher than chickpea [7], and can replace rapeseed and soybean meal in animal feed, moderately [8]. It is therefore used, not only for human food, but also for livestock feed, forage and green manure [9]. According to Hanbury et al. [10], the grass pea offers a cheap, high-protein, and currently under-utilized feed source due to the rising demand for animal products.
However, excessive consumption of grass pea seeds can cause lathyrism, occurred by the non-protein amino acid β-N-oxalyl-L-α, β-diaminopropionic acid (β-ODAP). It is thought that the presence of β-ODAP as a free amino acid in seeds and in significant concentrations in drought-tolerant grass pea is what causes this debilitating illness [11] affecting both animals and humans [12]. Indeed, when consumed in high quantities over an extended period of time (as is frequently the case during famine), “lathyrism” can result in permanent paralysis and brain damage [12]. According to a report by Abd El Moneim et al. [13], grass pea seeds should have an β-ODAP level of less than 0.22% for safe consumption to reduce the danger of lathyrism. Environmental conditions have a significant impact on the amount of β-ODAP content in grass pea seeds [4]. Its concentration varies commonly among both genotypes and environments [14]. Further domestication and improving of this crop for food (as low β-ODAP) and fodder (as high as biological and seed yield) have been made necessary [15]. Therefore, generating germplasm/cultivars with a low β-ODAP content should be the main goal of both traditional and contemporary breeding programs on Lathyrus [15]. Additionally, the majority of traditional breeding programs for grass peas have emphasized using the selection criterion to increase yield (number of branches per plant). The single node double blooms or pods, higher protein content, 100-seed weight, and forage traits are also important characteristics that can be used in grass pea breeding studies [15,16].
The improvement of quantitative traits related to yield and quality is the main target of breeding programs [17]. With the use of only few elite lines and/or cultivars make a limited contribution to the improvement studies because of their narrow genetic base [18]. Selection from a collection with high diversity makes it more possible to discover the desired traits [19]. Lots of genetic diversity studies have been conducted in grass pea for different regions [5,20,21,22,23,24,25,26] to find new traits and develop cultivars in the respective region. However, there is no study which was conducted in two different climatic conditions (lowland and highland) in grass pea. From this perspective, we evaluated a total of 94 grass pea accessions with agro-morphological traits, nutritional contents and β-ODAP contents in lowland and highland environmental areas. The evaluation of agronomic, food and forage traits for economic importance should be useful for choosing the appropriate genetic resources for crop improvement.
2. Materials and Methods
2.1. Genetic Material
The grass pea collection, 250 accessions from USDA and 24 accessions from ICARDA, were evaluated as an initial genetic material in this study (Table S1). This genetic resource was coded “GP” and ordered. It was grown in the experimental field of Akdeniz University in Antalya, Turkey (36°53′56.2″ N 30°38′30.3″ E) in 2018. However, 184 out of 274 accessions were discarded from the study because they did not produce sufficient seeds. Remaining genetic material (90 accessions) and four registered controls (Karadağ, İptaş, Gürbüz and Ceora) (Table S2) were used to conduct field trials in both locations, Antalya and Isparta, Turkey (Figure 1).
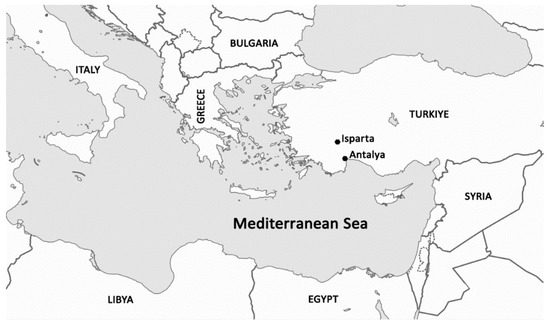
Figure 1.
(•) The site of experimental areas (Isparta (37°50′12.3″ N 30°32′31.1″ E) and Antalya (36°53′56.2″ N 30°38′30.3″ E), Turkiye).
2.2. Field Trials
2.2.1. First Year in Field Trials (2019)
A total of 94 grass pea genotypes were grown in the experimental field of Akdeniz University at Antalya, Turkiye (36°53′56.2″ N 30°38′30.3″ E) (lowland). Before seeding, 15-15-15 (N-P-K) compound fertilizer was applied as 10 kg da−1 during the soil tillage stage. Grass pea seeds were sown on 5 December 2019 in a randomized complete blocks design with two replications. Each genotype was grown in two rows of 3 m length with a row-to-row distance of 50 cm and plant to plant within a row of 10 cm. The plants were not irrigated during the trial period. Standard agronomic practices were applied to all plots. The harvest was performed on 30 May 2020.
2.2.2. Second Year in Field Trials (2020)
The 2nd year studies were carried out with the same genetic material in both locations, Antalya (lowland) and Isparta (highland). The field trial in Antalya was established on 23 December 2020 in the same experimental area with a randomized complete blocks design with two replications. The seeds were also sown on 20th October 2020 in the field of Isparta Applied Sciences University (37°50′12.3″ N 30°32′31.1″ E) in Isparta with an augmented experimental design. The experimental field was divided into three blocks of equal size and each block had four checks replicated across the three blocks in augmented treatment. Soil type of each location was monitored in Table 1. It shows that the pH of the soils in both Antalya and Isparta fields are neutral, the lime content is high, slightly salty and sufficient in terms of organic matter. Each experimental field consisted of a 3 m row on a ridge. Spacing was 50 cm between rows and 10 cm between plants in both locations. Similarly, standard agronomic practices were applied in both fields. The seeds were harvested on 25 May 2021 and 15 June 2021 in Antalya and in Isparta respectively.

Table 1.
The chemical and physical properties of soil in the experiment fields.
2.3. Climatic Conditions
The monthly temperature, precipitation, and humidity were recorded by the State Meteorology Station for Antalya (Table S3) and Isparta (Table S4). For 2018–2019 and 2019–2020, there were similar trends for temperatures, with the lowest temperatures occurring in January and February and the highest in June at Antalya. The highest rainfall was recorded in December. Additionally, there was less rainfall in 2018–2019 than in 2019–2020 in all growing seasons except for January, April and June. Similarly, the highest rainfall was observed in December and January in Isparta (highland), however at least 40% total rainfall was recorded compared to Antalya. The coldest month in highland is January, with 5.2 (°C), followed by February and March (Table S4).
2.4. Data Collection
Although all of the genotypes successfully passed the seedling period and bloomed, limited seed holding was occurred in 184 genotypes. The qualitative traits were recorded for the initial collection (274 accessions). However, 94 lines were used to get observations for quantitative and nutritional traits. Grass pea descriptors [4] were used for recording qualitative and quantitative characteristics. Plants were characterized by the following traits: days of first flowering, days of 50% flowering, plant height, pod number per plant, number of branches per plant, pod height, pod width, stem diameter, hundred seed weight, biological yield per plant and seed yield per plant. In addition, β-ODAP, raw protein, acid detergent fiber (ADF), and neutral detergent fiber (NDF) were determined from the seeds of grass pea.
2.5. Chemical Analysis
2.5.1. β-ODAP Content
In the first stage of analysis, a blender was used for homogenization. These samples were divided into 1-g portions in individual 50-mL sample tubes. Then, 25 mL of extraction solution, 0.1% (v/v) formic acid in water:methanol (50:50) (v/v), was added to the sample tube. For recovery studies, a standard was added to the tube at this stage. The mixture was extracted using Ultra-Turrax (IKA, Germany) for 2 min at 10,000 rpm. Centrifuging was done on the extracted samples for 10 min at 4 °C and 4000 rpm. The supernatant was passed through a 0.2-µm PTFE membrane filter. Filtered samples were diluted with a mobile phase and injected at 10 µL volumes to LC-MS/MS. β-ODAP was purchased from ChemFaces (Wuhan, China), with high purity (>98%). After extraction, β-ODAP content was identified with the UHPLC-MS/MS method, which has been detailed in the study by Arslan et al. [27].
2.5.2. Forage Traits
The Kjeldahl method was used for nitrogen content, and the crude protein ratio was calculated using a conversion factor of 6.25. ADF and NDF concentrations were determined according to standard laboratory procedures for forage quality analysis outlined by Ankom Technology. ANKOM F57 filter bags were used for ADF and NDF analysis in this study. Total digestible nutrients (TDN), dry matter intake (DMI), digestible dry matter (DDM), and relative feed value (RFV) were estimated [28] according to the following equations adapted from:
TDN = (−1.291 × ADF) + 101.35
DMI = 120% NDF% dry matter basis
DDM = 88.9 − (0.779 × ADF% dry matter basis)
RFV = DDM% × DMI% × 0.775
2.6. Data Analysis
Qualitative data were analyzed using percentage distribution. Analysis of variance was conducted using SAS 9.1 (Cary, NC, USA) [29]. Augmented randomized complete block design was performed using the “augmentedRCBD” package developed by Aravind et al. [30] in R-Studio (version 2022.02.0) (Boston, MA, USA) [31]. The least significant difference (LSD) test was used for mean comparison in the analysis of variance. Principal component analysis (PCA) was performed with the quantitative traits data using the Minitab 19.1 software (State College, PA, USA) [32]
3. Results
In this study, the large and diverse grass pea collection grown in highland and lowland conditions was evaluated with three qualitative, 11 quantitative, six forage and two quality traits. The frequency distribution of qualitative traits, flower colors, plant growth habits and seed color of the grass pea genotypes were shown in Figure 2. There was a large variation among grass pea genotypes in terms of flower colors. Nine different flower colors were observed in the grass pea collection as blue, white, blue-white, dark blue, purple, light blue, pink, blue-purple and red with percentages of 28.1, 24.45, 21.53, 13.5, 7.3, 2.55, 1.46, 0.73 and 0.36%. Furthermore, three plant growth habits were determined as erect (50%), semi-erect (40%) and spreading (10%). The seeds of the collection had a gray color with a value of 57%.
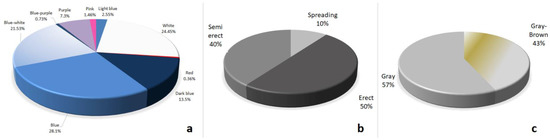
Figure 2.
Frequency distribution of qualitative traits in the whole collection. (a) the color of flowers; (b) growing type; (c) seed color.
According to the analysis of variance, there were significant differences among genotypes for all traits in Antalya (lowland) location (Table S2). The mean number of days of the first flowering varied from 88.8 to 109, and the number of days of 50% flowering ranged from 99.5 to 120.5 in the collection. In the average of two years, the genotypes GP23, GP11, and GP114 had the earliest flowering date. The highest plant height was recorded in GP213 with a value of 90.8, while the shortest plant was GP10 had a plant height of 41.5 cm. The grand mean of number of pods was 23.77 and check cultivars, Corea and Gürbüz showed a higher number of pods than the mean of the germplasm. The maximum and minimum biological yield was detected in GP104 and GP23 with values of 22.5 and 3.3 g, respectively. The seed yield ranged from 1.2 to 7.3 g. The highest seed yield was observed in genotype GP105, followed by GP 104 and GP 249, the mean of collection was 3.01 g. Among the check cultivars, İptaş gave the highest seed yield, however 40 genotypes of the collection had higher means for seed yield than this check cultivar.
A total of 90 genotypes along with four check cultivars were evaluated at field condition in Isparta (highland) for quantitative agronomic traits using an augmented experimental design (Table S5). The analysis of variance showed that there was a significant (<0.01) difference among the genotypes for all traits except for days of the first flowering. The results revealed no significant differences were observed for blocks except for traits of number of pods, number of branches and stem diameter (Table S6). The number of days to first flowering ranged from 172.1 to 206.3 days, and the number of days to 50% flowering ranged from 181.3 to 213.3 days. The check cultivar, Corea had the earliest 50% flowering date among the check cultivars with a value of 178, only genotypes GP230 and GP247 had higher values compared to this cultivar (Table S5). GP107 and GP105 had the tallest plants, while GP246 was the shortest (15.6 cm). Genotype GP156 and GP145 gave the highest number of pods (62) as well as GP145 produced the highest biological yield being 82.4 g in the highland conditions. There was also a lot of variation in the collection for hundred-seed weight and seed yield traits, which ranged from 4.1 to 82.4 g and 0.9 to 33 g, respectively (Table S5). The genotype GP40 had the highest seed yield followed by GP161, GP18 and GP 19.
Significant differences were observed in the germplasm for quality and forage traits among genotypes grown in Antalya (lowland) (Table S7). The β-ODAP content (%) ranged from 0.25 to 0.49, the average being 0.38. The genotypes GP213, GP49, GP58, GP60 and GP110 had the lowest values for this trait while the genotypes GP248 and GP227 had the highest content. The lowest value was 0.38 among the check cultivars. The maximum amount of protein content was recorded for GP53 in the germplasm, with a notable higher value in the quantity of this trait observed in the genotypes of GP40, GP270 and GP197. Regarding ADF (%), genotypes GP251, GP243, GP248 and GP23 had the highest values over the 9.0 in the mean of two years, the check cultivar, Karadağ had the highest check cultivar with value of 8.82. There were four genotypes (GP34, GP156, GP225 and GP149) had an NDF > 17%, the mean of the collection was 13.98. The DMI and DDM ranges in the collection varied from 6.48 to 9.96 and 81.48 to 83.4 with mean values of 8.45 and 82.45, respectively.
The ANOVA analysis of the genotypes showed a highly significant variation in all quality and forage traits in highland conditions (Table S8). There is a non-significant difference among the blocks for these traits in augmented experiment design. Overall, the β-ODAP content (%) corresponding to the genotypes was 0.35 (Table S9). The lowest values were recorded for GP17, GP18 andGP49 with the means of 0.19, 0.21, 0.22, respectively. GP215 had the greatest mean value (0.51) for this trait. The maximum and minimum protein content (%) were detected in the genotypes GP242 and GP225. The genotype, GP248 also had >24% protein content which is higher than the mean of all check cultivars (Table S9). The mean of ADF and NDF values were 8.43 and 15.72, respectively. The highest mean was 10.22 for ADF and 24.23 for NDF. The genotype GP248 was superior for these traits whose means were 10.15 and 19.78, respectively, they were higher than general means and check cultivars. The highest DMI was recorded for GP242, followed by GP43 and GP207. The check cultivar, Corea was the fourth genotype for this trait. When all genotypes were combined, the total mean of total digestible nutrients was 90.47%, with GP213 being the top genotype for this trait. The highest relative feed value was observed in GP242 (668.63) while the lowest value was measured in GP199 (316.72) in the collection.
The grass pea collection examined in this study had 94 genotypes and was evaluated in lowland and highland conditions. The t-test of significance for mean values indicated that there were significant differences between the growing areas for all agronomic traits except for the number of branches (Table 2). These genotypes grown in two different environmental area were also compared with quality and forage traits. The mean values for β-ODAP content, raw protein ADF, NDF, DMI and RFV were significantly different between the genotypes grown in lowland and highland (Table 2).
Table 2.
Means and standard errors for 11 quantitative and eight quality traits in 94 genotypes produced in Antalya (lowland) and Isparta (highland).
The PCA using the 11 quantitative traits including maturity traits, yield and yield related-trait showed that more than 76.4% and 72.2% variability were accounted for the first four principal components (PCs) with eigenvalues ≥ 1 in the collection grown in Isparta (highland) and Antalya (lowland) (Table 3). The 1st principal component (PC1) had an eigenvalue of 3.89 and explained 35.4% of the total variation in highland. Seed yield and biological yield had the highest positive eigenvectors in PC1, while the pod height had the highest negative eigenvector. The second component (PC2) explained 17.1% of the total variance with an eigenvalue of 1.87 and was mainly correlated with flowering traits, negatively (Table 3). In lowland, the first principal component’s (PC1) eigenvalue was 3.36, explaining 30.36% of the total variation, the highest positive eigenvector was biological yield (Table 3). The PC2 explained 16.3% of the total variance and was correlated with days to first flowering, days to 50% flowering, plant height, and the number of pods and stem diameter, positively. The traits of quality and forage were also evaluated with PCA for the grass pea collection grown in lowland and highland (Table 4). Results showed that in the analysis, three components had eigenvalues > 1 for highland andthey explained 93.7% of the variability among the 94 genotypes grown in highland. The PC1 explained 57.2% of the total variance and was positively correlated with all quality and forage traits except for ADF and NDF. The PC1 explained 52.79% of the total variance (75.9%) and was positively correlated with raw protein, TDN, DMI, DDM and RFV in the collection that was evaluated in lowland.
Table 3.
Eigenvectors for the four principal components (PCs) of traits associated with agronomic performance of 94 grass pea genotypes produced in two different regions.
Table 4.
Eigenvectors for principal components (PCs) of traits associated with forage and quality value of 94 grass pea genotypes produced in two different regions.
4. Discussion
This study was carried out in two different locations; lowland and highland, showed that this special grass pea collection has great variation with respect to seed yield, yield components, quality and forage traits. Obtaining a higher seed yield for different environmental conditions is one of the most important challenges in plant breeding [19]. However, improving the traits related to yield characteristics such as double podding, more seeds per pod, plant height or branches are also highly critical to obtain desired grass pea lines [4]. Our collection was characterized by three qualitative and 19 quantitative traits to develop desired cultivars. Similarly, different germplasm resources have been characterized with different agro-quality traits in grass pea [20,22,25,33,34].
Based on comparison between their altitudes, the mean number of days to the first flowering was found to be shorter in lowland environmental conditions. Altitude levels and sun exposure times are thought to be responsible for these differences [35]. The results obtained in our study were found to be higher when compared to the studies conducted in European countries and India [35,36,37]. Furthermore, the highest day of 50% flowering was determined as 213.3 days (GP107) in highland (Table S5) and the lowest mean was 120.5 days (GP237) in lowland (Table S6). While our findings regarding the flowering period are in agreement with the results of Çakmakçı and Çeçen [38], Şeydoşoğlu et al. [39] and Öten et al. [40], they are higher than the findings of Kumari [37]. Grela et al. [41] stated that variation of these traits depends on the environmental factors, especially on soil type and precipitation amount during vegetation period. Plant height effects both seed and biological yield in grass pea. In the present study, plant height ranged from 41.5 cm to 90.8 cm in lowland conditions and 15.6–76.8 cm in highland conditions. In the research of grass pea, it was reported that the plant height was determined between 24.5 cm and 172.0 cm by different studies [35,42,43]. These results clearly revealed that environmental differences highly affect the plant height trait of grass pea. We also had large variation for the number of branches and comparable results were also observed as 6.10–13.00 [44], 3.73–6.00 [45], 4.6–8.6 [46]. The hundred-grain weight is considerable in terms of giving an idea about the grain’s size, fullness, thinness and flour yield. We obtained the maximum value as 23.8 in highland and 29.39 in lowland. These are higher values than those obtained by Aksu et al. [43] and Başaran et al. [44]. However, Grela et al. [35], Ribinski et al. [47] monitored higher weights in this trait compared to our maximum results. Biological yield frequently used as yield selection criteria, especially in studies to increase grain yield in cereal and legume plants [48]. The maximum biological yield was detected in GP104 and GP145 in lowland and highland, respectively. These genotypes, therefore, should be used in cultivar development program and also as parents in crossing programs to obtain superior lines. Looking at the seed yield, we observed increased mean values compared to the check cultivar average values. Moreover, in comparison with Antalya and Isparta for seed yields, we observed significant differences between genotypes (Table S8). According to Pandey et al. [34], seed yield per plant in grass pea ranged from 0.5 to 19.7 g, whereas Ribinski et al. [47] claimed that it ranged from 7.20 to 21.19 g. Especially, we obtained lower values in lowland compared to highland and these previous studies. According to Das et al. [15] one of the important factors influencing seed yield is ecological difference. In addition, PCA analysis demonstrated that seed yield and biological yield had high and positive values in PC1 both environmental areas. Similar these traits positively contributed to PC was obtained by Polignano et al. [49] when they characterized of genetic diversity of grass pea entries.
Genotype x environment effects play an important role in the phenotypic expression of ODAP content, which is polygenically inherited [50]. Low ODAP is frequently linked to undesired features such as late flowering and low seed and biological yields [51]. Therefore, new breeding programs have been successful in achieving both low ODAP, high yield and protein in recent years [5]. The β-ODAP content of the genotypes grown in lowland (Antalya) and highland (Isparta) regions has significantly different (Tables S7 and S9). We obtained large variation for β-ODAP content among the genotypes and lands and it is showed that this trait is affected by both genetic and environmental factors [52,53]. The genotypes GP2 and GP49 genotypes in collection are notable for having low β-ODAP concentrations in both Antalya and Isparta. These accessions therefore provide better opportunities for developing high seed yielding and low B-ODAP cultivars suitable for studied regions. Previous studies indicated that there was no genotype of grass pea that was β-ODAP free, although in several genotypes the β-ODAP content was low [6]. Futhermore, many researchers [14,54,55] found that these low-toxin cultivars did not have stable -ODAP levels in grass pea seeds when grown under different environmental conditions. The β-ODAP content in grass pea seed had high variation depends on genotype and environmental conditions and it ranged from 0.02 to 7.2% [56]. Onar et al. [57] reported that they found the amount of β-ODAP in local grass pea varieties grown in Turkey, ranged from 0.10% to 0.87% (w/w). Arslan et al. [27] investigated the β-ODAP contents of 173 local grass pea genotypes in lowland conditions and obtained values ranging from 1.55 mg/g to 20.8 mg/g, showing the genotype effect on this trait.
Crude protein content is a significant indicator of feed quality [58]. The minimum crude protein content in ruminant diet should be around 6.0 to 8.0% of dry matter for adequate activity of rumen microorganisms [59], suggesting that hay crude protein content in investigated grass peas is more than twice or thrice the needed ratios. The highest crude protein ratios were found in GP242 (24.64%) and GP248 (24.08%) genotypes in highland (Table S9), GP53 (27.09%), GP40 (26.88%) and GP270 (26.55%) in lowland (Table S7). There were significant differences among genotypes grown in two different locations (Table 2). Differences in crude protein ratios of the genotypes were mainly resulted from plant genetics, but leaf, spike and stem ratios, ripening periods, temperature and fertilization might also have significant effects on crude protein contents [60]. Present crude protein contents of some genotypes were similar to the findings of Basaran et al. [61]. In fact, Basaran et al. [61] stated that due to ecological differences in the regions where grass pea genotypes are collected, variation in seed crude protein concentrations can be linked to ecological factors rather than genetic variation.
Increasing ADF ratios reduces digestibility of the feeds and increasing NDF ratios reduces feed intake and make the animals feel full, thus limit feed intake and feed availability. Since high ADF and NDF ratios have negative effects on feed intake and digestibility, feeds with ideal ADF and NDF values are usually preferred [62]. ADF content of grass pea varied between 6.87 and 9.74% in lowland, while they varied between 7.19 and 10.22% in highland. Lower ADF values are preferred for animal production due to the negative correlation between ADF values and ruminant digestion [63]. Therefore, genotypes having the lowing values should be taken into consideration for forage breeding. NDF content of grass pea varied between 11.15 and 17.58% in lowland, while it varied between 11.52 and 24.23% in highland. Grela et al. [35] found NDF between 11.25 and 18.92%, while Karadag and Yavuz [63] found it between 10.18 and 13.55%. The monogastric and ruminants should have lower NDF content in their feed. Furthermore, ruminant animals may require a certain amount of NDF values, but higher NDF values may reduce animal intake [63]. The TDN refers to the nutrients that are available for livestock and are related to the ADF concentration of the forage [64]. As ADF increases, there is a decline in TDN which means that animals are not able to utilize the nutrients that are present in the forage [65]. In Antalya ecological conditions, line GP270 had the highest TDN and DDM values, while line GP248 had the lowest. When the averages of both regions in terms of TDN, DMI, DDM and RFV were compared, it was determined that the values in Antalya were higher. According to the Hay Market Task Force of American Forage and Grassland Council standards, the genotype is classed as premium quality when it has protein content > 19, ADF < 31%, NDF < 40%, and RFV > 151. The scale showed that lots of genotypes in the collection should be classed as premium with regard to forage quality. Considering all the results, GP60 in lowland and GP40 in highland were considered the most promising lines for grass pea breeding with their high crude protein content, low ADF, NDF and β-ODAP ratios, as well as biological yield.
Supplementary Materials
The following supporting information can be downloaded at: https://www.mdpi.com/article/10.3390/agronomy12102426/s1, Table S1: The initial genetic material of the study; Table S2: Means of 11 agronomic traits for grass pea collection produced in the 2020 and 2021 growing seasons, Antalya (lowland), Turkey; Table S3: Monthly temperature, precipitation and humidity values of experimental area in Antalya (lowland); Table S4: Climatic data for experimental area in Isparta (highland); Table S5: Means of 11 agronomic traits for grass pea collection produced 2021 growing season, Isparta (highland), Turkey; Table S6: Analysis of variance of augmented block design for 11 agronomic traits in grass pea collection produced 2021 growing season in Isparta (highland), Turkey; Table S7: Means of quality and forage traits for grass pea collection produced in the 2020 and 2021 growing seasons, Antalya (lowland), Turkey; Table S8: Analysis of variance of augmented block design for forage and quality traits in grass pea collection produced 2021 growing season in Isparta (highland), Turkey; Table S9. Means of eight quality and forage traits for grass pea collection produced in the 2021 growing season, Isparta (lowland), Turkey
Author Contributions
Conceptualization, M.A. and E.Y.; methodology, E.Y.; validation, M.A. and M.T.; formal analysis, E.Y.; investigation, M.A.; resources, M.A.; data curation, M.A and M.T.; writing—original draft preparation, M.A. and E.Y.; writing—review and editing, E.Y.; visualization, E.Y.; supervision, E.Y.; project administration, M.A.; funding acquisition, M.A. All authors have read and agreed to the published version of the manuscript.
Funding
This study was funded by the Scientific Research Projects Coordination Unit of Akdeniz University, Turkey with the project code: FBA-2020-5294.
Institutional Review Board Statement
Not applicable.
Informed Consent Statement
Not applicable.
Data Availability Statement
Not applicable.
Acknowledgments
We are grateful to USDA, ARS Plant Genetic Resources Conservation Unit and International Center for Agricultural Research in the Dry Areas (ICARDA) for supplying genetic material several times.
Conflicts of Interest
The authors declare no conflict of interest. The funders had no role in the design of the study; in the collection, analyses, or interpretation of data; in the writing of the manuscript; or in the decision to publish the results.
References
- Araujo, S.S.; Beebe, S.; Crespi, M.; Delbreil, B.; González, E.M.; Gruber, V.; Lejeune-Henaut, I.; Link, W.; Monteros, M.J.; Prats, E.; et al. Abiotic stress responses in legumes: Strategies used to cope with environmental challenges. Crit. Rev. Plant Sci. 2015, 34, 237–280. [Google Scholar] [CrossRef]
- Hanjra, M.A.; Qureshi, M.E. Global water crisis and future food security in an era of climate change. Food Policy 2010, 35, 365–377. [Google Scholar] [CrossRef]
- Gonçalves, L.; Rubiales, D.; Bronze, M.R.; Vaz Patto, M.C. Grass pea (Lathyrus sativus L.)—A sustainable and resilient answer to climate challenges. Agronomy 2022, 12, 1324. [Google Scholar] [CrossRef]
- Campbell, C.G. Grass Pea, Lathyrus sativus L.; Promoting the Conservation and Use of Underutilized and Neglected Crops. Nr 18; Institute of Plant Genetics and Crop Plant Research: Rome, Italy; International Plant Genetic Resources Institute: Gatersleben, Germany, 1997; p. 92. [Google Scholar]
- Hanbury, C.D.; Siddique, K.H.M.; Galwey, N.W.; Cocks, P.S. Genotype-environment interaction for seed yield and ODAP concentration of Lathyrus sativus L. and L. cicera L. in Mediterranean-type environments. Euphytica 1999, 110, 45–60. [Google Scholar] [CrossRef]
- Vaz Patto, M.C.; Skiba, B.; Pang, E.C.K.; Ochatt, S.J.; Lambein, F.; Rubiales, D. Lathyrus improvement for resistance against biotic and abiotic stresses: From classical breeding to marker assisted selection. Euphytica 2006, 147, 133–147. [Google Scholar] [CrossRef]
- Longvah, T.; Ananthan, R.; Bhaskarachary, K.; Venkaiah, K. Indian Food Composition Table; National Institute of Nutrition: Hyderabad, India, 2017; pp. 1–578. [Google Scholar]
- Castell, A.G.; Cliplef, R.L.; Briggs, C.J.; Campbell, C.G.; Bruni, J.E. Evaluation of lathyrus (Lathyrus sativus L.) as an ingredient in pig starter and grower diets. Can. J. Anim. Sci. 1994, 74, 529–539. [Google Scholar] [CrossRef]
- Fikre, A.; Korbu, L.; Kuo, Y.-H.; Lambein, F. The contents of the neuro-excitatory amino acid β-ODAP (β-N-oxalyl-L-α,β-diaminopropionic acid), and other free and protein amino acids in the seeds of different genotypes of grass pea (Lathyrus sativus L.). Food Chem. 2008, 110, 422–427. [Google Scholar] [CrossRef]
- Hanbury, C.D.; White, C.L.; Mullan, B.P.; Siddique, K.H.M. A review of the use and potential of Lathyrus sativus L. and L. cicera L. grain for animal feed. Anim. Feed. Sci. Technol. 2000, 87, 1–27. [Google Scholar] [CrossRef]
- Lambein, F.; Travella, S.; Kuo, Y.-H.; Van Montagu, M.; Heijde, M. Grass pea (Lathyrus sativus L.): Orphan crop, nutraceutical or just plain food? Planta 2019, 250, 821–838. [Google Scholar] [CrossRef]
- Hillocks, R.J.; Maruthi, M.N. Grass pea (Lathyrus sativus): Is there a case for further crop improvement? Euphytica 2012, 186, 647–654. [Google Scholar] [CrossRef]
- Abd El Moneim, A.M.; Van Dorrestein, B.; Baum, M.; Mulugeta, W. Role of ICARDA in Improving the nutritional Quality and Yield Potential of Grass Pea (Lathyrus sativus) for Subsistence Farmers in Developing Countries: CGIAR-Wide Conference on Agriculture Nutrition; International Food Policy Research Institute: Washington, DC, USA, 1999; pp. 5–6. [Google Scholar]
- Dahiya, B.S.; Jeswani, L.M. Genotype and environment interactions for neurotoxic principle (BOAA) in grass pea. Indian J. Agric. Sci. 1975, 45, 437–439. [Google Scholar]
- Das, A.; Parihar, A.K.; Barpete, S.; Kumar, S.; Gupta, S. Current perspectives on reducing the β-ODAP content and improving potential agronomic traits in grass pea (Lathyrus sativus L.). Front. Plant Sci. 2021, 12, 703275. [Google Scholar] [CrossRef] [PubMed]
- Basaran, U.; Mut, H.; Onal-Asci, O.; Acar, Z.; Ayan, I. Variability in forage quality of Turkish grass pea (Lathyrus sativus L.) landraces. Turk. J. Field Crops 2011, 16, 9–14. [Google Scholar]
- Upadhyaya, H.D.; Swamy, B.P.M.; Goudar, P.V.K.; Kullaiswamy, B.Y.; Singh, S. Identification of diverse groundnut germplasm through multienvironment evaluation of a core collection for Asia. Field Crops Res. 2005, 93, 293–299. [Google Scholar] [CrossRef]
- Gupta, S.K.; Baek, J.; Carrasquilla-Garcia, N.; Penmetsa, R.V. Genome-wide polymorphism detection in peanut using next-generation restriction-site-associated DNA (RAD) sequencing. Mol. Breed. 2015, 35, 145. [Google Scholar] [CrossRef]
- Yol, E.; Furat, S.; Upadhyaya, H.D.; Uzun, B. Characterization of groundnut (Arachis hypogaea L.) collection using quantitative and qualitative traits in the Mediterranean basin. J. Integr. Agric. 2018, 17, 63–75. [Google Scholar] [CrossRef]
- Tay, J.; Valenzuela, A.; Venegas, F. Collecting and evaluating Chilean germplasm of grasspea (Lathyrus sativus L.). Lathyrus Lathyrism Newsl. 2000, 1, 21. [Google Scholar]
- Abd El-Moneim, A.M.; Dorrestein, B.V.; Baum, M.; Ryan, J.; Bejiga, G. Role of ICARDA in improving the nutritional quality and yield potential of grasspea (Lathyrus sativus L.) for subsistence farmers in dry areas. Lathyrus Lathyrism Newsl. 2001, 2, 55–58. [Google Scholar]
- Kumari, V. Stable genotypes of grasspea for mid hill conditionsof Himachal Pradesh. Indian J. Genet. 2000, 60, 399–402. [Google Scholar]
- Tadesse, W.; Bekele, E. Variation and association of morphological and biochemical characters in grass pea (Lathyrus sativus L.). Euphytica 2003, 130, 315–324. [Google Scholar] [CrossRef]
- Tadesse, W.; Bekele, E. Phenotypic diversity of Ethiopian grass pea (Lathyrus sativus L.) in relation to geographical regions and altitudinal range. Genet. Resour. Crop Evol. 2003, 50, 497–505. [Google Scholar] [CrossRef]
- Tavoletti, S.; Iommarini, L.; Crinò, P.; Granati, E. Collection and evaluation of grasspea (Lathyrus sativus L.) germplasm of central Italy. Plant Breed. 2005, 124, 388–391. [Google Scholar] [CrossRef]
- Sammour, R.H. Genetic diversity in Lathyrus sativus L. germplasm. Res. Rev. BioSci. 2014, 8, 325–336. [Google Scholar]
- Arslan, M.; Oten, M.; Erkaymaz, T.; Tongur, T.; Kilic, M.; Elmasulu, S.; Cinar, A. β-N-oxalyl-L-2,3-diaminopropionic acid, L-homoarginine and asparagine contents in the seeds of different genotypes Lathyrus sativus L. as determined by UHPLC-MS/M. Int. J. Food Prop. 2017, 20, S108–S118. [Google Scholar] [CrossRef]
- Horrocks, R.D.; Vallentine, J.F. Harvested Forages; Academic Press: London, UK, 1999; p. 426. [Google Scholar]
- SAS Institute. SAS/STAT Software 9.1; SAS Institute Inc.: Cary, NC, USA, 2003. [Google Scholar]
- Aravind, J.; Mukesh Sankar, S.; Wankhede, D.P.; Kaur, V. augmentedRCBD: Analysis of Augmented Randomised Complete Block Designs, R Package Version 0.1.5. 2021. Available online: https://aravind-j.github.io/augmentedRCBD/index.html (accessed on 20 August 2022).
- R Core Team. R: A Language and Environment for Statistical Computing; R Foundation for Statistical Computing: Vienna, Austria, 2022; Available online: https://www.R-project.org/. (accessed on 24 August 2022).
- MINITAB. Minitab Package Program. 2019. [Google Scholar]
- Jain, H.K.; Somayajulu, N.; Barat, G.K. Final Technical Report on Investigation in Lathyrus sativus; Indian Agricultural Research Institute: New Delhi, India, 1994. [Google Scholar]
- Pandey, R.L.; Chitale, M.W.; Sharma, R.N.; Geda, A.K. Evaluation and characterization of germplasm of grass pea (Lathyrus sativus). J. Med. Aromat. Plants 1997, 19, 14–16. [Google Scholar]
- Grela, E.R.; Rybiński, W.; Klebaniuk, R.; Matras, J. Morphological characteristics of some accessions of grass pea (Lathyrus sativus L.) grown in Europe and nutritional traits of their seeds. Genet. Resour. Crop Evol. 2010, 57, 693–701. [Google Scholar] [CrossRef]
- De la Rosa, L.; Martin, I. Morphological characterization of Spanish genetic resources of Lathyrus sativus L. Lathyrus Lathyrism Newsl. 2001, 2, 31–34. [Google Scholar]
- Kumari, V. Field evoluation of grasspea (Lathyrus sativus L.) germplasm for its toxicty in the Norhwestern Hills of India. Lathyrus Lathyrism Newsl. 2001, 2, 82–84. [Google Scholar]
- Çakmakçı, S.; Çeçen, S. The possibilities at entering crop rotation system of certain annual legume plants in Antalya. Turk. J. Agric. For. 1999, 23, 119–123. [Google Scholar]
- Seydoşoğlu, S.; Saruhan, V.; Kökten, K.; Karadağ, Y. Determination of yield and yield components of some grasspea (Lathyrus sativus L.) genotypes in ecological conditions of Diyarbakır. J. Agric. Fac. Gaziosmanpasa Univ. 2015, 32, 98–109. [Google Scholar] [CrossRef]
- Öten, M.; Kiremitçi, S.; Erdurmuş, C. The determination of yield characteristics of some grass pea (Lathyrus sativus L.) lines collected from Antalya natural flora. Ege J. Agric. Res. 2017, 54, 17–26. [Google Scholar]
- Grela, E.R.; Rybinski, W.; Matras, J.; Sobolewska, S. Variability in phenotypic and morphological characteristics of some Lathyrus sativus L. and Lathyrus cicera L. accessions and nutritional traits of their seeds. Genet. Resour. Crop Evol. 2012, 59, 1687–1703. [Google Scholar] [CrossRef]
- Ahmadi, J.; Vaezi, B.; Pour-Aboughadareh, A. Assessment of heritability and relationships among agronomic characters in grass pea (Lathyrus sativus L.) under rainfed conditions. Biharean Biol. 2015, 9, 29–34. [Google Scholar]
- Aksu, E.; Dogan, E.; Arslan, M. Agro-morpholoogical performance of grass pea (Lathyrus sativus L.) genotypes with low Β-ODAP content grown under Mediterranean environmental conditions. Fresenius Environ. Bull. 2021, 30, 638–644. [Google Scholar]
- Basaran, U.; Acar, Z.; Karacan, M.; Onar, N. Variation and correlation of morpho-agronomic traits and biochemical contents (protein and β-Odap) in Turkish grass pea (Lathyrus sativus L.) landraces. Turk. J. Field Crops 2013, 18, 166–173. [Google Scholar]
- Kosev, V.I.; Vasileva, V.M. Morphological characterization of grass pea (Lathyrus sativus L.) varieties. J. Agric. Sci.-Sri Lanka 2019, 14, 67–76. [Google Scholar] [CrossRef]
- Kumar, S.; Dubey, D.K. Genetic diversity among induced mutants of grasspea (Lathyrus sativus L.). Lathyrus Lathyrism Newsl. 2003, 3, 15–17. [Google Scholar]
- Rybinski, W.; Szot, B.; Rusinek, R. Estimation of morphological traits and mechanical properties of grass pea seeds (Lathyrus sativus L.) originating from EU countries. Int. Agrophys. 2008, 22, 261–275. [Google Scholar]
- Enneking, D. The nutritive value of grass pea (Lathyrus sativus L.) and allied species, their toxicity to animals and the role of malnutrition in nerulathyrism. Food. Chem. Toxicol. 2011, 49, 694–709. [Google Scholar] [CrossRef]
- Polignano, G.B.; Uggenti, P.; Olita, G.; Bisignano, V.; Alba, V.; Perrino, P. Characterization of grass pea (Lathyrus sativus L.) entries by means of agronomically useful traits. Lathyrus Lathyrism Newsl. 2005, 4, 9–14. [Google Scholar]
- Sharma, R.N.; Kashyap, O.P.; Chitale, M.W.; Pandey, R.L. Genetic analysis for seed attributes over the years in grass pea (Lathyrus sativus L.). Ind. J. Gen. Plant Breed. 1997, 57, 154–157. [Google Scholar]
- Kumar, S.; Bejiga, G.; Ahmed, S.; Nakkoul, H.; Sarker, A. Genetic improvement of grass pea for low neurotoxin (β-ODAP) content. Food Chem. Toxicol. 2011, 49, 589–600. [Google Scholar] [CrossRef] [PubMed]
- Lambein, F.; Khan, J.K.; Kuo, Y.-H.; Campbell, C.G.; Briggs, C.J. Toxins in the seedlings of some varieties of grass pea (Lathyrus sativus). Nat. Toxins 1993, 1, 246–249. [Google Scholar] [CrossRef]
- Abd El-Moneim, A.M.; Cocks, P.S. Adaptation and yield stability of selected lines of Lathyrus spp. under rainfed conditions in West Asia. Euphytica 1992, 66, 89–97. [Google Scholar] [CrossRef]
- Siddique, K.H.M.; Loss, S.P.; Herwig, S.P.; Wilson, J.M. Growth, yield and neurotoxin (ODAP) concentration of three Lathyrus species in Mediterranean type environments of Western Australia. Aust. J. Exp. Agric. 1996, 36, 209–218. [Google Scholar] [CrossRef]
- Dixit, G.P.; Parihar, A.K.; Bohra, A.; Singh, N.P. Achievements and prospects of grass pea (Lathyrus sativus L.) improvement for sustainable food production. Crop J. 2016, 4, 407–416. [Google Scholar] [CrossRef]
- Despande, S.S.; Campbell, C.G. Genotype variation in BOOA, condensed tannins, phenolics and enzyme inhibitors in grass pea (Latyhrus sativus). Can. J. Plant Sci. 1992, 72, 1037–1047. [Google Scholar] [CrossRef]
- Onar, A.N.; Erdoğan, B.Y.; Ayan, I.; Acar, Z. Homoarginine, β-ODAP, and asparagine contents of grass pea landraces cultivated in Turkey. Food Chem. 2014, 143, 277–281. [Google Scholar] [CrossRef]
- Assefa, G.; Ledin, I. Effect of variety, soil type and fertilizer on the establishment, growth, forage yield, quality and voluntary intake by cattle of oats and vetches cultivated in pure stand and mixtures. Anim. Feed. Sci. Technol. 2001, 92, 95–111. [Google Scholar] [CrossRef]
- Van Soest, P.J. Nutritional Ecology of the Ruminant, 2nd ed.; Comstock Publishing Associates: Ithaca, NY, USA, 1994. [Google Scholar]
- Ball, D.M.; Collins, M.; Lacefield, G.D.; Martin, N.P.; Mertens, D.A.; Olson, K.E.; Putnam, D.H.; Undersander, D.J.; Wolf, M.W. Understanding Forage Quality; American Farm Bureau Federation Publication: Park Ridge, IL, USA, 2001. [Google Scholar]
- Basaran, U.; Asci, O.O.; Mut, H.; Acar, Z.; Ayan, I. Some quality traits and neurotoxin β-N-oxalyl-L-α,β- diaminopropionic acid (β-ODAP) contents of Lathyrus sp. cultivated in Turkey. Afr. J. Biotechnol. 2011, 10, 4072–4080. [Google Scholar]
- Kiraz, A.B. Determination of relative feed value of some legume hays harvested at flowering stage. Asian J. Anim. Vet. Adv. 2011, 6, 525–530. [Google Scholar] [CrossRef]
- Karadag, Y.; Yavuz, M. Seed yields and biochemical compounds of grasspea (Lathyrus sativus L.) lines grown in semi-arid regions of Turkey. Afr. J. Biotechnol. 2010, 9, 8343–8348. [Google Scholar]
- Surmen, M.; Yavuz, T.; Cankaya, N. Effects of phosphorus fertilization and harvesting stages on forage yield and quality of common vetch. J. Food Agric. Environ. 2011, 9, 353–355. [Google Scholar]
- Aydin, N.; Mut, Z.; Mut, H.; Ayan, I. Effect of autumn and spring sowing dates on hay yield and quality of oat (Avena sativa L.) genotypes. J. Anim. Vet. Adv. 2010, 9, 1539–1545. [Google Scholar] [CrossRef]
Publisher’s Note: MDPI stays neutral with regard to jurisdictional claims in published maps and institutional affiliations. |
© 2022 by the authors. Licensee MDPI, Basel, Switzerland. This article is an open access article distributed under the terms and conditions of the Creative Commons Attribution (CC BY) license (https://creativecommons.org/licenses/by/4.0/).