Article

Mixture of Alfalfa, Orchardgrass, and Tall Fescue Produces Greater Biomass Yield in Southwest China

1
College of Grassland Science and Technology, Sichuan Agricultural University, Chengdu 611130, China
2
College of Environment and Resources, Taiyuan University of Science and Technology, Taiyuan 030024, China
3
College of Agronomy, Ningxia University, Yinchuan 750021, China
4
Sichuan Grass Industry Technology Research and Promotion Center, Chengdu 610041, China
5
Institute of Qinghai-Tibet Plateau, Southwest Minzu University, Chengdu 610041, China
*
Author to whom correspondence should be addressed.
These authors contributed equally to this work.
Agronomy 2022, 12(10), 2425; https://doi.org/10.3390/agronomy12102425
Submission received: 7 September 2022 / Revised: 1 October 2022 / Accepted: 4 October 2022 / Published: 6 October 2022

Abstract

:
The current study investigated the influence of mixture composition on the biomass yield and early establishment of legume–grass mixtures. The legume species alfalfa (Medicago sativa L. (A)), white clover (Trifolium repens L. (WC)), and red clover (Trifolium pratense L. (RC)) and grass species orchardgrass (Dactylis glomerata L. (O)), tall fescue (Festuca arundinacea Schreb. (TF)), and perennial ryegrass (Lolium perenne L. (PR)) were grown in monocultures and in different legume–grass mixtures. Legume–grass mixtures (M1: WC + O + TF; M2: A + O + TF; M3: A + WC + O + TF; M4: RC + WC + O + TF; M5: A + WC + O + TF + PR; M6: RC + WC + O + TF + PR; and M7: A + RC + WC + O + TF + PR) were sown in a legume–grass seeding ratio of 3:7. The results showed that M2 had the greatest two-year average biomass yield (12.92 t ha−1), which was significantly (p < 0.05), 4.7%, 5.4%, 15.8%, and 29.1% greater than that of WC monoculture, M7, M4, and M1, respectively. The grass biomass yield proportions of all mixtures significantly decreased, while legume biomass yield proportions significantly increased in the second year compared to the first year of establishment. The land-equivalent ratio values of M2 and M4 were greater than 1 in each cutting period. The competition rate of grasses gradually decreased with prolonged establishment time. Overall, the biomass yield, legume and grass biomass yield proportions, land equivalent ratio, and competition rate data highlighted that M2 is the best choice to achieve greater productivity and early establishment in southwest China.

1. Introduction

There has been increasing interest in growing legume–grass mixtures rather than their respective monocultures because they often provide greater biomass yields and balanced feedstock’s for ruminants [1,2]. Including legume in a mixture improves the use of natural resources, such as available water and solar radiation, while reducing the fertilizer requirements through biological nitrogen fixation [3]. The grass specie in the mixture contributes to the total biomass production and reduces invasion by weeds, legume lodging, and the possibility of bloat [4]. However, legume–grass mixtures often face numerous challenges due to lack of agronomic knowledge, improper species selection, poor grass growth in summer, and fierce competition among species for resources which significantly hinder the productivity and establishment of such mixtures.
Appropriate species choice for legume–grass mixture is the key to agricultural management to acquire greater productivity and early establishment [5]. The early establishment of legume–grass mixtures is usually calculated by the dynamics of biomass yields in different years, land-equivalent ratio (LER), and competition rate (CR) [6]. A study reported that successful forage productions of legume–grass mixtures depend on fast establishment and regrowth capability after mowing the legumes and the ability of grasses to compete with legumes for light capture and growth rate without N fertilization [7]. Therefore, in order to cope with the empty and unproductive gaps, mixtures should composed of well-adopted species grown in the specific soil and environmental conditions [8]. The most common legume and grass species in the subtropics regions that are generally included in legume–grass mixtures are alfalfa (Medicago sativa L.), white clover (Trifolium repens L.), red clover (Trifolium pratense L.), orchardgrass (Dactylis glomerata L.), tall fescue (Festuca arundinacea Schreb.), and perennial ryegrass (Lolium perenne L.). Alfalfa is a perennial, protein-rich fodder legume that is differentiated by a higher dry matter production, increased drought tolerance, and the capacity to improve soil health through biological nitrogen fixation [5]. Clovers are abundant in calcium, phosphate, and protein and have a limited lifespan [9]. They are valuable plants that improve and preserve soil, and they quickly regrow from their seed. Orchardgrass, tall fescue, and perennial ryegrass are distinguished by greater winter hardiness, fast growth, and greater biomass production [1]. Numerous studies have reported the benefits for biomass yield production when legume–grass mixture are composed of above-mentioned species [1,10,11]. However, the early establishment of legume–grass mixtures consisting of above-mentioned legume and grass species from well-defined diversity gradient is still unknown.
The productivity and regeneration of legume–grass mixtures are not only affected by the type of mixed pasture but also by the proportions of mixed sowing and external environments. The knowledge related to the formulation of the specie seeding rate for legume–grass mixtures and its impact on the mixture’s productivity and early establishment is useful information for the farmers. A study reported that the effects of varying species proportions on the productivity of mixtures depend on the dominant species [12], while another study established that, when proportions of the species in the mixture became more equal, then the production of the legume–grass mixture increased [13]. However, most of the studies concerning the impacts of legume and grass seeding ratios on the production of mixtures suggested that the presence of a 30–40% seeding rate of the legume could achieve greater biomass yields [6,14]. Therefore, it is important to pay more attention while formulating the seed mixes for legume–grass mixtures to achieve the better productivity and early establishment.
The Sichuan province of China is considered as one of the largest producers of animal husbandry. However, the lack of forage in this region is the primary constraint on the animal husbandry development. This scarcity is usually caused by the environmental stresses, and most important perennial grasses cannot survive in the summer season in the low-altitude region of Sichuan. Moreover, the species selection for legume–grass mixtures is problematic due to the lack of suitable varieties for this region. Therefore, it is imperative to adapt a mixed planting technique to alleviate the forage deficit in this region. Moreover, an experiment-based study through a legume–grass mixed planting technique is crucial in this region in order to utilize the grassland resources and abandoned farmlands efficiently, which can significantly contribute to sustainable agriculture production and improve the livelihoods of farmers.
Consequently, the current study aimed to explore the effect of different legume–grass combinations on the early establishment and biomass yield of mixtures in Southwest China.

2. Materials and Methods

2.1. Study Site and Plant Materials

A two-year field study was conducted from September 2017 to June 2019 at the Modern Agriculture Research and Development Base of Sichuan Agricultural University, Chongzhou, China (103°07′ E, 30°30′ N). The selected forage species for the legume–grass mixtures were as follows: alfalfa (A), white clover (WC), red clover (RC), orchardgrass (O), tall fescue (TF), and perennial ryegrass (PR). The variety names and biological characteristics of selected species are given in Table 1.

2.2. Soil Properties and Weather Description

The study area has uniformly fertile paddy soil with the following soil characteristics: 6.30 pH, 37.6 g kg−1 of organic matter, 135.7 mg kg−1 of alkali-hydrolyzed nitrogen, 1.81 g kg−1 of total nitrogen, 10.2 mg kg−1 of available phosphorous, and 101.1 mg kg−1 of available potassium. The research site features a subtropical monsoon humid climate with an average annual temperature of 15.9°C, 1012.4 mm of total annual rainfall, and 1161.5 h of sunshine. The monthly average temperature (°C) and the sum of rainfall (mm) of the study site from year 2017 to 2019 are given in Table 2.

2.3. Experimental Design and Field Management

The experiment was conducted in a randomized complete block design with three replicates. The seven legume–grass mixtures (M1: WC + O + TF; M2: A + O + TF; M3: A + WC + O + TF; M4: RC + WC + O + TF; M5: A + WC + O + TF + PR; M6: RC + WC + O + TF + PR; M7: A + RC + WC + O + TF + PR) and six monocultures were sown in a net plot size of 5 m × 3 m on 15 September 2017. The legume and grass seeding ratio for mixtures was adjusted to 3:7. The seeding ratio for each legume or grass species was adjusted to 1:1 if the mixture contained two or more than two species. For instance, the seeding rate of each grass specie was evenly distributed in M1 (contains two grasses). For monocultures of A, WC, RC, O, TF, and PR, the corresponding seeding rates were 22.50, 7.50, 15, 15, 37.50, and 18 kg ha−1, respectively. Seeding rates for legume–grass mixtures were calculated using the following formula:
Seeding rate of specie in mixture = Monoculture seeding rate × Mixed seeding ratio
The seeding rates of legume and grass species used for growing mixtures are presented in Table 3. The basal dose of nitrogen (N), phosphorus (P2O5), and potassium (K2O) fertilizers was applied at the rate of 47, 24, and 40 kg ha−1, respectively, and the same amount was also applied after each mowing. The first, second, and third cuts of biomass production were performed on 24 March, 6 May, and 23 July in 2018 and 21 March, 1 May, and 15 July in 2019, respectively.

2.4. Soil Sampling and Measurement

Before sowing, soil samples from 20 cm depth were taken at random sites of the study area. For the purpose of determining soil parameters, soil samples were air-dried at room temperature to a consistent weight and passed through a 2 mm sieve. A pH meter was used to determine the pH of a 1/5 (w/v) aqueous extract. Following nitric-perchloric acid digestion, the levels of phosphorus and potassium were assessed using ICP spectrometry. The dilution heat method was used to measure soil organic matter, while the alkaline hydrolysis diffusion method was used to measure alkali-hydrolyzed nitrogen [15]. The Kjeldahl technique was used to calculate the total nitrogen [16].

2.5. Biomass Yield Determination

All plots were mechanically cut to a stubble height of 5 cm with a sickle bar mower, when A reached the flowering stage or when the main grass reached 1 m tall. The side rows of each plot were removed before harvesting. The harvesting period was slightly different each year due to the growing environment and plant growth. After harvesting, weeds were removed firstly, and then the legume and grass components were separated. The whole-plot fresh weight was recorded and then a sub-sample of approximately 300 g was dried at 75 °C until reaching a constant weight to estimate the dry matter (DM) concentration, which was used to calculate the DM yield. The legume and grass biomass yield proportions were calculated by manual sorting of legume and grass biomass yields and expressed in percentage.

2.6. Competitive Indexes Determination

The land-equivalent ratio (LER) among two functional groups (i.e., legume and grass) of legume–grass mixtures was calculated by the following formula: [17]
LER = Yij/Yii + Yji/Yjj
Here, Yij is the biomass yield of the functional groups, when functional groups i and j are mixed; Yii is the biomass yield when functional group i is sown in a monoculture; Yji is the biomass yield of functional group j when specie j is combined with functional group i; and Yjj is the biomass yield when functional group j is sown in a monoculture.
An LER close to 1 indicates that the interspecific and intraspecific interference in the mixed planting community are equal under the mixed planting mode. An LER greater than 1 indicates that the interspecific interference is less than intraspecific interference, and there is a possibility of niche differentiation among various groups in the mixed community. The greater the value, the greater the possibility of differentiation, the better the compatibility, and the higher the efficiency of resources utilization by species of the mixed community. An LER less than 1 indicates that the interspecific interference in the mixed community is greater than intraspecific interference, and various groups have the possibility of overlapping in the same niche. The smaller the value, the greater the possibility of niche vacancy leading to insufficient utilization of resources.
The competition rate (CR) among the two functional groups (i.e., legume and grass) of legume–grass mixtures was calculated according to following formula: [18]
CRi = (Yij/(Yii × Zij))/(Yji / (Yjj × Zji))
Here, CRi is the competition rate of functional groups i; Zji is the ratio of seed j in mixed sowing; and the rest are the same as mentioned above.

2.7. Statistical Analysis

Data were analyzed using the SPSS software (version 19.0). To examine the effects of legume–grass combination and year on the biomass yield, we used two-way ANOVA with treatments and year, and their interaction was considered as a fixed effect and replication was considered as a random effect. However, the land-equivalent ratio and competition data were analyzed by the one-way ANOVA. The means were compared for significance by Duncan’s multiple range method, and significance was declared at p < 0.05. The tables and graphics were shaped by Excel 2007 and Prism GraphPad.

3. Results

3.1. Biomass Yield of Whole Cropping Systems

The first, second, and third cutting biomass yields of legume–grass mixtures and monocultures for two consecutive years are shown in Table 4. The total biomass yield in 2018 and 2019 differed significantly among the treatments and years (p < 0.001), and their interaction was also significant (p < 0.001). The M2 showed the greatest two-year average biomass yield (12.92 t ha−1), which was 4.7%, 5.4%, 15.8%, and 29.1% higher than that of WC monoculture, M7, M4, and M1, respectively. Moreover, the two-year average biomass yield of WC monoculture was not only significantly (p < 0.01) greater than other monocultures but also higher than 5 out of 7 mixtures (except for M2 and M7). However, the legume–grass mixtures that included WC were less productive. Moreover, M2 showed the least reduction of biomass yield (0.7 t ha−1) in the second year (12.6 t ha−1) compared to the first year (13.3 t ha−1), followed by M7 (2.0 t ha−1), M4 (2.1 t ha−1), and M6 (2.2 t ha−1). However, M3 and M1 showed the greatest reduction of biomass yields of 2.9 and 3.5 t ha−1 in the second year compared to their respective first-year biomass yields. These results suggest that M2 produced a more stable biomass yield and established faster than that of other legume–grass mixtures.

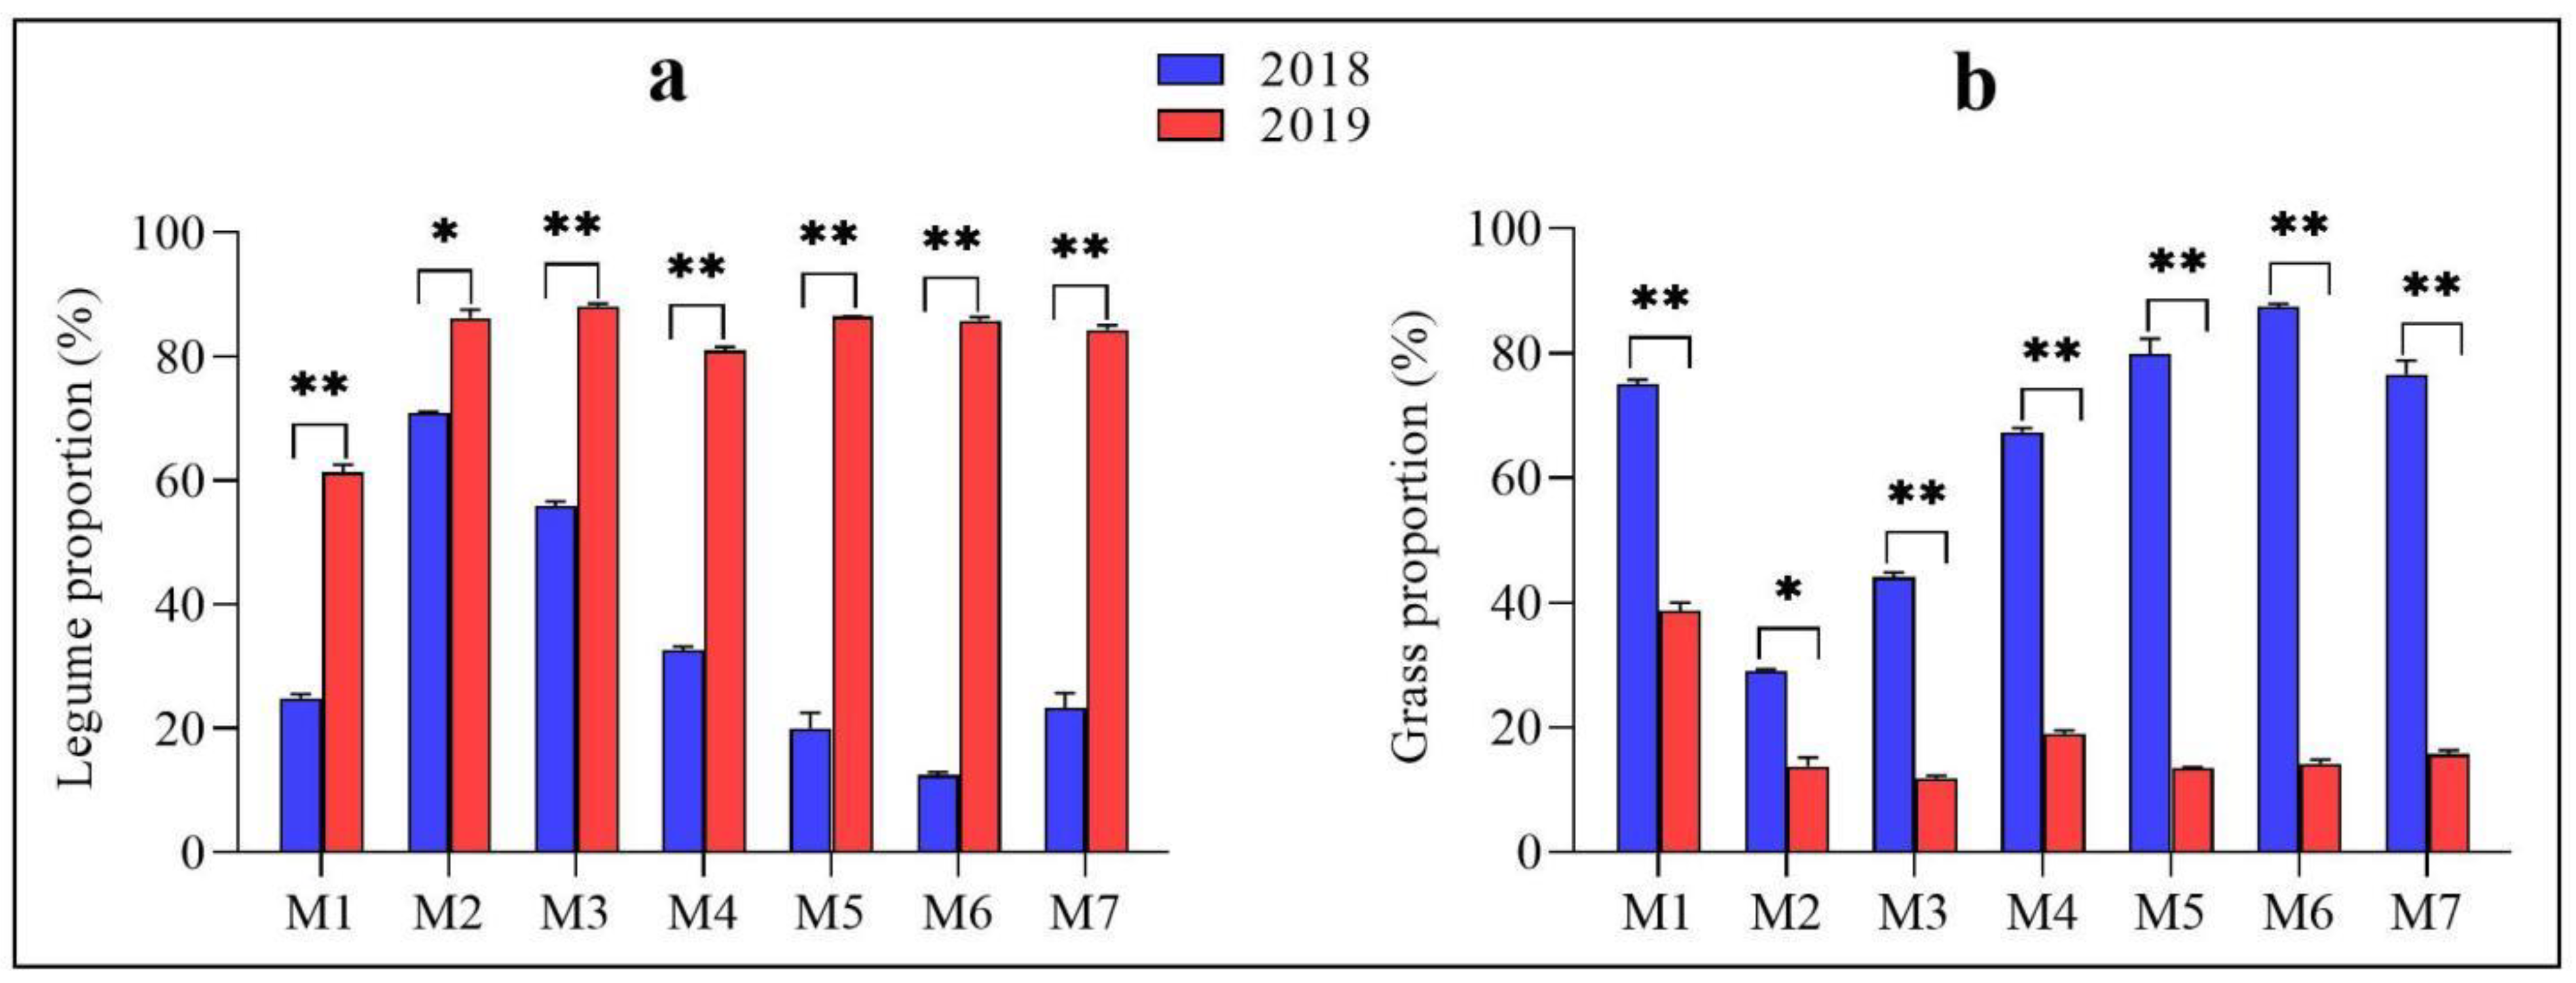
3.2. Dynamics of Legume and Grass Biomass Yield Proportions of Mixtures during Early Establishment

The biomass yield proportions of the same type of components (legume and grass) of mixtures during early establishment are represented in Figure 1. The legume biomass yield proportions of all mixtures significantly increased, while grass biomass yield proportions of all mixtures significantly deceased in the second year compared to the first year. The M6 had the lowest legume proportion of 12.49% in the first year, while M3 had the highest legume proportion of 88.15% in the second year. However, M2 showed quite better stability in term of legume biomass yield proportion compared to other mixtures, accounting 78.88% in the first year and 86.20% in the second year, followed by M3 (Figure 1a). Contrarily, M6 had the greater grass biomass yield proportion of 87.51% in the first year, while M3 had the lowest grass biomass yield proportion of 11.85% in the second year. However, the lowest reduction of grass biomass yield in second year was found in M2 compared to its first year followed by M1 and M3. These findings suggest that M2 had the better biomass yield stability during early establishment compared to other mixtures, which might reflect the inclusion of alfalfa that can be combined with other grasses to compensate their biomass yield reduction in the following years.

3.3. Competitive Indices

Based on the biomass yield, the LER values of most of the cuttings of legume–grass mixtures were higher than 1.0 over the two years, indicating the greater land-use efficiency of the mixed planting system compared to the monocultures (Table 5). For example, all the cutting LER values of M2 and M4 were greater than 1 in both years, which showed that the species of these mixtures were using land resources efficiently. However, some other mixtures showed LER values greater than 1 in the first, second, and third cutting but not in all cuttings. For example, the third cutting of M3 showed the maximum LER value of 2.16 in 2019, but had LER value of 0.97 in the first cutting in 2018. These findings highlight that M2 has good interspecific compatibility during mixed planting coupled with a land use advantage.
The LER can only explain the degree of comprehensive utilization of environmental resources but cannot demonstrate the species-specific competitiveness. Therefore, in order to better describe the species competition in the current study, the CR of grasses and legumes was calculated (Table 6). The first, second, and third cutting CR of grasses in all mixtures except M2 and M3 was significantly greater than that of legumes in the first year. However, it considerably decreased in the second year compared to legumes. All cuttings CR of legumes of M2 and M3 were substantially greater than those of grasses in the two consecutive years. These findings suggest that legume competitiveness increased, while grass competitiveness decreased with prolonged establishment time.

4. Discussion

4.1. Biomass Yield and Early Establishment of Different Cropping Systems

Multispecies swards could achieve greater biomass yields compared to the corresponding monocultures [6,19]. This greater productivity is usually related with the resource utilization and interspecific competition among species [20,21]. The biomass yield is highly influenced by the component species of the mixture due to differences in their competitive ability for the resources [22]. Similarly, the current study indicates that M2 produced the greatest biomass yield compared to other legume–grass mixtures and monocultures. This could probably be attributed to the deliberate selection of species for composing a mixture with high yield potential and distinct differences in their traits to acquire resources. It highlights that the species contributed in M2 were partly complementary with resource utilization by decreasing the fierce competition among species, and, as a bonus, alfalfa’s biological nitrogen fixation in its root nodules may be transferred to grasses to support their growth. Moreover, in the current study, the biomass yield of white clover monoculture was not only greater than that of other monocultures but was also higher than 5 out of 7 legume–grass mixtures, supporting that species choice in mixture is more important than diversity [12]. However, it was fascinating to know that the mixtures which included white clover were substantially less productive. This might be related to the vigorous growth and tallness of grasses during the early stage, meaning that white clover cannot get light resources properly, which turned into its lower production when grown with grasses [23].
The productivity of greater diversified mixtures except M7 was less governed by the deliberate selection of species for mixtures in the current study. This result is inconsistent with other reports, where more diverse species mixtures were shown to exceed the average biomass yield of their component monocultures by 70% to 200% [24,25]. This can be exemplified by the lower biomass yield advantage from the best-adapted species because of their lower seeding density in high diversified mixtures [26]. However, M7 had the significantly greater biomass yield compared to other legume–grass mixtures except M2. This lower biomass production of M7 compared to M2 might be related to the presence of perennial ryegrass in M7, which experienced no mowing of perennial ryegrass in the second year, leading to limited overall biomass production.
The establishment of legume–grass mixtures is a fundamental component for their success besides greater productivity. Studies have reported that mixture productivity is often stabilized by greater plant diversity [25,26], but its impact on the establishment of mixtures is not universal [27]. In the current study, all legume–grass mixtures except M2 showed less biomass yield in 2019 compared to 2018, highlighting the lower influence of greater species diversity on the stability of biomass yields. The legume biomass yield proportions of all mixtures significantly increased, while grass biomass yield proportions of all mixtures significantly deceased in the second year compared to its first year. It is conceivable that the biomass yield declines were simply due to the grass components of mixtures hardly surviving the summer season, which in turn would be a function of the success of legumes. Moreover, the M2 mixture showed greater early establishment, and there was no significant differences in the two years’ biomass yields. This might be attributed to the presence of alfalfa in that mixture which can absorb water from deeper soil than grasses because of its complementary root systems and provide N to the grasses when resources are more likely to become limiting for growth [28]. In addition, it is well known that perennial legumes grow better in the second year, which compensated the M2 biomass yield reduction of grasses in the second year.

4.2. Grasses of Legume–Grass Mixtures Had Lower Competitive Ability Than Legumes in the Following Year

Interspecific interactions play key roles in determining the biomass yield and early establishment of legume–grass intercropping systems. Grasses may take advantage of readily available nutrients, such as nitrogen from legumes, and transform them into high biomass yields and land-use efficiency [28]. Multispecies sward productivity studies have established that the competitive abilities of component species are positively correlated with the yield production of this system [29,30]. Therefore, investigations of the interspecific competitiveness of each crop have played a crucial role in accurately estimating the advantages of intercropping systems [31]. In the current study, the LER values of all cuttings of M2 and M4 were greater than 1 in two consecutive years, highlighting that the species included in these mixtures have good interspecific compatibility during intercropping and occupy a different ecological niche in terms of resources and environmental utilization. Similarly, a previous study revealed that the mixture containing alfalfa in the intercropping system had a higher LER value [32]. This finding could be explained by the legume’s ability to fix atmospheric nitrogen, which can also significantly contribute to synergistic interactions via the transfer of fixed nitrogen between species to improve mixture establishment [33]. Overall, the LER values of all legume–grass mixtures represented an increasing trend from 2018 to 2019, suggesting that the mixtures were utilizing land resources efficiently with a prolonged establishment time.
The CR is considered as a more accurate indicator of the competitive ability of the mixture’s component species [6]. The current study found that the all cuttings grasses CR of all legume–grass mixtures except M2 and M3 was significantly greater than the legumes CR in 2018. However, grasses CR decreased significantly while legumes CR increased substantially with prolonged establishment time, highlighting that grasses were less competitive to legumes in the later period of establishment in accordance with previous work [28]. Moreover, all the grasses were cold-season types and produced more biomass yields in winter and spring, while legumes biomass yields were concentrated in the summer season. The decrease in grasses’ competition compared to legumes was simply due to the summer season, which affected the growth of grasses seriously, and fertilization application after each cut could not help the grasses to compete with legumes in later period of establishment. That was another reason for the lower competitiveness of legumes in the early periods of the establishment. Nevertheless, M2 and M3 had alfalfa as a component specie, which has more profound, more developed, and larger roots, with a smaller proportion of root mass in fine roots and nodules, providing a greater competitive ability and a superior ecological niche to alfalfa in the intercropping system [6]. These characteristics may reduce belowground competition with forage grasses, particularly in areas immediately around grass roots, and contribute to higher biomass yields.

5. Conclusions

Overall, the data supported the advantages of mixing alfalfa with orchardgrass and tall fescue (M2), under a legume and grass seeding ratio of 3:7, in terms of biomass yield and early establishment in the first two years. The M2 showed the least biomass reduction of 0.7 t ha−1, while M3 and M1 represented the greater biomass yield reductions of 2.9 and 3.5 t ha−1 in the second year compared to their corresponding first year biomass yields. The productivity of white clover in monoculture was not only greater than that of other monocultures but also greater than 5 out of 7 mixtures. It was fascinating to know that mixtures that included white clover were substantially less productive. The LER of all legume–grass mixtures increased with prolonged establishment time. The grasses were more competitive to legumes in the first year but were less competitive to legumes in the second year. It is concluded that a mixture of alfalfa, tall fescue and orchardgrass has the potential to exert better utilization of environmental resources and to improve the livelihoods of farmers of Southwest China.

Author Contributions

Conceptualization and investigation, X.L., M.T., C.L. and Y.Y.; methodology, C.L.; software, M.T.; validation, X.L. and C.C.; formal analysis, Y.X.; investigation, G.Z.; resources, Y.X.; data curation, C.C.; writing—original draft preparation, X.L.; writing—review and editing, M.C.; visualization, Y.Y. and M.T.; supervision, Y.Y.; project administration, Y.Y.; funding acquisition, X.L. All authors have read and agreed to the published version of the manuscript.

Funding

This research was funded by Doctoral research start-up fund of Taiyuan University of Science and Technology (20182024), Innovation and Entrepreneurship Training program for College students (XJ2022058) and Sichuan Science and Technology Department Programs (2021 YFN0059).

Institutional Review Board Statement

Not applicable.

Informed Consent Statement

All individuals included in this section have read and agreed to the published version of the manuscript.

Data Availability Statement

Not applicable.

Acknowledgments

The authors are grateful for the support of Xingjin Wen for the field management.

Conflicts of Interest

The authors declare no conflict of interest.

References

  1. Tahir, M.; Li, C.; Zeng, T.; Xin, Y.; Chen, C.; Javed, H.H.; Yang, W.; Yan, Y. Mixture Composition Influenced the Biomass Yield and Nutritional Quality of Legume-Grass Pastures. Agronomy 2022, 12, 1449. [Google Scholar] [CrossRef]
  2. Finn, J.A.; Kirwan, L.; Connolly, J.; Sebastià, M.T.; Helgadottir, A.; Baadshaug, O.H.; Bélanger, G.; Black, A.; Brophy, C.; Collins, R.P. Ecosystem function enhanced by combining four functional types of plant species in intensively managed grassland mixtures: A 3-year continental-scale field experiment. J. Appl. Ecol. 2013, 50, 365–375. [Google Scholar] [CrossRef] [Green Version]
  3. Ojeda, J.J.; Caviglia, O.P.; Agnusdei, M.G.; Errecart, P.M. Forage yield, water-and solar radiation-productivities of perennial pastures and annual crops sequences in the south-eastern Pampas of Argentina. Field Crops Res. 2018, 221, 19–31. [Google Scholar] [CrossRef]
  4. Albayrak, S.; Mevlüt, T.; YUeKSEL, O.; Yilmaz, M. Forage yield and the quality of perennial legume-grass mixtures under rainfed conditions. Not. Bot. Horti Agrobot. Cluj-Napoca 2011, 39, 114–118. [Google Scholar] [CrossRef] [Green Version]
  5. McDonald, I.; Baral, R.; Min, D. Effects of alfalfa and alfalfa-grass mixtures with nitrogen fertilization on dry matter yield and forage nutritive value. J. Anim. Sci. Technol. 2021, 63, 305–318. [Google Scholar] [CrossRef]
  6. Bi, Y.; Zhou, P.; Li, S.; Wei, Y.; Xiong, X.; Shi, Y.; Liu, N.; Zhang, Y. Interspecific interactions contribute to higher forage yield and are affected by phosphorus application in a fully-mixed perennial legume and grass intercropping system. Field Crops Res. 2019, 244, 107636. [Google Scholar] [CrossRef]
  7. Gierus, M.; Kleen, J.; Loges, R.; Taube, F. Forage legume species determine the nutritional quality of binary mixtures with perennial ryegrass in the first production year. Anim. Feed Sci. Technol. 2012, 172, 150–161. [Google Scholar] [CrossRef]
  8. Peeters, A.; Parente, G.; Le Gall, A. Temperate legumes: Key-species for sustainable temperate mixtures. In Sustainable Grassland Productivity; Grassland Science in Europe; Artes Gráficas Marcipa: Badajoz, Spain, 2006. [Google Scholar]
  9. Louarn, G.; Pereira-Lopès, E.; Fustec, J.; Mary, B.; Voisin, A.-S.; de Faccio Carvalho, P.C.; Gastal, F. The amounts and dynamics of nitrogen transfer to grasses differ in alfalfa and white clover-based grass-legume mixtures as a result of rooting strategies and rhizodeposit quality. Plant Soil 2015, 389, 289–305. [Google Scholar] [CrossRef]
  10. Aponte, A.; Samarappuli, D.; Berti, M.T. Alfalfa–Grass Mixtures in Comparison to Grass and Alfalfa Monocultures. Agron. J. 2019, 111, 628–638. [Google Scholar] [CrossRef]
  11. Sleugh, B.; Moore, K.J.; George, J.R.; Brummer, E.C. Binary Legume–Grass Mixtures Improve Forage Yield, Quality, and Seasonal Distribution. Agron. J. 2000, 92, 24–29. [Google Scholar] [CrossRef]
  12. Sanderson, M.; Skinner, R.; Barker, D.; Edwards, G.; Tracy, B.; Wedin, D. Plant species diversity and management of temperate forage and grazing land ecosystems. Crop Sci. 2004, 44, 1132–1144. [Google Scholar] [CrossRef] [Green Version]
  13. Tilman, D. Plant diversity and composition: Effects on productivity and nutrient dynamics of experimental grasslands. In Biodiversity and Ecosystem Functioning: Synthesis and Perspectives; Tilman, D., Knops, J., Wedin, D., Reich, P., Eds.; Oxford University Press: Oxford, UK, 2002; p. 21. [Google Scholar]
  14. Sanderson, M.A.; Brink, G.; Stout, R.; Ruth, L. Grass–legume proportions in forage seed mixtures and effects on herbage yield and weed abundance. Agron. J. 2013, 105, 1289–1297. [Google Scholar] [CrossRef] [Green Version]
  15. Bao, S. Soil Agrochemical Analysis; China Agricultural Press: Beijing, China, 2000; Volume 67, p. 72. [Google Scholar]
  16. Bremner, J.M. Nitrogen-total. In Methods of Soil Analysis: Part 3 Chemical Methods; Soil Science Society of America: Madison, WI, USA, 1996; Volume 5, pp. 1085–1121. [Google Scholar]
  17. Willey, R.W. Resource use in intercropping systems. Agric. Water Manag. 1990, 17, 215–231. [Google Scholar] [CrossRef]
  18. Dhima, K.V.; Lithourgidis, A.S.; Vasilakoglou, I.B.; Dordas, C.A. Competition indices of common vetch and cereal intercrops in two seeding ratio. Field Crops Res. 2007, 100, 249–256. [Google Scholar] [CrossRef]
  19. Tian, Y.; Sun, W.; Song, M.; Zhao, Y.; Wen, S.; Cui, Y.; Li, X.; Xu, X. Effects of grass-legume mixture on plant production and inorganic nitrogen acquisition. Rhizosphere 2021, 20, 100447. [Google Scholar] [CrossRef]
  20. Chamkhi, I.; Cheto, S.; Geistlinger, J.; Zeroual, Y.; Kouisni, L.; Bargaz, A.; Ghoulam, C. Legume-based intercropping systems promote beneficial rhizobacterial community and crop yield under stressing conditions. Ind. Crops Prod. 2022, 183, 114958. [Google Scholar] [CrossRef]
  21. Zhang, J.; Cheng, G.; Yu, F.; Kräuchi, N.; Li, M.-H. Intensity and Importance of Competition for a Grass (Festuca rubra) and a Legume (Trifolium pratense) Vary with Environmental Changes. J. Integr. Plant Biol. 2008, 50, 1570–1579. [Google Scholar] [CrossRef] [PubMed]
  22. Wendling, M.; Büchi, L.; Amossé, C.; Jeangros, B.; Walter, A.; Charles, R. Specific interactions leading to transgressive overyielding in cover crop mixtures. Agric. Ecosyst. Environ. 2017, 241, 88–99. [Google Scholar] [CrossRef]
  23. Wendling, M.; Charles, R.; Herrera, J.; Amossé, C.; Jeangros, B.; Walter, A.; Büchi, L. Effect of species identity and diversity on biomass production and its stability in cover crop mixtures. Agric. Ecosyst. Environ. 2019, 281, 81–91. [Google Scholar] [CrossRef] [Green Version]
  24. Cardinale, B.J.; Wright, J.P.; Cadotte, M.W.; Carroll, I.T.; Hector, A.; Srivastava, D.S.; Loreau, M.; Weis, J.J. Impacts of plant diversity on biomass production increase through time because of species complementarity. Proc. Natl. Acad. Sci. USA 2007, 104, 18123–18128. [Google Scholar] [CrossRef] [PubMed]
  25. Tilman, D.; Isbell, F.; Cowles, J.M. Biodiversity and ecosystem functioning. Annu. Rev. Ecol. Evol. Syst. 2014, 45, 471–493. [Google Scholar] [CrossRef]
  26. Woodfield, D.R.; Caradus, J.R. Factors Affecting white Clover Persistence in New Zealand Pastures; New Zealand Grassland Association: Dunedin, New Zealand, 1996; Volume 58, pp. 229–235. [Google Scholar]
  27. Polley, H.W.; Collins, H.P.; Fay, P.A. Biomass production and temporal stability are similar in switchgrass monoculture and diverse grassland. Biomass Bioenergy 2020, 142, 105758. [Google Scholar] [CrossRef]
  28. Bork, E.W.; Gabruck, D.T.; McLeod, E.M.; Hall, L.M. Five-Year Forage Dynamics Arising from Four Legume–Grass Seed Mixes. Agron. J. 2017, 109, 2789–2799. [Google Scholar] [CrossRef]
  29. Li, L.; Sun, J.; Zhang, F.; Li, X.; Yang, S.; Rengel, Z. Wheat/maize or wheat/soybean strip intercropping: I. Yield advantage and interspecific interactions on nutrients. Field Crops Res. 2001, 71, 123–137. [Google Scholar] [CrossRef]
  30. Mushagalusa, G.N.; Ledent, J.F.; Draye, X. Shoot and root competition in potato/maize intercropping: Effects on growth and yield. Environ. Exp. Bot. 2008, 64, 180–188. [Google Scholar] [CrossRef]
  31. Doubi, B.T.S.; Kouassi, K.I.; Kouakou, K.L.; Koffi, K.K.; Baudoin, J.-P.; Zoro, B.I.A. Existing competitive indices in the intercropping system of Manihot esculenta Crantz and Lagenaria siceraria (Molina) Standley. J. Plant Interact. 2016, 11, 178–185. [Google Scholar] [CrossRef] [Green Version]
  32. Sollenberger, L.E.; Templeton, W.C., Jr.; Hill, R.R., Jr. Orchardgrass and perennial ryegrass with applied nitrogen and in mixtures with legumes. Grass Forage Sci. 1984, 39, 263–270. [Google Scholar] [CrossRef]
  33. Tracy, B.F.; Sanderson, M.A. Forage productivity, species evenness and weed invasion in pasture communities. Agric. Ecosyst. Environ. 2004, 102, 175–183. [Google Scholar] [CrossRef]
Figure 1. The biomass yield proportions of the same type of components in legume–grass mixtures within different years: (a) for legume and (b) for grass. M1: WC + O + TF; M2: A + O + TF; M3: A + WC + O + TF; M4: RC + WC + O + TF; M5: A + WC + O + TF + PR; M6: RC + WC + O + TF + PR; and M7: A + RC + WC + O + TF + PR. A, alfalfa; WC, white clover; RC, red clover; O, orchardgrass; TF, tall fescue; and PR, perennial ryegrass. Error bar shows the standard error mean of the replicates. Significance was tested by Student’s t-test. ‘*’, ‘**’ shows the significant differences at p < 0.05 and p < 0.01.
Agronomy 12 02425 g001
Table 1. Variety names and biological characteristics of selected legume and grass species.
Specie NameVariety NameBiological Characteristics
LegumesAlfalfaXibuzhixingFall dormancy class 7
White cloverLadinoLarge-leaf type, prefers warm, humid climates
Red cloverDuoliSuitable for warm and humid climates
GrassesOrchardgrassAmbaEarly maturing, hardy, and heat-labile
Tall fescueMeishijiaSuitable for cold, warm, and humid climates with slight heat resistance
Perennial ryegrassKaidiPrefers cool and humid climates, not heat-resistant
Table 2. Monthly average temperature and sum of rainfall of the experimental site from 2017 to 2019.
MonthAverage Temperature (°C)Rainfall (mm)
201720182019201720182019
January8671635
February10873114
March141513112628
April151819246945
May21232062122146
June2225241522357
July262724289358294
August272725668532
September232220145110205
October18171846379
November12121191113
December868543
Note: The Chongzhou Meteorological Bureau was consulted for the climate information.
Table 3. Seeding rates of components species in the legume–grass mixtures.
Legume–grass MixturesSpeciesSeeding Rate (kg ha−1)/Mixed Ratio (%)
L:G 3:7
M1O5.25/35
TF13.13/35
WC2.25/30
M2O5.25/35
TF13.13/35
A6.75/30
M3O5.25/35
TF13.13/35
A3.36/15
WC1.13/15
M4O5.25/35
TF13.13/35
WC1.13/15
RC2.25/15
M5O3.45/23.30
PR4.14/23.30
TF8.63/23.30
A3.36/15
WC1.13/15
M6O3.45/23.30
PR4.14/23.30
TF8.63/23.30
WC1.13/15
RC2.25/15
M7O3.45/23.30
PR4.14/23.30
TF8.63/23.30
A2.25/10
WC0.75/10
RC1.50/10
Table 4. The biomass yield (t ha−1) of monocultures and their legume–grass mixtures in the establishment years of 2018 and 2019.
YearCuttingsMonocultures Legume–Grass Mixtures
WCARCOPRTF M1M2M3M4M5M6M7
2018First cut4.6 cd4.5 cde4.0 e4.2 de5.6 a3.1 f 4.9 bc4.8 bcd3.1 f4.2 de4.9 bcd3.9 e5.2 abc
Second cut3.8 de3.1 f3.0 f3.1 f4.4 bc2.9 f 3.0 f4.0 cde3.5 df4.2 bcd4.0 cde4.6 ab5.0 a
Third cut4.2 b1.7 e3.1 d2.7 d1.4 e2.8 d 3.0 d4.4 a3.8 bc3.6 c3.1 d2.6 d3.0 d
Total12.6 a9.4 gh10.1 f9.9 fg11.4 de8.8 h 10.9 e13.3 b10.6 ef11.8 cd11.8 cd11.2 de13.2 b
2019First cut4.5 a3.2 bc2.8 bc1.6 e-1.9 e 3.0 c4.5 a2.3 d3.4 bc2.9 c3.0 c3.6 b
Second cut3.1 b2.2 f2.6 c2.3 def-2.6 cde 2.7 cd4.0 a2.2 ef3.2 b3.0 bc2.9 bc3.8 a
Third cut4.1 a1.4 e2.8 c1.5 e-1.9 d 1.8 de4.1 a3.1 b3.2 b3.8 a3.0 bc3.8 a
Total11.7 b6.7 fg8.2 d5.4 h-6.4 g 7.4 ef12.6 a7.8 e9.8 c9.6 cd9.0 cd11.2 bc
Average12.1 b8.0 f9.1 e7.7 f5.7 g7.6 f 9.2 e12.9 a9.2 e10.9 c10.8 c10.1 d12.2 b
ANOVATreatment 0.001
Year 0.001
T × Y 0.001
Note: M1: WC + O + TF; M2: A + O + TF; M3: A + WC + O + TF; M4: RC + WC + O + TF; M5: A + WC + O + TF + PR; M6: RC + WC + O + TF + PR; and M7: A + RC + WC + O + TF + PR. A, alfalfa; WC, white clover; RC, red clover; O, orchardgrass; TF, tall fescue; and PR, perennial ryegrass. T × Y shows the interactive effect between treatments and years. Data are the mean of three replicates. The small superscripts indicate the significant differences within the same row. Significant difference was tested at p < 0.05.
Table 5. Land-equivalent ratio values of legume–grass mixtures at different cuts for the establishment years 2018 and 2019.
YearCuttingsLegume–Grass Mixtures
M1M2M3M4M5M6M7
2018First cut1.25 a1.23 ab0.76 c1.04 ab1.11 b0.92 bc1.20 a
Second cut1.00 b1.17 ab1.09 ab1.19 ab1.15 ab1.31 a1.39 a
Third cut1.16 bc1.21 b1.22 ab1.13 a0.98 d1.07 bcd0.99 cd
Average1.081.191.161.171.071.191.19
2019First cut1.60 a1.48 ab0.84 c1.38 ab1.34 ab1.24 b1.59 a
Second cut1.71 bc1.54 bc0.96 d1.66 bc1.39 c1.79 b2.21 a
Third cut1.94 ab1.65 c1.51 c2.16 a1.85 b2.12 a2.05 ab
Average1.751.561.101.731.531.721.95
Note: M1: WC + O + TF; M2: A + O + TF; M3: A + WC + O + TF; M4: RC + WC + O + TF; M5: A + WC + O + TF + PR; M6: RC + WC + O + TF + PR; and M7: A + RC + WC + O + TF + PR. A, alfalfa; WC, white clover; RC, red clover; O, orchardgrass; TF, tall fescue; and PR, perennial ryegrass. Different small superscripts indicate the significant differences within the same row. Significant difference was applied at a probability level of 0.05.
Table 6. Competition rate of legumes and grasses of different legume–grass mixtures at different cuttings for the establishment years of 2018 and 2019.
YearLegume–Grass MixturesCuttings
First CutSecond CutThird Cut
LegumeGrassLegumeGrassLegumeGrass
2018M11.25 bc0.81 d0.40 c2.51 b0.42 d2.52 a
M22.92 a0.35 d2.81 a0.36 b7.96 a0.13 d
M31.39 b0.73 d2.01 b0.51 b4.19 b0.24 cd
M41.00 c1.02 d0.51 c3.57 b1.39 d0.74 bc
M50.21 d5.14 c0.17 c6.47 ab1.82 cd0.61 bcd
M60.08 d13.55 a0.11 c15.67 a1.19 d0.84 b
M70.12 d8.47 b0.25 c4.72 ab3.47 bc0.29 bcd
SEM0.21301.07440.22731.58490.57260.1775
2019M12.16 d0.52 a1.54 cd0.65 a0.97 c1.04 a
M23.58 abc0.28 bc2.68 b0.39 b3.84 b0.26 bc
M34.46 abc0.23 bc4.09 a0.24 c6.30 a0.16 c
M45.10 ab0.20 bc2.79 b0.36 bc3.44 b0.29 bc
M52.56 d0.44 ab2.72 b0.37 bc3.37 b0.30 b
M65.87 a0.18 c2.30 bc0.44 b3.97 b0.25 bc
M73.33 cd0.34 abc1.13 d0.59 a3.78 b0.26 bc
SEM0.36070.03540.21980.03200.34290.0638
Note: M1: WC + O + TF; M2: A + O + TF; M3: A + WC + O + TF; M4: RC + WC + O + TF; M5: A + WC + O + TF + PR; M6: RC + WC + O + TF + PR; and M7: A + RC + WC + O + TF + PR. A, alfalfa; WC, white clover; RC, red clover; O, orchardgrass; TF, tall fescue; and PR, perennial ryegrass. SEM is the standard error mean. Different small superscripts indicate the significant differences among mixtures within the same year. The significant difference was tested at a probability level of 0.05.
Publisher’s Note: MDPI stays neutral with regard to jurisdictional claims in published maps and institutional affiliations.

