Abstract
In-season sensing can account for field variability and improve nitrogen (N) management; however, opportunities exist for refinement. The purpose of this study was to compare different sensors and vegetation indices (VIs) (normalized difference vegetation index (NDVI); normalized difference red edge (NDRE); Simplified Canopy Chlorophyll Content Index (SCCCI)) at various corn stages to predict in-season yield potential. Additionally, different methods of yield prediction were evaluated where the final yield was regressed against raw or % reflectance VIs, relative VIs, and in-season yield estimates (INSEY, VI divided by growing degree days). Field experiments at eight-site years were established in Mississippi. Crop reflectance data were collected using an at-leaf SPAD sensor, two proximal sensors: GreenSeeker and Crop Circle, and a small unmanned aerial system (sUAS) equipped with a MicaSense sensor. Overall, relative VI measurements were superior for grain yield prediction. MicaSense best predicted yield at the VT-R1 stages (R2 = 0.78–0.83), Crop Circle and SPAD at VT (R2 = 0.57 and 0.49), and GreenSeeker at V10 (R2 = 0.52). When VIs were compared, SCCCI (R2 = 0.40–0.49) outperformed other VIs in terms of yield prediction. Overall, the best grain yield prediction was achieved using the MicaSense-derived SCCCI at the VT-R1 growth stages.
1. Introduction
Nitrogen application has increased crop yields by 30–50% [1], promoting economic development and supporting a larger population [2]. Currently, most of the N fertilizer consumed in the US is used for corn production. Only half of the N applied is recovered with the rest lost to the environment, causing agricultural N pollution [3]. One of the reasons for low N recovery is the use of suboptimal methods such as yield goals for N recommendation [4,5]. Moreover, Mississippi State also recommends the crop yield goal (CYG) method for N rate recommendation [6], which was proven ineffective in Mississippi for accounting for the spatial and temporal variabilities necessary to minimize misapplication [7].
One proposed alternative to CYG-based N management is non-destructive canopy reflectance sensing [8]. Nitrogen is important for many significant processes within plants. It is required in large quantities compared to other nutrients, and its deficiency is reflected in the chemical or physical properties of plants [6]. Crop canopy sensors accurately account for N deficiencies as it results in lower chlorophyll content and greenness of plants. Furthermore, various vegetation indices (VIs) were developed based on differences in crop reflectance to characterize spatial and temporal N variability.
Consistently, in-season sensing has demonstrated the capability to provide an environmentally distinct N rate that can account for temporal and spatial variability [9,10,11]. The development of a nutrient management strategy grounded in sensor technology is contingent upon the ability to predict in-season yield potential using an algorithm created from on-site observations [4,10,12]. The calculation of in-season yield potential is enabled by the ability to distinguish differences in crop N uptake by using distinctions in vegetation indices (VI) as a proxy for crop N uptake differences [13]. The algorithm is created by computing a regression analysis between actual yield and a predictor such as raw or % reflectance-corrected VI values or in-season estimated yield (INSEY) expressed as a VI (such as the normalized difference vegetation index (NDVI) divided by growing degree days (GDD)), with a more robust data set generally improving yield prediction. Recently, Paiao et al. [14] introduced relative VIs for comparison, where these values were calculated by dividing the VI from each plot by the VI from the highest N rate treatment. Specifically, when INSEY is used, the predicted in-season yield potential is multiplied by a response index (RI), created from an N-rich strip as a proxy for unlimited N supply, to calculate whether the yield may be improved by the addition of N. Finally, an N rate prescription is created specific to that site to match the crop N demand [13].
Sensor-Based Datasets and Corn Correlations
Accurate in-season yield prediction is dependent upon a range of factors including corn growth stage, VI, and sensors. Corn growth stages are generally divided into vegetative and reproductive stages, where V1 denotes the one-leaf stage until tasseling, which is designated as VT. Similarly, R stages are designated as R1 based on corn kernel development and end at R6 with a mature, harvest-ready crop [15]. Martin et al. [16] observed that NDVI was most correlated to corn grain yields at the V7 to V9 growth stages. Similarly, Tagarakis and Ketterings [17] observed V7 as the most effective stage for grain yield prediction. Different sensors have also been compared, with Sharma et al. [18] revealing no significant differences between the Crop Circle™ ACS-430 (Holland Scientific, Lincoln, NE, USA) and GreenSeekerTM (Trimble Inc., Sunnyvale, CA, USA) sensors when predicting yield using an NDVI-derived INSEY approach at the V6 stage.
Furthermore, the accuracy of in-season yield potential prediction is conditional upon the strength of the relationship between the final grain yield and an in-season crop indicator. An INSEY-based prediction model is predominantly used and recommended. Tagarakis and Ketterings [17] used an INSEY-based model, with the INSEY-derived model exhibiting superior capabilities for grain yield prediction. Paiao et al. [14] compared Soil Plant Analysis Development (SPADTM) (Konica Minolta, Inc., Osaka, Japan), NDVI, relative NDVI, normalized difference red edge (NDRE), and relative NDRE, with the relative NDRE demonstrating the greatest capability for grain yield estimation.
The relationship between INSEY and yield improved when NDRE was utilized due to the red edge wavelength being less influenced by saturation effects at later growth stages [14]. There is also evidence that the simplified canopy chlorophyll content index (SCCCI), which incorporates both NDVI and NDRE, is better for grain yield prediction versus NDVI or NDRE [19,20,21].
Considering the intertwining factors influencing in-season yield prediction, the purpose of this study was to assess the applicability of sensor-based N management comprehensively. N management assessment was accomplished by analyzing the ability to predict yield potential using various sensors and VIs at multiple growth stages. The most competent method for utilizing VI data for grain yield prediction was also evaluated. The ultimate goal of this study was to use drawn conclusions to create an algorithm capable of accurately predicting N needs in Mississippi similar to those created for other regions [10,17].
2. Materials and Methods
The research was conducted in 2020 and 2021 at four locations across Mississippi: (a) Black Belt Experiment Station, in Noxubee County at Brooksville, (b) R. R. Foil Plant Science Research Center, in Oktibbeha County at Starkville, (c) Delta Research Extension Center, in Washington County at Stoneville, and (d) Northeast Mississippi Branch Experiment Station, in Lee County at Verona. In both years, soil sample data were collected on a per replication basis at all locations. A total of 16 cores were collected per replication at a 15 cm depth. The fertility for each location was modified according to Mississippi State University recommendations based on soil test results (Table 1).

Table 1.
Phosphorus (P), potassium (K), and magnesium (Mg) soil test results in kg ha−1 and soil pH 0 to 15 cm for Brooksville, Starkville, Stoneville, and Verona in 2020 and 2021 before nutrient amendments.
The experiment employed a randomized complete block design with four replications. In 2020, the experiment consisted of 12 treatments including a 0-N control, and in 2021, 11 treatments including a 0-N control. Treatment structure details are located in Table 2. Both N applications utilized a 32% urea ammonium nitrate (UAN) solution knifed into the soil using a four-row liquid fertilizer applicator. In 2020, the corn harvest occurred between 3 September and 17 September. In 2021, the harvest began on 24 August and was completed on 14 September. The middle two rows of each treatment were combine harvested, and then the yield data were adjusted to a 15.5% moisture level.
Table 2.
Treatments, first and second application rates, and total N rates applied at Brooksville, Starkville, Stoneville, and Verona, MS in 2020 and 2021.
The V stage was identified each time staging was executed by the number of visible leaf collars on a random selection of three corn plants within the field. At later stages, where the earliest collars had diminished, three plants were bisected, and nodes were counted to gain an indication of the V stage. The R1 stage was identified by the presence of visible silks and the R5 stage by denting on a majority of corn kernels.
2.1. Sensor Technologies
The center two rows of each plot were used for data collection. The sensors utilized in this study included the GreenSeeker hand-held, Crop Circle ACS-430, SPAD, and MicaSense™ MX RedEdge (MicaSense Inc., Seattle, WA, USA) sensors. The wavelengths measured by each sensor are noted in Table 3. The GreenSeeker sensor utilizes two bands, a 656 nm red band and a 774 nm NIR band, which can be used to calculate NDVI [22]. The Crop Circle sensor employs three bands, a 670 nm red band, a 730 nm red edge band, and a 780 nm near-infrared (NIR), band to calculate both the NDVI and NDRE [22]. The MicaSense camera utilizes five bands, a 668 nm red band, a 560 nm green band, a 475 nm blue band, an 840 nm NIR band, and a 717 nm red edge band [23]. The band combinations can calculate, among other VIs, NDVI, NDRE, and SCCCI [24]. Consistent sensor deployment and/or timing was not executed in either year, with sensor heterogeneity and sensing frequency concentrated within the later stages, the 2020 year, the Crop Circle sensor, and the Brooksville and Starkville locations.
Table 3.
Sensor types with their respective sensed wavelengths.
Three SPAD measurements were sampled per plant on the corn leaf between the midrib and leaf margin and then averaged for three different plants for a total of three SPAD values per treatment. This averaged number was not further modified except for transformations to an INSEY and relative value in the relevant VI comparisons. In both years, SPAD measurements were collected during the VT and R1 growth stages.
In 2020 and 2021, remote and proximal sensing was conducted from the V4 to R5 growth stages, with measurements primarily taken within the V6 to VT growth stages. The proximal sensing measurements were parallel to the canopy at 0.5 m from the canopy. The remote sensing sensor was mounted on a 650 mm class X-frame small unmanned aerial system (sUAS). Flight creation and implementation were completed using ArduPilot® Mission Planner® [25]. The flights were conducted during solar noon at 60 m above the canopy and speed of 7.6 m s−1. Overlap and sidelap were set to 75%, and overshoot and lead in 15 m. All images were 1280 × 960 pixels at a 16-bit resolution. Camera specifications included a 47.2° horizontal field of view (HFOV) and a 35.4° vertical field of view (VFOV). Reflectance panel imagery was taken before and after each flight for absolute reflectance referencing.
2.2. Data Processing
Data from the Crop Circle and GreenSeeker sensors were averaged in Microsoft® Office Excel to create a single data point per treatment per growth stage. Post-flight image processing was conducted using the Ag Multispectral workflow in Pix4DMapper® [26] to create image mosaics. Pixels were converted to % reflectance using the reflectance panel imagery at a reflectance value of 0.98. The purpose of this was to compensate for varying light conditions so that the image mosaics would be comparable across space and time. The Raw Crop Circle, GreenSeeker, and SPAD values were not converted to % reflectance. VI data extraction was completed within QGIS® Desktop 3.16.6 with GRASS 7.8.5 [27], ArcGIS® Desktop 10.8.1 [28], and R® version 4.0.2 [29], with only the center two rows extracted and subsequently used for VI calculations.
2.3. Vegetation Indices
Indices including NDVI, NDRE, and SCCCI were calculated for each sensor. Table 4 displays the VI calculations calculated for each sensor.
Table 4.
Vegetation indices used in the study table adapted from Fox [30].
2.4. Calculations and Statistics
Three methods were utilized for the best means of sensor-based yield prediction. Regression analysis with grain yield included comparisons with raw or % reflectance-corrected VI values [35], an INSEY-based comparison [13], and relative VI values [14] for all sensors. The INSEY was calculated as VI divided by growing degree days (GDD), consisting of the sum of the number of days from sowing to sensing with an average temperature above 10 °C [13]. Similarly, relative VI values were calculated by dividing the sensor reading in each plot by the mean reading in the highest N rate treatment [14]. Comparisons of the three methods were completed across each VI sensor combination present within this study with the entire VI dataset utilized within this segment of comparison.
Next, the VI with the greatest capability for yield prediction was evaluated. Only the MicaSense relative NDVI, NDRE, and SCCCI, and Crop Circle relative NDVI, NDRE, and SCCCI values were utilized in this comparison due to the capability of both sensors to calculate each VI evaluated within this study.
After the VI-to-yield comparison, the most efficient sensor for yield prediction was evaluated. The SPAD, GreenSeeker, and Crop Circle sensors were compared at the VT stage. For the GreenSeeker and Crop Circle sensors, NDVI-relative values were employed for comparison. VT was chosen due to being the most prominent stage for VI data collection. NDVI was used due to the commonality between sensors. The lack of VT data for every location in 2021 led to 2021 data omission for the sensor comparison. There was an inadequate amount of MicaSense data to accurately make a yield prediction comparison to its counterparts.
Lastly, the optimum stage for yield prediction was assessed. All GreenSeeker, MicaSense, and Crop Circle sensor data, differentiated by stage, were utilized for comparison. As SCCCI was most correlated to yield, the MicaSense and Crop Circle sensors’ relative SCCCI values were chosen for comparison. For the GreenSeeker sensor, relative NDVI was used. For the GreenSeeker sensor, the V4, V6, V10, and VT stages were compared; for the Crop Circle sensor, the V4, V6, V8, V10, and VT stages were compared; and for the MicaSense sensor, the V6, V8, V10, VT, R1, and R5 stages were compared.
The datapoints with 2.5 standard deviations or greater were removed as outliers before analysis. Comparisons were gauged by the goodness of fit through the coefficient of determination (R2), Akaike Information Criterion (AIC), and Root Mean Square Error (RMSE). As this study should be considered a feasibility study, no independent validation of results was performed and will be completed in future research.
3. Results
3.1. Best Method for Sensor-Based Grain Yield Predictions
All collected VI data were utilized in this segment of comparison. The best results for the Crop Circle and the MicaSense sensor are illustrated in Figure 1. Sensor-based yield prediction employed three different methods for grain yield prediction, including raw or % reflectance corrected VI values, INSEY, and relative VI values. With the SPAD sensor, the raw values were best at explaining grain yield variations with an R2 of 0.49, AIC of 1873, and RMSE of 1.945. Relative values were almost identical in yield prediction capabilities, with an R2 of 0.48, AIC of 1888, and RMSE of 1.976 (Table 5). For the GreenSeeker sensor, no method effectively predicted grain yield. The INSEY VI values were the most effective method, with a low R2 of 0.11, AIC of 1941, and RMSE of 3.171 (Table 5). With the Crop Circle-derived NDVI, the INSEY method predicted the yield with a low R2 of 0.07, AIC of 5602, and RMSE of 2.955. Furthermore, for Crop Circle, the relative NDRE yield prediction resulted in an R2 of 0.29, AIC of 5299, and RMSE of 2.582 (Figure 1C). The relative SCCCI was the best yield prediction method for the Crop Circle-derived SCCCI, with an R2 of 0.40, AIC of 5109, and RMSE of 2.371 (Table 5; Figure 1E). For the MicaSense sensor’s NDVI, the relative values predicted the yield with an R2 of 0.25, AIC of 1347, and RMSE of 1.941 (Figure 1B). NDRE’s yield prediction capabilities for the MicaSense sensor were maximized when relative values were used, with an R2 of 0.44, AIC of 1251, and RMSE of 1.674. For SCCCI, the relative values were also best for yield prediction, with an R2 of 0.49, AIC of 1227, and RMSE of 1.611 (Table 5; Figure 1F).
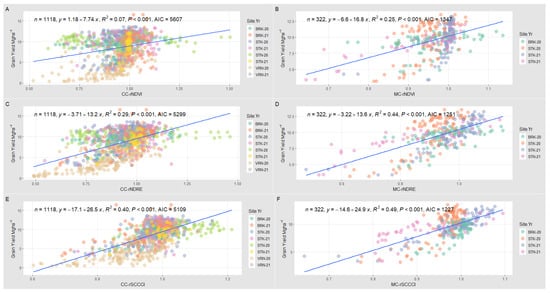
Figure 1.
Grain yield vs. relative VI comparison when collected using Crop Circle and MicaSense sensors. Crop Circle relative VIs included NDVI (A), NDRE (C), and SCCCI (E), whereas MicaSense relative VIs included NDVI (B), NDRE (D), and SCCCI (F). The number of datapoints for each equation is represented by n, the equation is represented by y, the coefficient of determination is represented by R2, the p-value by P, and the Akaike Information Criterion by AIC.
Table 5.
Comparison in yield prediction between the raw or % reflectance corrected VI, INSEY, and relative VI values for the SPAD, GreenSeeker, Crop Circle, and MicaSense sensors. The best fit method based on R2, AIC, and RMSE for each VI by sensor is bolded.
3.2. Comparison of VIs for Sensor-Based Yield Prediction
Total MicaSense and Crop Circle sensor data were utilized in this comparison segment. For the Crop Circle sensor, the relative SCCCI values were best for grain yield prediction, with an R2 of 0.40, AIC of 5109, and RMSE of 2.371 (Table 5; Figure 1E). Relative SCCCI was also best for yield prediction for the MicaSense sensor, with an R2 of 0.49, AIC of 1227, and RMSE of 1.611 (Table 5; Figure 1F). For the MicaSense sensor, the relative NDRE values provided a similar capability for grain yield prediction with an R2 of 0.44, AIC of 1251, and RMSE of 1.674 (Table 5; Figure 1D). For both the Crop Circle and MicaSense sensor, NDVI was the worst VI for grain yield prediction (Table 5).
3.3. Comparison of Sensors for Sensor-Based Yield Prediction
In this segment, the 2020 SPAD, GreenSeeker, and Crop Circle VT sensor data were compared. Between the SPAD, GreenSeeker, and Crop Circle sensors, the SPAD sensor was most effective for grain yield prediction when all sensors were compared, with an R2 of 0.53, AIC of 647.3, and RMSE of 2.243 (Table 6; Figure 2A). The second most suitable sensor was the Crop Circle sensor with an R2 of 0.31, AIC of 701.6, and RMSE of 2.709 (Table 6; Figure 2C). The least effective sensor for grain yield prediction was the GreenSeeker sensor with an R2 of 0.24, AIC of 714.3, and RMSE of 2.831 (Table 6; Figure 2B).
Table 6.
Sensor comparison between the relative VI values for the SPAD, GreenSeeker, and Crop Circle sensors. Data were collected at the VT stage from the Brooksville, Starkville, and Verona 2020 sites. The best fit sensor based on R2, AIC, and RMSE is bolded.
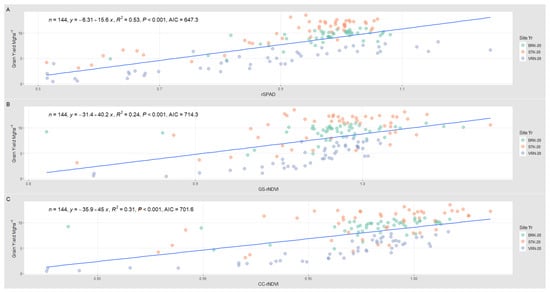
Figure 2.
Sensor comparison between the relative VI values for the SPAD (A), GreenSeeker (B), and Crop Circle sensors (C) at the VT stage. The population for each equation is represented by n, the equation is represented by y, the coefficient of determination is represented by R2, the p-value by P, and the Akaike Information Criterion by AIC.
3.4. Comparison of Growth Stages for Sensor-Based Yield Prediction
In this segment, total GreenSeeker, MicaSense, and Crop Circle sensor data, separated by stage, were compared. For the GreenSeeker sensor, the most effective stage for yield prediction was the V10 stage with an R2 of 0.52, AIC of 359.7, and RMSE of 1.527 (Table 7). The most suitable stage for yield prediction for the Crop Circle sensor was the VT stage with an R2 of 0.57, AIC of 1156, and RMSE of 1.916 (Table 7). For the MicaSense sensor, the superior stage for grain yield prediction within the vegetative stages was the VT stage with an R2 of 0.78, AIC of 134.3, and RMSE of 1.075. When the reproductive stages are included, R1 was most suitable for grain yield prediction with an R2 of 0.83, AIC of 124.7, and RMSE of 0.962 (Table 7).
Table 7.
Stage comparison between the GreenSeeker, Crop Circle, and MicaSense sensors. The best fit stage based on R2, AIC, and RMSE is bolded.
4. Discussion
As opposed to Tagarakis and Ketterings [17], where GreenSeeker INSEY values were better suited for yield prediction, we found that was not the most common optimal method overall (Table 5). The insufficiency of the INSEY method may be derived from the consistent GDDs present within the corn-growing season relative to crops such as winter annuals. The results also correspond to the findings of Paiao et al. [14], with five of the eight sensor VI combinations best predicting the yield when the relative VI method was utilized (Table 5). Akin to past studies, VIs that incorporated the red-edge wavelength were better predictors of grain yield, with SCCCI superior to either NDVI or NDRE (Table 5, [19,20]). This greater prediction capability is possibly due to SCCCI, which integrates NDRE and NDVI, being responsive to variance in both biomass and chlorophyll [20]. While NDVI is the most common VI utilized in yield prediction, the improved relationship between relative SCCCI and yield necessitates further research into the capabilities of relative SCCCI-derived algorithms. For the sensor comparison, the results were similar to Sharma et al. [18], with the Crop Circle and GreenSeeker sensors providing proximate prediction capability when NDVI is employed (Table 6). The sUAS-driven MicaSense sensor has the greatest potential for commercial use due to its ability for rapid data collection relative to the other sensors. Considering this advantage, the significance of the proportion of sensor capability to applicability should be considered when the aim is for commercial employment. Additionally, the capability of an algorithm to accurately predict N requirements should be gauged when the data originates from a sensor type not utilized in its creation [20]. The study results are similar to findings from past studies that have analyzed the effect of the stage, with the VI-to-yield correlation strengthening as the season progresses [16,17]. The improved correlation between yield and relative VI as the corn matures will need to be considered in algorithm creation due to the need for specialized equipment at later stages. In total, the combination that produced the highest correlation between VI and grain yield was the MicaSense sensor with relative SCCCI at the VT or R1 growth stages.
Recently, Colaço et al. [36] challenged the existing sensor-based N management strategies and inferred that encompassing multiple variables and using a non-mechanistic model would lead to a more accurate N rate. Furthermore, this paper is accentuating the need to account for the VI methodology for algorithm creation in N management. By distinguishing the most accurate VI, sensor, and stage, and considering the best method for VI data manipulation, a more robust algorithm can be created that could enhance N rate prescription capabilities.
5. Conclusions
In this study, four sensors and three VIs across multiple growth stages were assessed. Distinctions in the capability for grain yield prediction were observed across the different VIs, sensors, and stages. Specifically, SCCCI and later growth stages were best able to predict grain yield. While the SPAD sensor was best suited for grain yield prediction, practicality should be considered when the ultimate goal for an algorithm is commercial employment. Additionally, this study evaluated and found significant variance when the VI data methodology was examined. The variance derived from methodology differences highlights the pertinence of assessing VI methodology in future yield prediction modeling. By considering each factor, more accurate yield prediction algorithms may be derived that, sequentially, could provide better N prescription capabilities.
Author Contributions
Conceptualization, J.D.; methodology, J.D.; validation, J.D., A.A.A.F. and G.S.; formal analysis, C.O. and J.D.; investigation, C.O. and J.D.; resources, J.D. and G.S.; data curation, C.O.; writing—original draft preparation, C.O.; writing—review and editing, A.A.A.F., G.S. and J.D.; supervision, J.D.; project administration, J.D.; funding acquisition, J.D. All authors have read and agreed to the published version of the manuscript.
Funding
This research received no external funding.
Data Availability Statement
Data are available at reasonable request from the authors.
Acknowledgments
This publication is a contribution of the Mississippi Agricultural and Forestry Experiment Station.
Conflicts of Interest
The authors declare no conflict of interest.
References
- Stewart, W.M.; Dibb, D.W.; Johnston, A.E.; Smyth, T.J. The Contribution of Commercial Fertilizer Nutrients to Food Production. Agron. J. 2005, 97, 322–332. [Google Scholar] [CrossRef]
- Foley, J.A.; Ramankutty, N.; Brauman, K.A.; Cassidy, E.S.; Gerber, J.S.; Johnston, M.; Mueller, N.D.; O’Connell, C.; Ray, D.K.; West, P.C.; et al. Solutions for a cultivated planet. Nature 2011, 478, 337–342. [Google Scholar] [CrossRef] [PubMed]
- Raun, W.R.; Johnson, G.V. Improving Nitrogen Use Efficiency for Cereal Production. Agron. J. 1999, 91, 357–363. [Google Scholar] [CrossRef]
- Raun, W.; Figueiredo, B.; Dhillon, J.; Fornah, A.; Bushong, J.; Zhang, H.; Taylor, R. Can Yield Goals Be Predicted? Agron. J. 2017, 109, 2389–2395. [Google Scholar] [CrossRef]
- Rodriguez, D.G.P.; Bullock, D.S.; Boerngen, M.A. The Origins, Implications, and Consequences of Yield-Based Nitrogen Fertilizer Management. Agron. J. 2019, 111, 725–735. [Google Scholar] [CrossRef]
- Morris, T.F.; Murrell, T.S.; Beegle, D.B.; Camberato, J.J.; Ferguson, R.B.; Grove, J.; Ketterings, Q.; Kyveryga, P.M.; Laboski, C.A.M.; McGrath, J.M.; et al. Strengths and Limitations of Nitrogen Rate Recommendations for Corn and Opportunities for Improvement. Agron. J. 2018, 110, 1–37. [Google Scholar] [CrossRef]
- Oglesby, C.; Dhillon, J.; Fox, A.; Singh, G.; Ferguson, C.; Li, X.; Kumar, R.; Dew, J.; Varco, J. Discrepancy between the crop yield goal and optimum nitrogen rates for maize production in Mississippi. Agron. J. 2022. [Google Scholar] [CrossRef]
- Raun, W.R.; Solie, J.B.; Johnson, G.V.; Stone, M.L.; Lukina, E.V.; Thomason, W.E.; Schepers, J.S. In-Season Prediction of Potential Grain Yield in Winter Wheat Using Canopy Reflectance. Agron. J. 2001, 93, 131–138. [Google Scholar] [CrossRef]
- Ali, A.; Thind, H.; Singh, V.; Singh, B. A framework for refining nitrogen management in dry direct-seeded rice using GreenSeeker™ optical sensor. Comput. Electron. Agric. 2015, 110, 114–120. [Google Scholar] [CrossRef]
- Dhillon, J.; Aula, L.; Eickhoff, E.; Raun, W. Predicting in-season maize (Zea mays L.) yield potential using crop sensors and climatological data. Sci. Rep. 2020, 10, 11479. [Google Scholar] [CrossRef]
- Dhital, S.; Raun, W.R. Variability in Optimum Nitrogen Rates for Maize. Agron. J. 2016, 108, 2165–2173. [Google Scholar] [CrossRef]
- Bushong, J.T.; Mullock, J.L.; Arnall, D.B.; Raun, W.R. Effect of nitrogen fertilizer source on corn (Zea mays L.) optical sensor response index values in a rain-fed environment. J. Plant Nutr. 2018, 41, 1172–1183. [Google Scholar] [CrossRef]
- Raun, W.R.; Solie, J.B.; Johnson, G.V.; Stone, M.L.; Mullen, R.W.; Freeman, K.W.; Thomason, W.E.; Lukina, E.V. Improving Nitrogen Use Efficiency in Cereal Grain Production with Optical Sensing and Variable Rate Application. Agron. J. 2002, 94, 815–820. [Google Scholar] [CrossRef]
- Paiao, G.D.; Fernández, F.G.; Spackman, J.A.; Kaiser, D.E.; Weisberg, S. Ground-based optical canopy sensing technologies for corn–nitrogen management in the Upper Midwest. Agron. J. 2020, 112, 2998–3011. [Google Scholar] [CrossRef]
- Ritchie, S.W.; Hanway, J.J.; Benson, G.O. How a Corn Plant Develops; Sp. Rpt. 48; Iowa Agricultural and Home Economics Experiment Station Publications; Iowa State University of Science and Technology, Cooperative Extension: Ames, IA, USA, 1986; Volume 48, pp. 1–21. [Google Scholar]
- Martin, K.L.; Girma, K.; Freeman, K.W.; Teal, R.K.; Tubańa, B.; Arnall, D.B.; Chung, B.; Walsh, O.; Solie, J.B.; Stone, M.L.; et al. Expression of Variability in Corn as Influenced by Growth Stage Using Optical Sensor Measurements. Agron. J. 2007, 99, 384–389. [Google Scholar] [CrossRef]
- Tagarakis, A.C.; Ketterings, Q.M. In-Season Estimation of Corn Yield Potential Using Proximal Sensing. Agron. J. 2017, 109, 1323–1330. [Google Scholar] [CrossRef]
- Sharma, L.K.; Bu, H.; Franzen, D.W. Comparison of two ground-based active-optical sensors for in-season estimation of corn (Zea mays L.) yield. J. Plant Nutr. 2016, 39, 957–966. [Google Scholar] [CrossRef]
- Barzin, R.; Pathak, R.; Lotfi, H.; Varco, J.; Bora, G.C. Use of UAS Multispectral Imagery at Different Physiological Stages for Yield Prediction and Input Resource Optimization in Corn. Remote Sens. 2020, 12, 2392. [Google Scholar] [CrossRef]
- Sumner, Z.; Varco, J.J.; Dhillon, J.S.; Fox, A.A.A.; Czarnecki, J.; Henry, W.B. Ground versus aerial canopy reflectance of corn: Red-edge and non-red edge vegetation indices. Agron. J. 2021, 113, 2782–2797. [Google Scholar] [CrossRef]
- Parker, J.N. Sustainable Sidedress Nitrogen Applications for Early Corn and Cotton Crops Using Small Unmanned Aerial Systems. Master’s Thesis, Mississippi State University, Starkville, MS, USA, 2022. Available online: https://scholarsjunction.msstate.edu/td/5604 (accessed on 1 September 2020).
- Whelan, B. Proximal Crop Reflectance Sensors. 2015. Available online: https://grdc.com.au/__data/assets/pdf_file/0011/17300/grdc_proximinal-crop-reflectance.pdf.pdf (accessed on 1 September 2020).
- Thomson, E.R.; Spiegel, M.P.; Althuizen, I.H.J.; Bass, P.; Chen, S.; Chmurzynski, A.; Halbritter, A.H.; Henn, J.J.; Jónsdóttir, I.S.; Klanderud, K.; et al. Multiscale mapping of plant functional groups and plant traits in the High Arctic using field spectroscopy, UAV imagery and Sentinel-2A data. Environ. Res. Lett. 2021, 16, 055006. [Google Scholar] [CrossRef]
- Barzin, R.; Lotfi, H.; Varco, J.J.; Bora, G.C. Machine Learning in Evaluating Multispectral Active Canopy Sensor for Prediction of Corn Leaf Nitrogen Concentration and Yield. Remote Sens. 2022, 14, 120. [Google Scholar] [CrossRef]
- Mission Planner. ArduPilot Development Team. 2021. Available online: http://ardupilot.org/planner/ (accessed on 1 September 2020).
- Pix4Dmapper. Pix4D SA. 2021. Available online: www.pix4d.com (accessed on 1 September 2020).
- QGIS.org. QGIS Geographic Information System. QGIS Association. 2021. Available online: http://www.qgis.org (accessed on 1 September 2020).
- ESRI. ArcGIS Desktop. Redlands, CA: Environmental Systems Research Institute. 2021. Available online: https://www.arcgis.com/index.html (accessed on 1 September 2020).
- R Core Team. R: A Language and Environment for Statistical Computing; R Foundation for Statistical Computing: Vienna, Austria, 2021; Available online: https://www.R-project.org/ (accessed on 29 June 2021).
- Fox, A.A.A. An Integrated Approach for Predicting Nitrogen Status in Early Cotton and Corn. Available from Dissertations & Theses @ Mississippi State University; Pro- Quest Dissertations & Theses Global. 2015. Available online: https://www.proquest.com/pqdtglobal/docview/1679463711/AC3CA9ABEADF465EPQ/1?accountid=34815 (accessed on 1 September 2020).
- Rouse, J.W.; Haas, R.H.; Schell, J.A.; Deering, D.W. Monitoring Vegetation Systems in the Great Plains with ERTS; Third ERTS Sym.; NASA: Washington, DC, USA, 1973; pp. 309–317, NASA SP-351 I. [Google Scholar]
- Barnes, E.M.; Clarke, T.R.; Richards, S.E.; Colaizzi, P.D.; Haberland, J.; Kostrzewski, M.; Waller, P.; Choi, C.; Riley, E.; Thompson, T.; et al. Coincident detection of crop water stress, nitrogen status and canopy density using ground based multispectral data. In Proceedings of the 5th International Conference on Precision Agriculture, Bloomington, MI, USA, 16–19 July 2000. [Google Scholar]
- Varco, J.J.; Fox, A.A.; Raper, T.B.; Hubbard, K.J. Development of sensor based detection of crop nitrogen status for utilization in variable rate nitrogen fertilization. In Precision Agriculture; Wageningen Academica Publishers: Wageningen, The Netherlands, 2013; pp. 145–150. [Google Scholar]
- Raper, T.B.; Varco, J.J. Canopy-scale wavelength and vegetative index sensitivities to cotton growth parameters and nitrogen status. Precis. Agric. 2014, 16, 62–76. [Google Scholar] [CrossRef]
- Frels, K.; Guttieri, M.; Joyce, B.; Leavitt, B.; Baenziger, P.S. Evaluating canopy spectral reflectance vegetation indices to estimate nitrogen use traits in hard winter wheat. Field Crop. Res. 2018, 217, 82–92. [Google Scholar] [CrossRef]
- Colaço, A.; Richetti, J.; Bramley, R.; Lawes, R. How will the next-generation of sensor-based decision systems look in the context of intelligent agriculture? A case-study. Field Crop. Res. 2021, 270, 108205. [Google Scholar] [CrossRef]


Publisher’s Note: MDPI stays neutral with regard to jurisdictional claims in published maps and institutional affiliations. |
© 2022 by the authors. Licensee MDPI, Basel, Switzerland. This article is an open access article distributed under the terms and conditions of the Creative Commons Attribution (CC BY) license (https://creativecommons.org/licenses/by/4.0/).