Article

Effect of Ratios of Red and White Light on the Growth and Quality of Pak Choi

College of Horticulture, South China Agricultural University, Guangzhou 510642, China
*
Author to whom correspondence should be addressed.
Agronomy 2022, 12(10), 2322; https://doi.org/10.3390/agronomy12102322
Submission received: 30 August 2022 / Revised: 21 September 2022 / Accepted: 21 September 2022 / Published: 27 September 2022

Abstract

:
The effects of different ratios of red:white light on the biomass, photosynthetic capacity, phytochemical accumulation, and antioxidant capacity of pak choi were investigated. There were three treatments: red:white = 1:2 (LR), red:white = 1:1 (MR), red:white = 2:1 (HR) with white light as control (CK) at photosynthetic photon flux density (PPFD) of 250 μmol·m−2·s−1. In LR treatment, chlorophyll fluorescence and nitrate content were reduced, while the photosynthetic rate (Y(ll)), the contents of soluble protein, soluble sugar, vitamin C, flavonoids, polyphenols, glucosinolates, FRAP, and 2,2-diphenyl-1-bitter acyl radical scavenging increased. The chlorophyll content was enhanced in MR treatment, and the photosynthetic rate and glucosinolate content increased in HR treatment. The most suitable light for the cultivation of pak choi in the plant factory was red:white = 1:2.

1. Introduction

Light is one of the most important factors affecting plant growth, while red and blue light were considered as most effective for plant growth and development. Red light (600–700 nm) is the effective radiation required for photosynthesis [1], while blue light (400–500 nm) acts as the main light source for photosynthesis and regulates many physiological responses in plants through photoreceptors [2], involved in chlorophyll formation, stomatal opening and closing, and photosynthesis [2,3,4]. Under the simultaneous addition of red and blue light, pak choi biomass was higher in the treatment with a greater proportion of red light [5]. However, in several studies, it has been observed that the development of plants is severely hampered by monochromatic red light, including leaf curling and reduced photosynthetic capacity, collectively known as ‘red light syndrome’ which can be suppressed by the addition of blue light (400–500 nm) [6,7,8].
Under red and blue light conditions, an increasing proportion of red light could promote biomass accumulation and enhance the leaf area of pak choi and lettuce [5,9]. An increased proportion of red light also enhanced nitrate reductase activity, resulting in lower nitrate levels in the rocket [10]. The addition of moderate amounts of blue light increased the photosynthetic capacity of cucumber leaves [11]. As the ratios of red to blue light decreased, the antioxidant content such as carotenoids, anthocyanins, and flavonoids increased [12,13,14]. A greater proportion of blue light added to red light increased the carotenoid content in lettuce [15].
Green light possesses the ability to regulate plant growth and development [16]. It has long been widely accepted that plant leaves appear green because they reflected green light, and consequently that green light was not necessary for plant growth and development. However, plants have a better growth performance when green light is added to red and blue light [17]. At high light intensities, green light contributed significantly to lettuce growth, primary and secondary metabolism, and photomorphogenesis [18], probably because that green light could penetrate the leaf and reach the interior of the plant canopy, promoted photosynthesis in the deeper chloroplasts and leaves, thereby increasing crop growth capacity and biomass accumulation [19]. Supplementary green light significantly increased the total chlorophyll and carotenoid contents of tomatoes [20], as well as the photoprotective capacity of spinach [21], compared to conditions without green light.
Plants are most affected by red and blue light, and green light also has some remarkable effects on the plant. LED white light chips are cheaper than LED blue light, and it is more cost-effective to use white light instead of blue light. Therefore, white light could be used as an alternative to blue and green light for crop cultivation.
Pak choi (Brassica campestris ssp. chinensis var. communis) is rich in vitamin C, carotenoids, and flavonoids, which are beneficial to human health [22]. Pak choi is becoming more popular worldwide. This study was conducted to investigate the effects of different ratios of red and white light on the yield, quality, and photosynthesis of pak choi, providing information for the high-quality and efficient production of pak choi in plant factories.

2. Materials and Methods

2.1. Plant Materials, Growth Conditions and Treatments

This study was conducted in an artificial lighting plant factory at the South China Agricultural University (113.36° E, 23.16° N). Pak choi seeds (cv. Xiashangwei No.2, from GLseed seed company Ltd., Zhuhai, China) were sown in a sponge block (2 cm × 2 cm × 2 cm) containing a half-strength Hoagland nutrient solution. Seeding was grown under PPFD of 250 μmol·m−2·s−1 white LEDs, 10:14 h light:dark, 20 ± 2 °C, and 65–75% relative humidity. The 14-day-old seedlings with three true leaves were transplanted in the deep flow technique (DFT) hydroponics system with a half-strength Hoagland nutrient solution. The nutrient solution circulated for 5 min at 20 min intervals.
The customized hydroponic system at a density of 24 plants per plate (95 cm × 60 cm × 3 cm), was considered a replicate. All light treatments had three replicates. Half-strength Hoagland nutrient solution was used, and the electrical conductivity (EC) was 1.60 dS m−1 and pH was 6.8. Adjustable LED panels (Chenghui Equipment Co., Ltd., Guangzhou, China; 150 cm × 30 cm) with red (660 ± 10 nm) and white (peak at 440 nm) LEDs were used as light sources.
There were four light treatments: white LED, the control (CK); red:white 1:2 (Low red, LR); red:white 1:1 (Medium red, MR); and red:white 2:1 (High red, HR). The PPFD at the pak choi canopy level is 250 ± 20 μmol·m−2·s−1, and the photoperiod was 10:14 h (light:dark). The PPFD and spectra were monitored using a spectroradiometer (ALP-01, Asensetek, Taiwan, China) (Figure 1 and Table 1).

2.2. Plant Growth

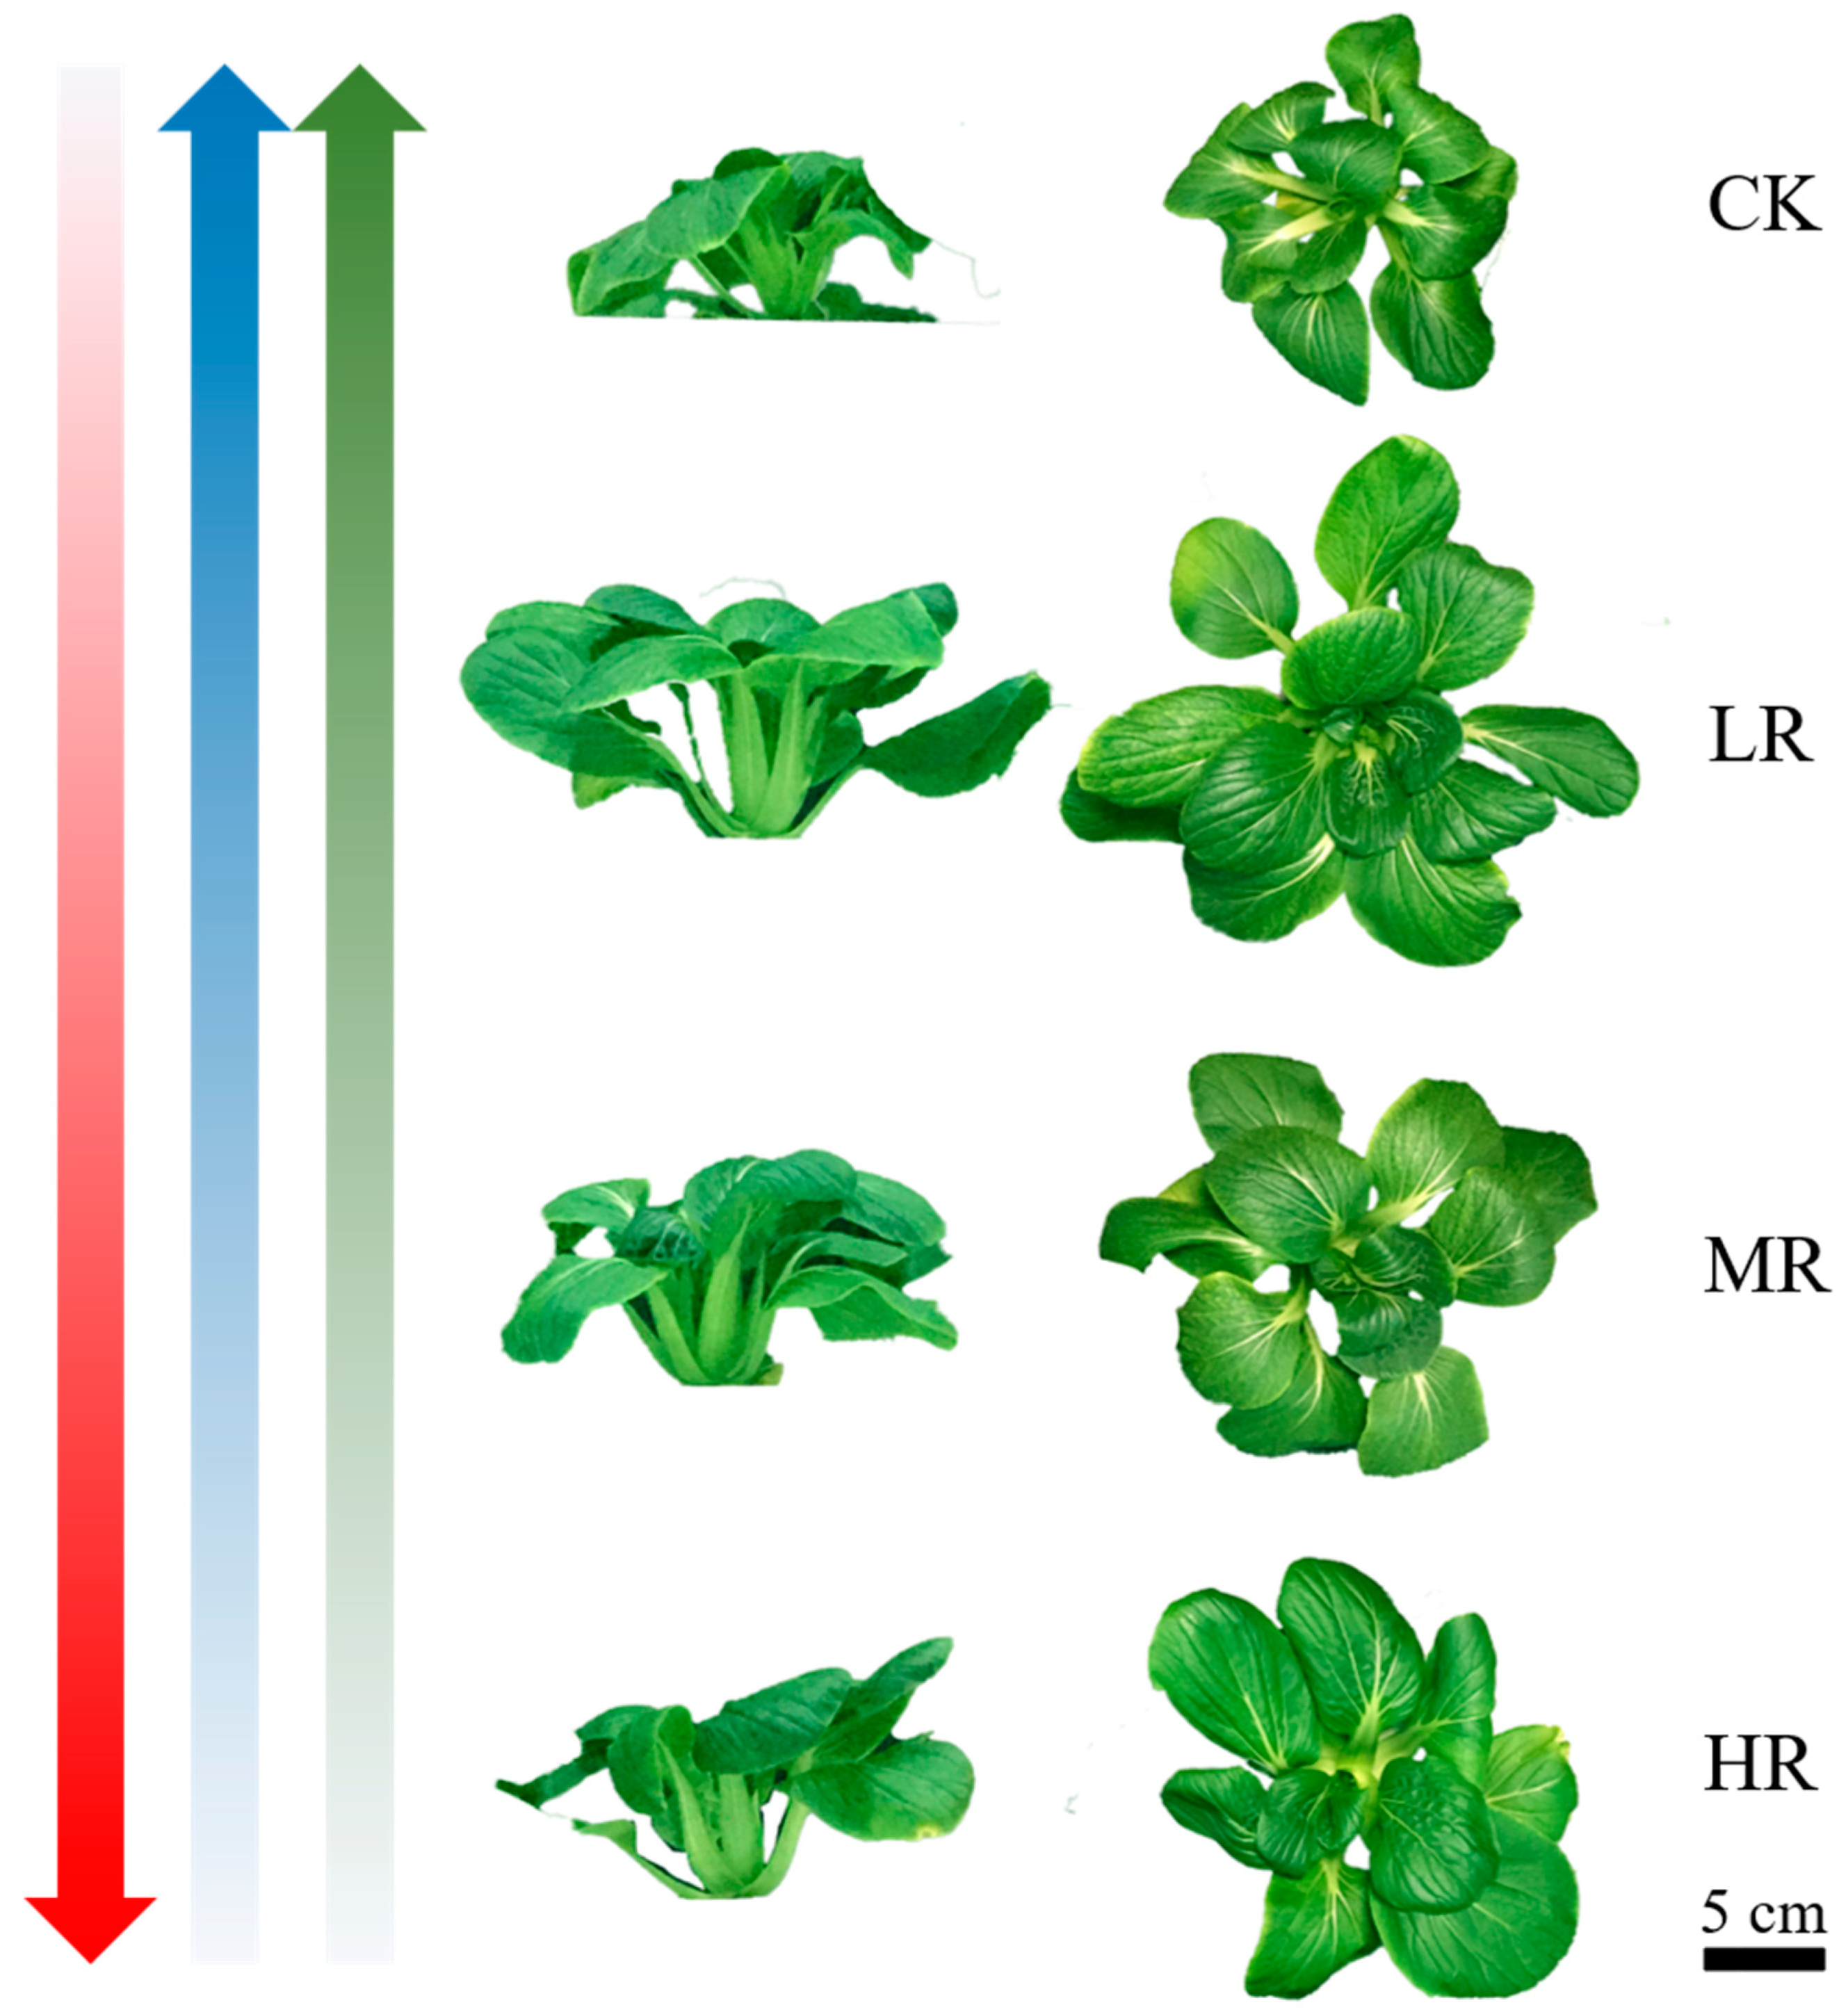
Nine plants per treatment were destructively determined at 30 days after treatment. Growing condition is shown in Figure 2. Shoots and roots’ fresh weight were measured using an electronic balance (BAS224S, Sartorius, Germany) immediately after harvest. Then shoots and roots were oven-dried 48 h at 75 °C for dry weight determination. All the expanded leaves were counted. The length of leaf and petiole of expanded leaves and the total leaf area were determined by software (ImageJ 1.42, National Institutes of Health, Bethesda, MD, USA). Petiole:leaf ratio = petiole length:leaf length. Specific leaf weight = leaf dry weight:leaf area.
The shoots of pak choi were immediately frozen in liquid nitrogen and stored at −40 °C.

2.3. Photosynthetic Parameters

2.3.1. Chlorophyll Fluorescence Measurements

Determination of chlorophyll fluorescence was based on Kumar et al. [23]. After 21 days of the treatment, the expanded leaves were collected from each treatment and chlorophyll fluorescence was taken after placing 30 min dark incubation of each leaf by imaging fluorometer (Imaging PAM—MAXI version, Heinz Walz, Effeltrich, Germany).

2.3.2. Chlorophyll (Chl) and Carotenoid Contents

Fresh samples of expanded leaves (0.2 g) were soaked in 8.0 mL acetone ethanol mixture (acetone:ethanol = 1:1, v:v) and incubated at 25 °C in dark for 48 h. The extract solution absorbance was determined with UV-spectrophotometer (Shimadzu UV-16A, Shimadzu, Corporation, Kyoto, Japan) at 663 nm (A663), 645 nm (A645), and 440 nm (A440). The pigments contents were calculated according to Gratani [24] as follows:
Chl a content (mg/g FW) = (12.70 × A663 − 2.69 × A645) × 8 mL/(1000 × 0.2 g);
Chl b content (mg/g FW) = (22.90 × A645 − 4.86 × A663) × 8 mL/(1000 × 0.2 g);
Chl a + Chl b content (mg/g FW) = (8.02 × A663 + 20.20 × A645) × 8 mL/(1000 × 0.2 g);
Carotenoid content (mg/g FW) = (4.70 × A440 − 2.17 × A663 − 5.45 × A645) × 8 mL/(1000 × 0.2 g)

2.4. Nutrients

2.4.1. Soluble Sugar Content

Soluble sugar content was determined by anthrone–sulfuric acid colorimetry [25]. Frozen fresh tissue (0.5 g) was mixed with 5.0 mL 80% ethanol in a test tube and kept in 80 °C water bath for 40 min. Another 2.5 mL 80% ethanol was added, and the test tube was returned to the 80 °C water bath for 40 min, then the solution was filtered by a funnel with double filter papers. The filtered solution was collected in a 10-mL volumetric flask, cooled to 25 °C, and then 80% ethanol was added until the volume was 10 mL. Later, the filtered solution (0.2 mL) and distilled water (0.8 mL) were mixed in a 10-mL test tube; 0.5 mL anthrone ethyl acetate reagent and 5.0 mL concentrated sulfuric aware added, mixed with vortex, and then placed in boiling water for 10 min. After cooling to ambient temperature, the solution was measured at 625 nm by a UV-spectrophotometer.

2.4.2. Nitrate Content

The nitrate content was determined by UV spectrophotometry [26]. Frozen fresh plant tissue (1.0 g) was homogenized in 10 mL distilled water and heated in a boiling water bath for 30 min. The homogenate was filtered into a volumetric flask. Then 0.1 mL sample solution was mixed with 0.4 mL 5% salicylic acid–sulfuric acid mixture and 9.5 mL 8% NaOH. The nitrate content was determined using a UV-spectrophotometer at 410 nm.

2.4.3. Soluble Protein Content

Determination of soluble protein content was performed by Coomassie brilliant blue G-250 staining [27]. Frozen fresh plant tissue (0.5 g) was mixed with 8 mL deionized water and then centrifuged at 986× g for 10 min at 4 °C. The supernatant (0.2 mL) was combined with 0.8 mL distilled water and 5.0 mL Coomassie brilliant blue G-250 solution (0.1 g·L−1). After 10 min, the absorbance was measured at 595 nm using a UV-spectrophotometer.

2.4.4. Vitamin C Content

Vitamin C content was determined by molybdenum blue spectrophotometry [28]. Frozen fresh tissue (0.5 g) was homogenized with 25 mL 0.05 mol/L oxalic acid solution (w:v) in a volumetric flask. Then the solution was filtered by a funnel with double filter papers. Next, 10.0 mL supernatant was mixed with 1.0 mL metaphosphoric acid solution (w:v), 2.0 mL 5% sulfuric acid solution (v:v) and 4.0 mL 5% ammonium molybdate solutions (w:v). The supernatants were mixed well and kept still for 15 min, then measured at 705 nm by a UV-spectrophotometer, using oxalic acid as a blank.

2.5. Antioxidants

2.5.1. Polyphenol Content

The polyphenol content was determined using the Folin–Ciocalteu assay [29]. Frozen fresh tissue (0.5 g) was extracted with 8 mL alcohol. The homogenate was allowed to stand for 30 min and then centrifuged at 986× g at 4 °C for 10 min. The supernatant (1 mL) was then mixed with 0.5 mL Folin phenol and 11.5 mL 26.7% sodium carbonate; 7.0 mL distilled water was then added to the mixture. The absorbance was measured at 510 nm using a UV-spectrophotometer.

2.5.2. Flavonoid Content

The flavonoid content was determined by an aluminum nitrate method [30]. The sample extract (1.0 mL), extracted following the same method as for polyphenols, was mixed with 0.7 mL 5% sodium nitrite solution in a 10-mL test tube for 5 min. Then 0.7 mL 5% aluminum nitrate was added to the mixture for 6 min. A total of 5.0 mL 5% sodium hydroxide solution was added and reacted at 25 °C. The absorption at 510 nm was measured by a UV-spectrophotometer.

2.5.3. Ferric-Reducing Antioxidant Power

The ferric reducing antioxidant power (FRAP) was determined following Benzie and Strain [31]. The sample solution (0.4 mL), extracted following the same method as for polyphenols, was mixed with 3.6 mL solution containing 0.3 mol·L−1 acetate buffer, 10 mmol·L−1 2, 4, 6-tripyridyl-S-triazine (TPTZ) and 20 mmol·L−1 FeCl3 at a 10:1:1 ratio (v:v:v) for 10 min at 37 °C. The FRAP was determined at 593 nm by a spectrophotometer.

2.5.4. DPPH Radical-Scavenging Rate

The 2, 2-diphenyl−1-picrylhydrazyl (DPPH) radical-scavenging rate was determined following Tadolini et al. [32]. The sample extract (2.0 mL), extracted following the same method as for polyphenols, was mixed with 2.0 mL DPPH solution (0.0080 g DPPH in 100 mL alcohol) and the absorbance of the mixture was determined at 517 nm using a UV-spectrophotometer.

2.5.5. Glucosinolate Content Determination

Determination of glucosinolates (GSLs) was performed with HPLC referring to Liu et al. [33]. The frozen-dried sample was extracted with methanol, and then the extracts were purified and desulfurized with the ion-exchange method. The GSLs were separated and identified by HPLC (Waters Alliance e2695). A 5-μm C18 column (Waters, 250 mm length, 4.6 mm diameter) was used for GSL separation. Elution was performed with mobile phase A (water, 18.2 MΩ·cm resistance) and mobile phase B (acetonitrile). The optimum column temperature was 30 °C. At a flow rate of 1.0 mL/min, the gradient conditions were set as follows: solvent A volume at 100% for 0 to 32 min, 80% for 32 to 38 min, and solvent B volume at 100% for 38 to 40 min. The time for elution was 42–50 min. The detector monitored GSLs at 229 nm. The individual GSLs were identified according to their HPLC retention times and our database, ad quantified with sinigrin as an internal reference with their HPLC areas and relative response factors. The results were expressed as μmol/g DW.

2.6. Statistical Analysis

Data were expressed as mean ± standard error and analyzed by two-way analysis of variance (ANOVA) using SPSS 23.0 (Chicago, IL, USA). Means were compared using Duncan’s test, and differences were considered significant at p < 0.05. Figures and PCA were drawn using Origin 2021 (Origin Lab, Northampton, MA, USA). Heat maps were generated using TBtools [34].

3. Results

3.1. The Effect of Red and White Light Ratios on Pak Choi Growth

The growth of pak choi was significantly affected by the ratios of red and white light. As the portion of red light increased, the dry and fresh weights of root and shoot increased (Table 2). The shoot fresh weight in LR, MR, and HR treatments significantly increased by 68%, 43%, 51%, and root fresh weight by 61%, 30%, and 42%, respectively. Shoot dry weight in LR, MR, and HR treatments increased significantly by 80%, 51%, and 53%, and root dry weight increased remarkably by 94%, 58%, and 39%, respectively. While the ratio of root:shoot significantly decreased by approximately 10% in LR, MR, and HR treatments.
The leaf area of pak choi increased notably by 29%, 14%, and 36% under LR, MR, and HR treatments, respectively. The number of leaves was significantly enhanced by the enhanced ratios of red light. Specific leaf weight was significantly increased in LR and MR treatments compared to CK.

3.2. The Effect of Red and White Light Ratios on Pak choi Photosynthetic Capacity

Different ratios of red and white light significantly affected chlorophyll fluorescence in pak choi (Figure 3). The increased ratios of red light treatments all decreased Y(NPQ), while LR and HR increased Y(ll). Compared to CK, Fv/Fm and Y(NPQ) remarkably decreased by 4% and 39% in LR treatment. Compared to CK, Y(NPQ) notably decreased by 20% in MR treatment. Compared to CK, Y(ll) significantly increased by 15%, Y(NPQ) and Y(NO) significantly decreased by 29%, and 10% in HR treatment.
The photosynthetic pigment of pak choi was remarkably affected by the ratios of red and white light (Figure 3). Compared to CK, the content of chlorophyll a and total chlorophyll significantly decreased by 5% and 11% in HR treatment. Compared to CK, chlorophyll b content significantly increased by 24%, and carotenoid content remarkably decreased by 14% in MR treatment.

3.3. The Effect of Red and White Light Ratios on Pak Choi Nutrition

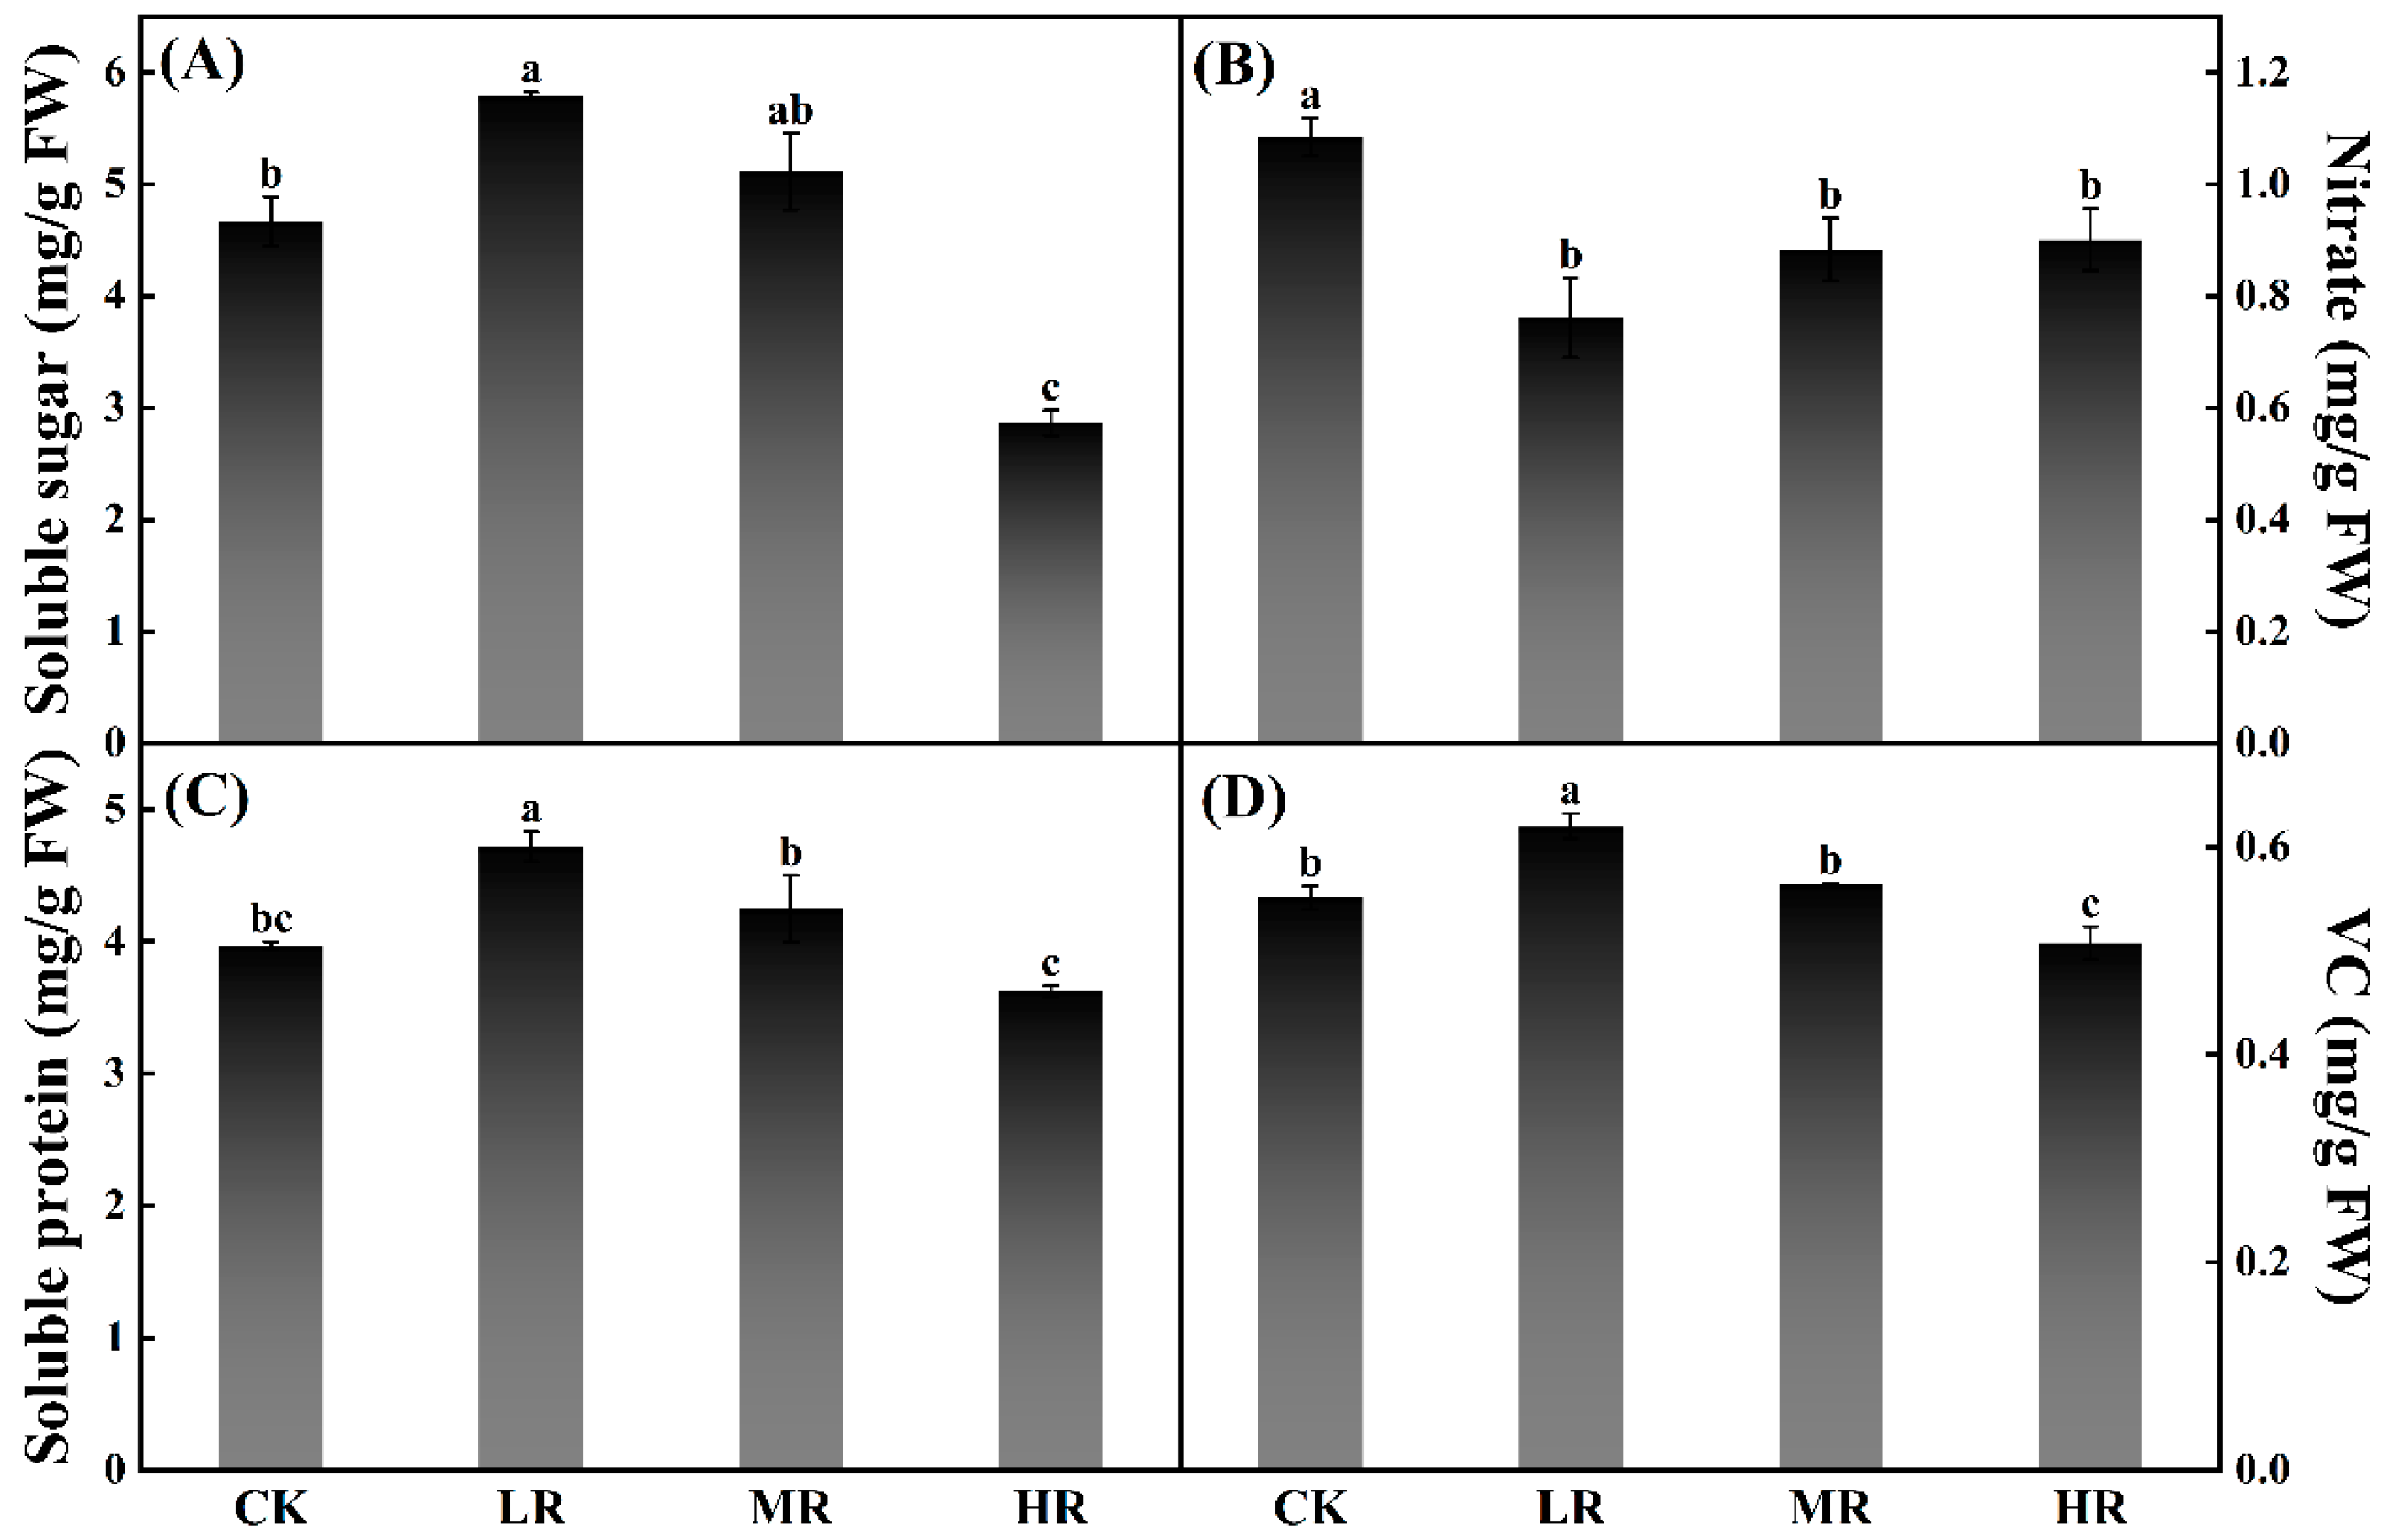
The pak choi nutrition was affected by different ratios of red and white light (Figure 4). Compared to CK, the soluble sugar content was significantly higher (24%) in LR treatment, while significantly lower (39%) in HR treatment, respectively. The nitrate content was significantly reduced with increasing red light, however there were no significant differences among the promoted proportion of red light treatments. Compared to CK, the content of soluble protein and VC increased remarkably by 19% and 12% in LR treatment, while VC decreased notably by 8% in HR treatment.

3.4. The Effect of Red and White Light Ratios on Pak Choi Antioxidant Capacity

The antioxidant capacity of pak choi was affected by different ratios of red and white light (Figure 5). Compared with CK, the contents of polyphenol, flavonoid, and FRAP significantly increased by 15%, 32%, and 30%, respectively, in LR treatment, and polyphenol content notably increased 27% in MR treatment, while FRAP did not remarkably change in MR and HR treatments.

3.5. The Effect of Red and White Light Ratios on Pak Choi Glucosinolate Content

Eight GSLs, including four aliphatic GSLs (progoitrin (PRO), glucoraphanin (RAA), sinigrin (SIN), gluconapin (NAP)), and four indole GSLs (4-hydroxygiucobrassicin (4OH), glucobrassicin (GBC), 4-methoxyglucobrassicin (4ME), neoglucobrassicin (NEO)), were identified in pak choi by HPLC (Figure 6).
In CK treatment, the aliphatic GSL possessed 89% of the total GSL. PRO, NAP, RAA, and SIN possessed 2.0%, 97.0%, 0.7%, and 0.3% of the aliphatic GSL, respectively, while 4ME, NEO, 4OH, and GBC, possessed 13.9%, 61.1%, 5.6%, and 19.4% of the indole GSL, respectively. Compared to CK, the content of PRO, 4ME, RAA, SIN, and 4OH, significantly increased 150%, 52%, 38%, 291%, and 200% in LR treatment, respectively, and the content of PRO, NEO, and 4OH was significantly enhanced by 133%, 135%, and 191% in HR treatment, respectively. The indole GSL content remarkably increased 94% and 33% compared to CK in HR and LR treatments, respectively. However, no significant differences in the aliphatic GSL content were observed among the treatments.

3.6. Heatmap Analysis

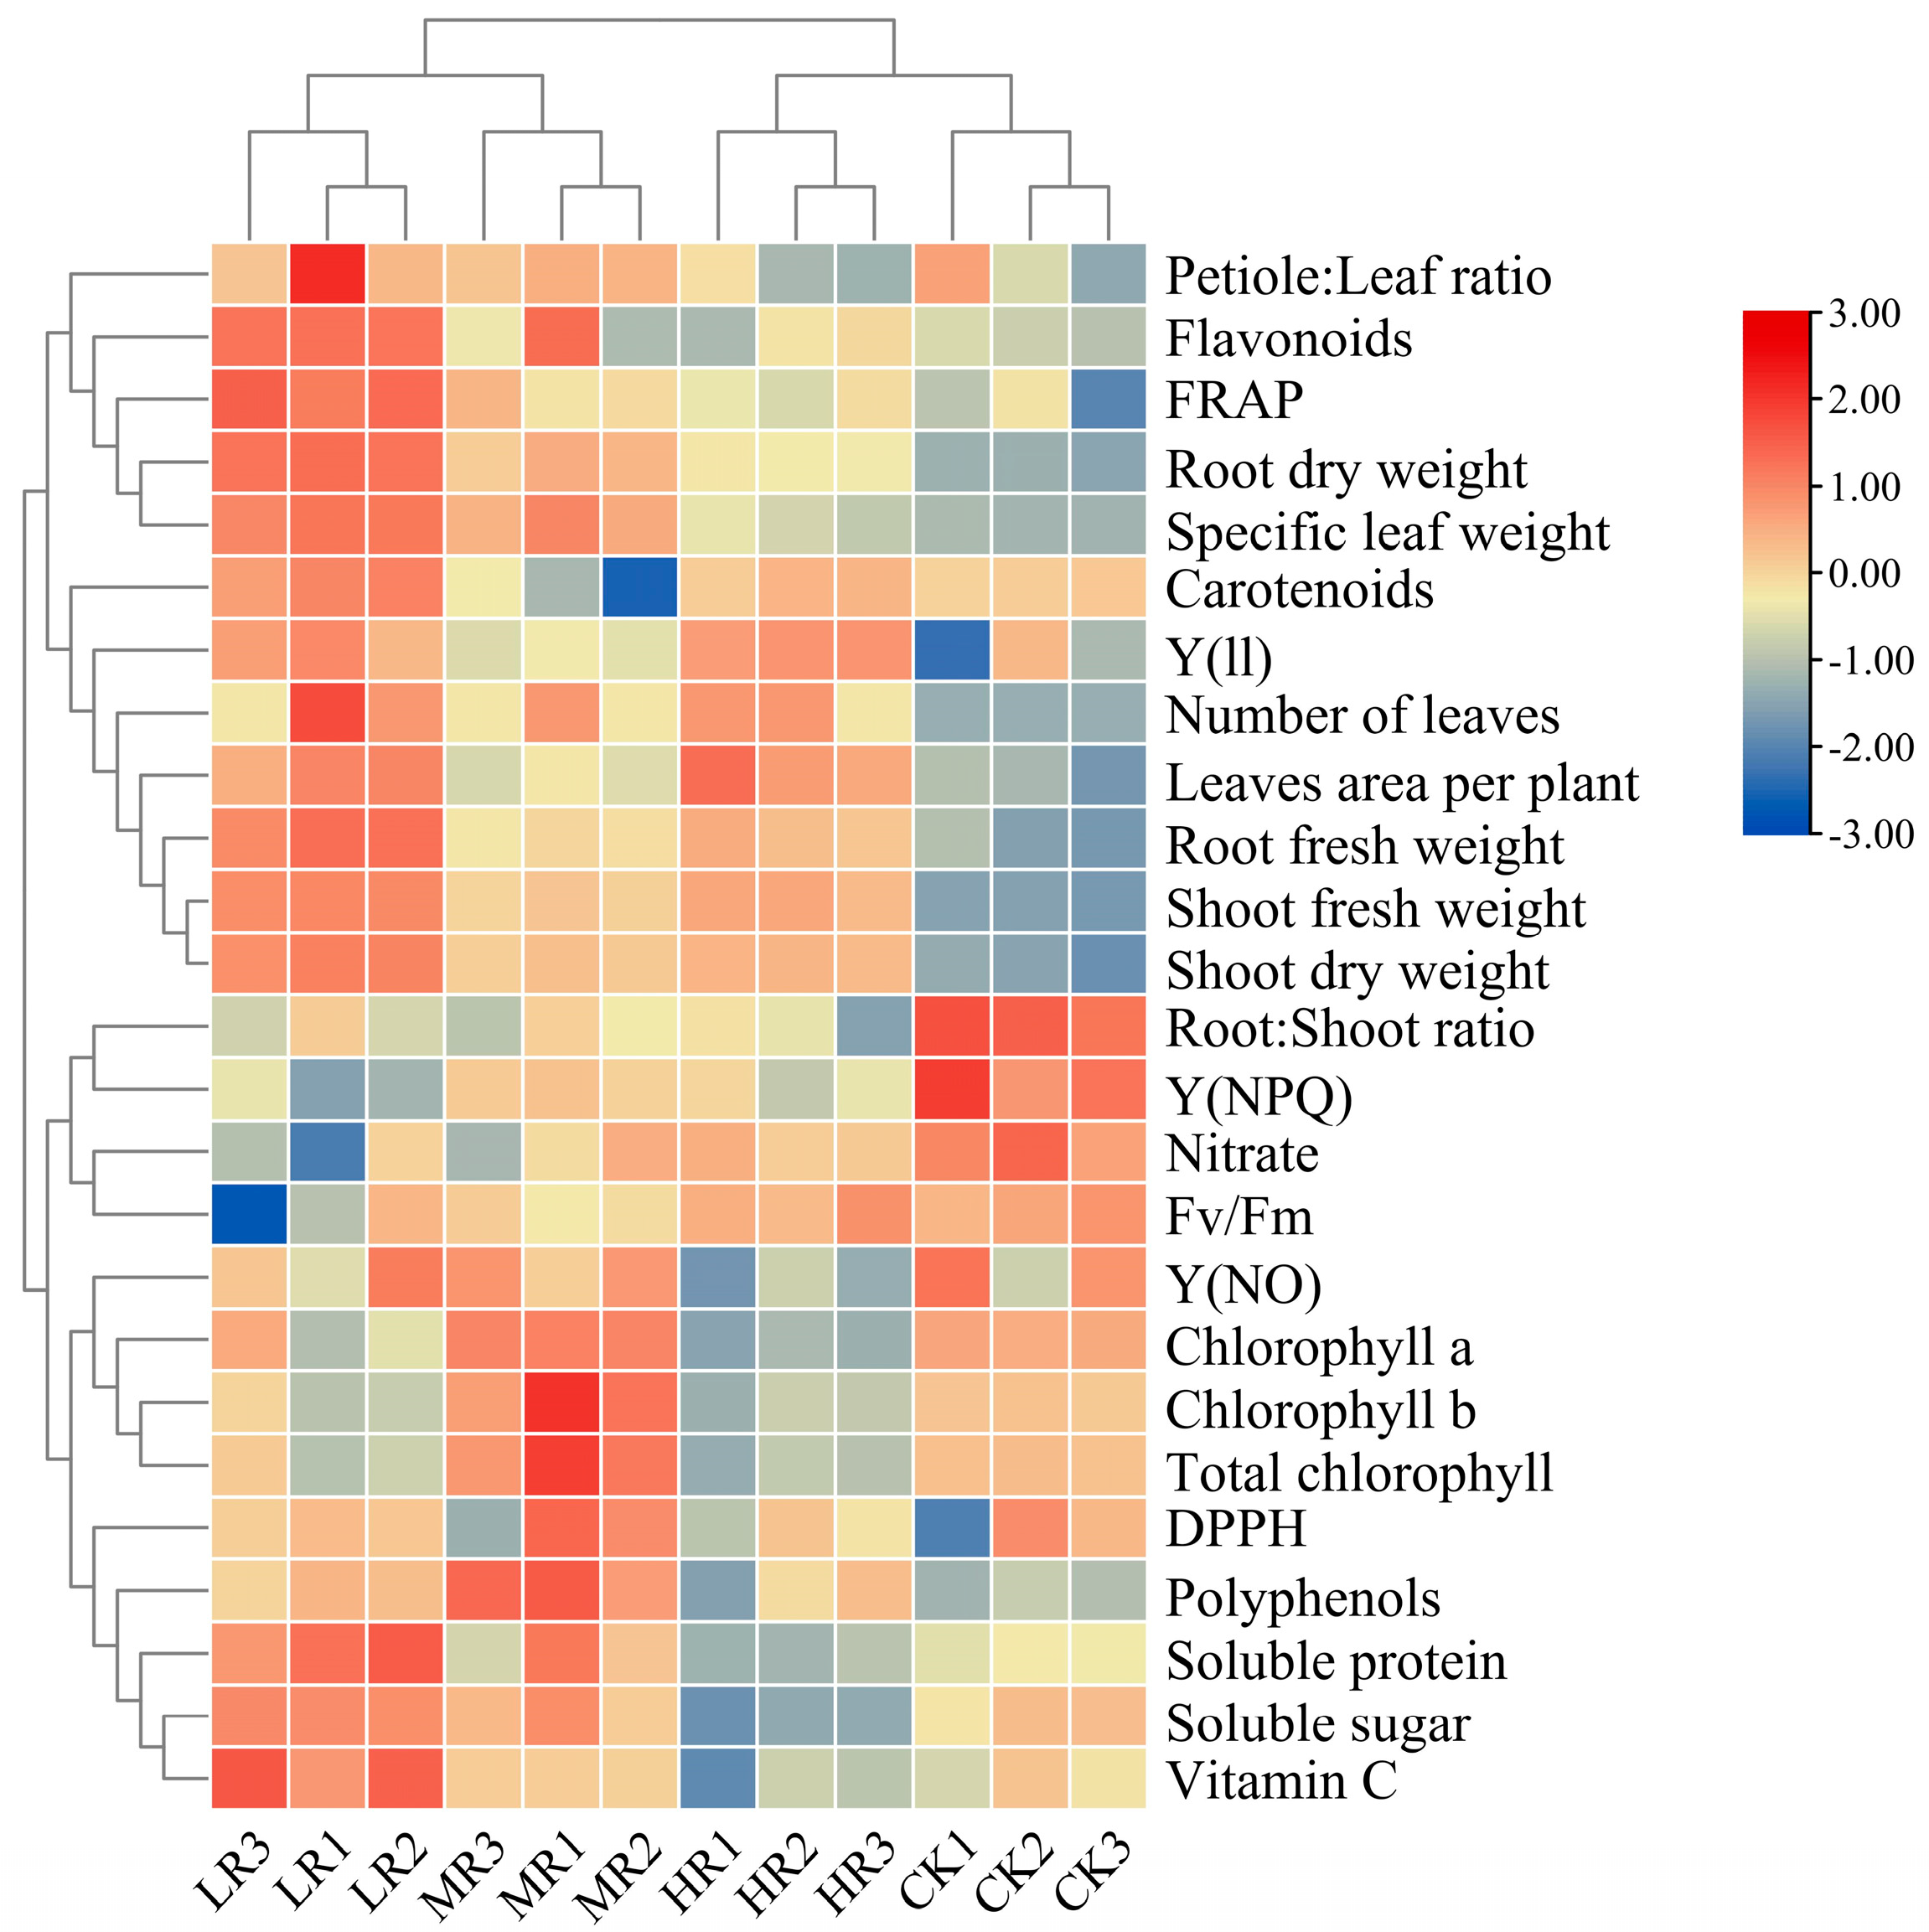
To gain an integrated view of treatment effects, a heatmap synthesizing the response of the growth and quality of pak choi under different radios of red and white light is presented (Figure 7).
The clusters showed that different ratios of red and white light have different effects on pak choi. Pak choi in CK revealed that root:shoot ratio, nitrate content, and Y(NPQ) were higher, but biomass accumulation and antioxidant content were lower. LR treatment promoted the accumulation of biomass and nutrition components. The contents of chlorophyll and polyphenol increased in MR treatment. In HR treatment, leaf area and Y(ll) increased while the contents of nutrition component and chlorophyll decreased.
Higher root dry weight, specific leaf weight, polyphenols, soluble protein, soluble sugar, and vitamin C were observed in LR and MR clusters. The HR cluster was separated from other clusters due to the lower content of polyphenols, soluble protein, soluble sugar, and vitamin C.

3.7. Multivariate Principal Component Analysis

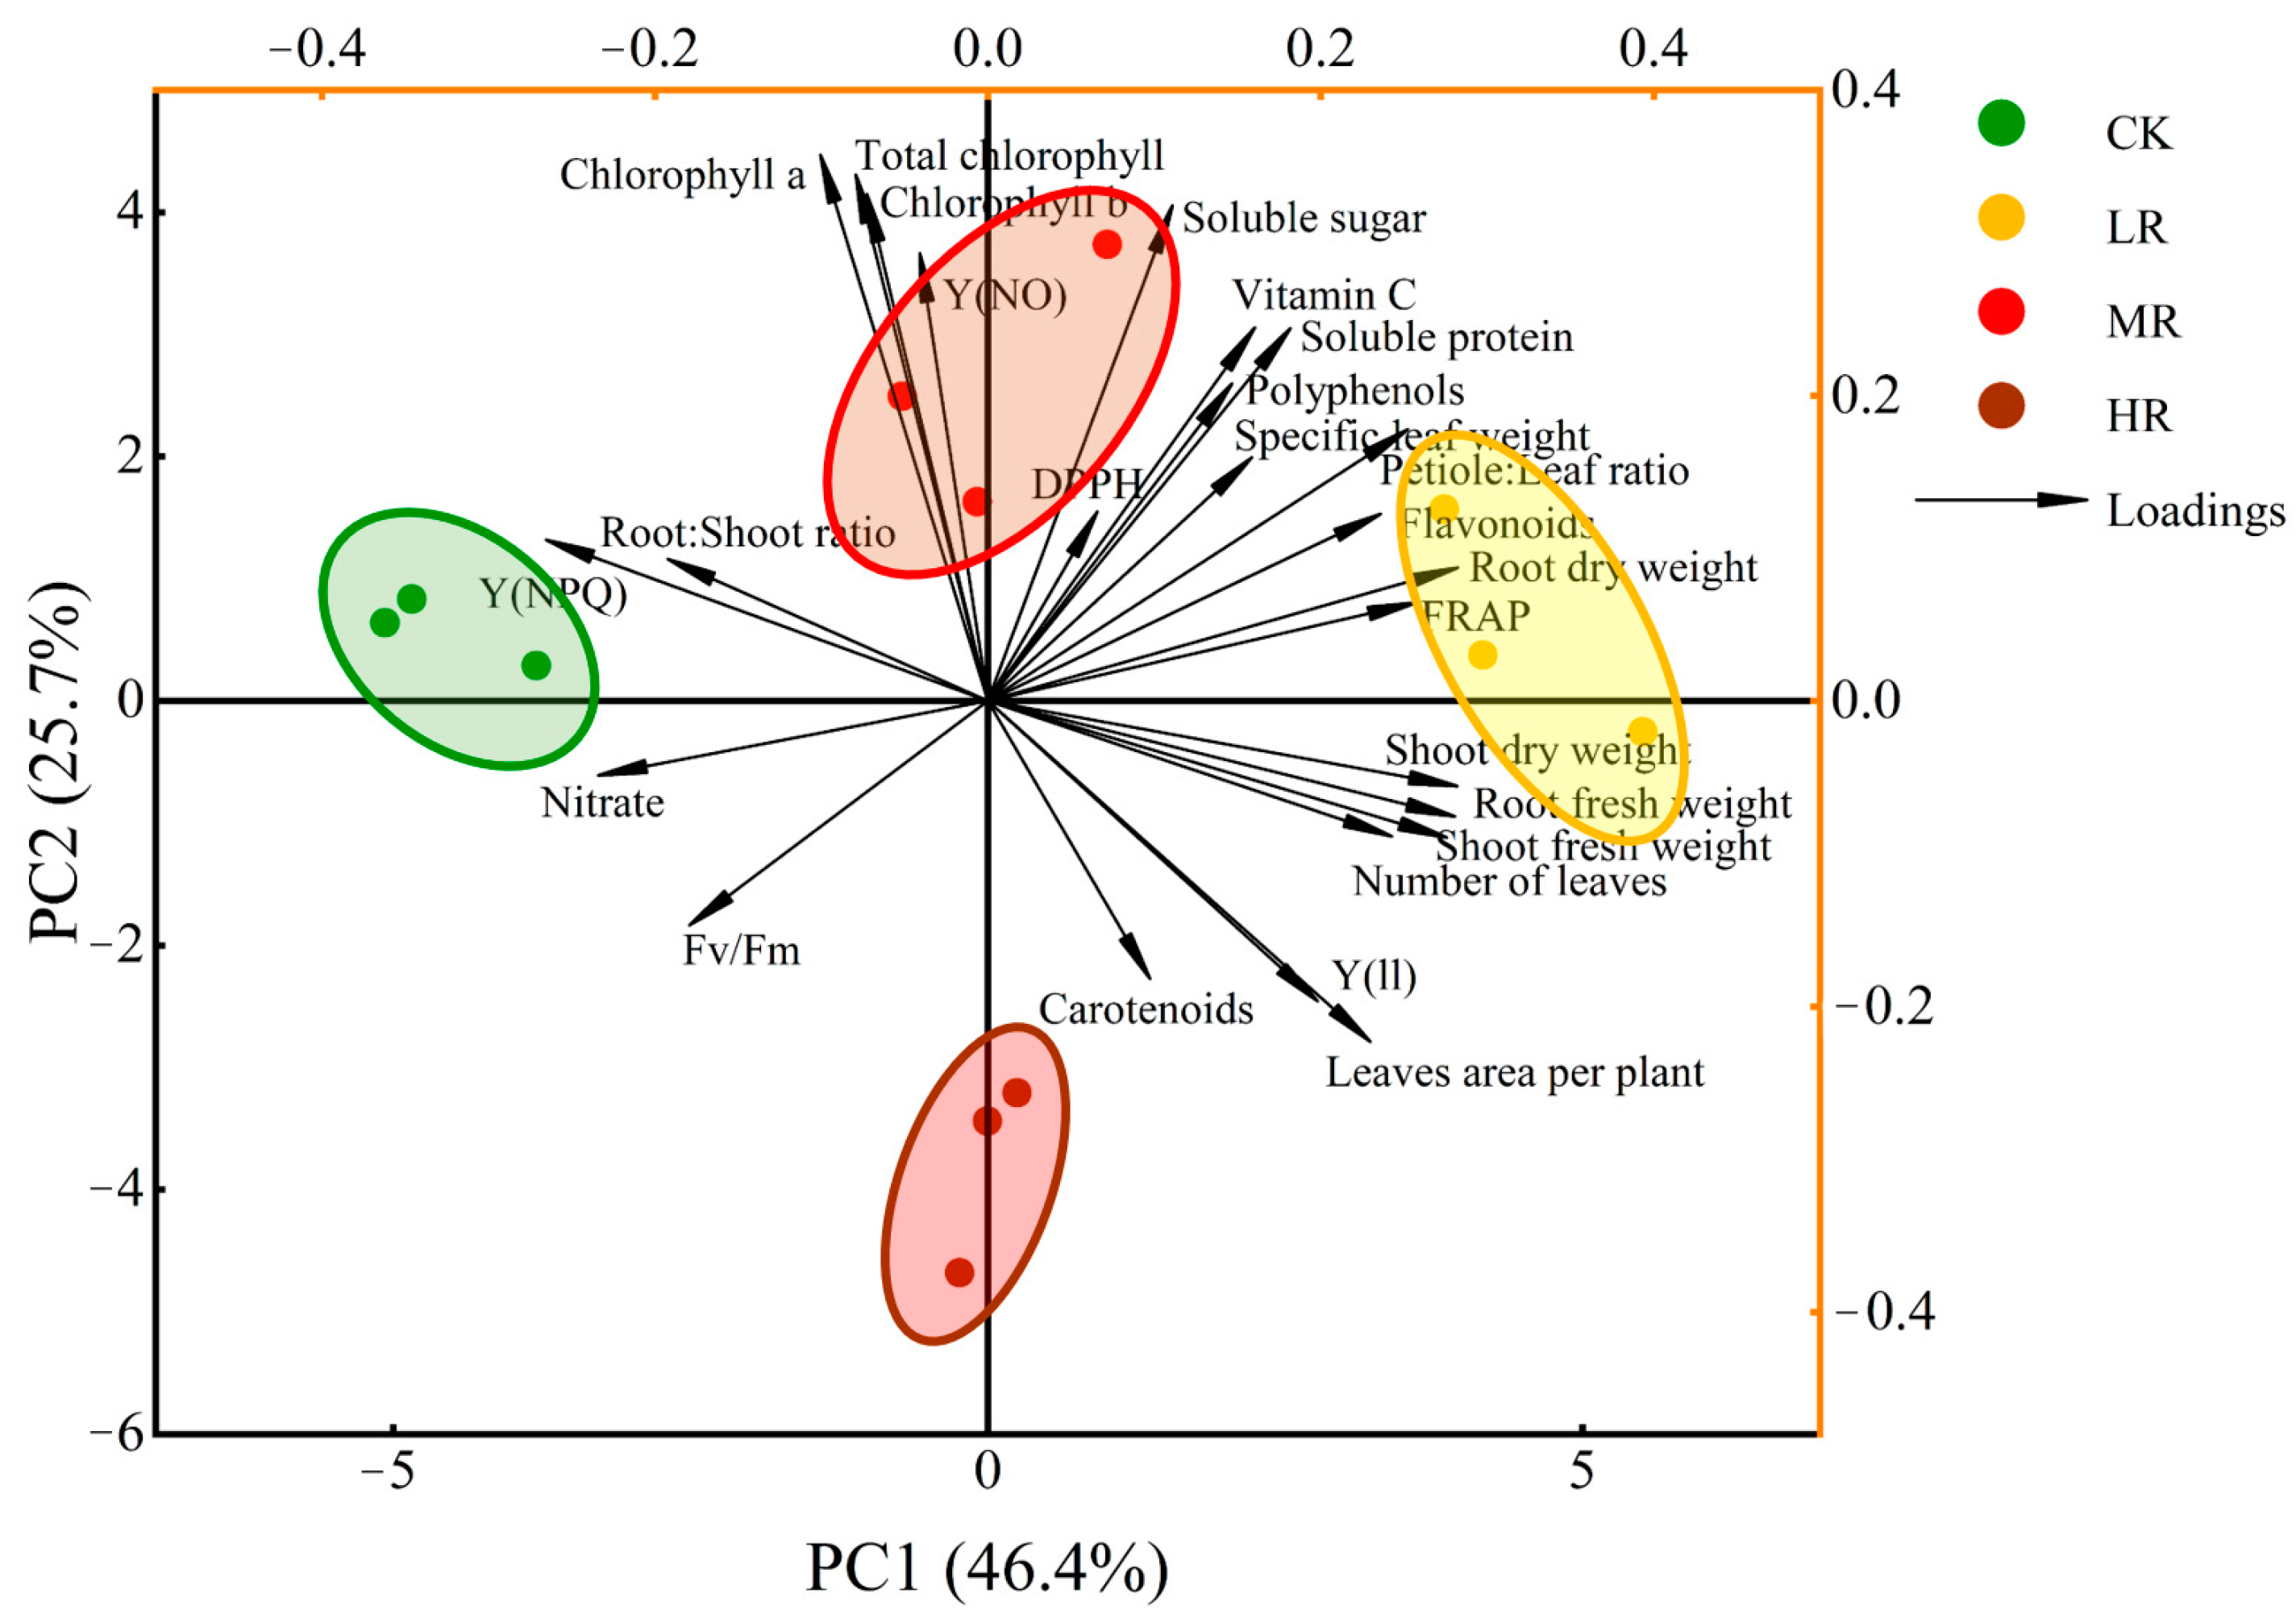
To compare the correlation of all parameters in pak choi responses to different ratios of red and white light, the principal component analysis (PCA) was performed (Table 3 and Figure 8). The first five principal components (F1–F5) were associated with eigen values > 1 and account for approximately 91.22% of the cumulative variance in pak choi, respectively (Table 3).
The first two factors (F1 and F2) of the PCA were presented in the scatterplot and correlation graph (Figure 8) and explained 72.14% of the total data variance of pak choi. The correlation arrow line illustrated the relationships among growth parameters, antioxidants, chlorophyll fluorescence, and nutrition components, by identifying the angle between two vectors (0° < positively correlated < 90°; uncorrelated: = 90°; 90° < negatively correlated < 180°).
CK treatment was more correlated with nitrate content, root:shoot ratio, Fv/Fm, and Y(NPQ), while LR treatment was more related to biomass accumulation, nutrition components, and antioxidant capacity. Chlorophyll content and Y(NO) were more associated with MR treatment, while carotenoid content was more correlated with HR treatment. PC1 was positively correlated with soluble sugars, DPPH, vitamin C, soluble protein, polyphenols, petiole:leaf ratio, specific leaf weight, flavonoids, root dry weight, and FRAP, and negatively correlated with nitrate and Fv/Fm. PC2 showed a negative correlation with shoot fresh weight, shoot dry weight, root fresh weight, leaf number, Y(ll), leaves area, and carotenoids, while it was positively correlated to Y(NO), chlorophyll a, chlorophyll b, total chlorophyll, root:shoot ratio and Y(NPQ).
Strong positive correlations were found among soluble sugar, DPPH, vitamin C, polyphenols, soluble protein, and petiole:leaf ratio in pak choi. Y(NO) showed strong positive correlations with chlorophyll a, chlorophyll b, and total chlorophyll, while leaf number also expressed strong positive correlations with shoot fresh weight, shoot dry weight, and root fresh weight.

4. Discussion

4.1. Different Red and White Light Ratios Affected Growth of Pak Choi

Red light affected phytochromes and regulated plant growth and photosynthesis, thereby influencing plant development [35]. Compared to white light, the fresh weight and dry weight of cabbage shoot remarkably increased 14% and 7% under red light, and notably increased 103% and 23% under R:B = 6, respectively [36]. The shoot fresh weight and root:shoot ratio of lettuce in treatment of R:B = 3 increased 12% and 26%, respectively, compared to R:B = 1 and 0.33 treatments [37]. The fresh weight of pak choi grown under the supplemental blue light (25% of the sunlight intensity) was 28% lower than the sunlight treatment [38]. Green light could penetrate the inner leaves of plants, thus stimulated photosynthesis in deeper chlorophyll layers and increased biomass accumulation [19]. Irradiation of cabbage with green light promoted photosynthetic pigment synthesis in the deeper leaves [39], which might enhance photosynthesis capacity and biomass accumulation. The biomass accumulation of pak choi (cv. Xiazhijiao) under R:B = 0.9 and R:G = 0.51 treatment was higher than R:B = 1.77, 2.69, and 4.02, while R:G = 0.77, 1.53, and 1.66, respectively [40]. In this study, the higher biomass of pak choi was found in LR treatment (R:B = 2.4, R:G = 1.47). Therefore, the suitable R:B and R:G ratios for pak choi biomass accumulation were species-specific.
In red leaf lettuce, leaf area decreased 28%, while specific leaf weight increased 29% under R:B = 2.3 than R:B = 4 [41]. Okra grown under blue light showed a significant increase in leaf area and a remarkable decrease in leaf number [42]. In this study, the leaf number and total leaf area of pak choi in LR, MR, and HR treatments significantly increased. Increasing the R:B ratios might result in a change in total leaf area leading to a higher specific leaf weight, which was reduced by excessive R:B ratios.

4.2. Different Red and White Light Ratios Affected Photosynthetic Capacity of Pak Choi

Fv/Fm reflects the maximum quantum efficiency of photosystem II (PSII), and the status of plant health and phytotoxicity as well. Previous studies have shown that in red and blue lighting conditions, increasing the proportion of red light decreased Fv/Fm of lettuce [43,44]. A significant reduction in Fv/Fm values was found in the LR treatment, but a similar phenomenon was not observed in treatments with a higher proportion of red light (MR, HR). The parameters of biomass accumulation and specific leaf weight indicated a negative correlation to Fv/Fm (angle > 90°) (Figure 8), and it might be due to the larger biomass and specific leaf weight of pak choi in LR treatment.
The light energy absorbed by chlorophyll has three destinations: Y(ll) for the energy that drives photosynthesis, Y(NO) for the energy dissipated as fluorescence, and Y(NPQ) for the energy dissipated as heat. These three destinations compete with each other. Under red light conditions, increased Y(NO) was accompanied by a notably decreased Y(NPQ), indicating a decrease in photoprotective capacity in spinach. This phenomenon was alleviated with the addition of green light. The addition of green light to red light remarkably increased Y(ll) in spinach [21], indicating that plants could utilize radiant energy more efficiently with green light. In LR treatment, Y(ll) was significantly higher while Y(NPQ) was remarkably lower. Y(NPQ) was significantly reduced in MR treatment, and both Y(NO) and Y(NPQ) notably decreased, while Y(ll) significantly increased in HR treatment. These results demonstrated that LR, MR, and HR treatments had a reduced photoprotective capacity, while LR and HR treatments were effective in converting light energy into chemical energy. The PCA plot (Figure 8) revealed that Y(ll) was highly positively correlated with the total leaves area, the larger area exposed to light might stimulate the photosynthetic light utilization. Meanwhile, Y(NO) was found to be highly positively correlated with chlorophyll content, the plant might need more photosynthetic pigments to cope with light intensity.
Blue light might affect plant photosynthetic pigment content to a greater extent than red light [36,45]. A high proportion of red light reduced the chlorophyll content of cucumber and tomato, thus negatively affecting photosynthetic capacity [7,8]. Under red and blue lighting, the lower proportion of blue light reduced the photosynthetic rate, while the higher proportion of blue light reduced the leaf area thereby reducing the biomass of tomatoes [46]. The treatment of R:B = 6 increased photosynthetic pigment accumulation, while monochromatic red light reduced photosynthetic pigment accumulation in pak choi [36]. Total chlorophyll content of tomato cv. ‘Microtom’ was significantly higher in the treatment with R:G = 0.38 than R:G = 1.31 [20]. In this study, chlorophyll content was significantly reduced under HR treatment (R:B = 7.4, R:G = 4.5).

4.3. Different Red and White Light Ratios Affected Nutrition of Pak Choi

Soluble sugar is one of the direct products of photosynthesis. Lettuce grown in R:B = 5 treatment significantly increased soluble sugar content compared to the R:B = 3, 1, 0.3, and 0.2 treatments [43]. There was a remarkable decrease in soluble sugar content in pak choi under increasing blue light proportion treatments compared to sunlight treatment [38]. Nitrate is a common source of nitrogen for higher plants and is taken up by the plant through the plasma membrane. The energy for the uptake of nitrate is dependent on ATP produced by respiration pathways. As the proportion of red light increased, nitrate reductase activity increased [10] and these need more carbohydrates to meet the energy requirements for nitrate reduction. In this study, the content of soluble sugar was higher, while nitrate content was lower in LR treatment (R:B = 2.4). As the R:B ratios increased, the soluble sugar content showed a decreasing trend, with a corresponding increase in nitrate content.
Blue light promotes mitochondrial respiration and primary nitrogen metabolizing enzyme activity, providing a rich source of nitrogen and carbon skeleton for protein synthesis [47]. Compared to monochromatic light treatments, the soluble protein content of cabbage increased in treatment of R:B = 6 [36]. This study found the soluble protein content was higher in LR treatment (R:B = 2.4). The CK treatment had a negative effect on protein synthesis, possibly because that low R:B light ratios reduced Y(ll), resulting in lower energy supply for protein synthesis. Soluble protein content in pak choi was positively correlated with soluble sugar content (angle < 90°) (Figure 8). The lower soluble sugar content in high ratios of R:B treatments (MR, HR) might result in insufficient energy produced by respiration, ultimately resulted in significantly lower soluble protein content than LR.
The increased blue light proportion under daylight significantly increased the VC content in pak choi [38]. Lettuce had higher VC content in R:B = 0.33 than R:B = 1 and 3 treatments, and this might be that blue light up-regulated the expression of APX, MDHAR, DHAR, and GR involved in VC regeneration [37]. In this study, VC content of pak choi increased in LR treatment (R:B = 2.4), and was significantly higher than CK.

4.4. Different Red and White Light Ratios Affected Antioxidant Content and Activity of Pak Choi

With the reduction in R:B ratios, the content of antioxidants in plants increased, such as phenolics in pak choi [38], flavonols in basil, lettuce, and rocket [48], and both phenolics and flavonoids in red leaf lettuce [49], probably because that the biosynthetic pathways of phenolics and flavonoids are derived from phenylpropanoid biosynthesis. Blue light could regulate the expression of key enzymes in this pathway such as PAL, F3H, CHS, and GST [50,51], but a higher proportion of blue light might not be suitable for the synthesis of antioxidant substances. In this study, a notable promotion in phenolic content was found in both LR and MR treatments, while the highest flavonoid content was observed in LR treatment. The ratios of R:B = 2.4 (LR) was a suitable light treatment to simultaneously increase the contents of polyphenol and flavonoid in pak choi.
FRAP was commonly used to evaluate the total antioxidant capacity of plants and showed a high correlation with polyphenols, flavonoids, and VC contents (angle < 90°) (Figure 8). This meant that the different red and white light ratio treatments affected the contents of polyphenols, flavonoids, and VC, then affected the antioxidant capacity and FRAP. FRAP in LR treatment was significantly higher than the other treatments, indicating that R:B = 2.4, while R:W = 1:2 maximized the antioxidant capacity of pak choi.

4.5. Different Red and White Light Ratios Affected Glucosinolate Content of Pak Choi

GSLs are commonly found in Brassica and partly responsible for the distinctive taste of Brassica vegetables [52]. GSLs could help restore plant cell damage and beneficial to human health, with their metabolites having cancer-preventive and anti-inflammatory effects [53,54,55]. Light quality greatly affected the GSLs content in Brassica [56]. The addition of blue light at intensities of 50, 100, and 150 μmol·m−2·s−1 enhanced the total GSL content in green leafy pak choi by 11%, 17%, and 10%, respectively [38]. The aliphatic GSL content of broccoli sprouts grown under blue light was significantly increased 26% compared to the treatment with R:B = 7.3 [57].
Both monochromatic red and green light significantly increased the content of indolic GSL in Cardamine fauriei [58]. The total GSL content of kale promoted significantly when the proportion of blue light reduced and the proportion of red light increased accordingly [59], and R:B = 8 treatment enhanced the total GSL content of kale more than the R:B = 2 treatment [60]. In this study, higher blue light treatment (LR) increased the contents of PRO, RAA, SIN, 4OH, 4ME, and NEO, and a high proportion of red light (HR) remarkably increased the content of three GSLs (PRO, 4OH, NEO). In terms of total GSL, HR treatment significantly increased the indolic GSL content of pak choi. Increasing the proportion of blue light increased the indolic GSL content but increasing the proportion of red light could increase the indolic GSL content more. Therefore, different R:B light ratios affected the total GSL content of pak choi by regulating the indolic GSL content, and higher ratios of red light are more effective. Due to the negative effects of a higher proportion of red light on pak choi growth, it is necessary to find the suitable red and white light ratios for the growth and accumulation of GSLs in pak choi.

5. Conclusions

In this study, the red and white light improved the photosynthetic capacity and hence the biomass and quality of pak choi, and pak choi under LR treatment had greater biomass and higher nutrition. Therefore, red:white ratios of 1:2 was suitable for the high-quality pak choi production than other red:white ratios in artificial lighting plant factory.

Author Contributions

Conceptualization, methodology, validation, formal analysis, data curation, writing-original draft, X.H.; methodology, writing-review and editing, R.H.; methodology, Validation, Y.L., K.L. and J.T.; formal analysis, Y.C.; visualization, X.L.; conceptualization, methodology, resources, supervision, project administration, funding acquisition, H.L. All authors have read and agreed to the published version of the manuscript.

Funding

This work was supported by the National Key Research and Development of China (2021YFD2000701) and Key Research and Development Program of Guangdong (2019B020214005).

Institutional Review Board Statement

Not applicable.

Informed Consent Statement

Not applicable.

Data Availability Statement

Not applicable.

Conflicts of Interest

The authors declare that they have no known competing financial interests or personal relationships that could have appeared to influence the work reported in this paper.

References

  1. McCree, K.J. The action spectrum, absorptance and quantum yield of photosynthesis in crop plants. Agric. Meteorol. 1971, 9, 191–216. [Google Scholar] [CrossRef]
  2. Lin, K.-H.; Huang, M.-Y.; Huang, W.-D.; Hsu, M.-H.; Yang, Z.-W.; Yang, C.-M. The effects of red, blue, and white light-emitting diodes on the growth, development, and edible quality of hydroponically grown lettuce (Lactuca sativa L. var. capitata). Sci. Hortic.-Amst. 2013, 150, 86–91. [Google Scholar] [CrossRef]
  3. Wang, X.Y.; Xu, X.M.; Cui, J. The importance of blue light for leaf area expansion, development of photosynthetic apparatus, and chloroplast ultrastructure of Cucumis sativus grown under weak light. Photosynthetica 2015, 53, 213–222. [Google Scholar] [CrossRef]
  4. Muneer, S.; Kim, E.J.; Park, J.S.; Lee, J.H. Influence of green, red and blue light emitting diodes on multiprotein complex proteins and photosynthetic activity under different light intensities in lettuce leaves (Lactuca sativa L.). Int. J. Mol. Sci. 2014, 15, 4657–4670. [Google Scholar] [CrossRef] [PubMed]
  5. Li, H.; Tang, C.; Xu, Z.; Liu, X.; Han, X. Effects of different light sources on the growth of non-heading Chinese cabbage (Brassica campestris L.). J. Agric. Sci.-Camb. 2012, 4, 262. [Google Scholar] [CrossRef]
  6. Ouzounis, T.; Heuvelink, E.; Ji, Y.; Schouten, H.J.; Visser, R.G.F.; Marcelis, L.F.M. Blue and red LED lighting effects on plant biomass, stomatal conductance, and metabolite content in nine tomato genotypes. In Proceedings of the VIII International Symposium on Light in Horticulture, East Lansing, MI, USA, 22–26 May 2016; Volume 1134, pp. 251–258. [Google Scholar]
  7. Trouwborst, G.; Hogewoning, S.W.; van Kooten, O.; Harbinson, J.; van Ieperen, W. Plasticity of photosynthesis after the ‘red light syndrome’ in cucumber. Environ. Exp. Bot. 2016, 121, 75–82. [Google Scholar] [CrossRef]
  8. Zhang, Y.; Kaiser, E.; Zhang, Y.; Yang, Q.; Li, T. Red/blue light ratio strongly affects steady-state photosynthesis, but hardly affects photosynthetic induction in tomato (Solanum lycopersicum). Physiol. Plant. 2019, 167, 144–158. [Google Scholar] [CrossRef]
  9. Son, K.-H.; Park, J.-H.; Kim, D.; Oh, M.-M. Leaf shape index, growth, and phytochemicals in two leaf lettuce cultivars grown under monochromatic light-emitting diodes. Hortic. Sci. Technol. 2012, 30, 664–672. [Google Scholar]
  10. Signore, A.; Bell, L.; Santamaria, P.; Wagstaff, C.; Van Labeke, M.-C. Red light is effective in reducing nitrate concentration in rocket by increasing nitrate reductase activity, and contributes to increased total glucosinolates content. Front. Plant. Sci. 2020, 11, 604. [Google Scholar] [CrossRef]
  11. Hogewoning, S.W.; Trouwborst, G.; Maljaars, H.; Poorter, H.; van Ieperen, W.; Harbinson, J. Blue light dose–responses of leaf photosynthesis, morphology, and chemical composition of Cucumis sativus grown under different combinations of red and blue light. J. Exp. Bot. 2010, 61, 3107–3117. [Google Scholar] [CrossRef]
  12. Ma, G.; Zhang, L.; Kato, M.; Yamawaki, K.; Kiriiwa, Y.; Yahata, M.; Ikoma, Y.; Matsumoto, H. Effect of blue and red LED light irradiation on β-cryptoxanthin accumulation in the flavedo of citrus fruits. J. Agric. Food Chem. 2012, 60, 197–201. [Google Scholar] [CrossRef]
  13. Li, Q.; Kubota, C. Effects of supplemental light quality on growth and phytochemicals of baby leaf lettuce. Environ. Exp. Bot. 2009, 67, 59–64. [Google Scholar] [CrossRef]
  14. Ren, J.; Guo, S.; Xu, C.; Yang, C.; Ai, W.; Tang, Y.; Qin, L. Effects of different carbon dioxide and LED lighting levels on the anti-oxidative capabilities of Gynura bicolor DC. Adv. Space Res. 2014, 53, 353–361. [Google Scholar] [CrossRef]
  15. Yorio, N.C.; Goins, G.D.; Kagie, H.R.; Wheeler, R.M.; Sager, J.C. Improving spinach, radish, and lettuce growth under red light-emitting diodes (LEDs) with blue light supplementation. HortScience 2001, 36, 380–383. [Google Scholar] [CrossRef] [PubMed]
  16. Folta, K.M.; Maruhnich, S.A. Green light: A signal to slow down or stop. J. Exp. Bot. 2007, 58, 3099–3111. [Google Scholar] [CrossRef] [PubMed]
  17. Paradiso, R.; Proietti, S. Light-quality manipulation to control plant growth and photomorphogenesis in greenhouse horticulture: The state of the art and the opportunities of modern LED systems. J. Plant. Growth Regul. 2021, 41, 742–780. [Google Scholar] [CrossRef]
  18. Johkan, M.; Shoji, K.; Goto, F.; Hahida, S.N.; Yoshihara, T. Effect of green light wavelength and intensity on photomorphogenesis and photosynthesis in Lactuca sativa. Environ. Exp. Bot. 2012, 75, 128–133. [Google Scholar] [CrossRef]
  19. Smith, H.L.; McAusland, L.; Murchie, E.H. Don’t ignore the green light: Exploring diverse roles in plant processes. J. Exp. Bot. 2017, 68, 2099–2110. [Google Scholar] [CrossRef]
  20. Vitale, E.; Velikova, V.; Tsonev, T.; Costanzo, G.; Paradiso, R.; Arena, C. Manipulation of light quality is an effective tool to regulate photosynthetic capacity and fruit antioxidant properties of Solanum lycopersicum L. cv. ‘Microtom’ in a controlled environment. PeerJ 2022, 10, e13677. [Google Scholar] [CrossRef]
  21. Vitale, L.; Vitale, E.; Guercia, G.; Turano, M.; Arena, C.J.P. Effects of different light quality and biofertilizers on structural and physiological traits of spinach plants. Photosynthetica 2020, 58, 932–943. [Google Scholar] [CrossRef]
  22. Mao, P.; Duan, F.; Zheng, Y.; Yang, Q. Blue and UV-A light wavelengths positively affected accumulation profiles of healthy compounds in pak-choi. J. Sci. Food Agric. 2021, 101, 1676–1684. [Google Scholar] [CrossRef] [PubMed]
  23. Kumar, U.; Kaviraj, M.; Rout, S.; Chakraborty, K.; Swain, P.; Nayak, P.K.; Nayak, A.K. Combined application of ascorbic acid and endophytic N-fixing Azotobacter chroococcum Avi2 modulates photosynthetic efficacy, antioxidants and growth-promotion in rice under moisture deficit stress. Microbiol. Res. 2021, 250, 126808. [Google Scholar] [CrossRef] [PubMed]
  24. Gratani, L. A non-destructive method to determine chlorophyll content of leaves. Photosynthetica 1993, 26, 469–473. [Google Scholar]
  25. Kohyama, K.; Nishinari, K. Effect of soluble sugars on gelatinization and retrogradation of sweet potato starch. J. Agric. Food Chem. 1991, 39, 1406–1410. [Google Scholar] [CrossRef]
  26. Cataldo, D.; Maroon, M.; Schrader, L.E.; Youngs, V.L. Rapid colorimetric determination of nitrate in plant tissue by nitration of salicylic acid. Commun. Soil Sci. Plant Anal. 1975, 6, 71–80. [Google Scholar] [CrossRef]
  27. Blakesley, R.W.; Boezi, J.A. A new staining technique for proteins in polyacrylamide gels using Coomassie Brilliant Blue G250. Anal. Biochem. 1977, 82, 580–582. [Google Scholar] [CrossRef]
  28. Chen, G.; Mo, L.; Li, S.; Zhou, W.; Wang, H.; Liu, J.; Yang, C. Separation and determination of reduced vitamin C in polymerized hemoglobin-based oxygen carriers of the human placenta. Artif. Cell Nanomed. B 2015, 43, 152–156. [Google Scholar] [CrossRef]
  29. Singleton, V.L.; Orthofer, R.; Lamuela-Raventós, R.M. Analysis of total phenols and other oxidation substrates and antioxidants by means of folin-ciocalteu reagent. In Methods in Enzymology; Elsevier: Amsterdam, The Netherlands, 1999; Volume 299, pp. 152–178. [Google Scholar]
  30. Xie, Y.; Zheng, Y.; Dai, X.; Wang, Q.; Cao, J.; Xiao, J. Seasonal dynamics of total flavonoid contents and antioxidant activity of Dryopteris erythrosora. Food Chem. 2015, 186, 113–118. [Google Scholar] [CrossRef]
  31. Benzie, I.F.; Strain, J.J. The ferric reducing ability of plasma (FRAP) as a measure of “antioxidant power”: The FRAP assay. Anal. Biochem. 1996, 239, 70–76. [Google Scholar] [CrossRef]
  32. Tadolini, B.; Juliano, C.; Piu, L.; Franconi, F.; Cabrini, L. Resveratrol inhibition of lipid peroxidation. Free Radic. Res. 2000, 33, 105–114. [Google Scholar] [CrossRef]
  33. Liu, K.; Gao, M.; Jiang, H.; Ou, S.; Li, X.; He, R.; Li, Y.; Liu, H.J.M. Light Intensity and Photoperiod Affect Growth and Nutritional Quality of Brassica Microgreens. Molecules 2022, 27, 883. [Google Scholar] [CrossRef] [PubMed]
  34. Chen, C.; Chen, H.; He, Y.; Xia, R. TBtools, a toolkit for biologists integrating various biological data handling tools with a user-friendly interface. BioRxiv 2018, 289660. [Google Scholar] [CrossRef]
  35. Quian-Ulloa, R.; Stange, C. Carotenoid biosynthesis and plastid development in plants: The role of light. Int. J. Mol. Sci. 2021, 22, 1184. [Google Scholar] [CrossRef] [PubMed]
  36. Fan, X.; Zang, J.; Xu, Z.; Guo, S.; Jiao, X.; Liu, X.; Gao, Y. Effects of different light quality on growth, chlorophyll concentration and chlorophyll biosynthesis precursors of non-heading Chinese cabbage (Brassica campestris L.). Acta Physiol. Plant. 2013, 35, 2721–2726. [Google Scholar] [CrossRef]
  37. Zha, L.; Liu, W.; Yang, Q.; Zhang, Y.; Zhou, C.; Shao, M. Regulation of ascorbate accumulation and metabolism in lettuce by the red: Blue ratio of continuous light using LEDs. Front. Plant Sci. 2020, 11, 704. [Google Scholar] [CrossRef]
  38. Zheng, Y.-J.; Zhang, Y.-T.; Liu, H.-C.; Li, Y.-M.; Liu, Y.-L.; Hao, Y.-W.; Lei, B.-F. Supplemental blue light increases growth and quality of greenhouse pak choi depending on cultivar and supplemental light intensity. J. Integr. Agric. 2018, 17, 2245–2256. [Google Scholar] [CrossRef]
  39. Amagai, Y.; Lu, N.; Hayashi, E.; Takagaki, M.; Kikuchi, M.; Ibaraki, Y.; Kozai, T. External green light as a new tool to change colors and nutritional components of inner leaves of head cabbages. J. Food Meas. Charact. 2022, 16, 269–280. [Google Scholar] [CrossRef]
  40. Li, Y.; Liu, N.; Ji, F.; He, D. Optimal red: Blue ratio of full spectrum LEDs for hydroponic pakchoi cultivation in plant factory. Int. J. Agric. Biol. Eng. 2022, 15, 72–77. [Google Scholar]
  41. Samuolienė, G.; Viršilė, A.; Haimi, P.; Miliauskienė, J. Photoresponse to different lighting strategies during red leaf lettuce growth. J. Photochem. Photobiol. B 2020, 202, 111726. [Google Scholar] [CrossRef]
  42. Degni, B.F.; Haba, C.T.; Dibi, W.G.; Soro, D.; Zoueu, J.T. Effect of light spectrum on growth, development, and mineral contents of okra (Abelmoschus esculentus L.). Open Agric. 2021, 6, 276–285. [Google Scholar] [CrossRef]
  43. Azad, M.O.K.; Kjaer, K.H.; Adnan, M.; Naznin, M.T.; Lim, J.D.; Sung, I.J.; Park, C.H.; Lim, Y.S. The evaluation of growth performance, photosynthetic capacity, and primary and secondary metabolite content of leaf lettuce grown under limited irradiation of blue and red LED light in an urban plant factory. Agriculture 2020, 10, 28. [Google Scholar] [CrossRef]
  44. Meng, Q.; Boldt, J.; Runkle, E.S. Blue radiation interacts with green radiation to influence growth and predominantly controls quality attributes of lettuce. J. Am. Soc. Hortic. Sci. 2020, 145, 75–87. [Google Scholar] [CrossRef]
  45. Johkan, M.; Shoji, K.; Goto, F.; Hashida, S.-N.; Yoshihara, T. Blue light-emitting diode light irradiation of seedlings improves seedling quality and growth after transplanting in red leaf lettuce. HortScience 2010, 45, 1809–1814. [Google Scholar] [CrossRef] [Green Version]
  46. Kaiser, E.; Ouzounis, T.; Giday, H.; Schipper, R.; Heuvelink, E.; Marcelis, L.F. Adding blue to red supplemental light increases biomass and yield of greenhouse-grown tomatoes, but only to an optimum. Front. Plant Sci 2019, 9, 2002. [Google Scholar] [CrossRef] [PubMed]
  47. Kowallik, W. Blue light effects on respiration. Plant Biol. 1982, 33, 51–72. [Google Scholar] [CrossRef]
  48. Matysiak, B.; Kowalski, A. White, blue and red LED lighting on growth, morphology and accumulation of flavonoid compounds in leafy greens. Zemdirbyste 2019, 106, 281–286. [Google Scholar] [CrossRef]
  49. Li, Y.; Wu, L.; Jiang, H.; He, R.; Song, S.; Su, W.; Liu, H. Supplementary Far-Red and Blue Lights Influence the Biomass and Phytochemical Profiles of Two Lettuce Cultivars in Plant Factory. Molecules 2021, 26, 7405. [Google Scholar] [CrossRef]
  50. Hong, G.-J.; Hu, W.-L.; Li, J.-X.; Chen, X.-Y.; Wang, L.-J. Increased accumulation of artemisinin and anthocyanins in Artemisia annua expressing the Arabidopsis blue light receptor CRY1. Plant Mol. Biol. Rep. 2009, 27, 334–341. [Google Scholar] [CrossRef]
  51. Zhang, Y.; Jiang, L.; Li, Y.; Chen, Q.; Ye, Y.; Zhang, Y.; Luo, Y.; Sun, B.; Wang, X.; Tang, H. Effect of red and blue light on anthocyanin accumulation and differential gene expression in strawberry (Fragaria × ananassa). Molecules 2018, 23, 820. [Google Scholar] [CrossRef]
  52. Cartea, M.E.; Velasco, P. Glucosinolates in Brassica foods: Bioavailability in food and significance for human health. Phytochem. Rev. 2008, 7, 213–229. [Google Scholar] [CrossRef]
  53. Hanschen, F.S.; Klopsch, R.; Oliviero, T.; Schreiner, M.; Verkerk, R.; Dekker, M. Optimizing isothiocyanate formation during enzymatic glucosinolate breakdown by adjusting pH value, temperature and dilution in Brassica vegetables and Arabidopsis thaliana. Sci. Rep.-UK 2017, 7, 40807. [Google Scholar] [CrossRef] [PubMed]
  54. Mickens, M.A.; Torralba, M.; Robinson, S.A.; Spencer, L.E.; Romeyn, M.W.; Massa, G.D.; Wheeler, R.M. Growth of red pak choi under red and blue, supplemented white, and artificial sunlight provided by LEDs. Sci. Hortic.-Amst. 2019, 245, 200–209. [Google Scholar] [CrossRef]
  55. Wiesner, M.; Zrenner, R.; Krumbein, A.; Glatt, H.; Schreiner, M. Genotypic variation of the glucosinolate profile in pak choi (Brassica rapa ssp. chinensis). J. Agric. Food Chem. 2013, 61, 1943–1953. [Google Scholar] [CrossRef] [PubMed]
  56. del Carmen Martínez-Ballesta, M.; Moreno, D.A.; Carvajal, M. The physiological importance of glucosinolates on plant response to abiotic stress in Brassica. Int. J. Mol. Sci. 2013, 14, 11607–11625. [Google Scholar] [CrossRef] [PubMed]
  57. Kopsell, D.A.; Sams, C.E. Increases in shoot tissue pigments, glucosinolates, and mineral elements in sprouting broccoli after exposure to short-duration blue light from light emitting diodes. J. Am. Soc. Hortic. Sci. 2013, 138, 31–37. [Google Scholar] [CrossRef]
  58. Abe, K.; Kido, S.; Maeda, T.; Kami, D.; Matsuura, H.; Shimura, H.; Suzuki, T. Glucosinolate profiles in Cardamine fauriei and effect of light quality on glucosinolate concentration. Sci. Hortic.-Amst. 2015, 189, 12–16. [Google Scholar] [CrossRef]
  59. Lee, G.-J.; Heo, J.-W.; Jung, C.-R.; Kim, H.-H.; Jo, J.-S.; Lee, J.-G.; Lee, G.-J.; Nam, S.-Y.; Hong, E.-Y. Effects of artificial light sources on growth and glucosinolate contents of hydroponically grown kale in plant factory. J. Bio-Environ. Control 2016, 25, 77–82. [Google Scholar] [CrossRef]
  60. Zhang, Y.; Ji, J.; Song, S.; Su, W.; Liu, H. Growth, nutritional quality and health-promoting compounds in Chinese Kale grown under different ratios of red: Blue LED lights. Agronomy 2020, 10, 1248. [Google Scholar] [CrossRef]
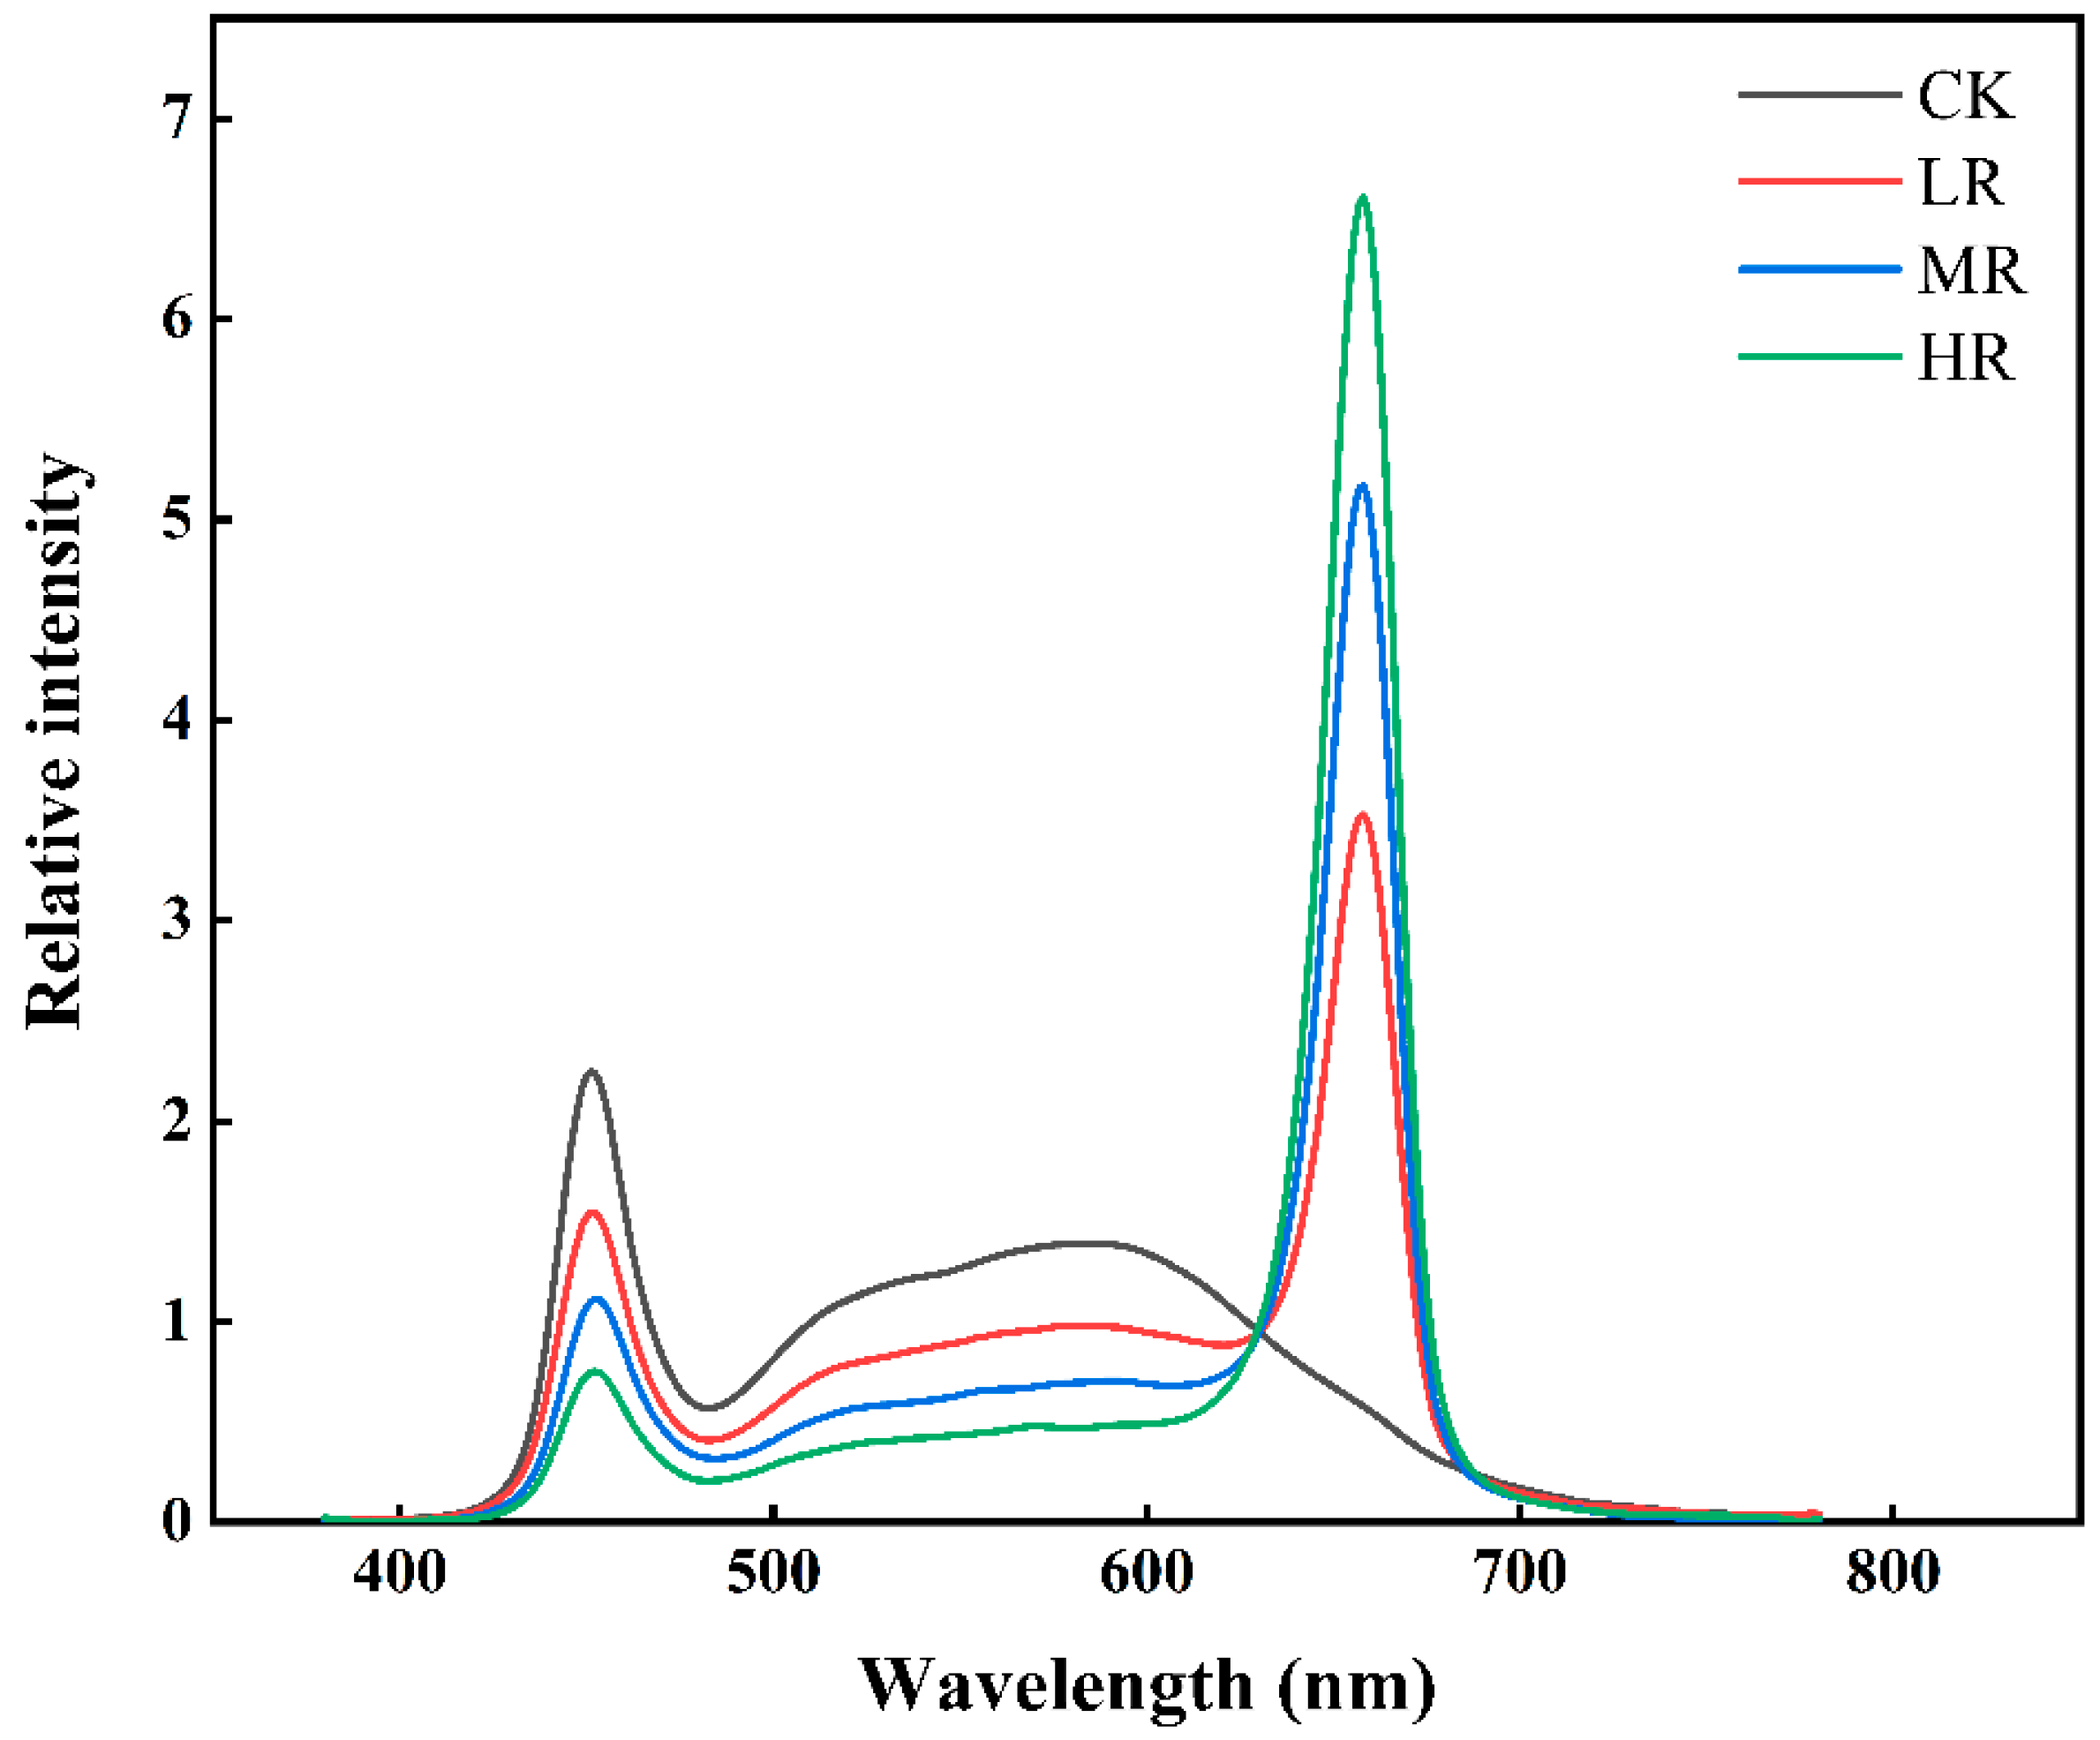
Figure 1. Photon flux density in the four treatments. The spectral distribution was measured by a spectrometer (ALP-01, Asensetek, Taiwan, China).
Agronomy 12 02322 g001
Figure 2. Pak choi morphology at 35 days after treatments. CK: only white light, LR: red:white = 1:2, MR = red:white = 1:1, LR = red:white = 2:1. The direction and color of the arrows indicate trends in the intensity of the different light qualities.
Agronomy 12 02322 g002
Figure 3. CK: only white light, LR: red:white = 1:2, MR = red:white = 1:1, LR = red:white = 2:1. Maximum photosynthetic efficiency (Fv/Fm) (A), photosynthetic efficiency (Y(ll)) (B), energy dissipated as fluorescence (Y(NPQ)) (C), energy dissipated as heat (Y(NO)) (D), and the content of Chl a (E), Chl b (F), Total Chl (G), and Carotenoids (H) of pak choi grown under different ratios of red and white light treatments. All values are expressed as mean ± standard error (n = 3). The letters marked in all figures indicate the significance of the difference (p ≤ 0.05, Duncan’s test).
Agronomy 12 02322 g003
Figure 4. CK: only white light, LR: red:white = 1:2, MR = red:white = 1:1, LR = red:white = 2:1. The contents of soluble sugar (A), nitrate (B), soluble protein (C), and vitamin C (VC) (D) of pak choi grown under the different ratios of red and white light treatments. All values are expressed as mean ± standard error (n = 3). The letters marked in all figures indicate the significance of the difference (p ≤ 0.05, Duncan’s test).
Agronomy 12 02322 g004
Figure 5. CK: only white light, LR: red:white = 1:2, MR = red:white = 1:1, LR = red:white = 2:1. DPPH (A), polyphenols content (B), FRAP (C), and flavonoid content (D) of pak choi grown under the different ratios of red and white light treatments. All values are expressed as mean ± standard error (n = 3). The letters marked in all figures indicate the significance of the difference (p ≤ 0.05, Duncan’s test).
Agronomy 12 02322 g005
Figure 6. CK: only white light, LR: red:white = 1:2, MR= red:white = 1:1, LR = red:white = 2:1. The contents of eight different GSLs (A,B) and different sorts of GSL content (C) of pak choi grown under the different ratios of red and white light treatments. The specific aliphatic GSL species are as follows: progoitrin (PRO); gluconapin (NAP); glucoraphanin (RAA); sinigrin (SIN), and specific indolic GSL species are as follows: 4-methoxyglucobrassicin (4ME); neoglucobrassicin (NEO); 4-hydroxygiucobrassicin (4OH); glucobrassicin (GBC). All values are expressed as mean ± standard error (n = 3). The letters marked in all figures indicate the significance of the difference (p ≤ 0.05, Duncan’s test).
Agronomy 12 02322 g006
Figure 7. CK: only white light, LR: red:white = 1:2, MR = red:white = 1:1, LR = red:white = 2:1. Cluster heat map analysis of pak choi grown under the different ratios of red and white light treatments. Results are visualized using a false-color scale, with blue indicating a decrease and red indicating an increase in the response parameters.
Agronomy 12 02322 g007
Figure 8. CK: only white light, LR: red:white = 1:2, MR = red:white = 1:1, LR = red:white = 2:1. Principal component analysis of pak choi grown under the different ratios of red and white light treatments.
Agronomy 12 02322 g008
Table 1. Lighting parameters of treatments.
ParametersLighting Treatments
CKLRMRHR
Single-band photon flux density (μmol·m−2·s−1)
Blue light (400–500 nm)75.7553.20 38.4925.91
Green light (500–600 nm)123.4287.0861.7642.56
Red light (600–700 nm)70.09127.76158.44191.65
Integrated photon flux density (μmol·m−2·s−1)
PPFD269.27268.05258.70 260.12
YPFD224.38234.10 232.56239.82
Radiation ratio
Red:Blue0.932.40 4.127.40
Red:Green0.571.472.574.50
Daily light integral (mol·m−2·d)
10 h9.709.669.329.37
Table 2. Growth of pak choi grown under the different ratios of red and white light treatments.
TreatmentsCKLRMRHR
Shoot fresh weight (g)60.94 ± 1.83 c102.12 ± 2.10 a87.11 ± 2.27 b91.71 ± 2.00 b
Shoot dry weight (g)3.06 ± 0.10 c5.51 ± 0.13 a4.61 ± 0.11 b4.69 ± 0.13 b
Root fresh weight (g)3.47 ± 0.14 c5.59 ± 0.16 a4.50 ± 0.13 b4.93 ± 0.19 b
Root dry weight (g)0.31 ± 0.01 d0.60 ± 0.01 a0.49 ± 0.02 b0.43 ± 0.01 c
Root:shoot ratio0.07 ± 0.01 a0.06 ± 0.01 b0.06 ± 0.01 b0.06 ± 0.01 b
Leaves area (cm2 per plant)767.56 ± 20.28 c989.95 ± 28.14 a872.63 ± 18.09 b1042.95 ± 29.61 a
Number of leaves13.00 ± 0.29 b14.89 ± 0.51 a14.33 ± 0.33 a14.56 ± 0.38 a
Petiole:leaf ratio0.40 ± 0.01 ab0.41 ± 0.01 a0.40 ± 0.01 ab0.39 ± 0.01 b
Specific leaf weight (mg DW/cm2)4.08 ± 0.03 c5.54 ± 0.07 a5.21 ± 0.15 b4.32 ± 0.13 c
CK: only white light, LR: red:white = 1:2, MR = red:white = 1:1, LR = red:white = 2:1. All values in the table are expressed as mean ± standard error (n = 9). Different letters in the same row indicate significant differences between treatments by Duncan’s multiple range test (p ≤ 0.05).
Table 3. Eigen value, factor scores, and contribution of the first five principal component axes to variation in pak choi grown under the different ratios of red and white light.
Principal ComponentsF1F2F3F4F5
Eigen Value11.616.432.261.491.02
Variability (%)46.4325.719.035.984.08
Cumulative %46.4372.1481.1787.1491.22
Publisher’s Note: MDPI stays neutral with regard to jurisdictional claims in published maps and institutional affiliations.