Article

European Grapevine Moth and Vitis vinifera L. Phenology in the Douro Region: (A)synchrony and Climate Scenarios

1
CoLAB VINES&WINES—National Collaborative Laboratory for the Portuguese Wine Sector, Associação para o Desenvolvimento da Viticultura Duriense (ADVID), Edifício Centro de Excelência da Vinha e do Vinho, Régia Douro Park, 5000-033 Vila Real, Portugal
2
Centre for the Research and Technology of Agro-Environmental and Biological Sciences (CITAB), Universidade de Trás-os-Montes e Alto Douro (UTAD), 5000-801 Vila Real, Portugal
3
Mountain Research Center (CIMO), Instituto Politécnico de Bragança, Campus de Santa Apolónia, 5300-253 Bragança, Portugal
4
Associação para o Desenvolvimento da Viticultura Duriense (ADVID), Parque de Ciência e Tecnologia de Vila Real, Régia Douro Park, 5000-033 Vila Real, Portugal
*
Author to whom correspondence should be addressed.
Agronomy 2022, 12(1), 98; https://doi.org/10.3390/agronomy12010098
Submission received: 18 October 2021 / Revised: 11 December 2021 / Accepted: 29 December 2021 / Published: 31 December 2021

Abstract

:
The European grapevine moth (Lobesia botrana; Denis and Schiffermüller, 1775) is considered a key pest for grapevine (Vitis vinifera L.) in the Douro Region, Portugal. The phenology of both the grapevine and the pest has changed in the last decades due to the increase in temperature. Here, we assess the potential impact of climate change on the (a)synchrony of both species. The results show that the phenological stages (budburst, flowering and veraison) undergo an advancement throughout the region (at an ~1 km resolution) under a climate change scenario (Representative Concentration Pathways, RCP8.5) for the period 2051–2080, with respect to the historic period (1989–2015). For cv. Touriga Nacional and Touriga Franca, the budburst advances up to 14 days, whereas for flowering and veraison the advancements are up to 10 days (mainly at low elevations along the Douro River). For the phenology of Lobesia botrana, earliness was also verified in the three flights (consequently there may be more generations per year), covering the entire region. Furthermore, the third flight advances further compared to the others. For both varieties, the interaction between the third flight (beginning and peak) and the veraison date is the most relevant modification under the future climate change scenario (RCP8.5, 2051–2080). The aforementioned outcomes from the phenology models help to better understand the possible shifts of both trophic levels in the region under future climate, giving insights into their future interactions.

1. Introduction

Plants and insects are dependent on the accumulation of heat units for their development. Plant phenology is directly influenced by weather and climate, with the following parameters being considered: temperature, photoperiod, relative humidity, precipitation and CO2 [1]. Furthermore, pests are also influenced directly by climatic factors, although other features such as habitat structure, overwintering, food quality, and the length of the growing season also influence their development [1,2].
In recent years, changes in climatic conditions (particularly changes in temperature and the seasonal pattern of precipitation distribution) have already influenced the interactions between the pest and the host. In this way, it is expected that future climate change could have a strong impact on phenological stages, population dynamics, development thresholds and adaptation [3]. Therefore, anticipating the likely impacts on the phenology of the grapevine (Vitis vinifera L.), a crop of high cultural and economic relevance in Europe, and one of its main pests, the European grapevine moth (Lobesia botrana, LB hereafter), will be essential. Hence, the prediction of possible changes in the two trophic levels can be based on simulations using phenological models [4].
The thermal models of the vegetative cycle of the grapevine are based on the accumulation of heat units. The occurrence of a certain phenological stage is based on the sum of temperatures, starting at a pre-defined date, until reaching a limit for each variety [5]. For models based on growing degree-days (GDD), the temperatures are accumulated from a given threshold, called the base temperature. This value is usually 10 °C [6], or another closed temperature. Furthermore, some authors suggest that thermal accumulation can begin on the first day of the year [7,8]. The sigmoid(-function) model, with two associated parameters (d and e), proposed by Hänninen [9], allows a gradual change in the weights given to temperatures within a transition range. Wang and Engel [10] consider the potential negative effects of extreme temperatures on crop development. Parker et al. [11] present the GFV model (Grapevine Flowering and Veraison model), based on daily average temperature accumulation (base temperature is 0 °C), starting from 1 March.
These models can assess the development of the phenology under different climatic conditions. In recent years, studies have applied the combination of different models with climate scenarios to understand possible future changes in phenology in different varieties [12,13,14]. The mentioned studies indicate that the phenological stages of the grapevine (budburst, flowering and veraison) will occur earlier in the future [15].
To predict the evolution of the LB phenology, some models have already been developed. Some of these are based on the relationship between the accumulation of degree-days and the capture of adult males in traps [16,17,18]. Other authors have introduced other specific abiotic factors in their models, such as precipitation, relative humidity, and wind speed. However, they also considered biotic factors, mainly fertility, mortality, larvae diet, etc. [4,19]
Warmer temperatures during the winter and spring will affect the overwintering of pupae. However, early spring temperatures might have a positive effect on the pest [20]. Another aspect, warmer conditions, may accelerate the rate of development, as heat units accumulate earlier and faster, and thus increase voltinism [1,21,22,23]. Lastly, future warmer temperatures will not only individually affect the phenology of the grapevine and grape moth, but also the biological interactions between them [24].
The Douro Demarcated Region (DDR, henceforth) is located in the northeastern part of Portugal and is considered the oldest controlled winemaking region in the world. In 2001, a part of this region (Alto Douro Vinhateiro) was classified by UNESCO as an evolving and living landscape [25]. The DDR is divided into three sub-regions: Baixo Corgo, Cima Corgo and Douro Superior. According to the IVDP (Instituto dos Vinhos do Douro e do Porto, I.P.), 2020 data indicate that the vineyard area is 17% of the region’s total. In detail, the Baixo Corgo sub-region (29% of the total area) occupies the largest percentage of vineyard area, followed by Cima Corgo (22%), and then Douro Superior (9%) (available in: https://www.ivdp.pt/pt) (accessed on 26 September 2021). In terms of the impact of climate change in the DDR, a warming and drought trend is projected in the coming decades [26], reflected in the earliness of the phenological stages of the grapevine [5,27]. Furthermore, a recent study indicates an earlier three LB flights (beginning and peak of flight) in future climate scenarios, with a fourth complete flight more likely to happen [22].
The present study aimed to evaluate the impact of climate change on the phenology of both the grapevine and LB in the DDR (at an ~1 km grid resolution), and thus to provide useful information to support strategies of management for the regional winegrowers and decision-makers. The structure of the study is as follows: (1) to run the LB phenology model (beginning and peak of flight for three flights) over both the historic (1989–2015) and future periods (RCP4.5 and RCP8.5, 2021–2080), in Julian days (DOY); (2) to apply a similar methodology for three grapevine phenological stages in two varieties (cv. Touriga Nacional and Touriga Franca), namely budburst, flowering and veraison; (3) to compute the difference between each climate scenario and the historic period for both the plant and insect; (4) to assess the interaction of LB and grapevine phenology models for the historic period and future climate scenarios; and lastly, (5) to produce spatial–temporal maps covering the whole DDR, at an ~1 km grid resolution, based on the aforementioned methodologies.

2. Materials and Methods

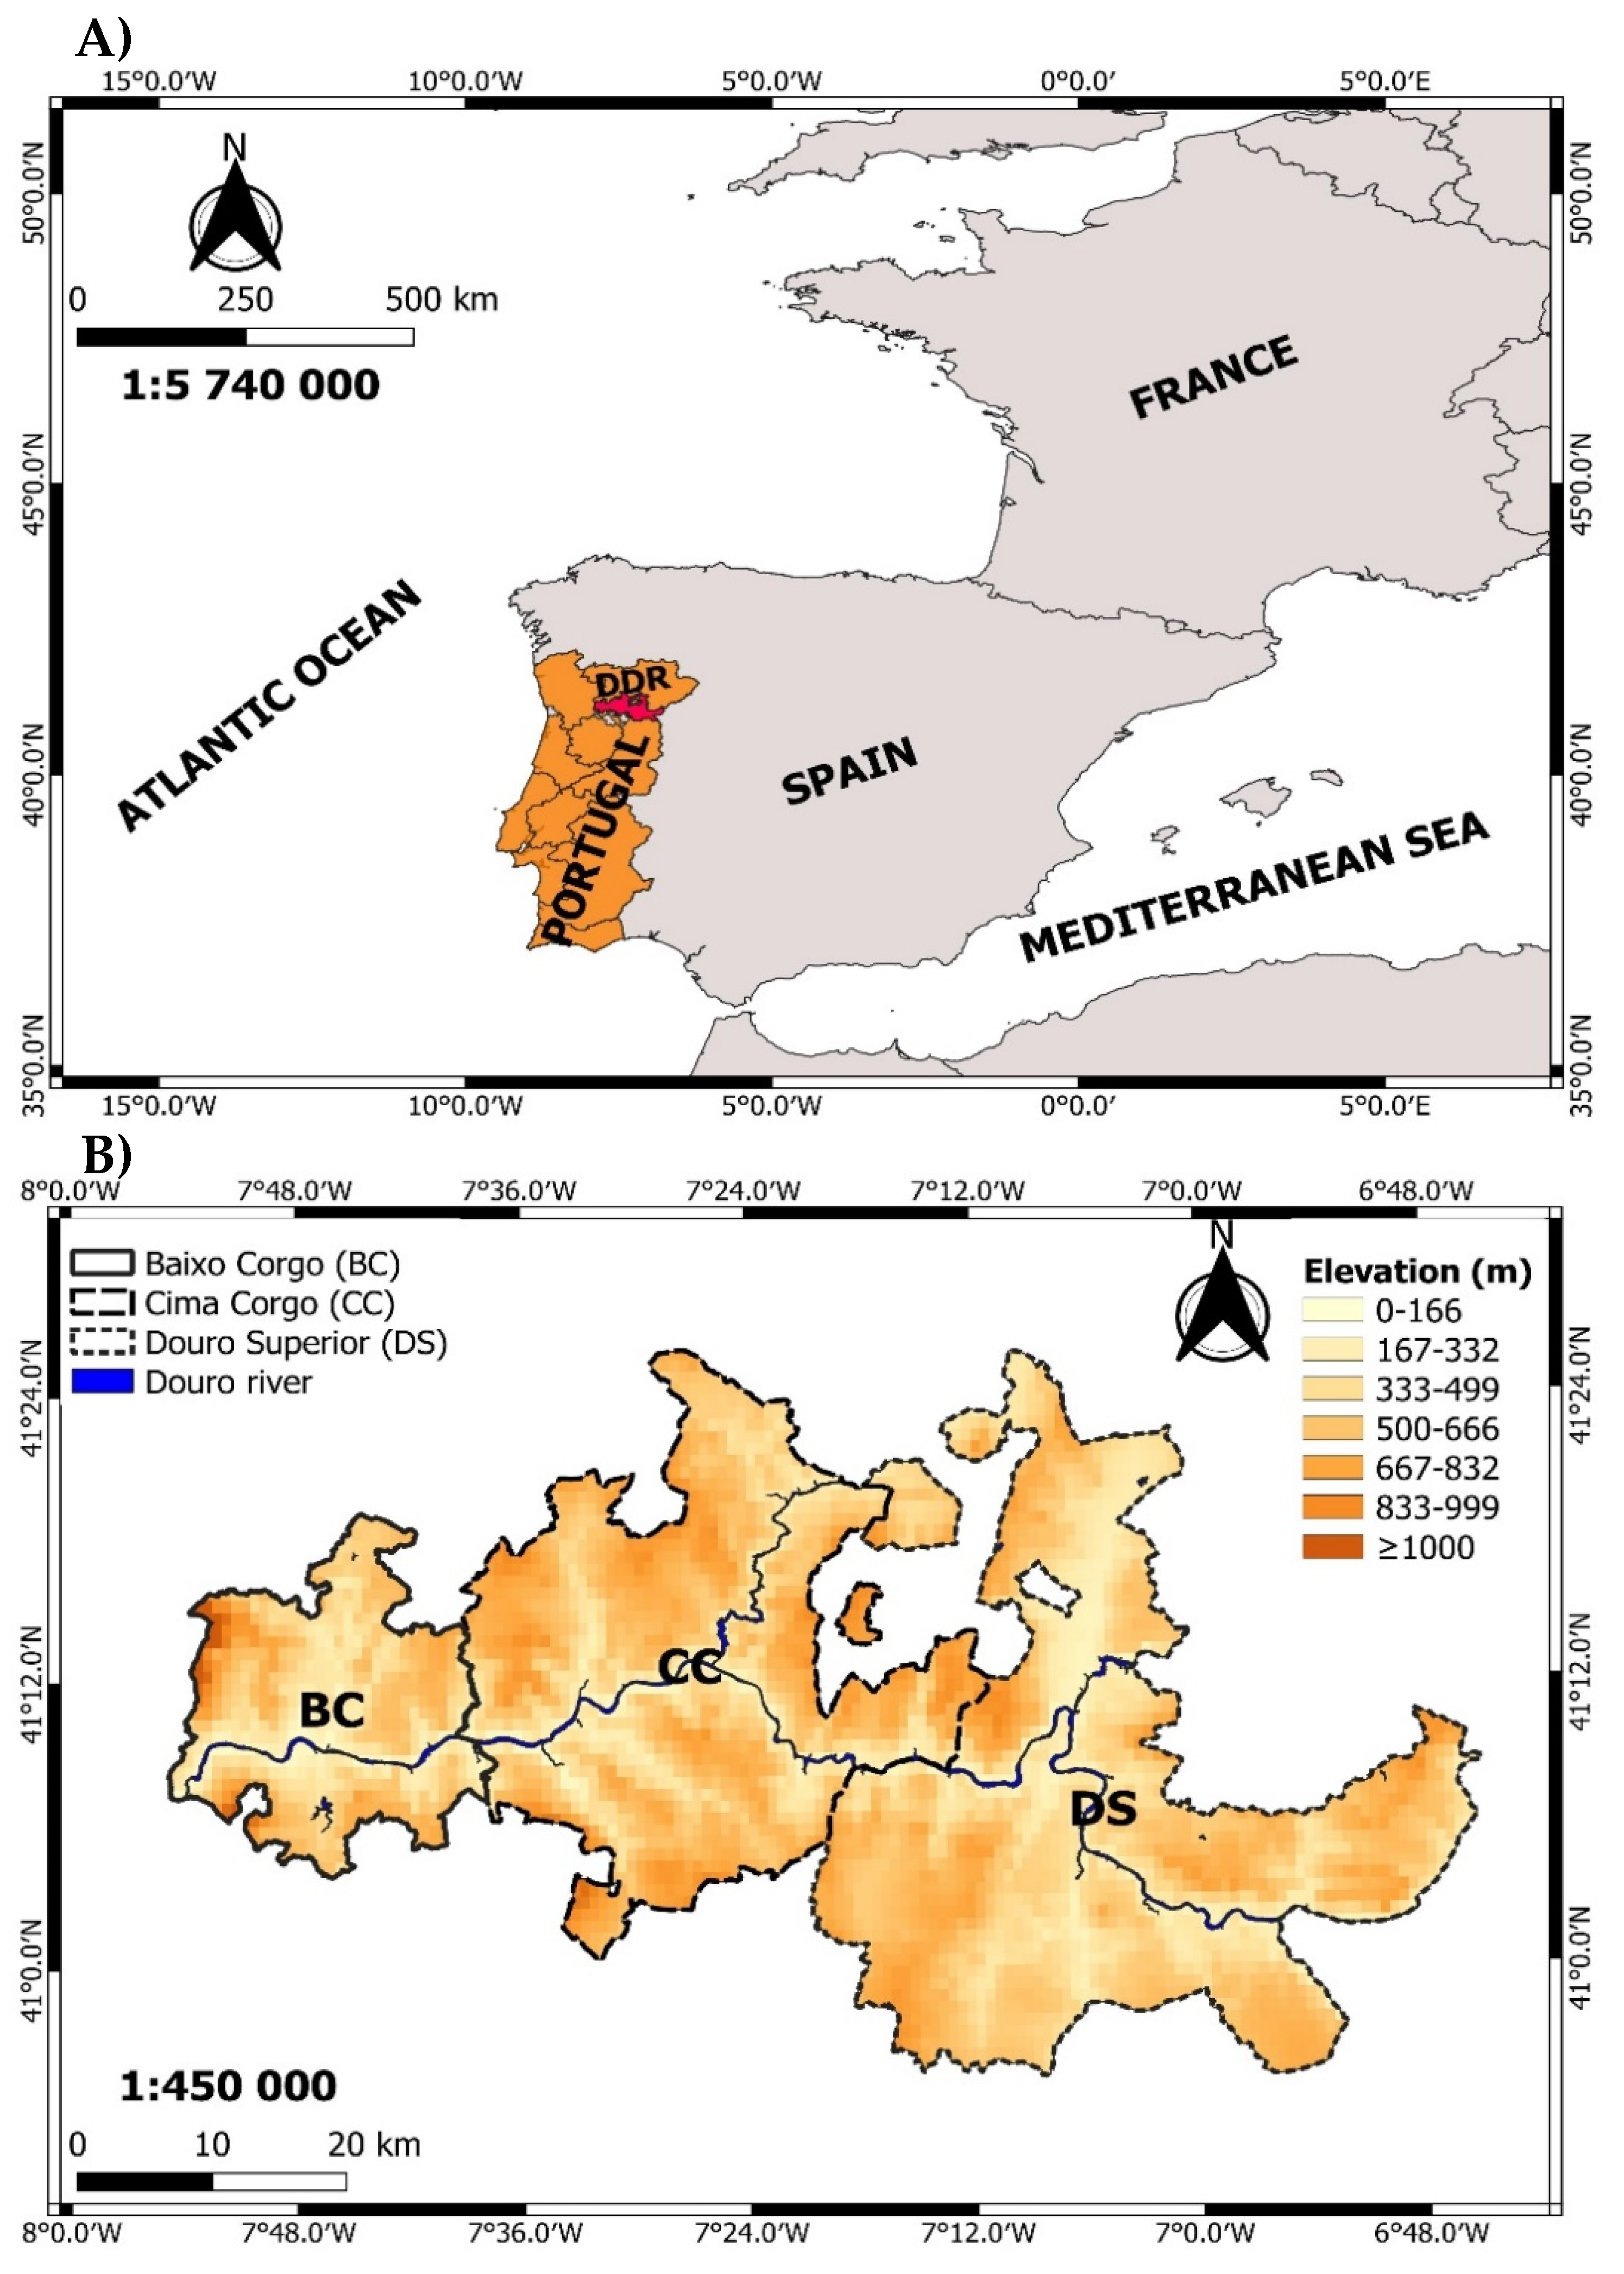
2.1. Study Area and Climate Conditions

The landscape of the DDR is characterized by mountainous terrain that rises from the Douro river on moderate to steep slopes and varied exposures. The average, maximum and minimum elevations of the region are 443, 1408 and 42 m, respectively [28]. Despite the wide range of meso-climates due to the very complex orography, all climates are of Mediterranean-type, typically characterized by mild and rainy autumns-winters and warm and dry summers, but with high interannual variability and irregularity in the precipitation regime. High solar radiation levels and potential evapotranspiration are also common [29]. Moreover, precipitation in the region decreases from west to east, with the annual precipitation varying from >1000 mm, in westernmost areas, to <400 mm, in the innermost areas close to the Spanish border [30]. Overall, a wide diversity of terroirs can be identified [31]. Figure 1 shows the region divided into three sub-regions: Baixo Corgo (BC), Cima Corgo (CC) and Douro Superior (DS), along with a DEM (Digital Elevation Model).

2.2. Phenological Models

2.2.1. Grapevine

Generalized sigmoid models (GSM) were developed to predict three phenological stages of the grapevine, which are budburst (Biologische Bundesanstalt, Bundessortenamt und CHemische Industrie scale, BBCH 07), flowering (BBCH 65), and veraison (BBCH 81) [32]. These models were calibrated and validated with a large number of varieties (51, including cv. Touriga Nacional and Touriga Franca) from four Portuguese wine regions: Douro, Dão, Vinhos Verdes and Lisboa, as described by Reis et al. [5]. Phenological stages were recorded (overall period: 1990–2018) through site observations based on the Baggiolini scale [33] and assessed when at least 50% of a pre-defined and time-invariant (homogeneous) subsample of plants reached the corresponding stage. Lastly, cv. Touriga Nacional and Touriga Franca were selected, as these varieties are considered to have high expression and economic importance in the region.

2.2.2. LB Flight

Degree-day models were developed based on data collected over 20 years in the DDR. The flight model of LB, as described by Carlos et al. [17], is based on the degree-days required for the occurrence of its main flight events (beginning and occurrence of 50% of captured males, i.e., peak flight in pheromone traps). The lower and upper development thresholds were defined at 7.3 °C and 33 °C, respectively, according to Carlos et al. [17]. Lastly, in this study, the accumulation of degree-days since 1 January was used for each flight.

2.2.3. Robustness and Predictability

The models applied to predict the LB flights and the phenological stages of the grapevine (budburst, flowering and veraison) show high robustness and effectiveness based on data observed in the field. According to the literature, phenology models may operate with different inputs (temperature, precipitation, relative humidity, solar radiation and others) [5,11,17,34,35,36,37] based on the scale of interest and specific objectives. The robustness of the models is particularly important, especially in the reliability of projections of climate change impacts [38]. However, a greater number of atmospheric elements may improve the model performance and its predictability.

2.3. Climate Dataset for the Historic Period and Future Scenarios

E-OBS originally (available at: https://www.ecad.eu/download/ensembles/download.php) (accessed on 29 September 2021) consisted of gridded daily minimum (TN), maximum (TX) and mean (TG) temperature values and daily precipitation totals at a resolution of approximately 25 km [39]. Later, the mean sea level pressure was added as a grid variable [40]. The data were developed as part of the ENSEMBLES project to be used in climate change studies and for the validation of regional climate models [41]. In this context, a new high-resolution grid (~1 km) was used for the daily TG, TN and TX covering the DDR, based on the original dataset (~25 km, 1950–2015) [42]. In this way, from the set of observational data, a period of 27 years (1989–2015) was extracted.
The CORDEX project (Coordinated Regional Climate Downscaling Experiment; http://wcrp-cordex.ipsl.jussieu.fr/) (accessed on 1 October 2021) [43] aims to provide an internationally coordinated framework for improving climate scenarios [44]. EURO-CORDEX is the European branch of this project, with 29 working groups [45]. A large set of simulations is available, depending on the combinations of GCM (Global Climate Model) and RCM (Regional Climate Model) [46]. For our purpose, the combinations used (GCM-RCM chains) were CNRMALADIN, ICHECDMI, IPSLINERIS and MPICLM. More details can be found in Reis et al. [22]. Daily TG, TN and TX were extracted from these climate model experiments.
For the future scenarios, two periods were considered: 2021–2050 (short-term) and 2051–2080 (medium-long term), under RCP4.5 and RCP8.5. In addition, the raw simulated data were available at an ~11 km grid resolution, covering the entire region. However, the abovementioned simulated data were converted to a ~1 km grid resolution to be compared with the historic period and used in the phenological models. In this way, three steps were undertaken to obtain high-resolution temperature datasets. First, the climate model simulated data, previously bias-corrected using E-OBS as a baseline [47], were subtracted from the E-OBS dataset on a daily timescale and at an ~11 km resolution (daily anomalies). Second, a bilinear interpolation (in the latitude × longitude grid) was applied to interpolate the anomalies from ~11 km to ~1 km grid resolution. Third, the ~1 km grid resolution anomalies were summed to the corresponding variable for the historic baseline period (1989–2015), obtained from a high-resolution dataset in Portugal [42].

2.4. Impact of Future Climate Scenarios

To predict the impact of climate change on LB flights, degree-day models were used for each flight (three flights). The starting point of the accumulation of degree-days was from 1 January. Lastly, the lower and upper development thresholds used were 7.3 °C and 33 °C, respectively [17].
The generalized sigmoid models (GSM) [5] for each phenological stage (budburst, flowering and veraison) were used for cv. Touriga Nacional and Touriga Franca, to evaluate the impact of climate scenarios on phenology. These models incorporate the F-forcing parameter for each variety and phenological stage. Moreover, this parameter is the critical thermal forcing (sum of units) required to complete a given phenological stage. According to Reis et al. [5], the following F-forcing parameters are considered: a) cv. Touriga Nacional: F = 46 (January 1st–budburst); F = 36 (budburst–flowering); F = 65 (flowering–veraison); b) cv. Touriga Franca: F = 50 (January 1st–budburst); F = 39 (budburst–flowering); F = 58 (flowering–veraison). GSM was applied with daily TG for the two future periods (2021–2050 and 2051–2080) and under both RCP4.5 and RCP8.5. In addition, the same method was applied for flight phenology models, using daily TN and TX.
The output comprised the simulated days (DOY) for the beginning and peak of each flight, in the case of LB, and the dates of the three grapevine phenological stages for the two varieties under study. Spatio-temporal maps were drawn up with the outputs obtained from LB and grapevine (cv. Touriga Nacional and Touriga Franca) at an ~1 km resolution and also considering the temporal average for each period (future and historic periods).
When comparing the periods (future and historic) and assessing the statistical significance of the corresponding differences, we assumed two independent samples: X with m observations (2021–2050; 2051–2080) from the future period and Y with n observations (1989–2015) from the historic period. Averages ( X ¯ and Y ¯ ) and variances ( S x 2 and S y 2 ) are shown below:
X ¯ = 1 m   i = 1 m X i ,   Y ¯ = 1 n   i = 1 n Y i ,
and
S x 2 = 1 m 1   i = 1 m ( X i X ¯ ) 2 ,   S y 2 = 1 n 1   i = 1 n ( Y i Y ¯ ) 2 ,
We considered unequal variances, so the statistical test for unequal variance t-test is:
t = X ¯ Y ¯ S x 2 m + S y 2 n ,
For use in significance tests, the statistic test distribution has an approximate Student’s t distribution, with the number of degrees of freedom given by Satterthwaite’s approximation [48,49,50].
d . f . = ( S x 2 m + S y 2 n ) 2 ( S x 2 m ) 2 m 1 + ( S y 2 n ) 2 n 1   ,
Lastly, the following null hypothesis was considered:
H0: Future ( X ¯ ) Historic ( Y ¯ )   = 0
H1: Future ( X ¯ ) —Historic ( Y ¯ )   ≠ 0
The value obtained, if 0, indicates that the t-test does not reject the null hypothesis at the 5% significance level (p ≤ 0.05), even if equal variances are not assumed.

2.5. Interaction of Trophic Levels

We subtracted the Julian days (DOY) from both trophic levels for the historic (1989–2015) and future periods (2051–2080; RCP8.5) at an ~1 km grid resolution over the entire region (for the development of the high-resolution grid see Section 2.3).
The difference obtained took into account only the third flight (beginning and peak) of the LB with the veraison date (cv. Touriga Franca and Touriga Nacional), according to the available phenology models (Section 2.2), since this is indeed the most relevant interaction for the Douro wine region in both the historic and future periods (2051–2080; RCP8.5).
We assumed that the synchrony between LB and the grapevine is when the pest can be hosted on the host. In more detail, it is when LB’s third flight synchronizes with the veraison’s date, i.e., the difference in their timings is small (Δ DOY ≅ 0). For asynchrony, it is when there are differences, in Julian days, between the third flight and the veraison’s date (Δ DOY ≠ 0) [4].
Lastly, we defined for the entire region elevations below or equal to 400 m as low elevation areas. Between 401 and 499 m is an average elevation. Above or equal to 500 m is high elevation.

3. Results

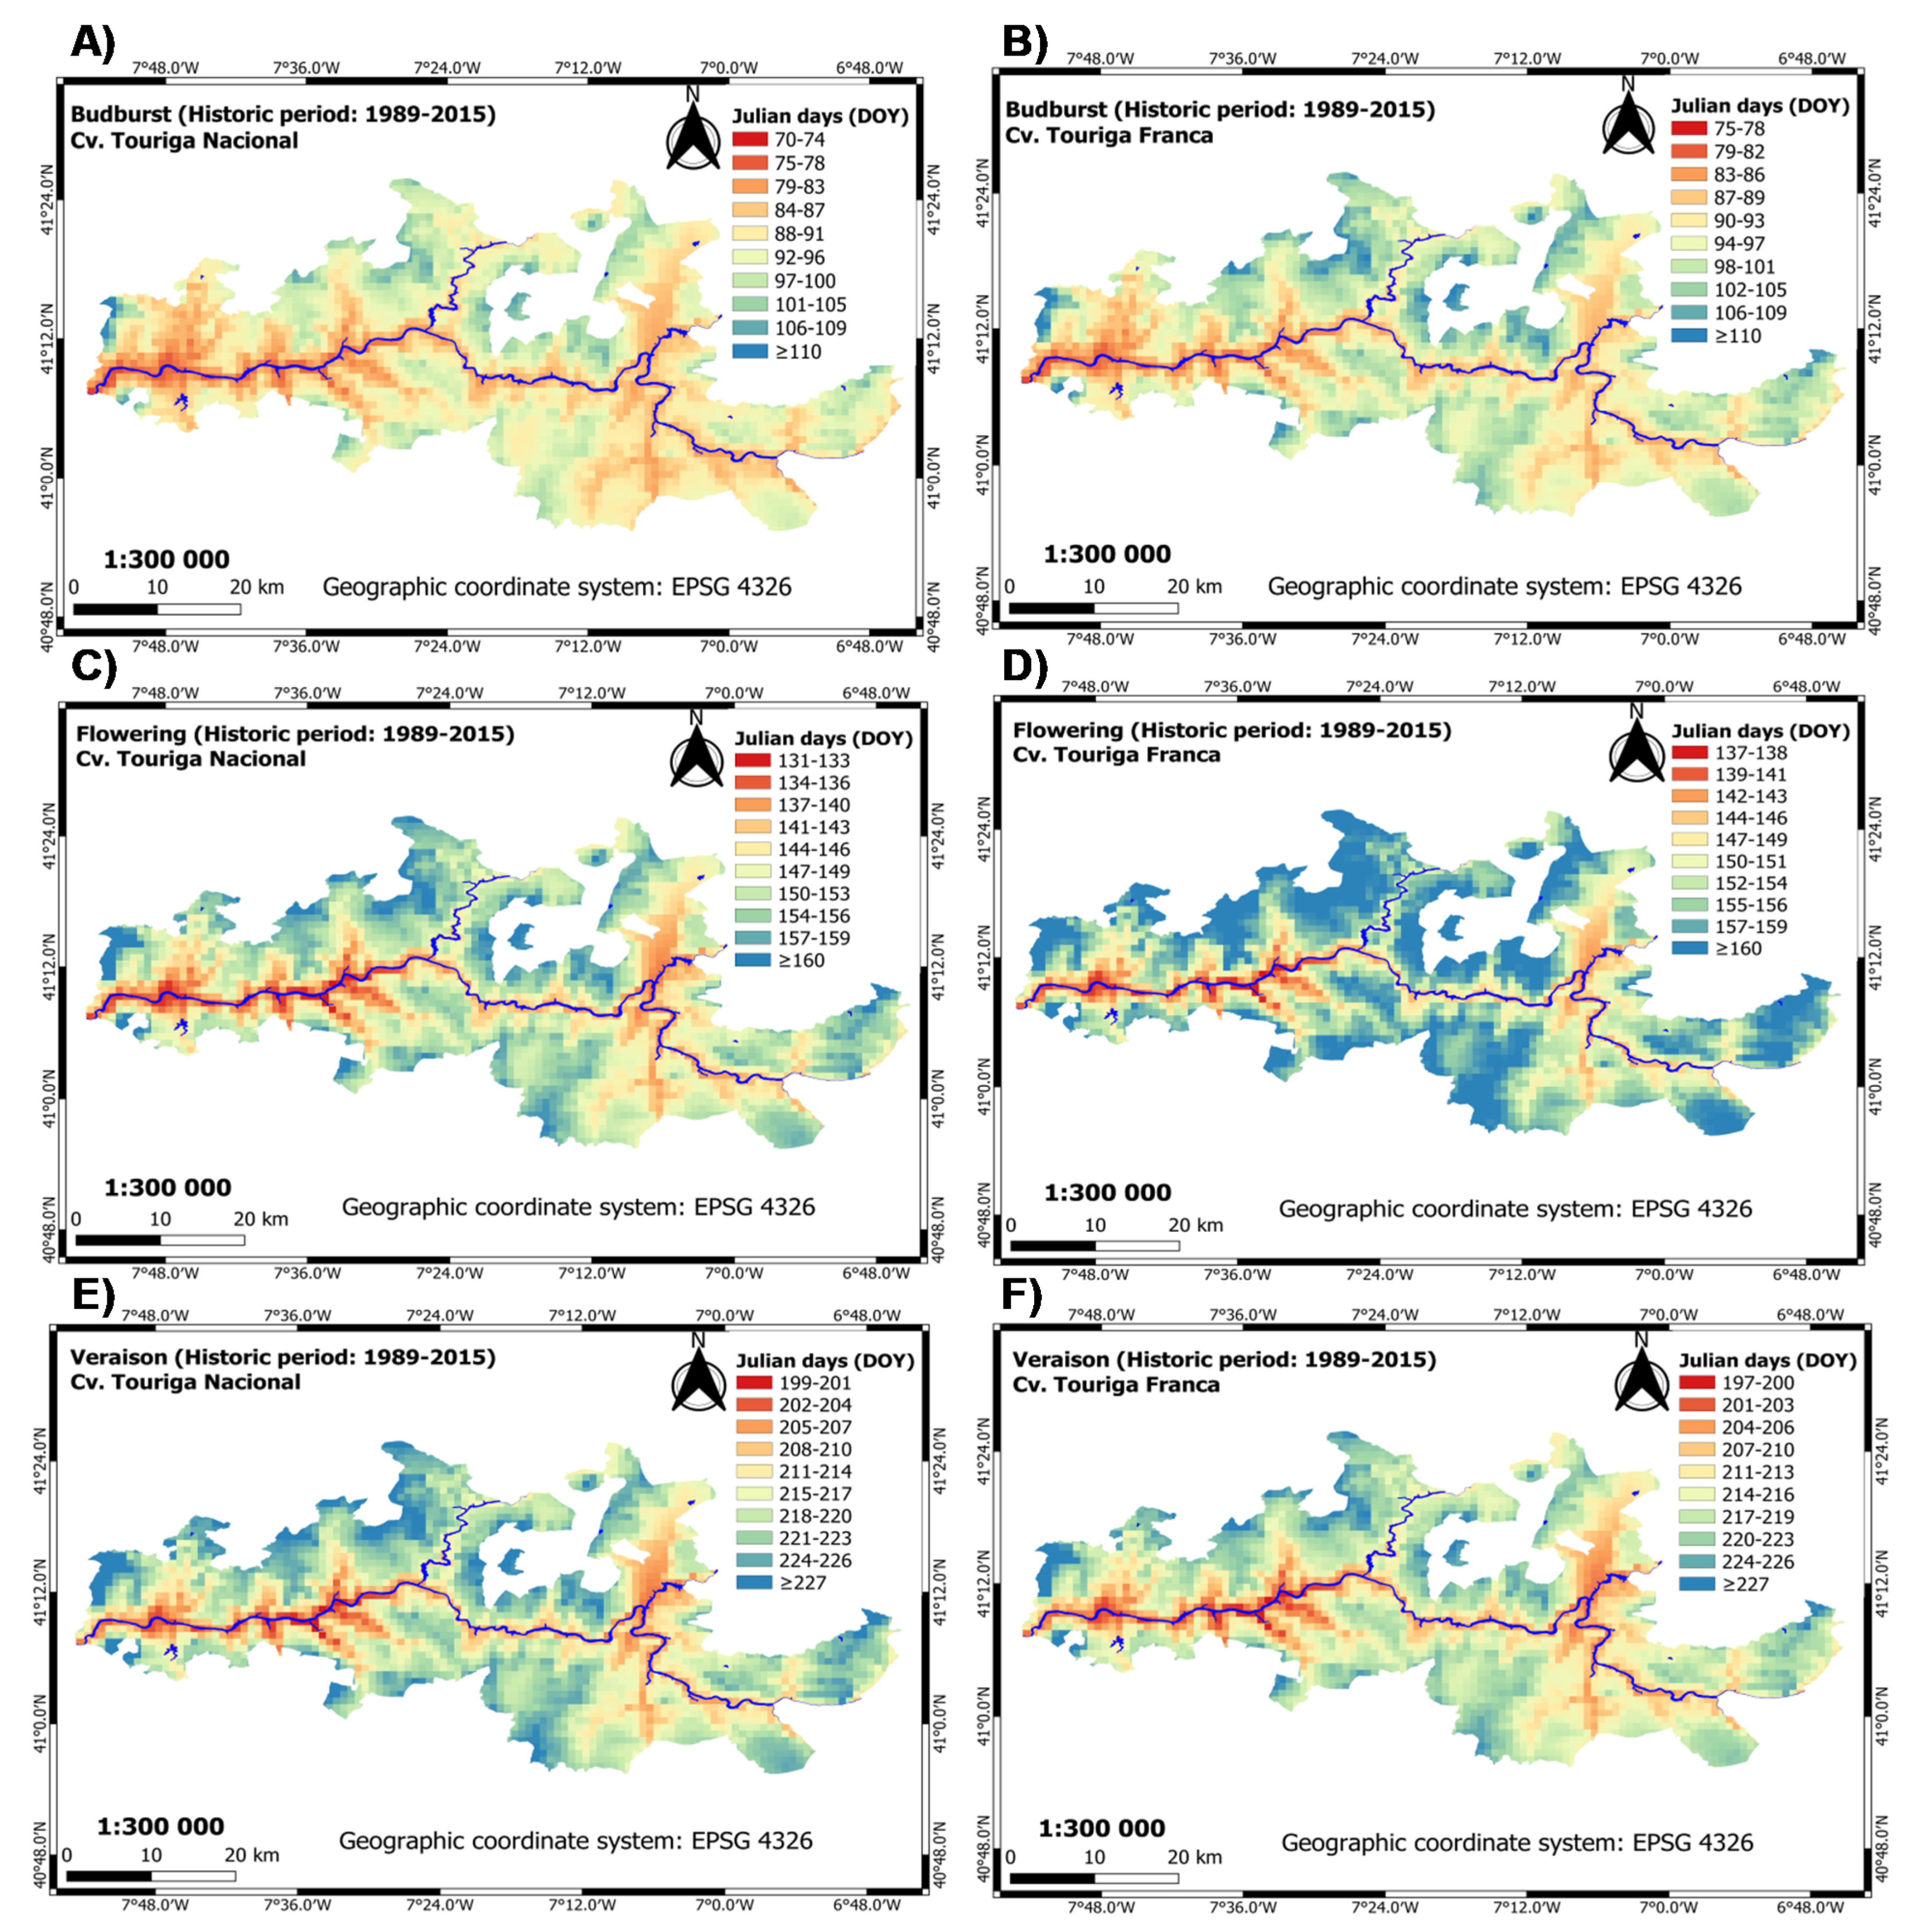
3.1. Grapevine Phenology

3.1.1. Historic Period

In the historic period (1989–2015), the days obtained by the phenology models (budburst, flowering and veraison) were validated with visual observations in the field. In this way, slight differences in phenology (period average DOY) were observed between cv. Touriga Nacional and Touriga Franca in the three phenological stages evaluated (Figure 2A–F).
For budburst, it was verified that cv. Touriga Nacional (DOYbegin 70) occurs earlier than cv. Touriga Franca (DOYbegin 75) at low to average elevations, mainly along the Douro river. At the high elevations, in both varieties, budburst is observed later, since the daily thermal accumulation is smaller (DOY ≥ 110).
For flowering, the same earliness behaviour is observed for cv. Touriga Nacional and Touriga Franca at low to average elevations (DOYbegin 131 and DOYbegin 137, respectively). At the high elevations, it is observed for both varieties that flowering occurs later, with DOY ≥ 160, particularly for cv. Touriga Franca.
For veraison, an inversion of the observed dates of the two varieties is observed. Therefore, cv. Touriga Franca tends to be earlier than cv. Touriga Nacional at low to average elevations, along the Douro river (DOYbegin 197 and DOYbegin 199, respectively). At high elevations, the veraison happens later in both varieties (DOY ≥ 227). However, in some sites, it may not happen, likely due to insufficient daily thermal accumulation, resulting in difficulties in grape ripening.

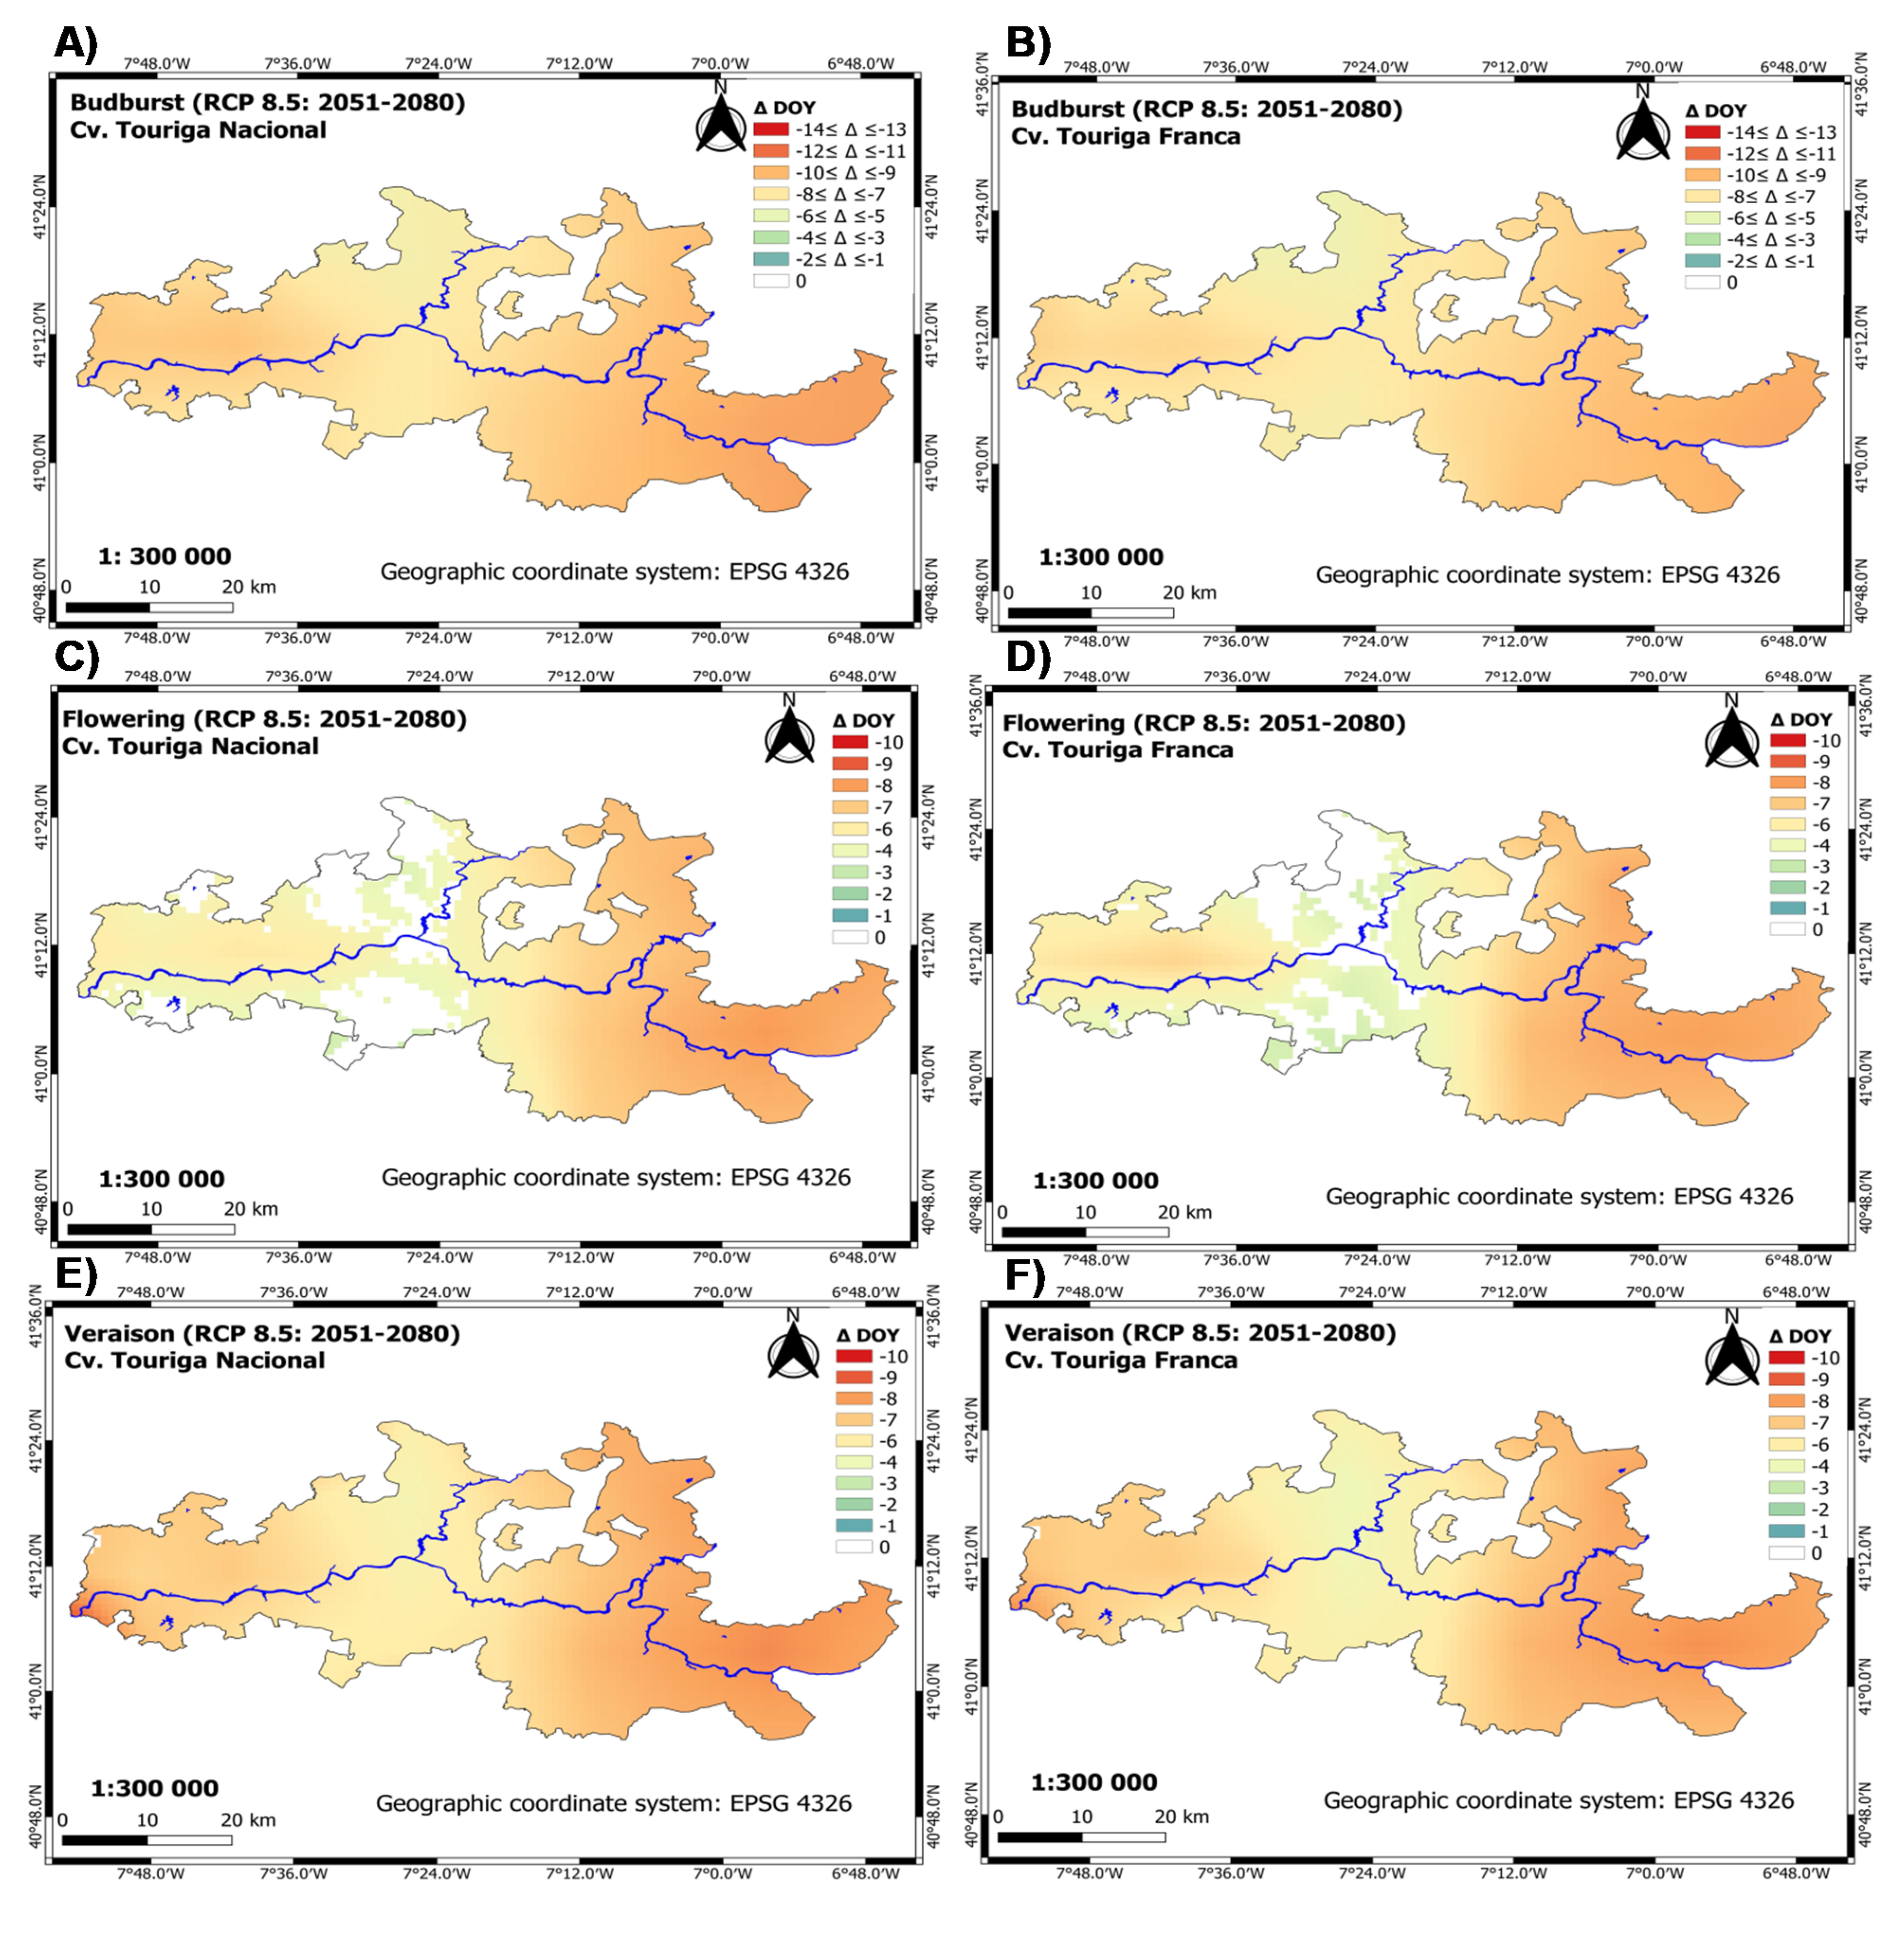
3.1.2. Future Period: Climate Scenarios

We examined the difference between the averages of the future (RCP4.5 and RCP8.5) and historic periods. The future period average consists of two sub-periods, namely 2021–2050 and 2051–2080. The average of each sub-period is based on the ensemble of climate models previously mentioned. In the analysis of the difference between periods, the alternative hypothesis was followed, which is represented: H1: Future ( X ¯ ) —Historic ( Y ¯ )   ≠ 0. In this way, we assessed the statistical significance of the differences in the future sub-periods compared to the historic period.
For budburst in both varieties, there is advancement at low and average elevations in DS and BC with respect to the historic period (up to 14 days). In addition, at high elevations in the CC, the advancement is smaller (the daily thermal accumulation is smaller), and, therefore, it is roughly between 3 to 6 days (Figure 3A,B).
For flowering, there is a weaker advancement. In DS, especially at low and average elevations, this will be up to 10 days. Furthermore, in BC and CC, at low to average elevations (including along the Douro river), the projected advancement will be roughly 1 to 7 days. Lastly, at high elevations, in CC and BC, there is no advancement. This aspect is mainly observed for cv. Touriga Nacional, since it has a larger area covered (Figure 3C,D).
For veraison, at low and average elevations in BC and DS, it was found that the advancement is projected to be up to 10 days for both varieties. In CC, at high elevations, there is slight advancement of 2 to 7 days (Figure 3E,F). Overall, it can be concluded that there will be a greater advancement in budburst with respect to flowering and veraison for both varieties. In Figure S1 (Supplementary Material), the spatial-temporal maps with the ensemble-mean DOY (averaged over the ensemble of climate models) of each sub-period and climate scenario are presented.

3.2. LB Flight Phenology

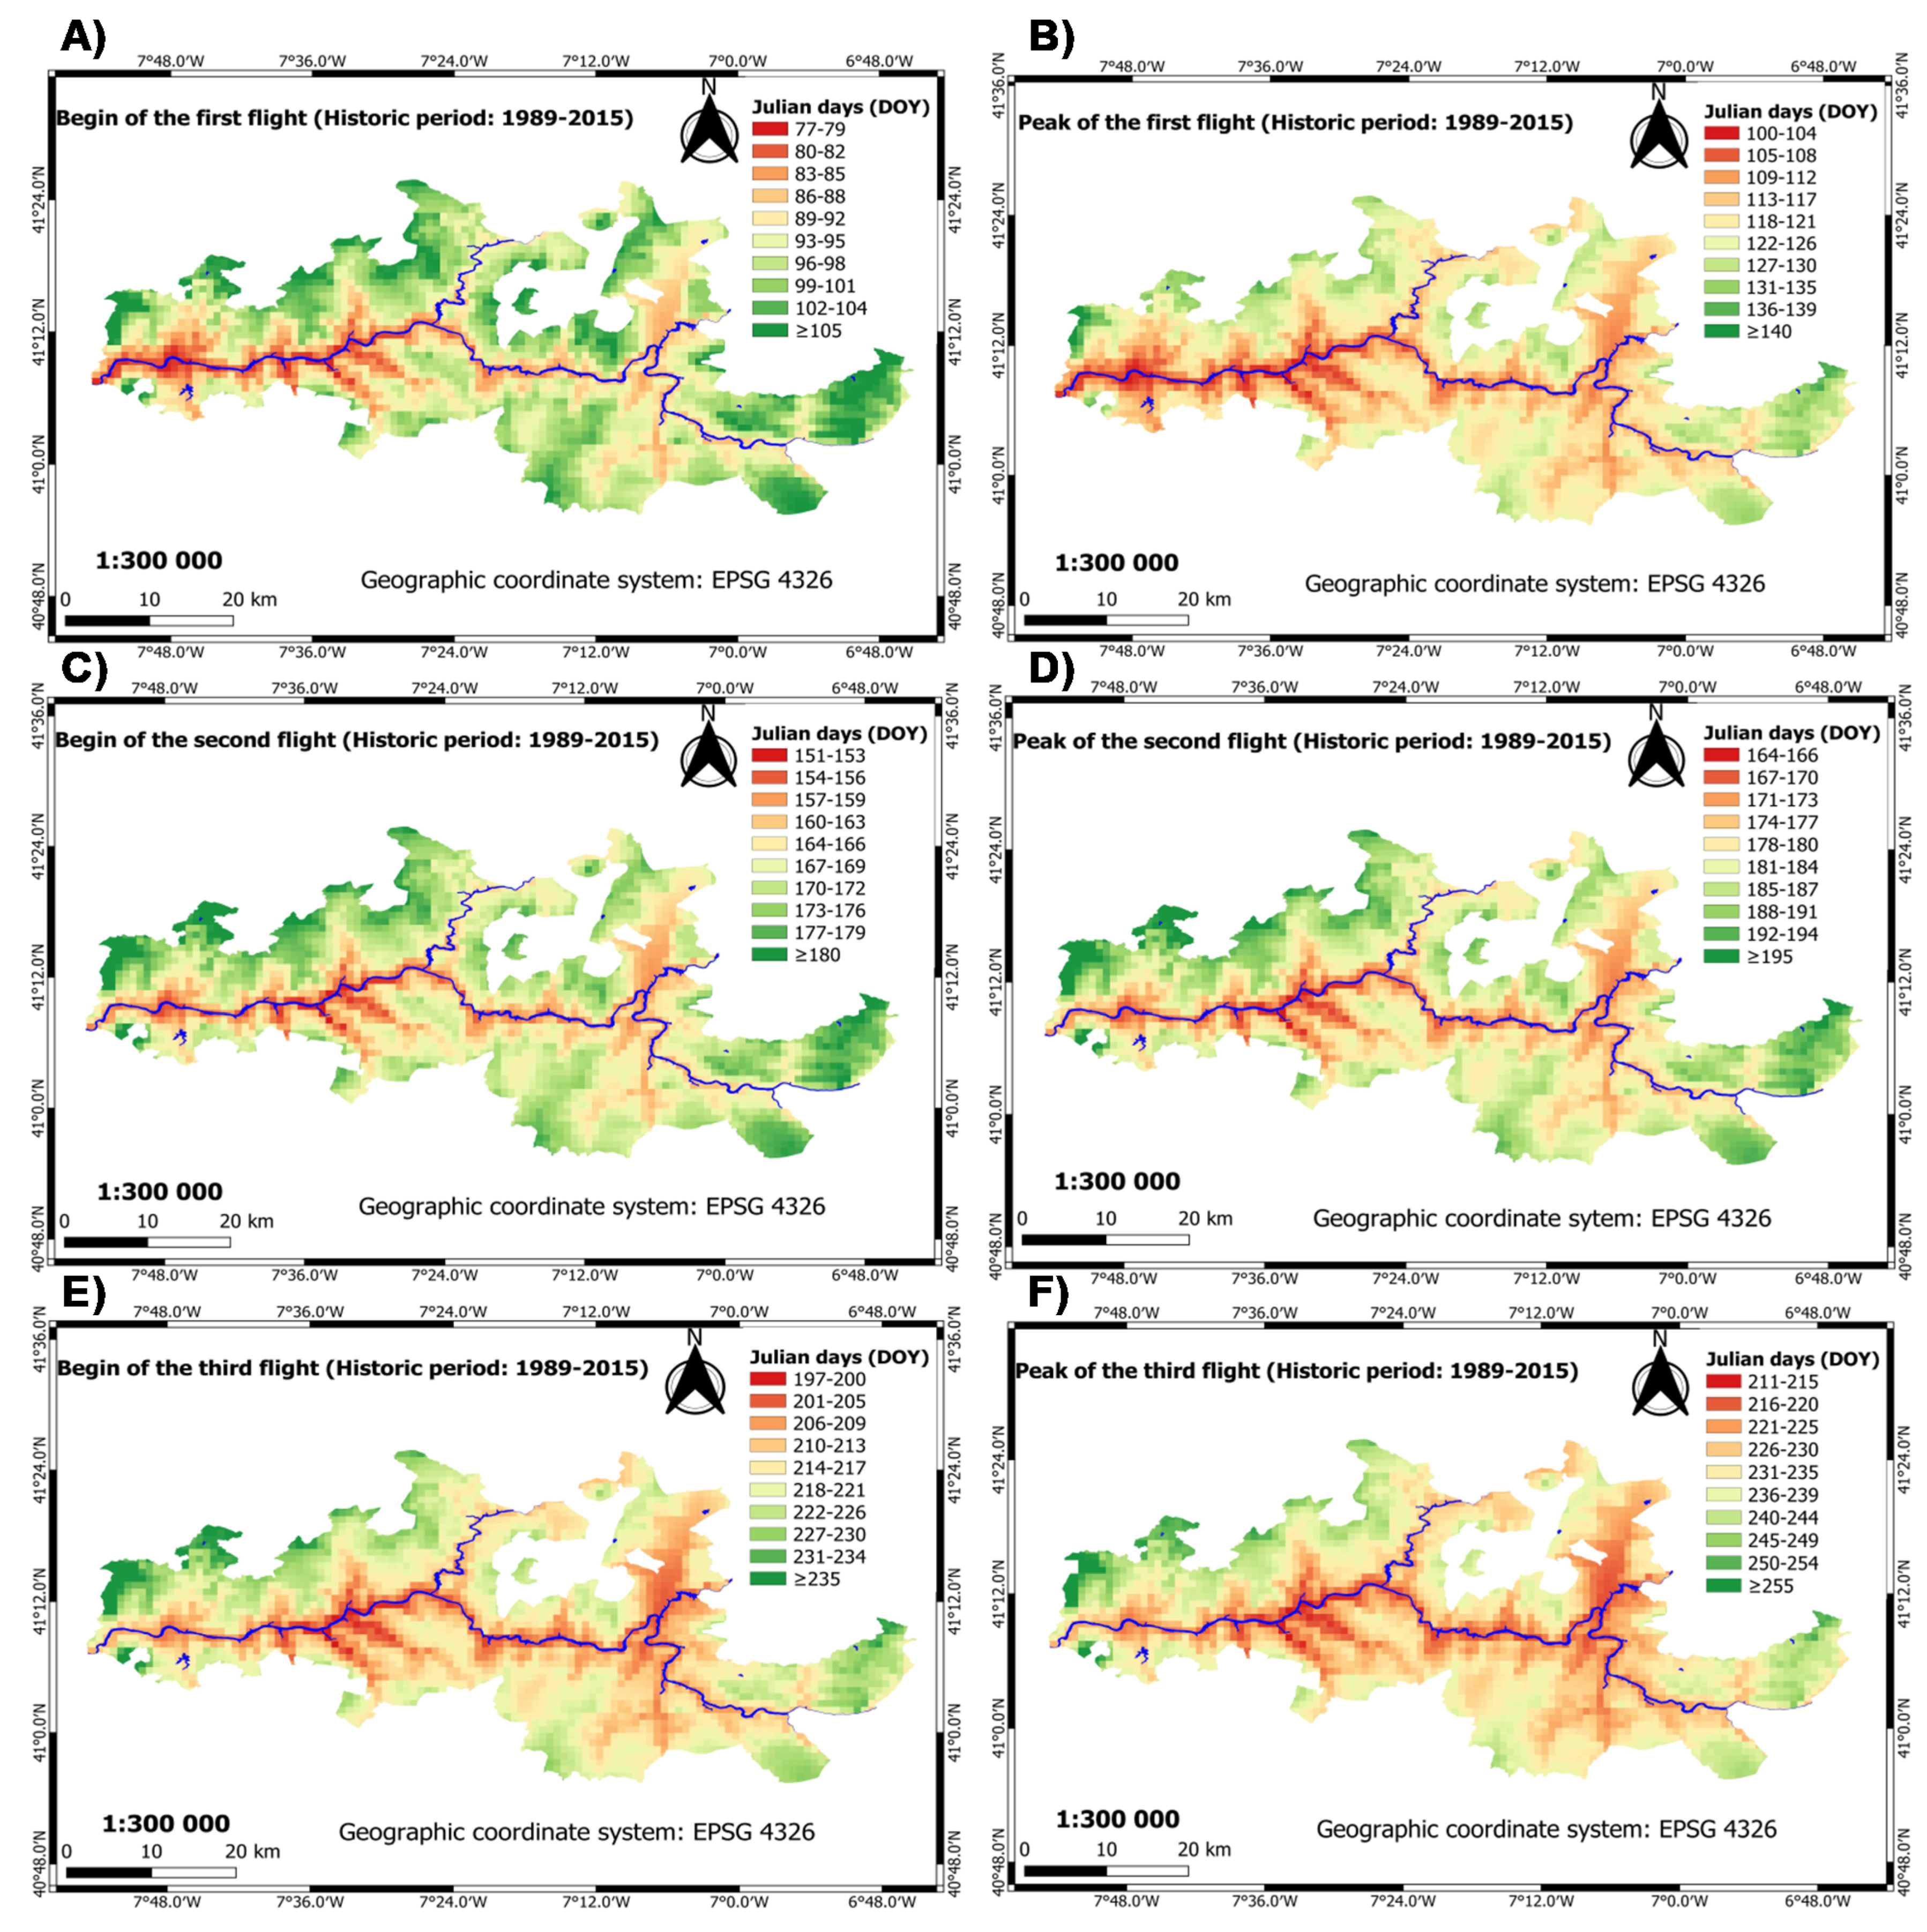
3.2.1. Historic Period

We examined the average of the DOY period of the beginning and peak of the LB flight. Furthermore, this analysis was considered for the three flights under study (Figure 4A–F).
For the first flight, at low and average elevations (warmer areas), it was observed that the beginning occurred earlier than at high elevations (cooler areas). Therefore, in those elevations, the general DOYbegin range is 77–92, mainly along the Douro river. At high elevations, the daily thermal accumulation is smaller and, consequently, there is a delay equal to or greater than 28 days (DOYbegin ≥ 105). However, there are also locations with high elevations, in the range of DOY 93 to 105. At the peak, more zones are observed near the earliest date, once that it covers more area in five intervals of the map (between DOY 100 and 121). In this way, at low and average elevations, the general DOYpeak range is 100–121. Lastly, we observed a difference of 40 days or more at some high elevations (DOYpeak ≥ 140).
In the second flight, the beginning is similar to the first flight in terms of earliness throughout the region. Hence, mainly along the Douro river, at low and average elevations, the general DOYbegin range is 151–166. In areas farther away from the river, the phenology delays at some high elevations, with the difference being equal to or greater than 29 days (DOYbegin ≥ 180). The peak is earlier at low and average elevations because its general DOYpeak range is 164–180. At higher elevations, there is a delay equal to or greater than 31 days (DOYpeak ≥ 195).
In the third flight the earliest date reached is observed (DOYbegin = 197), mainly along the river. Additionally, it is also noteworthy that, at some high elevations towards the DDR limits, dates close to the earliest were observed. However, at some high elevations, there is a difference in the earliest date, at least 38 days (DOYbegin ≥ 235). Consequently, the flight may not happen, because the thermal accumulation is insufficient, as the diapause is induced by the photoperiod [51]. The peak, at low and average elevations, reaches the earliest date (DOYpeak = 211). At high elevations, there is a difference to the earliest date of at least 44 days (DOYpeak ≥ 255). This analysis is similar to the beginning of the flight and the peak may not occur.
Overall, on the one hand, we examined that there are different dynamics in the phenology of each flight, as it depends at least on elevation and thermal accumulation to reach a certain stage. On the other hand, this dynamic means that there are different timings of the phenology in the region (e.g., at low elevations, especially near the river, the peak of the first flight occurs, while LB is still at the beginning of the first flight at high elevations).

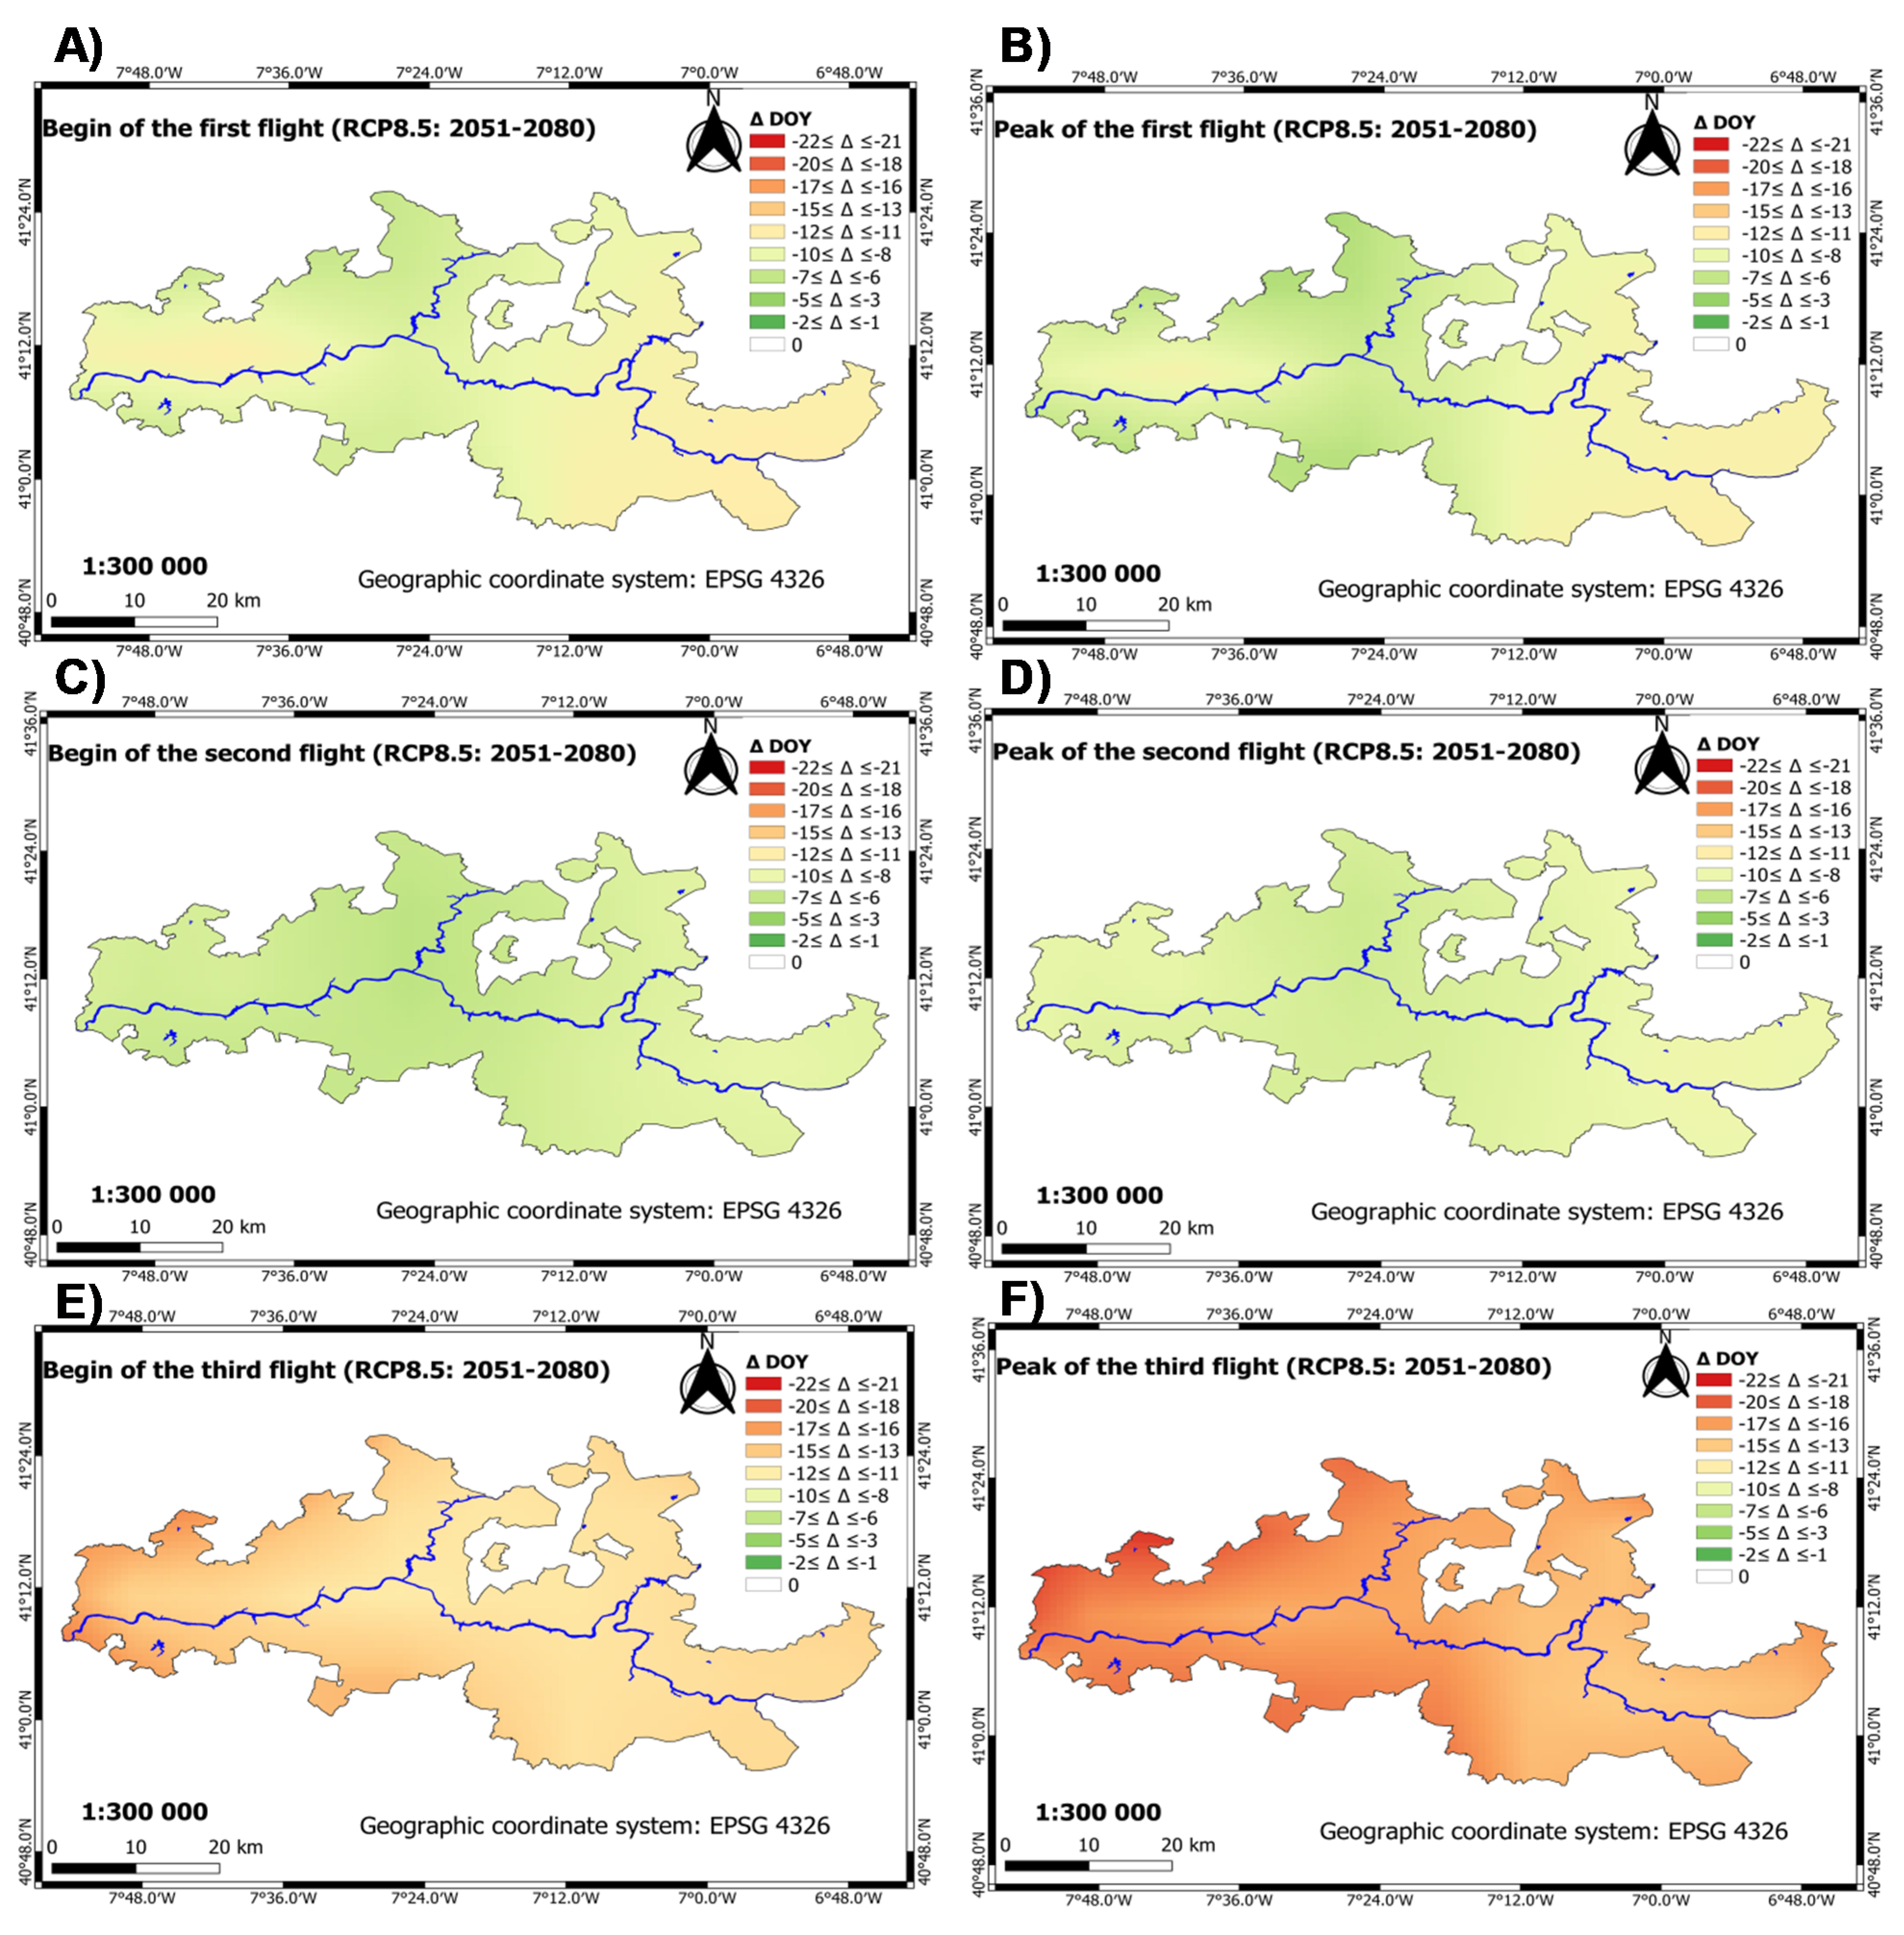
3.2.2. Future Period: Climate Scenarios

We analyzed the difference of the averages of the future and historic periods for the flight phenology. A similar statistical methodology was applied to the grapevine phenology. It was verified that there are statistically significant changes with respect to the historic period in the three sub-regions, mostly in the sub-period 2051–2080 in the two climate scenarios (RCP4.5 and RCP8.5). However, we analyze herein with more detail the most severe climate scenario (RCP8.5), leaving RCP4.5 results for Figure S2 (Supplementary Material).
In the first flight, it was observed that the advancement about the historic period is up to 14 days. This advance is observed at low and average elevations, mainly in BC and DS. However, in CC and BC, the advancement is smaller, at high elevations, but the beginning advances further regarding the peak of the flight.
In the second flight, in general, the peak advances more near the beginning. At the peak, the advancement of phenology regarding the historic period is up to 12 days. This advancement covers practically the entire region (BC, CC and DS) regardless of the elevation. At the beginning of the flight, it advances less, especially at average and high elevations, in CC and BC, with this advancement being roughly between 1 to 5 days.
On the third flight, there was greater advancement compared to the other flights. Another aspect considered, in general, is the peak that advances further regarding the beginning of the flight. At peak, the advancement can reach 22 days, in BC, CC and DS (the latter in a smaller area). However, at the beginning of the flight, the advancement observed is lower in the three sub-regions, which can reach up to 20 days.
In general, it can be concluded that there is generalized advancement, covering the entire DDR for the three LB flights, adding that the third advances further compared to the others (Figure 5A–F). Finally, in annexes S3 and S4, the spatial-temporal maps with the DOY average (set of climate models) of the evaluated sub-period and climate scenarios (RCP4.5 and RCP8.5) are available.

3.3. Interaction of Trophic Levels: LB and Grapevine

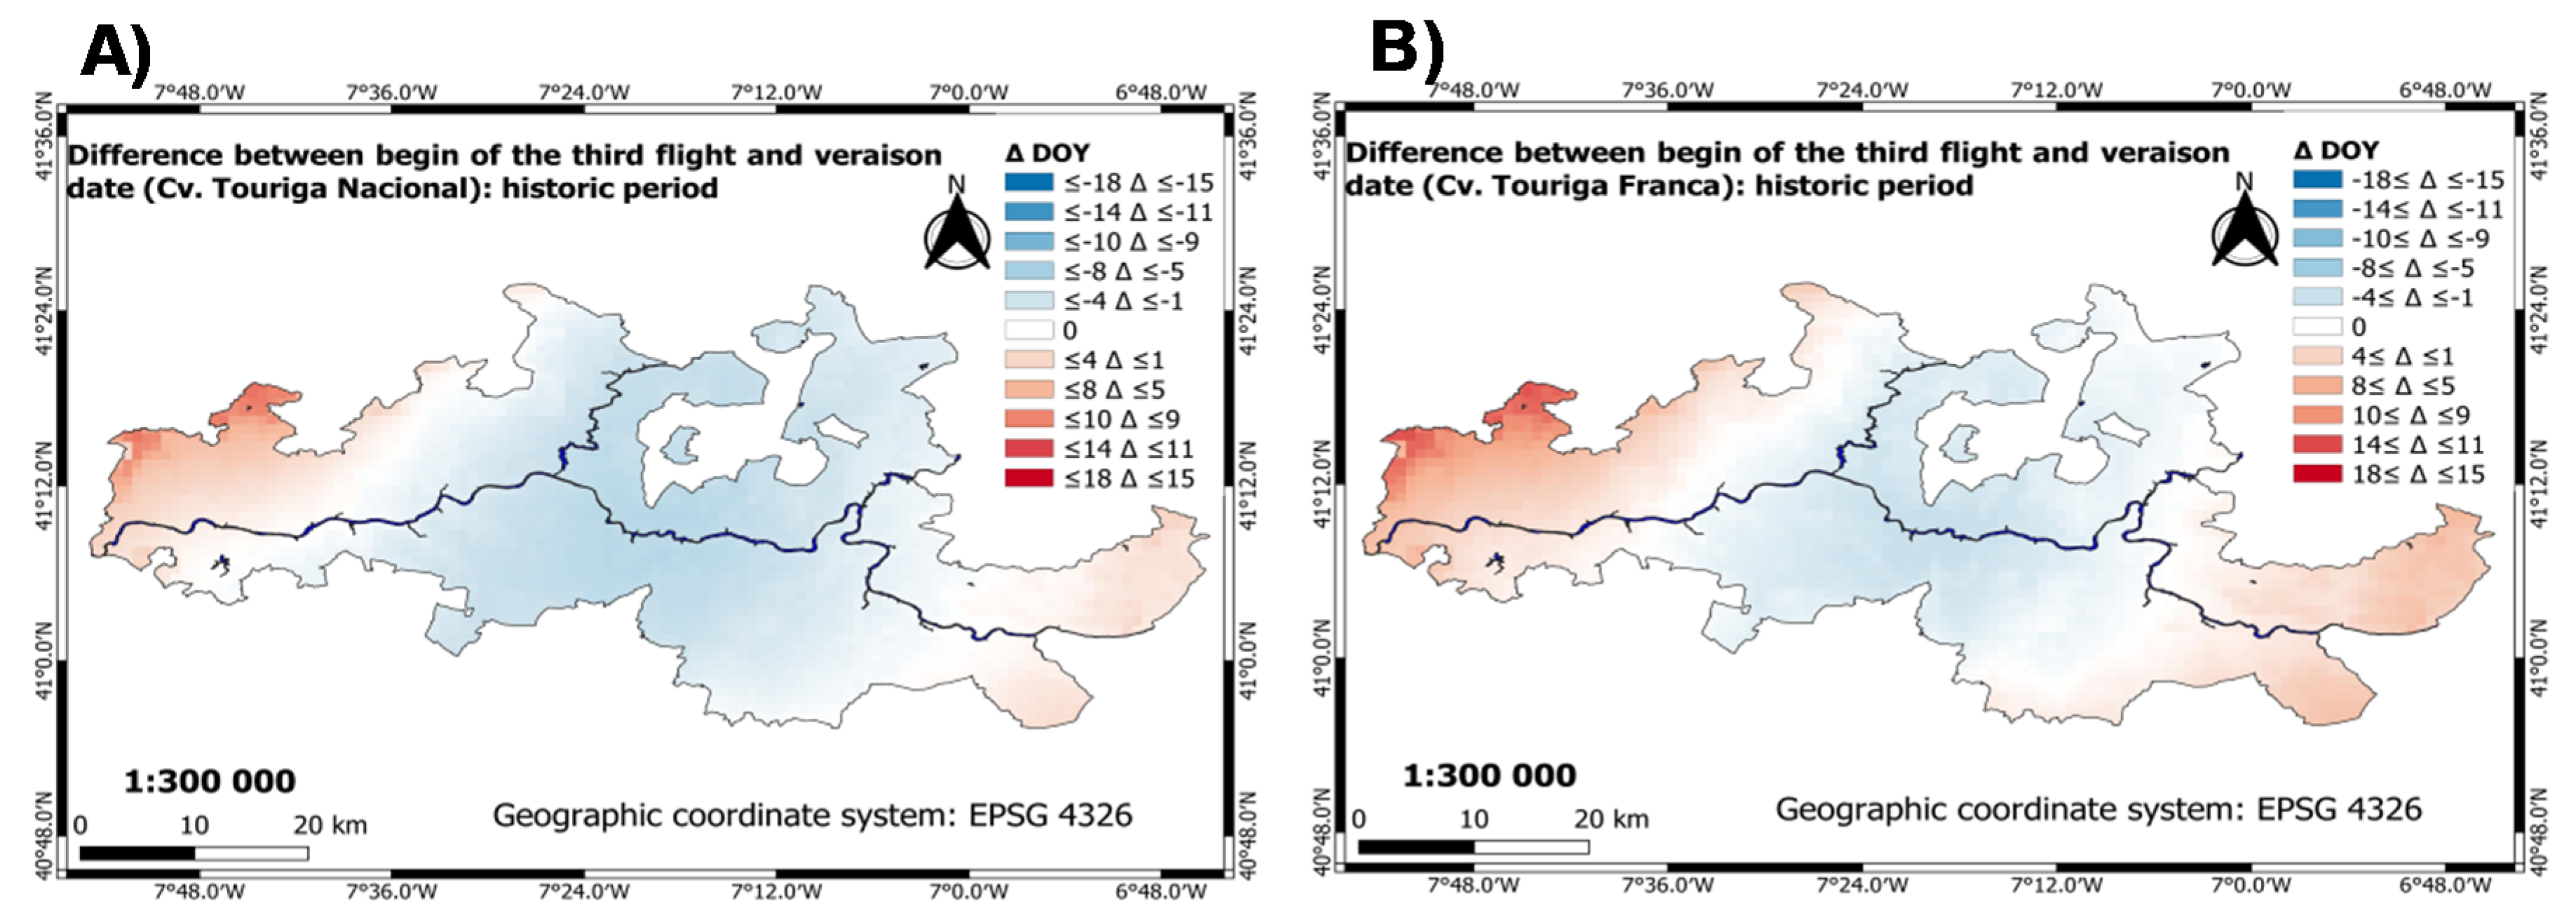
3.3.1. Historic Period

The analysis of the interaction between the trophic levels (LB and grapevine) is important to examine whether there is synchrony between them, which underlies likely interactions between the LB and grapevine. The most interesting interaction was found between the third flight (beginning) and the veraison date in the historic period (1989–2015). Synchrony between the beginning of the third flight and the veraison date of both varieties (cv. Touriga Nacional and Touriga Franca) is observed. In greater detail, the beginning of the third flight is synchronized with the two varieties when the differences in their corresponding timings are small (Δ DOY ≅ 0). That phenological interaction is mainly observed in two sub-regions for cv. Touriga Franca: CC and DS (Figure 6B; white color on the map), whereas it is observed in the three sub-regions for cv. Touriga Nacional (Figure 6A; white color on the map).
On the one hand, concerning asynchrony, this is observed when the beginning of the third flight occurred later than the date of the veraison in cv. Touriga Nacional in the three sub-regions BC (≤+10 Δ DOY ≤ +1), CC and DS (≤+4 Δ DOY ≤ +1), regardless of the elevation (Figure 6A; light to dark orange color on the map). The outcomes for cv. Touriga Franca in the three sub-regions are as follows: BC (≤+14 Δ DOY ≤ +1), CC (≤+4 Δ DOY ≤ +1) and DS (≤+8 Δ DOY ≤ +1) (Figure 6B; light to dark orange color on the map). On the other hand, asynchrony was also observed when the beginning of the third flight occurred earlier than the date of the veraison on cv. Touriga Nacional in the three sub-regions BC (≤−4 Δ DOY ≤ −1), CC and DS (≤−10 Δ DOY ≤ −1), irrespective to the elevation (Figure 6A; light to dark blue color on the map). For cv. Touriga Franca, the results in two sub-regions are the following: CC and DS (≤−8 Δ DOY ≤ −1) (Figure 6B; light to dark blue color on the map).

3.3.2. Future Period

Anticipating the impact of climate change on the two trophic levels (LB and grapevine) is of high importance. Therefore, predicting possible changes in both trophic levels from simulations obtained by phenology models can help to understand this complex mechanism. Therefore, the future sub-period (2051–2080) in a more severe climate scenario (RCP8.5) was analyzed in greater detail. The results obtained suggest that there may be synchrony (Δ DOY ≅ 0) between the beginning of the third flight and the veraison date (cv. Touriga Nacional and Touriga Franca), at both average and high elevations, mainly in BC and DS (Figure 7A,B; white color on the maps). For asynchrony, the beginning of the third flight is projected to occur earlier than the veraison date in both varieties over most of the region (Figure 7A,B; light to dark blue color on the maps). The difference will be ≤−14 Δ DOY ≤ −1, except in the BC sub-region, which will occur later, mainly at high elevations (≤+4 Δ DOY ≤ +1) (Figure 7A,B; light orange color on the maps). Consequently, at the peak of the same flight, there will be synchrony, mainly at low elevations (along the Douro river) in the CC and DS sub-regions and both varieties (Figure 7C,D; white color on the maps). Lastly, asynchrony is observed over the three sub-regions BC (≤+18 Δ DOY ≤ +1), CC (≤+10 Δ DOY ≤ +1) and DS (≤+14 Δ DOY ≤ +1). In this case, the peak of the flight will occur later about the date of the veraison of the two varieties (Figure 7C,D; light to dark orange color on the maps).
In conclusion, the simulations indicate that the rhythm of LB may be different in comparison to the grapevine phenology under a future climate scenario.

4. Discussion

This study aimed to analyze the impact of climate change on the cycle of grapevine and LB in DDR. Our results indicate that the phenological stages will occur earlier across the region (at a ~1 km resolution) for 2051–2080 under RCP8.5. In this way, the budburst advances up to 14 days, flowering and veraison up to 10 days (mainly at low elevations, along the Douro river). The generalized advancement is valid for both target varieties, cv. Touriga Nacional and Touriga Franca. This analysis is in line with several recent studies, which highlight the impact of climate change on phenology, namely earlier phenological stages and shorter intervals [15,27,30,52,53,54]. Moreover, earlier phenological stages will result in heterogeneity. Earlier budburst and flowering can result in a substantial increase in frost damage risks [30]. Lastly, the climate projections of the grapevine phenological stages provide valid information for medium-long term planning/management [55].
In the three sub-regions, at high elevations, thermal accumulation and phenology advancement is weaker. Thus, for both varieties (cv. Touriga Nacional and Touriga Franca), there was less advancement in the budburst, mainly at high elevations of the CC sub-region. For flowering, no advancement was found for BC and CC (cv. Touriga Nacional with the largest area covered). Finally, for the veraison, there was lower advancement in phenology, mainly at high elevations of the CC sub-region in both varieties. According to Caffarra and Eccel [56], the increase in temperature can make more areas suitable for viticulture at higher elevations, where the climate is currently too cold. However, the suitability of the viticulture areas must be carefully evaluated. In temperate zones, the temperature variations will affect the development of grapevine, which depends at least on local climatic conditions, the cultivated variety and cultural practices.
For LB phenology, a similar statistical methodology was applied to the grapevine. For the first flight, the advancement is up to 14 days for 2051–2080 under RCP8.5 (mainly at low and average elevations in BC and DS). For the second flight, the flight peak advances more than its beginning. The advancement of the peak of the flight is up to 12 days, almost covering the whole region (BC, CC and DS), regardless of the elevation. The third flight experiences the strongest advancement when compared to the other flights. At peak, the advancement can reach 22 days in BC, CC and DS. However, the advancement is smaller at the beginning of the flight, for which it can reach 20 days at low elevations in the three sub-regions. In general, it can be concluded that there is generalized advancement throughout the DDR for the three LB flights, though the third flight undergoes a more significant advancement. The earliness of LB flights in this climate scenario is in line with other previous studies [2,23,57]. According to Reis et al. [22], it was observed that LB phenology advances in the locations evaluated in the DDR. The earliness observed in the three flights in the 2021–2080 period was 7 to 12 days, under RCP4.5, and 15 to 24 days, under RCP8.5, when compared to the historic period (2000–2019). Therefore, that study suggests that a fourth complete flight is likely to occur in the future. However, the number of days with excessively high temperatures (i.e., above the upper threshold for development (>33 °C)), is projected to increase. This may decrease LB populations (in the total number of male catches in the traps/percentage of bunches attacked on the second and third flights/generations) [22] in some warmer zones in DDR.
The simulations obtained by the phenology models (LB and grapevine) suggest that the warm climate will prevent the two trophic levels from developing at the same rhythm in a climatic scenario. The most interesting results regarding the interactions between both trophic levels were between the third flight and the veraison. The simulations suggest that there is synchrony between the beginning of the third flight and veraison in both varieties (Cv. Touriga Nacional and Touriga Franca) for 2051–2080 under RCP8.5. The observed synchrony is mainly in the BC and DS sub-regions at average and high elevations. Another predicted difference compared to the historic period is the peak of the same flight with the veraison date. In this case, the synchronization can occur mainly at low elevations, in the CC and DS sub-regions in both varieties. The projections reveal that a change in the phenology between the two trophic levels can happen under climate change. Our simulations are consistent with other preceding studies [4,58,59,60].

5. Conclusions

This study provides important insights regarding the shifts in phenology in DDR. This evolution is related to (a)synchrony of LB and grapevine in DDR. In addition, this study provides new knowledge at a regional scale and with a medium-long term projection (2051–2080). The projection mainly takes into account the RCP8.5 climate scenario, but the results for RCP4.5 are also provided.
The simulations highlight generalized advancement of the phenological stages (budburst, flowering and veraison), covering the entire region (at an ~1 km resolution) and for both selected varieties. The earliness is greatest in budburst in the sub-period 2051–2080 and under RCP8.5. Regarding the LB phenology, for the same climate scenario and sub-period, there is also generalized advancement of the three flights (beginning and peak), covering the entire region. Furthermore, it is important to note that the third flight is projected to undergo the strongest advancement compared to the others. Therefore, the most interesting interactions in future climate scenarios (RCP8.5) are the third flight (beginning and peak) with the veraison date for both varieties.
Lastly, simulations with phenology models can help to understand the impact of climate change on the phenology of both trophic levels (LB and grapevine). Therefore, future findings should study interactions in more detail at different space and time scales, with the aim of better adaptation of the species.

Supplementary Materials

The following supporting information can be downloaded at: https://www.mdpi.com/article/10.3390/agronomy12010098/s1, Figure S1: Phenology maps for the future period (2051–2080, RCP8.5) covering the entire Douro Demarcated Region. A color scale represents the Julian days (DOY) obtained by the phenology models for each phenological stage, namely budburst (A) and (B), flowering (C) and (D) and veraison (E) and (F). The varieties chosen were cv. Touriga Nacional (left) and Touriga Franca (right). In addition, it is integrated into the Douro river (thick blue line) along with the three sub-regions. Figure S2: Difference between future and historic (RCP4.5) phenology maps covering the entire Douro Demarcated Region. The color scale shows the difference between future and historic (Δ DOY) for each beginning (left) and peak (right) of the flight, namely first (A) and (B), second (C) and (D) and third (E) and (F). In addition, it is integrated into the Douro river (thick blue line) along with the three sub-regions. Figure S3: Phenology maps for the future period (2051–2080, RCP4.5) covering the entire Douro Demarcated Region. The color scale represents the Julian days (DOY) obtained by the phenology models for each beginning (left) and peak (right) of the flight, namely the first (A) and (B), second (C) and (D) and third (E) and (F). In addition, it is integrated into the Douro river (thick blue line) along with the three sub-regions. Figure S4: Phenology maps for the future period (2051–2080, RCP8.5) covering the entire Douro Demarcated Region. The color scale represents the Julian days (DOY) obtained by the phenology models for each beginning (left) and peak (right) of the flight, namely the first (A) and (B), second (C) and (D) and third (E) and (F). In addition, it is integrated into the Douro river (thick blue line) along with the three sub-regions.

Author Contributions

Conceptualization, S.R., J.M., C.C., F.G. and J.A.S., Formal analysis, S.R., J.M., C.C., F.G. and J.A.S., Investigation, S.R., J.M., C.C., F.G. and J.A.S., Methodology, S.R., J.M., C.C., F.G. and J.A.S., Software, S.R., Supervision, C.C., F.G. and J.A.S., Validation, S.R., J.M., C.C., F.G. and J.A.S., Writing—original draft, S.R., J.M., C.C., F.G. and J.A.S., Writing—review and editing, S.R., J.M., C.C., F.G. and J.A.S. All authors have read and agreed to the published version of the manuscript.

Funding

This research was funded by the operation nº NORTE-06-3559-FSE-000067 and by the Clim4Vitis project “Climate change impact mitigation for European viticulture: knowledge transfer for an integrated approach”, funded by European Union’s Horizon 2020 Research and Innovation Programme, under grant agreement nº 810176.

Acknowledgments

The authors also thank ADVID and its members, for providing meteorological and phenological data and for collaborating in the data field collection namely the male catches in sex pheromone traps. The authors from CITAB were also supported by National Funds by FCT—Portuguese Foundation for Science and Technology, under the project UIDB/04033/2020. Fátima Gonçalves is also grateful to the European Social Fund (ESF) through the Regional Operational Program North 2020, within the scope of the Program “Contratação de Recursos Humanos Altamente Qualificados”, Norte-06-3559-FSE-000188 and to the FCT for financial support by national funds FCT/MCTES to CIMO (UIDB/00690/2020).

Conflicts of Interest

The authors declare no conflict of interest. The funders had no role in the design of the study; in the collection, analyses, or interpretation of data; in the writing of the manuscript, or in the decision to publish the results.

References

  1. Castex, V.; Beniston, M.; Calanca, P.; Fleury, D.; Moreau, J. Pest management under climate change: The importance of understanding tritrophic relations. Sci. Total Environ. 2018, 616–617, 397–407. [Google Scholar] [CrossRef] [PubMed]
  2. Reineke, A.; Thiéry, D. Grapevine insect pests and their natural enemies in the age of global warming. J. Pest Sci. 2016, 89, 313–328. [Google Scholar] [CrossRef]
  3. Caffarra, A.; Rinaldi, M.; Eccel, E.; Rossi, V.; Pertot, I. Modelling the impact of climate change on the interaction between grapevine and its pests and pathogens: European grapevine moth and powdery mildew. Agric. Ecosyst. Environ. 2012, 148, 89–101. [Google Scholar] [CrossRef]
  4. Castex, V. The Impact of Climate Change on the Development of Agricultural Pests, Their Hosts and Natural Enemies: Assessing Overlaps in Trophic Interactions. Ph.D. Thesis, Université de Genève, Geneva, Switzerland, 2019. [Google Scholar]
  5. Reis, S.; Fraga, H.; Carlos, C.; Silvestre, J.; Eiras-Dias, J.; Rodrigues, P.; Santos, J.A. Grapevine Phenology in Four Portuguese Wine Regions: Modeling and Predictions. Appl. Sci. 2020, 10, 3708. [Google Scholar] [CrossRef]
  6. Amerine, M.; Winkler, A. Composition and Quality of Musts and Wines of California Grapes. Hilgardia 1944, 15, 493–675. [Google Scholar] [CrossRef] [Green Version]
  7. Pouget, R. Etude du Rhythme végétative: Caractères physiologiques liées à la précocité de débourrement chez la vigne. Ann. Amelior. Plantes 1966, 16, 81–100. [Google Scholar]
  8. Riou, C. The Effect of Climate on Grape Ripening: Application to the Zoning of Sugar Content in the European Community; Office des Publications Officielles des Communautés Européennes: Luxembourg, 1994; p. 322. [Google Scholar]
  9. Hänninen, H. Modelling Bud Dormancy Release in Trees from Cool and Temperate Regions; Society of Forestry in Finland: Helsinki, Finland, 1990; Volume 213. [Google Scholar]
  10. Wang, E.; Engel, T. Simulation of phenological development of wheat crops. Agric. Syst. 1998, 58, 1–24. [Google Scholar] [CrossRef]
  11. Parker, A.K.; Cortazar-Atauri, I.G.; Leeuwen, C.; Chuine, I. General phenological model to characterise the timing of flowering and veraison of Vitis vinifera L. Aust. J. Grape Wine Res. 2011, 17, 206–216. [Google Scholar] [CrossRef]
  12. Duchêne, E.; Huard, F.; Vincent, D.; Schneider, C.; Merdinoglu, D. The challenge of adapting grapevine varieties to climate change. Clim. Res. 2010, 41, 193–204. [Google Scholar] [CrossRef] [Green Version]
  13. Molitor, D.; Caffarra, A.; Sinigoj, P.; Pertot, I.; Hoffmann, L.; Junk, J. Late frost damage risk for viticulture under future climate conditions: A case study for the Luxembourgish winegrowing region. Aust. J. Grape Wine Res. 2014, 20, 160–168. [Google Scholar] [CrossRef]
  14. Cuccia, C.; Bois, B.; Richard, Y.; Parker, A.; Garcia de Cortazar-Atauri, I.; Cornelis, V.; van Leeuwen, C.; Castel, T. Phenological model performance to warmer conditions: Application to Pinot noir in Burgundy. J. Int. Sci. Vigne Vin 2014, 48, 169–178. [Google Scholar] [CrossRef]
  15. Garcia de Cortazar-Atauri, I.; Duchêne, E.; Destrac Irvine, A.; Barbeau, G.; Rességuier, L.; Lacombe, T.; Parker, A.; Saurin, N.; van Leeuwen, C. Grapevine phenology in France: From past observations to future evolutions in the context of climate change. OENO One 2017, 51, 115. [Google Scholar] [CrossRef] [Green Version]
  16. Milonas, P.G.; Savopoulou-Soultani, M.; Stavridis, D.G. Day-degree models for predicting the generation time and flight activity of local populations of Lobesia botrana (Den. & Schiff.) (Lep., Tortricidae) in Greece. J. Appl. Entomol. 2001, 125, 515–518. [Google Scholar]
  17. Carlos, C.; Gonçalves, F.; Oliveira, I.; Torres, L. Is a biofix necessary for predicting the flight phenology of Lobesia botrana in Douro Demarcated Region vineyards? Crop Prot. 2018, 110, 57–64. [Google Scholar] [CrossRef]
  18. Ortega-Lopez, V.; Amo-Salas, M.; Ortiz-Barredo, A.; Diez-Navajas, A.M. Male flight phenology of the European grapevine moth Lobesia botrana (Lepidoptera: Tortricidae) in different wine-growing regions in Spain. Bull. Entomol. Res. 2014, 104, 566–575. [Google Scholar] [CrossRef]
  19. Gutierrez, A.P.; Ponti, L.; Gilioli, G.; Baumgärtner, J. Climate warming effects on grape and grapevine moth (Lobesia botrana) in the Palearctic region. Agric. For. Entomol. 2018, 20, 255–271. [Google Scholar] [CrossRef] [Green Version]
  20. Bale, J.S.; Masters, G.J.; Hodkinson, I.D.; Awmack, C.; Bezemer, T.M.; Brown, V.K.; Butterfield, J.; Buse, A.; Coulson, J.C.; Farrar, J.; et al. Herbivory in global climate change research: Direct effects of rising temperature on insect herbivores. Glob. Chang. Biol. 2002, 8, 531–544. [Google Scholar] [CrossRef]
  21. Honêk, A. Geographical variation in thermal requirements for insect development. EJE 1996, 93, 303–312. [Google Scholar]
  22. Reis, S.; Martins, J.; Gonçalves, F.; Carlos, C.; Santos, J.A. European grapevine moth in the Douro region: Voltinism and climatic scenarios. OENO One 2021, 55, 335–351. [Google Scholar] [CrossRef]
  23. Martín-Vertedor, D.; Ferrero-García, J.; Torres-Vila, L.M. Global warming affects phenology and voltinism of Lobesia botrana in Spain. Agric. For. Entomol. 2010, 12, 169–176. [Google Scholar] [CrossRef]
  24. Kalinkat, G.; Rall, B.C. Effects of Climate Change on the Interactions between Insect Pests and Their Natural Enemies. In Climate Change and Insect Pests; CABI: Wallingford, UK, 2015. [Google Scholar]
  25. Andresen, T.; de Aguiar, F.B.; Curado, M.J. The Alto Douro Wine Region greenway. Landsc. Urban Plan. 2004, 68, 289–303. [Google Scholar] [CrossRef]
  26. Santos, M.; Fonseca, A.; Fraga, H.; Jones, G.; Santos, J.A. Bioclimatic conditions of the Portuguese wine denominations of origin under changing climates. Int. J. Climatol. 2020, 40, 927–941. [Google Scholar] [CrossRef]
  27. Costa, R.; Fraga, H.; Fonseca, A.; García de Cortázar-Atauri, I.; Val, M.C.; Carlos, C.; Reis, S.; Santos, J.A. Grapevine phenology of cv. Touriga franca and Touriga nacional in the Douro wine region: Modelling and climate change projections. Agronomy 2019, 9, 210. [Google Scholar] [CrossRef] [Green Version]
  28. Jones, G. Uma Avaliação do Clima para a Região Demarcada do Douro: Uma análise das condições climáticas do passado, presente e futuro para a produção de vinho. In ADVID—Associação Para o Desenvolvmento da Viticultura Duriense; ADVID—Associação para o Desenvolvmento da Viticultura Duriense: Vila Real, Portugal, 2013; p. 110. [Google Scholar]
  29. ADVID. Impact of Climate Change on the Douro Wine Region: Study Proposal. Association for the Development of Viticulture in the Douro Region. December 2007, ADVID. Available online: www.advid.pt (accessed on 1 October 2021).
  30. Fraga, H.; García de Cortázar Atauri, I.; Malheiro, A.C.; Moutinho-Pereira, J.; Santos, J.A. Viticulture in Portugal: A review of recent trends and climate change projections. OENO One 2017, 51, 61–69. [Google Scholar] [CrossRef] [Green Version]
  31. Fraga, H.; Costa, R.; Santos, J.A. Modelling the Terroir of the Douro Demarcated Region, Portugal. In E3S Web of Conferences; EDP Sciences: Les Ulis, France, 2018; p. 02009. [Google Scholar]
  32. Lorenz, D.H.; Eichhorn, K.W.; Bleiholder, H.; Klose, R.; Meier, U.; Weber, E. Growth Stages of the Grapevine: Phenological growth stages of the grapevine (Vitis vinifera L. ssp. vinifera)—Codes and descriptions according to the extended BBCH scale†. Aust. J. Grape Wine Res. 1995, 1, 100–103. [Google Scholar] [CrossRef]
  33. Baillod, M.; Baggiolini, M. Les stades repères de la vigne. Rev. Suisse Vitic. Arboric. Hortic 1993, 25, 7–9. [Google Scholar]
  34. Gutierrez, A.P.; Ponti, L.; Cooper, M.L.; Gilioli, G.; Baumgärtner, J.; Duso, C. Prospective analysis of the invasive potential of the European grapevine moth Lobesia botrana (Den. & Schiff.) in California. Agric. For. Entomol. 2012, 14, 225–238. [Google Scholar]
  35. Gilioli, G.; Pasquali, S.; Marchesini, E. A modelling framework for pest population dynamics and management: An application to the grape berry moth. Ecol. Model. 2016, 320, 348–357. [Google Scholar] [CrossRef]
  36. Baumgärtner, J.; Gutierrez, A.P.; Pesolillo, S.; Severini, M. A model for the overwintering process of European grapevine moth Lobesia botrana (Denis & Schiffermüller) (Lepidoptera, Tortricidae) populations. J. Entomol. Acarol. Res. 2012, 44, e2. [Google Scholar] [CrossRef] [Green Version]
  37. García de Cortázar-Atauri, I.; Brisson, N.; Gaudillere, J.P. Performance of several models for predicting budburst date of grapevine (Vitis vinifera L.). Int. J. Biometeorol. 2009, 53, 317–326. [Google Scholar] [CrossRef]
  38. Santos, J.A.; Fraga, H.; Malheiro, A.C.; Moutinho-Pereira, J.; Dinis, L.T.; Correia, C.; Moriondo, M.; Leolini, L.; Dibari, C.; Costafreda-Aumedes, S.; et al. A Review of the Potential Climate Change Impacts and Adaptation Options for European Viticulture. Appl. Sci. 2020, 10, 3092. [Google Scholar] [CrossRef]
  39. Cornes, R.C.; van der Schrier, G.; van den Besselaar, E.J.M.; Jones, P.D. An Ensemble Version of the E-OBS Temperature and Precipitation Data Sets. J. Geophys. Res. Atmos. 2018, 123, 9391–9409. [Google Scholar] [CrossRef] [Green Version]
  40. Van den Besselaar, E.J.M.; Haylock, M.R.; van der Schrier, G.; Klein Tank, A.M.G. A European daily high-resolution observational gridded data set of sea level pressure. J. Geophys. Res. Atmos. 2011, 116, D11110. [Google Scholar] [CrossRef] [Green Version]
  41. Hofstra, N.; Haylock, M.R.; New, M.; Jones, P. Testing E-OBS European high-resolution gridded data set of daily precipitation and surface temperature. J. Geophys. Res. Atmos. D Atmos. 2009, 114, D21101. [Google Scholar] [CrossRef]
  42. Fonseca, A.R.; Santos, J.A. High-resolution temperature datasets in Portugal from a geostatistical approach: Variability and extremes. J. Appl. Meteorol. Climatol. 2018, 57, 627–644. [Google Scholar] [CrossRef]
  43. Giorgi, F.; Jones, C.; Asrar, G.R. Addressing climate information needs at the regional level: The CORDEX framework. WMO Bull. 2009, 58, 175–183. [Google Scholar]
  44. Jacob, D.; Petersen, J.; Eggert, B.; Alias, A.; Christensen, O.B.; Bouwer, L.M.; Braun, A.; Colette, A.; Déqué, M.; Georgievski, G.; et al. EURO-CORDEX: New high-resolution climate change projections for European impact research. Reg. Environ. Chang. 2014, 14, 563–578. [Google Scholar] [CrossRef]
  45. Dyrrdal, A.V.; Stordal, F.; Lussana, C. Evaluation of summer precipitation from EURO-CORDEX fine-scale RCM simulations over Norway. Int. J. Climatol. 2018, 38, 1661–1677. [Google Scholar] [CrossRef]
  46. Spinoni, J.; Barbosa, P.; Bucchignani, E.; Cassano, J.; Cavazos, T.; Christensen, J.; Christensen, O.B.; Coppola, E.; Evans, J.; Geyer, B. Future global meteorological drought hot spots: A study based on CORDEX data. J. Clim. 2020, 33, 3635–3661. [Google Scholar] [CrossRef]
  47. Martins, J.; Fraga, H.; Fonseca, A.; Santos, J.A. Climate Projections for Precipitation and Temperature Indicators in the Douro Wine Region: The Importance of Bias Correction. Agronomy 2021, 11, 990. [Google Scholar] [CrossRef]
  48. Welch, B.L. The generalization of ‘student’s’ problem when several different population varlances are involved. Biometrika 1947, 34, 28–35. [Google Scholar] [CrossRef]
  49. Fagerland, M.W.; Sandvik, L. Performance of five two-sample location tests for skewed distributions with unequal variances. Contemp. Clin. Trials 2009, 30, 490–496. [Google Scholar] [CrossRef]
  50. Ruxton, G.D. The unequal variance t-test is an underused alternative to Student’s t-test and the Mann–Whitney U test. Behav. Ecol. 2006, 17, 688–690. [Google Scholar] [CrossRef]
  51. Nagarkatti, S.; Tobin, P.C.; Saunders, M.C. Diapause Induction in the Grape Berry Moth (Lepidoptera: Tortricidae). Environ. Entomol. 2001, 30, 540–544. [Google Scholar] [CrossRef]
  52. Fraga, H.; Santos, J.A.; Moutinho-Pereira, J.; Carlos, C.; Silvestre, J.; Eiras-Dias, J.; Mota, T.; Malheiro, A.C. Statistical modelling of grapevine phenology in Portuguese wine regions: Observed trends and climate change projections. J. Agric. Sci. 2015, 154, 795–811. [Google Scholar] [CrossRef] [Green Version]
  53. Droulia, F.; Charalampopoulos, I. Future Climate Change Impacts on European Viticulture: A Review on Recent Scientific Advances. Atmosphere 2021, 12, 495. [Google Scholar] [CrossRef]
  54. Morales-Castilla, I.; García de Cortázar-Atauri, I.; Cook, B.I.; Lacombe, T.; Parker, A.; van Leeuwen, C.; Nicholas, K.A.; Wolkovich, E.M. Diversity buffers winegrowing regions from climate change losses. Proc. Natl. Acad. Sci. USA 2020, 117, 2864–2869. [Google Scholar] [CrossRef] [PubMed]
  55. Tomasi, D.; Jones, G.V.; Giust, M.; Lovat, L.; Gaiotti, F. Grapevine Phenology and Climate Change: Relationships and Trends in the Veneto Region of Italy for 1964–2009. Am. J. Enol. Vitic. 2011, 62, 329–339. [Google Scholar] [CrossRef]
  56. Caffarra, A.; Eccel, E. Projecting the impacts of climate change on the phenology of grapevine in a mountain area. Aust. J. Grape Wine Res. 2011, 17, 52–61. [Google Scholar] [CrossRef]
  57. Taylor, R.A.J.; Herms, D.A.; Cardina, J.; Moore, R.H. Climate change and pest management: Unanticipated consequences of trophic dislocation. Agronomy 2018, 8, 7. [Google Scholar] [CrossRef] [Green Version]
  58. Damien, M.; Tougeron, K. Prey–predator phenological mismatch under climate change. Curr. Opin. Insect Sci. 2019, 35, 60–68. [Google Scholar] [CrossRef] [PubMed]
  59. Stange, E.E.; Ayres, M.P. Climate change impacts: Insects. In Encyclopedia of Life Sciences (ELS); John Wiley & Sons, Ltd.: Chichester, UK, 2010. [Google Scholar]
  60. Schweiger, O.; Settele, J.; Kudrna, O.; Klotz, S.; Kühn, I. Climate change can cause spatial mismatch of trophically interacting species. Ecology 2008, 89, 3472–3479. [Google Scholar] [CrossRef] [PubMed]
Figure 1. (A) Map with the geographical location of Portugal (orange), as well as the Douro Demarcated Region (red). (B) Douro Demarcated Region map with its three sub-regions: Baixo Corgo (BC, left side, continuous line), Cima Corgo (CC, middle, long line) and Douro Superior (DS, right side, broken line). The Douro River and other main watercourses are also represented. Elevation at an ~1 km grid resolution is also displayed.
Agronomy 12 00098 g001
Figure 2. Phenology maps for the historic period (1989–2015) covering the entire Douro Demarcated Region. A color scale represents the Julian days (DOY) obtained by the phenology models for each phenological stage, namely budburst (A,B), flowering (C,D) and veraison (E,F) of the varieties cv. Touriga Nacional (left) and Touriga Franca (right). The Douro river and main tributaries are also outlined (thick blue line).
Agronomy 12 00098 g002
Figure 3. Difference between future and historic (RCP8.5) phenology maps covering the entire Douro Demarcated Region. A color scale represents the differences between future and historic (Δ DOY) for each phenological stage, namely budburst (A,B), flowering (C,D) and veraison (E,F) in the varieties cv. Touriga Nacional (left) and Touriga Franca (right). The Douro river and main tributaries are also outlined (thick blue line).
Agronomy 12 00098 g003
Figure 4. Phenology maps for the historic period (1989–2015) covering the entire Douro Demarcated Region. The color scale represents the Julian days (DOY) obtained by the phenology models for each beginning (left) and peak (right) of the flight, namely the first (A,B), second (C,D) and third (E,F). In addition, the Douro river and main tributaries are also outlined (thick blue line).
Agronomy 12 00098 g004
Figure 5. Difference between future and historic (RCP8.5) phenology maps covering the entire Douro Demarcated Region. The color scale shows the difference between future and historic (Δ DOY) for each beginning (left) and peak (right) of the first (A,B), second (C,D) and third (E,F) flights. In addition, the Douro river and main tributaries are also outlined (thick blue line).
Agronomy 12 00098 g005
Figure 6. Phenology maps for the historic period (1989–2015) covering the entire Douro Demarcated Region. The color scale shows the difference between Lobesia botrana flight and grapevine (Δ DOY), namely third flight with veraison. In addition, the varieties under study are represented, cv. Touriga Nacional left; (A) and Touriga Franca right; (B). Lastly, the Douro river and main tributaries are also outlined (thick blue line).
Agronomy 12 00098 g006
Figure 7. Phenology maps for the future period (2051–2080, RCP8.5) covering the entire Douro Demarcated Region. The color scale shows the difference between Lobesia botrana flight and grapevine (Δ DOY), namely third flight with veraison. In addition, the varieties under study are represented, cv. Touriga Nacional left; (A,C) and Touriga Franca right; (B,D). Lastly, the Douro river and main tributaries are also outlined (thick blue line).
Agronomy 12 00098 g007
Publisher’s Note: MDPI stays neutral with regard to jurisdictional claims in published maps and institutional affiliations.

