Article

Effect of Magnesium Fertilization Systems on Grain Yield Formation by Winter Wheat (Triticum aestivum L.) during the Grain-Filling Period

by
Witold Grzebisz
* and
Jarosław Potarzycki
Department of Agricultural Chemistry and Environmental Biogeochemistry, Poznan University of Life Sciences, Wojska Polskiego 28, 60-637 Poznan, Poland
*
Author to whom correspondence should be addressed.
Agronomy 2022, 12(1), 12; https://doi.org/10.3390/agronomy12010012
Submission received: 26 November 2021 / Revised: 14 December 2021 / Accepted: 17 December 2021 / Published: 22 December 2021

Abstract

:
The application of magnesium significantly affects the components of the wheat yield and the dry matter partitioning in the grain-filling period (GFP). This hypothesis was tested in 2013, 2014, and 2015. A two-factorial experiment with three rates of magnesium (0, 25, 50 kg ha−1) and four stages of Mg foliar fertilization (without, BBCH 30, 49/50, two-stage) was carried out. Plant material collected at BBCH: 58, 79, 89 was divided into leaves, stems, ears, chaff, and grain. The wheat yield increased by 0.5 and 0.7 t ha−1 in response to the soil and foliar Mg application. The interaction of both systems gave + 0.9 t ha−1. The Mg application affected the grain yield by increasing grain density (GD), wheat biomass at the onset of wheat flowering, durability of leaves in GFP, and share of remobilized dry matter (REQ) in the grain yield. The current photosynthesis accounted for 66% and the REQ for 34%. The soil-applied Mg increased the REQ share in the grain yield to over 50% in 2014 and 2015. The highest yield is possible, but provided a sufficiently high GD, and a balanced share of both assimilate sources in the grain yield during the maturation phase of wheat growth.

1. Introduction

Progressive growth in the human population is a fact, and it will reach at least nine billion by 2050 [1]. The food gap can be covered by several actions, but the most important and effective are both the increase in yields of crops, and area of arable soils. In the past, the first factor was responsible for 55–60% increase in the food production [2]. Wheat is one of the most important crops in the world that can cover the food gap. Grain is used as the staple source for production of bread [3]. The yielding potential of this crop is high. The world record, set in New Zealand in 2020, is 17.398 t ha−1 [4]. The wheat yield potential assessed for the leading producers in Europe, such as Ireland, Germany, and France, is at the level of 12.7, 11.1, and 9.9 t ha−1 [5]. The actual yields for these countries are lower, and for 2015–2019, amounted to 9.65 ± 0.86, 6.92 ± 1.03, and 7.49 ± 0.52 t ha−1, respectively. The world average yield of wheat is drastically lower and amounts to only 3.2 t ha−1 [6]. It can be, therefore, concluded that the exploration of the yielding potential of wheat on a global scale is not sufficient.
The grain yield of wheat is the result of two basic elements of the yield structure, i.e., the number of grains per unit area (grain density, acronym—GD) and the weight of grains, expressed as 1000 grain weight (TGW). Grain density is an aggregate yield parameter, defined by basic yield structure components such as ear density (ED) and grain number per ear (GR) [7]. The number of fertile flowers per plants develops during a long period of an ear development. This process is the most intensive in the boot phase (BBCH 40–49). The partition of assimilates, necessary for the balanced growth of vegetative (leaves and stems) and reproductive wheat organs (spike), is a prerequisite for a high grain yield. In this phase, it should be 50:50 [8]. The increase in the yield wheat, and cereals in general, is a derivative of the improvement of this particular yield trait. Most of the study related to breeding of new wheat varieties stresses that GD is the yield trait decisive for the grain yield increase [9,10]. At the same time, it was observed that GD is highly sensitive to environmental conditions, including not only weather, but also supply of nitrogen to plants in critical stages of yield formation [11,12,13]. Grain growth begins approximately 12 days after the beginning of flowering [7,14]. The final TGW is a result of the rate of carbohydrate accumulation in the enlarging grain and the length of the grain-filling phase (GFP) [9]. The key environmental factor influencing the TGW is the temperature during the GFP. Its increase, on the one hand, increases the rate of carbohydrate transport to enlarging grains, and on the other hand, it shortens the activity of leaves, producing assimilates [15]. The ear weight at the end of wheat heading, just before flowering, is used by breeders as an important indicator of the potential grain density [13,16]. This particular period of wheat growth is, therefore, decisive for wheat grain yield. In practice, the utilization of the yield potential of wheat by a farmer depends on two sets of factors. The first is the yield potential of the variety. The second set of factors is closely related to the environmental and agronomic conditions, which affect partitioning of assimilates between those organs, which are responsible for GD [13,17,18].
The growth rate of grains, as the factor determining the grain yield, depends on two sources of carbohydrate. The first, known as current photosynthesis (CP), concerns the actual photosynthetic activity of physiologically active parts of the plant. The second one, termed as remobilization, concerns the carbohydrate reserves accumulated by the plant in the vegetative parts during the preflowering stages of its growth. The share of remobilized assimilate reserves in the final grain weight ranges from about 20% (5–25%) under optimal conditions to as much as 60% under stressful growth conditions [19,20]. High temperature and simultaneous drought during the grain-filling period are the key environmental factors accelerating the grain growth rate. At the same time, they reduce the activity and longevity of leaves and ears, leading finally to TGW decrease [21,22,23,24].
The existence of the yield gap, regardless of the scale of the assessed area, i.e., field, farm, region, or country, clearly indicates the presence of factors, limiting the use of the yielding potential of wheat. The essence of the farmer’s use of the production potential of modern wheat varieties is the high efficiency of two key factors, i.e., water and nitrogen, which are not complementary [25]. Water productivity is a good indicator of the wheat yield gap [26]. In Ireland, the actual productivity of water is 1.89 kg m−3, and the potential is 2.53 kg m−3. In Poland, these two values are 1.04 and 1.49 kg m−3, respectively. The yield gap based on water productivity is 0.43 t ha−1 and 5.23. t ha−1 for both these two countries, respectively. These two figures clearly show the presence of coarse and fine factors, limiting efficiency of these two mega-drives to the grain yield of wheat.
The production of wheat on suitable soil, i.e., requiring a fine modulation of its fertility, largely depends on the management of three main nutrients, i.e., nitrogen (N), phosphorus (P), and potassium (K). In such cases, the nutritional status of the wheat can be effectively controlled, based on the concept of the fertilizer management principles [27]. This concept is based on determining the correct (i) dose, (ii) time, (iii) source, and (iv) a method of fertilizer application. In fact, based on the in-season development of wheat yield components, these rules apply to nitrogen. There are numerous scientific papers explaining the response of wheat to each of these four operational measures of nitrogen fertilization management [28,29].
The yield stagnation is observed in the leading wheat producers, irrespective of the world region [2,30]. Regression models, such as quadratic or quadratic-plateau, are often used to determine the response of the wheat yield to N doses. Both models can signal and even determine the appearance of an ineffective range of N fertilizer applied. This yield gap can be, at least partially, covered by a balanced supply of P and K. It does not depend, however, on the direct application of these nutrients, but on the level of soil fertility [31,32]. The productivity of fertilizer nitrogen in wheat also depends on the nutritional status of the plant with other nutrients [33]. One of them is magnesium [34]. The effect of Mg application to cereals, as shown by a meta-analysis by Wang et al. [35], reached 8.2%, being, however, significantly lower compared to grasses (10.6%), and especially to fruits (12.5%).
The aim of the study was to evaluate the effect of the magnesium fertilization system on the grain yield and grain yield components of wheat, against the background of its impact on the partitioning of dry matter in the period of grain formation and filling.

2. Materials and Methods

2.1. Experimental Site

A field experiment was carried out at Jarosławiec (52°15′ N, 17°32′ E, Poland) on soil originated from sandy loam, classified as Albic Luvisols (Neocambic) [36]. The content of organic matter (Corg) in a 0.0–0.3 m layer ranged during the study from 21 ± 0.1 to 25 ± 0.9 g kg−1 soil (losses on ignition). Soil reaction (pH) was in the neutral range (1 M KCl). The content of available nutrients, measured before the application of fertilizers, was in general good for P and sufficient for K and Mg. The amount of the mineral N (Nmin) determined in a 0.0–0.9 m layer was high in the first two growing seasons, and medium in the third (Table 1).

2.2. Weather Conditions

The weather conditions were very variable in the consecutive growing seasons (Figure 1). The beginning of spring, with the exception of 2012/2013, favored the growth of wheat. In 2013, negative temperatures in the first two decades of March stopped plant growth. In all years of study, temperatures during the flowering and grain filling were within the ranges optimal for the yield development. The sum of rainfall during the spring growing season was as follows: 2013—299.4 mm, 2014—285.2 mm, and 2015—265 mm. In 2015, a shortage of rainfall was revealed, which covered three main phases of wheat development, ranging from shooting to early flowering. The sum of rainfall in this period was 37.6 mm, while in 2013 it reached 88.8 mm, and in 2014, 92.6 mm.

2.3. Experimental Design

The field experiment was arranged as a two-factor split-plot design, replicated four times:
(1)
Soil-applied magnesium (Mgs): 0, 25, 50 kg Mg ha−1.
(2)
Foliar-applied magnesium (Mgf):
a.
Without application.
b.
Applied at the BBCH 30 stage (I).
c.
Applied at the BBCH 49/50 stage (II),
d.
Double-stage application (I + II).
The spring barley was the forecrop for winter wheat. The Tobak wheat variety was sown annually on 20–25 September. The soil was fertilized with magnesium in the form of kieserite (MgSO4 H2O), containing 25% MgO and 50% SO3. Kieserite was applied into the soil three weeks before wheat sowing. Foliar fertilization of wheat with Mg was carried out, using Epsom salt (MgSO4 H2O) containing 16% MgO and 37.5% SO3. The amounts of the applied nutrients are shown in Table 2. The sulfur applied together with the magnesium fertilizers was balanced in the first dose of N. It was used as a mixture of ammonium sulfate and ammonium saltpeter (17.5% SO3). The first N dose of 80 kg ha−1 was applied just before the beginning of the growing season in spring. The second dose of 50 kg ha−1 was applied at BBCH 30/31, and the third one of 60 kg ha−1 at BBCH 45–47. Phosphorus at a rate of 30.1 kg P ha−1 as triple superphosphate (46% P2O5) and K at a rate of 66.4 kg K ha−1 as muriate of potash (KCl) were applied together with the soil magnesium. The total area of a single plot was 30 m2 with a harvested area of 15 m2. Plant protection was conducted in accordance with the codex of good practice.

2.4. Plant Material Sampling and Analysis

The plant material used for dry matter determination was collected at BBCH 58, BBCH 79, and BBCH 89 from an area of 2.0 m2. The sampled material was then divided, depending on the wheat stage, into subsamples of leaves (LE), stems (ST), ears (EA), chaffs (CH), and grain (G). The results are expressed on a dry weight basis.

2.5. Calculated Parameters

The following set of plant parameters was calculated:
  • Dry matter remobilization quota (REQ):
    a.
    REQ79 = TB58 – TBv79, t ha−1.
    b.
    REQ79–89 = TBv79 – TBv89, t ha−1.
    c.
    REQ89 = TB58 – TBv89, t ha−1.
  • Dry matter remobilization efficiency (ReE):
    a.
    ReE79 = REQ79/TB58, %.
    b.
    ReE79–89 = REQ79/TBv79, %.
    c.
    ReE89 = REQ89/TB58, %.
  • Contribution of remobilized dry matter in the grain yield (ReG):
    a.
    ReG79 = REQ79/GY79, %.
    b.
    ReG79–89 = REQ79/ΔGT79–89, %.
    c.
    ReG79 = REQ89/GY89, %.
  • Current photosynthesis (CP):
    a.
    CP79 = TB79 – TB58, t ha−1.
    b.
    CP79–89 = TB89 – TB79, t ha−1.
    c.
    CP89 = TB89 – TB58, t ha−1.
  • Efficiency of current photosynthesis (CPE):
    a.
    CPE79/TB58, %.
    b.
    CPE79–89/TB79, %.
    c.
    CPE89/TB58, %.
  • Contribution of current photosynthesis to the grain yield (CPG):
    a.
    CPG79 = CP79/GY79, %.
    b.
    CPG79–89 = CP79/ΔGY79, %.
    c.
    CPG79 = CP79/GY89, %.
where
  • TB58—dry matter (leaves + stem + ear) yield of wheat at BBCH 58, t ha−1 DW.
  • TBv79—dry matter (leaves + stem + chaffs) yield of wheat at BBCH 79, t ha−1 DW.
  • GY79—dry matter yield of grain at BBCH 79, t ha−1 DW.
  • TB79—total dry matter (leaves + stem + chaffs + grain) yield of wheat at BBCH 79, t ha−1 DW.
  • TBv89—dry matter (leaves + stem + chaffs) yield of wheat at BBCH 79, t ha−1 DW.
  • ΔGY89—dry matter yield of grain at BBCH 79–89, t ha−1 DW.
  • GY89—dry matter yield of grain at BBCH 79, t ha−1 DW.
  • TB89—total dry matter (leaves + stem + chaffs + grain) yield of wheat at BBCH 79, t ha−1 DW.

2.6. Statistical Analysis

The collected data were subjected to an analysis of variance using STATISTICA® 13 (StatSoft, Inc., Krakow, Poland 2013). The distribution of the data (normality) was checked using the Shapiro–Wilk test. The homogeneity of variance was checked by the Bartlett test. Means were separated by honest significant difference (HSD) using Tukey’s method, when the F-test indicated significant factorial effects at the level of p < 0.05. To determine the wheat grain yield, stepwise regression was used to define the optimal set of wheat components. In the computational procedure, a consecutive variable was removed from the multiple regressions in a step-by-step manner. The best regression model was chosen based on the highest F-value for the model and the significance of all variables.

3. Results

3.1. Grain Yield and Yield Structure

The wheat grain yield significantly resulted from the interaction of magnesium fertilization systems (MgFs), regardless of the course of the weather in the subsequent years of the study (Table 3). The interaction between magnesium fertilization systems (Mg application) was very specific (Figure 2). Soil-applied Mg, irrespective of its dose, resulted in a significant increase in the yield, reaching 5–6% (+0.5 t ha−1) compared to the Mg-control plot, i.e., fertilized only with NPK. The net effect of magnesium foliar fertilization (Mg-FF) was the highest on the Mg-control plot. On this particular plot, due to foliar application of Mg, the grain yield increased by 6–7% compared to the Mg-absolute control (+0.7 t ha−1). The interaction of the soil Mg application and the double-stage Mg-FFs resulted in a further yield increase. The significant effect of this system of Mg fertilization was the strongest on the plot fertilized with both 50 kg Mg ha−1 and Mg-FF at BBCH 30 and repeated at BBCH 49/50. The relative increase in the yield compared to the Mg-absolute control was 10% (0.92 t ha−1).
Out of the four examined yield components, the only thousand grain weight (TGW) did not respond to the interaction of experimental factors and years (Table 3). A significant increase in TGW resulted from Mg-FF at BBCH 49/50 or its two-stage application. A significantly higher TGW was recorded in 2013 compared to other years of the study. This yield component was negatively correlated with the grain yield (Table A1). It also showed negative relationships with other yield components. Ears’ density (ED) was the only yield component that significantly responded to the interaction of years and magnesium fertilization systems (Mg-FSs), but without a dominant impact on the grain yield (Table A1). The number of grain per ear (GR) affected the grain yield, but was not the component, which can be used for the grain yield diagnosis. Grain density (GD), which responded to the interaction of both magnesium fertilization systems, was revealed as the best indicator of the grain yield. The dependence obtained is presented below:
GY = 0.0138 GD2 + 0.879 GD − 2.828 for n = 36, R2 = 0.95, and p ≤ 0.01
The obtained equation clearly shows that each unit increase in GD to 31.84 × 1000 grain per m2 resulted in a progressive increase in the yield to a maximum of 11.169 t ha−1.

3.2. Wheat Biomass Structure during the Grain-Filling Period

The structure of wheat biomass was investigated in three well-defined stages of this crop growth, i.e., the end of heading (BBCH 58), the end of the milk stage (BBCH 79), and at maturity (BBCH 89) [37]. Based on the stepwise regression analysis, it was found that the leaf biomass at BBCH 58 was the best single grain yield indicator from among 14 examined biomass components (Table A1). The regression model obtained is as follows:
GY = 1.706LE58 + 5.046 for n = 36, R2 = 0.82, and p ≤ 0.01
The year was, in fact, the dominant factor that significantly affected the variability in the leaf biomass at BBCH 58 (Table 4, Figure 3). The highest biomass, averaged for experimental treatments, was recorded in 2014. It was 78% and 18% higher than in 2013 and 2015. For comparison, the difference in the grain yield was only 29% and 13%, respectively. The effect of Mg-FSs on this wheat trait was clear, but, at the same time, very diverse in the subsequent years of study. Every year, the most significant response of leaf biomass to Mg application was found on the plot fertilized with 25 kg Mg ha−1. In 2013, the highest leaf biomass was recorded on the plot with Mg-FF at the BBCH 49/50 stage, but the differences between treatments were low. In the other two years, the maximum biomass was recorded on a plot with a two-stage Mg-FF, i.e., at BBCH 30, and repeated at BBCH 49/50. A significant response of leaf biomass response to Mg-FF was also recorded on the Mg-soil control in 2015. On the other hand, Mg-FF on the main plot fertilized with 50 kg Mg ha−1 caused a reduction in the leaf biomass compared to the Mg-soil control.
In-season grain yield of wheat, as determined at the BBCH 79 stage, significantly responded to the interaction of both experimental factors and years (Table 4, Figure 4). The weather course was the main factor affecting the yield. The highest yield recorded in 2015 was 11.5% higher compared to 2014 and 27.3% compared to 2013. The impact of Mg application was very different in the studied years. In 2013, Mg-FSs, in general, led to yield reduction. This dominant, but negative, trend in response to soil-applied Mg was weakened by Mg-FF at BBCH 30. In 2014, the significant grain yield increase in response to Mg application was recorded only on the Mg-soil control. The interactional effect of both Mg-FSs was revealed on the plot treated with 25 kg Mg ha−1, showing a slight increase in grain yield. In 2015, the interactional effect of Mg-FSs was recorded on the plot treated with 50 kg Mg ha−1 and Mg-FF at BBCH 49/50. In other main plots, Mg applied to the wheat foliage resulted in a reduction in the wheat grain yield, compared to the corresponding Mg-controls.
The grain yield in the BBCH 79 stage of wheat development showed significant relationships with the biomass of all parts of wheat at BBCH 58. Stepwise regression analysis showed that the effect of chaff biomass on the yield can only be assessed together with the leaf biomass. The yield wheat grain at BBCH 79 was positively correlated with the leaf biomass, and at the same time was negatively correlated with the chaff biomass:
GY79 = 6.148 + 0.88LE58 − 0.305CH79 for n = 36, R2 = 0.62, and p ≤ 0.01
Leaf biomass was highly stable over the period, ranging from BBCH 58 to BBCH 79 (Table 4). In this period of wheat development, a slight increase in the leaf biomass in 2013 and a significant decrease in the remaining years of study were noted. The observed decrease was most evident in 2014 on the plot with 25 kg Mg ha−1. Ear biomass showed a deep decrease during this period, but only in 2014 and 2015, amounting to 0.36 and 1.66 t ha−1. Stem biomass in this particular period increased significantly in 2013, while it decreased substantially in the other two years. This decrease was particularly large in 2014, when it amounted to 1.68 t ha−1. The wheat GY79 was positively and significantly correlated with ED (+0.83 ***), but at the same time negatively with TGW (−0.73 ***). The same pattern of relationships was observed for biomass in all wheat organs at BBCH 58 and leaf biomass at BBCH 79, but not for stem and chaff biomass at the latter stage (Table A1).
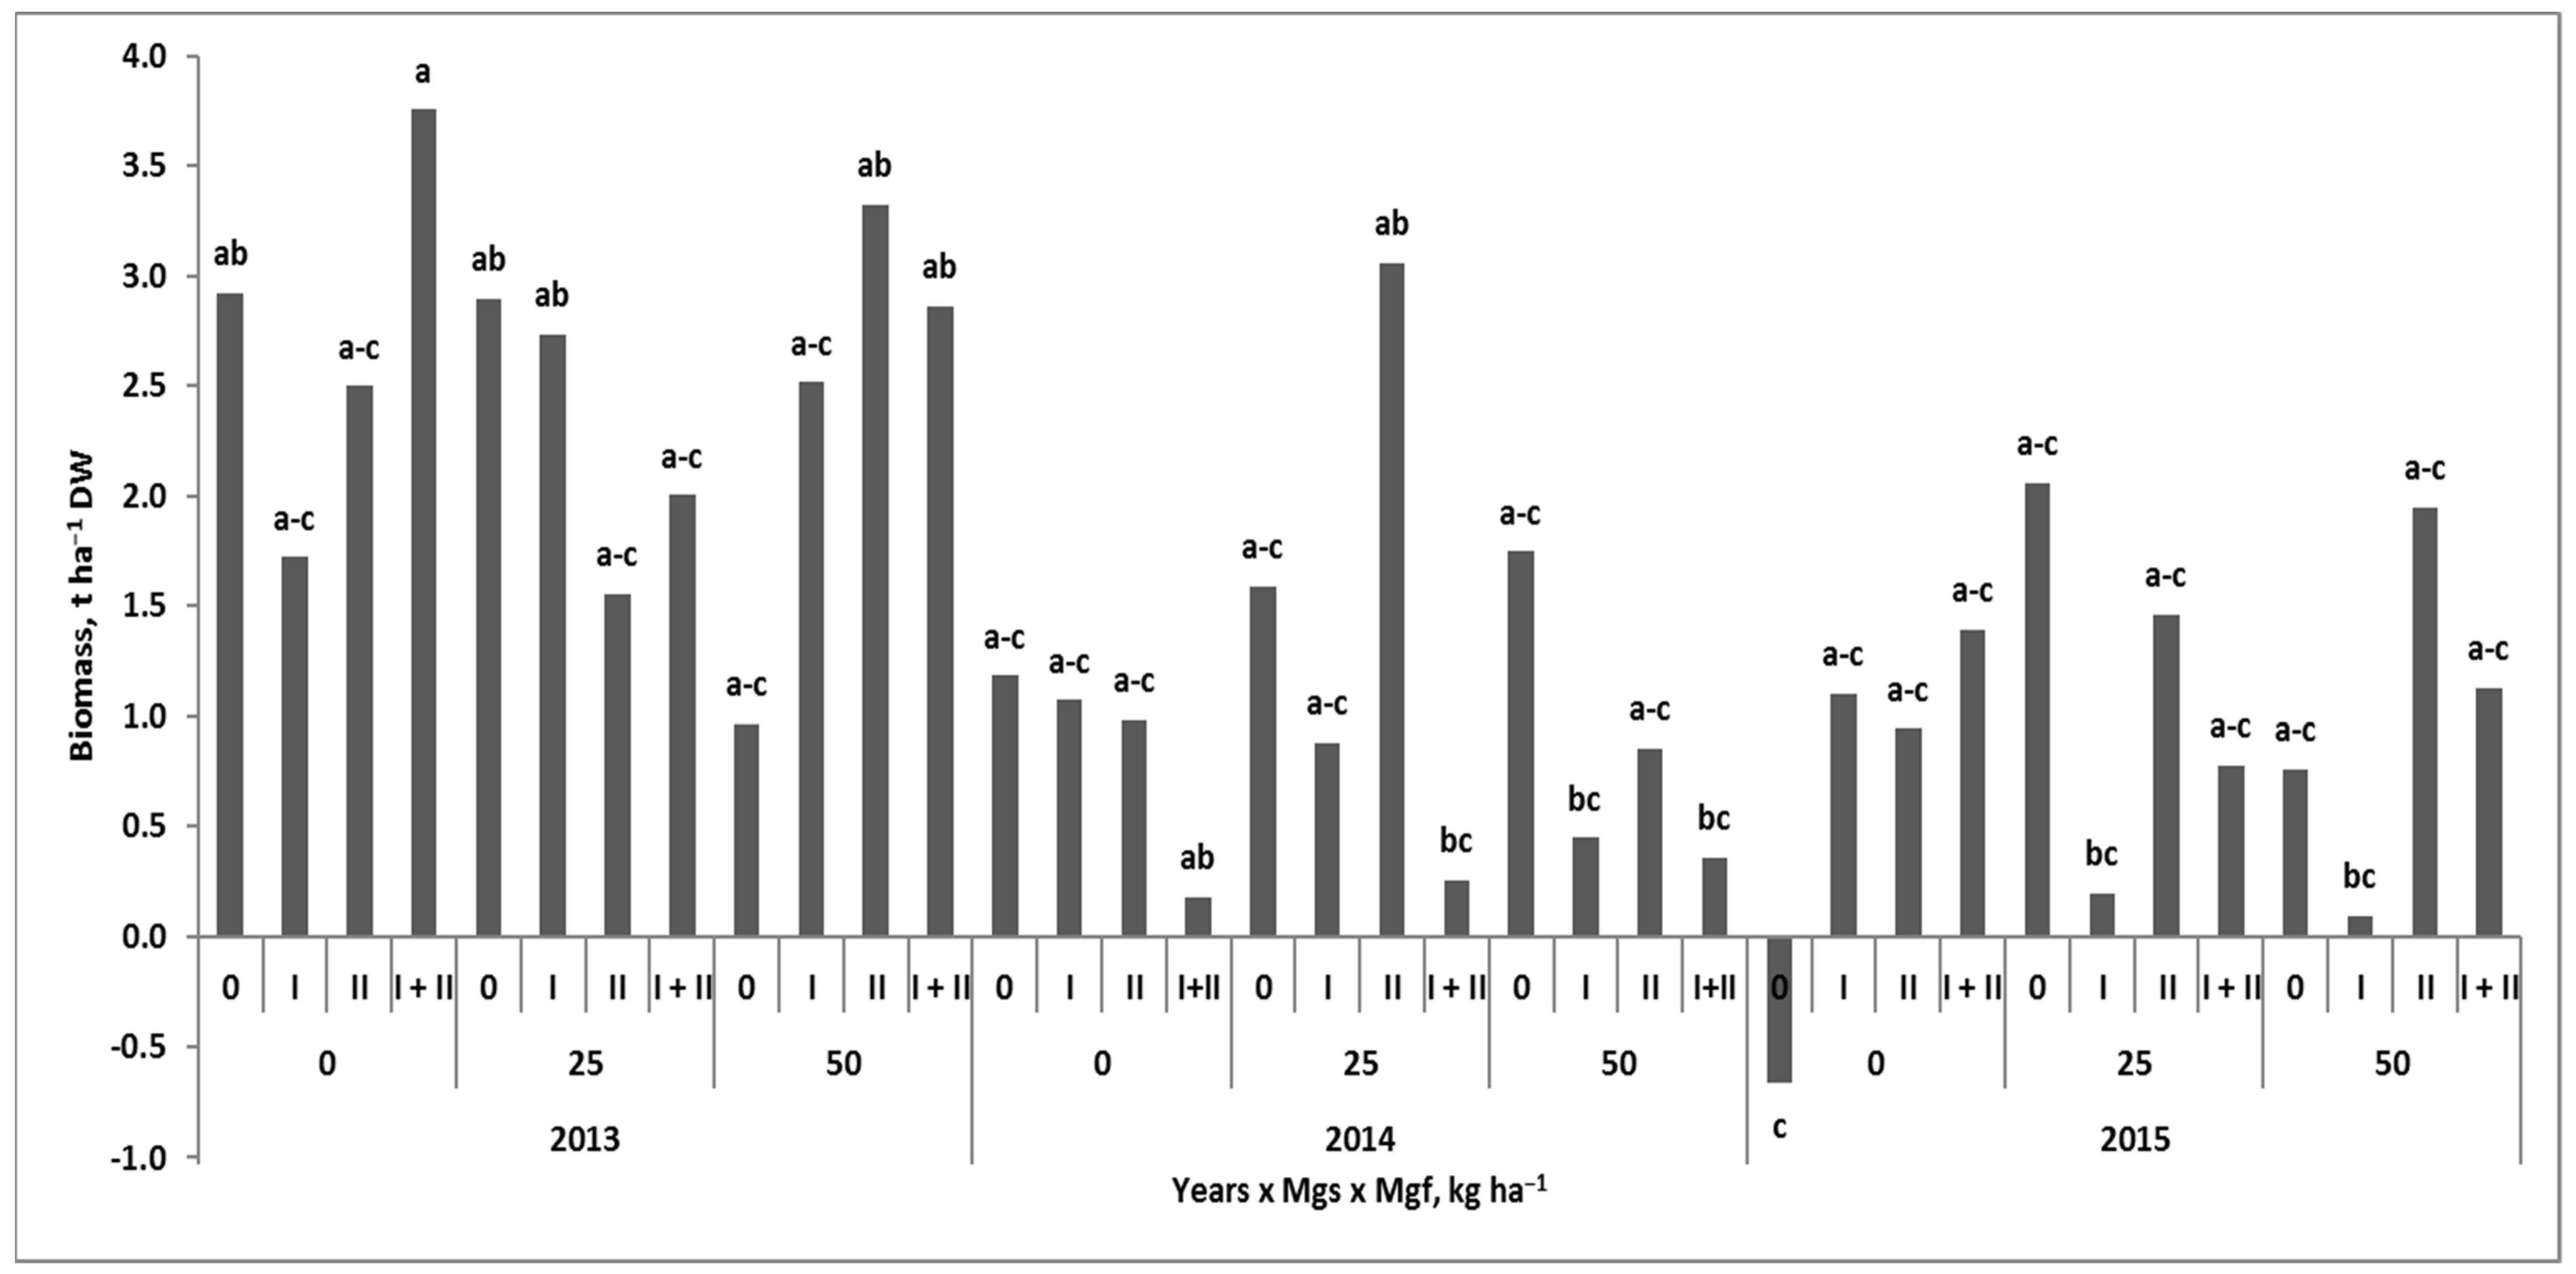
The grain yield increased until the wheat was mature. The recorded increase in the yield in the maturation phase of wheat growth, defined as dGY89, was significantly dependent on the interaction of all factors (Table 4). The effect of Mg-FSs on dGY89 was most pronounced in 2014 (Figure 5). In this particular year, dGY89, averaged over the examined Mg-FSs, was two-, and almost six-fold higher than in 2013 and 2015, respectively. In 2014, the effect of soil-applied Mg was progressive, but slight. The strongest increase in dGY79 was recorded on the Mg-control and the main plot fertilized with 25 kg Mg ha−1, and simultaneously treated with Mg in a double Mg-FF system.
On the plot with 50 kg Mg ha−1, the best Mg-FF effect was achieved at BBCH 30 or 49/50. In 2013, the effect of the soil-applied Mg increased along its dose. The actual increase in the yield on the Mg-control plot was highest on the Mg-FF-BBCH 49/50 plot. The interactional effect of both Mg-FSs was the best on the plot with 25 kg Mg ha−1. The highest dGY89 was recorded on the Mg-FF at BBCH 49/50. No effect of Mg-FF was observed on the plot treated with 50 kg Mg ha−1. In 2015, the effect of the soil-applied Mg on dGY89 was low. The best effect of Mg-FF was observed, regardless on the stage of its application, on the Mg-soil control plot. The positive effect of Mg-FF on the plots with soil-applied Mg was very diverse, depending on the stage of application. It should be emphasized that the number of grains per ear (GE) and grain density (GD) had a positive effect on the increase in the wheat grain yield during the maturation phase. The first component was decisive, determining the value of dGY89:
dGY89 = 0.154 GE − 4.436 for n = 36, R2 = 0.81, and p ≤ 0.1

3.3. Indices of Dry Matter Management by Wheat during the Grain-Filling Period

The yield of wheat grain depends on two sources of assimilates. The first concerns the amount of dry matter remobilized from the vegetative organs of wheat during its post-flowering growth. The second source is the current photosynthesis of physiologically active parts of the plant [38]. The yield-forming role of both sources was assessed on the basis of two time intervals of wheat growth. In the first calculation procedure, the studied period covered the entire post-flowering period, i.e., from BBCH 58 to BBCH 89. In the second procedure, the intermediate phases of wheat grain yield development were studied. The period from BBCH 58 to BBCH 79 included the phases responsible for grain expansion. The second, from BBCH 79 to BBCH 89, covered the grain maturation phase [37].
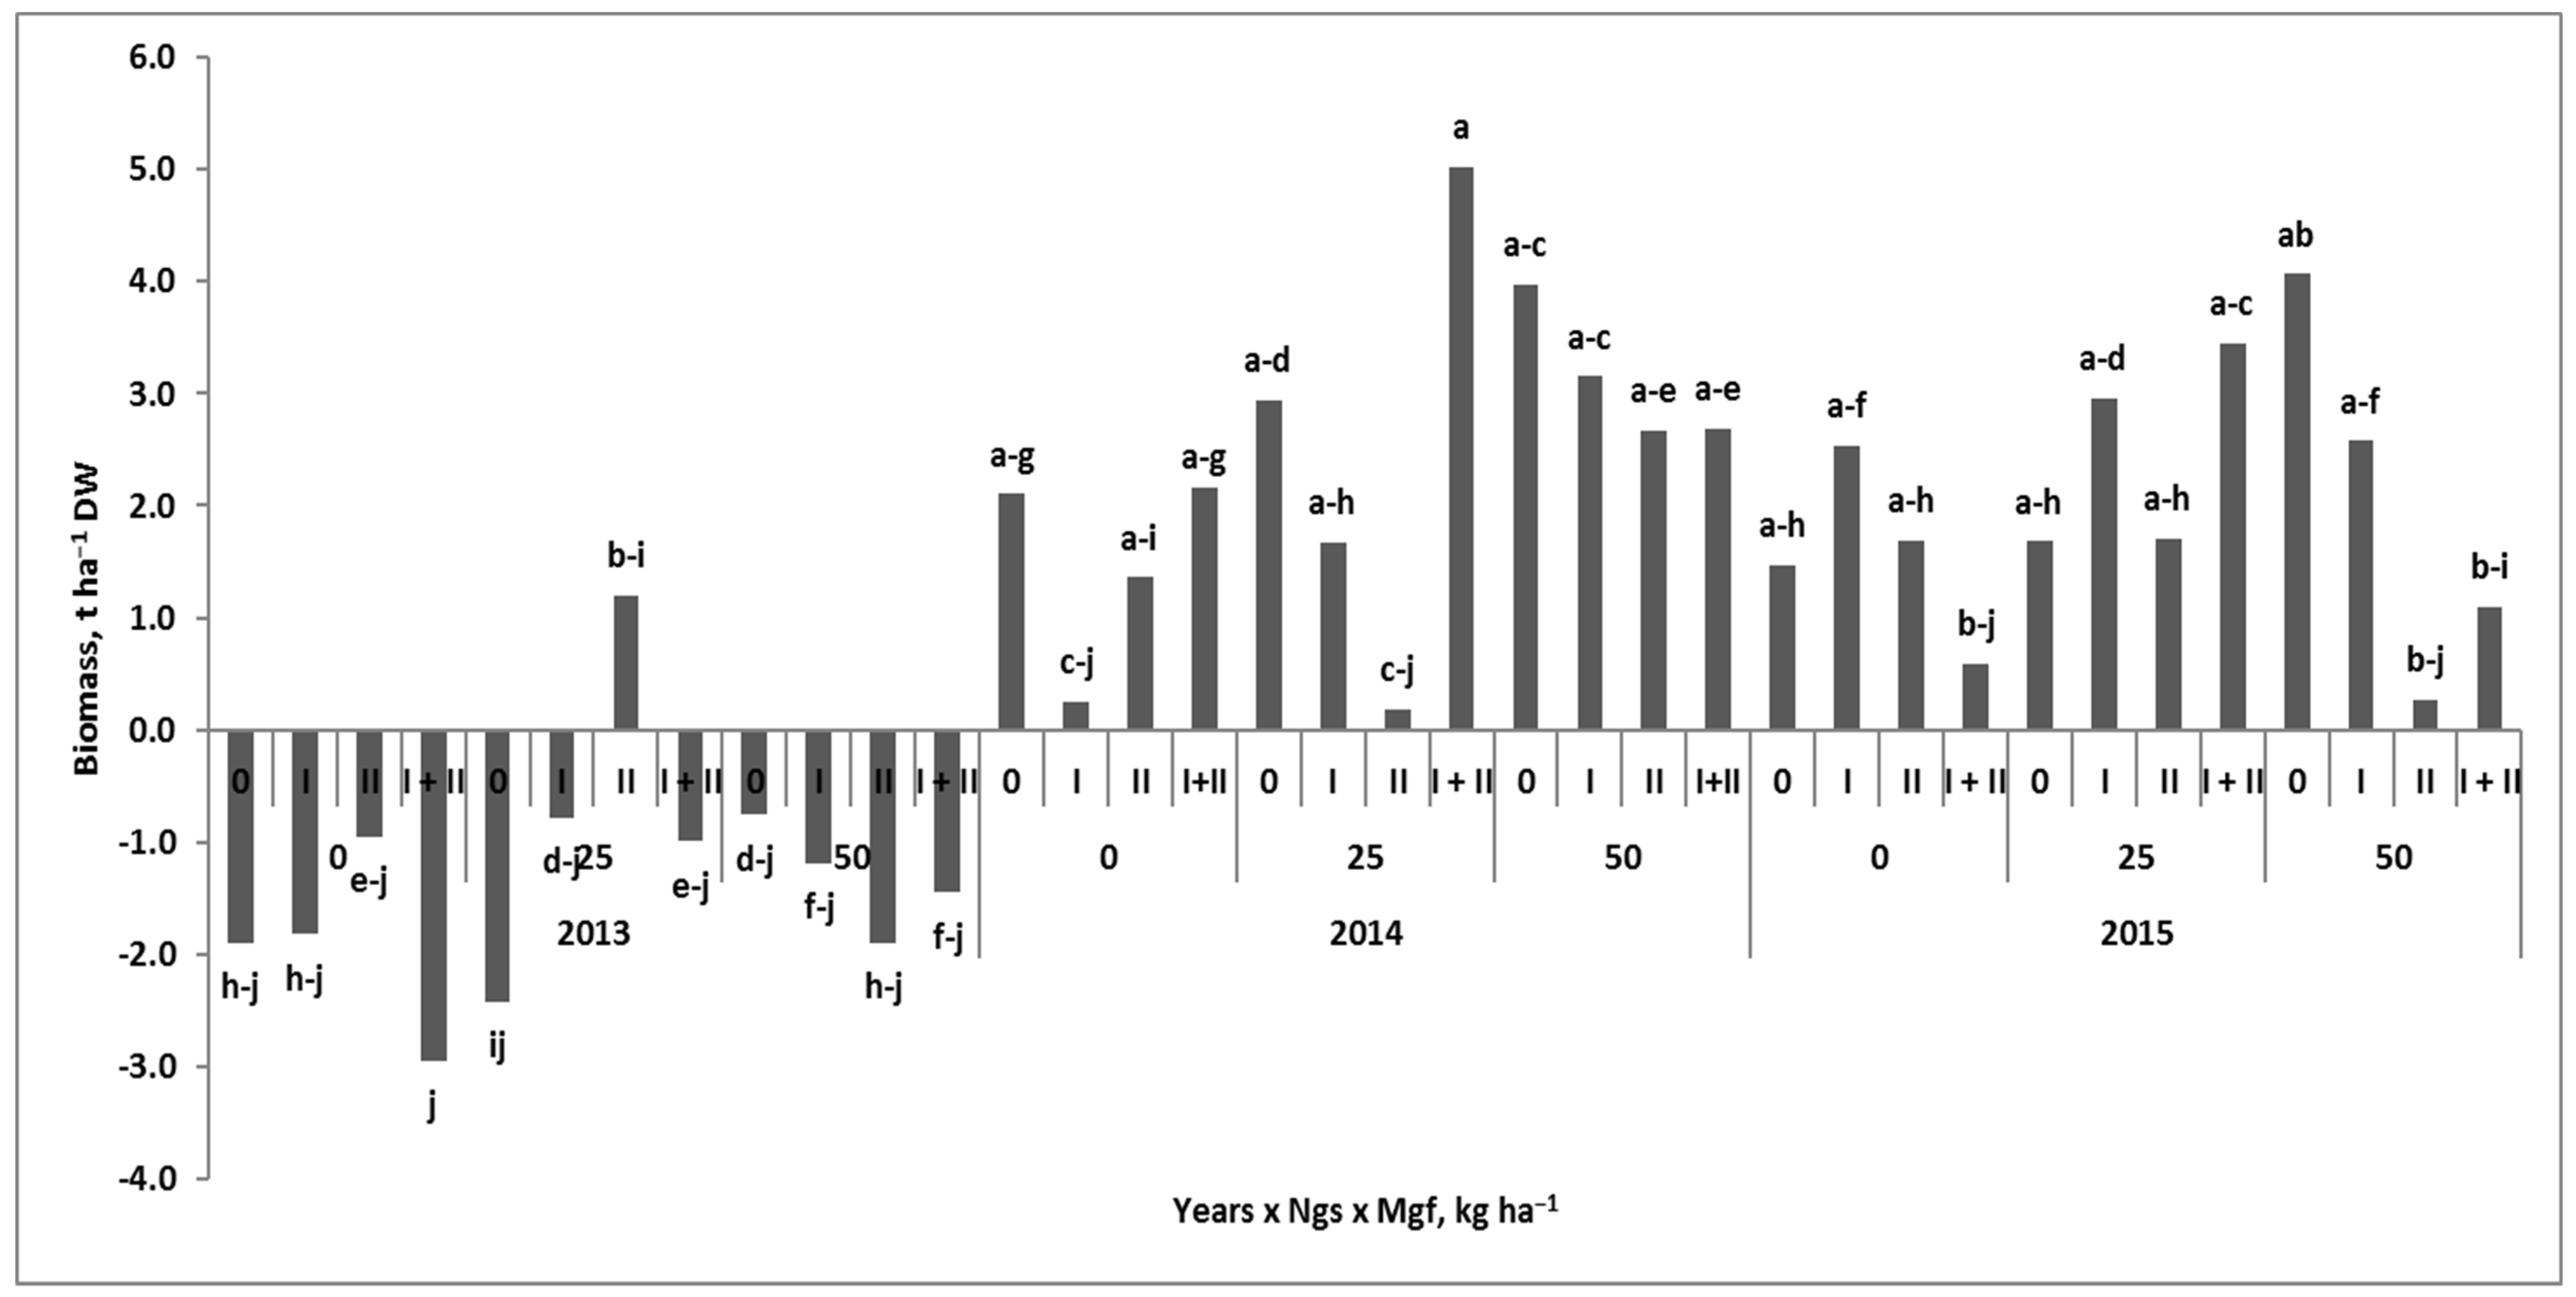
The basic indicator of dry matter management by wheat throughout the grain-filling period (GFP) is the amount of dry matter remobilized (REQ89) from the vegetative parts of the plant [37]. Positive values of this index indicate a decrease, and negative—an increase in dry weight in the assessed period (Table 5). The conducted study showed that the weather conditions during the growing season were the dominant factor, influencing the value of REQ89 (Figure 6). The greatest impact of Mg-FSs on this wheat trait was found in 2014. This index was 2.8-fold, and 17% higher than in 2013 and 2015. In 2014, REQ89 gradually increased with the Mg soil-applied dose. In comparison to the Mg-control, the increase in REQ89 on the plot with 25 kg ha−1 was 36.4%, and 72.7% on the plot with 50 Mg kg ha−1. The effect of Mg-FF was usually negative, except for the two-stage Mg-FF application, which increased REQ89 from 4.5 t ha−1 to 5.3 t ha−1. In 2015, the effect of the soil-applied Mg showed the same patterns as in 2014. The REQ response to the first Mg dose was 4.6-fold compared to the Mg-soil control. Its value increased by another 30% in response to the second Mg dose. The positive effect of Mg-FF turned out to be the best on the Mg-soil control. Plants treated with Mg at BBCH 30 increased 4-fold REQ89 compared to the absolute Mg-control. As in 2014, the interaction of the highest soil Mg dose with Mg-FF resulted in a reduction in REQ89. In 2013, the effect of the soil-applied Mg was low, decreasing significantly with the increase of its dose. The best interaction of the Mg-FSs was found on the plot with 25 kg Mg ha−1 and Mg-FF at BBCH 49/50.
Despite the high values of REQ89, the efficiency of dry matter remobilization (ReE89) was low, reaching only 11.8% in 2013, 25.4% in 2014, and 21.9% in 2015. The contribution of the remobilized dry matter in the grain yield (ReG89) was proportionally higher. In 2014 and 2015, it exceeded 35%. The values of all these indicators significantly depended on the total wheat biomass at BBCH 58 (Table A2). This relationship is shown below for REQ89:
REQ89 = 0.605T58 − 4.529 for n = 36, R2 = 0.79 and p ≤ 0.01
This index and its derivatives showed significant relationships with both GY79 and GY89. In both cases, these relationships were poor. The regression models obtained are as follows:
GY89 = −0.075REQ892 + 0.64REQ89 + 6.095 for n = 36, R2 = 0.25 and p ≤ 0.05
GY89 = 0.417REQ89 + 7.3 for n = 36, R2 = 0.43 and p ≤ 0.01
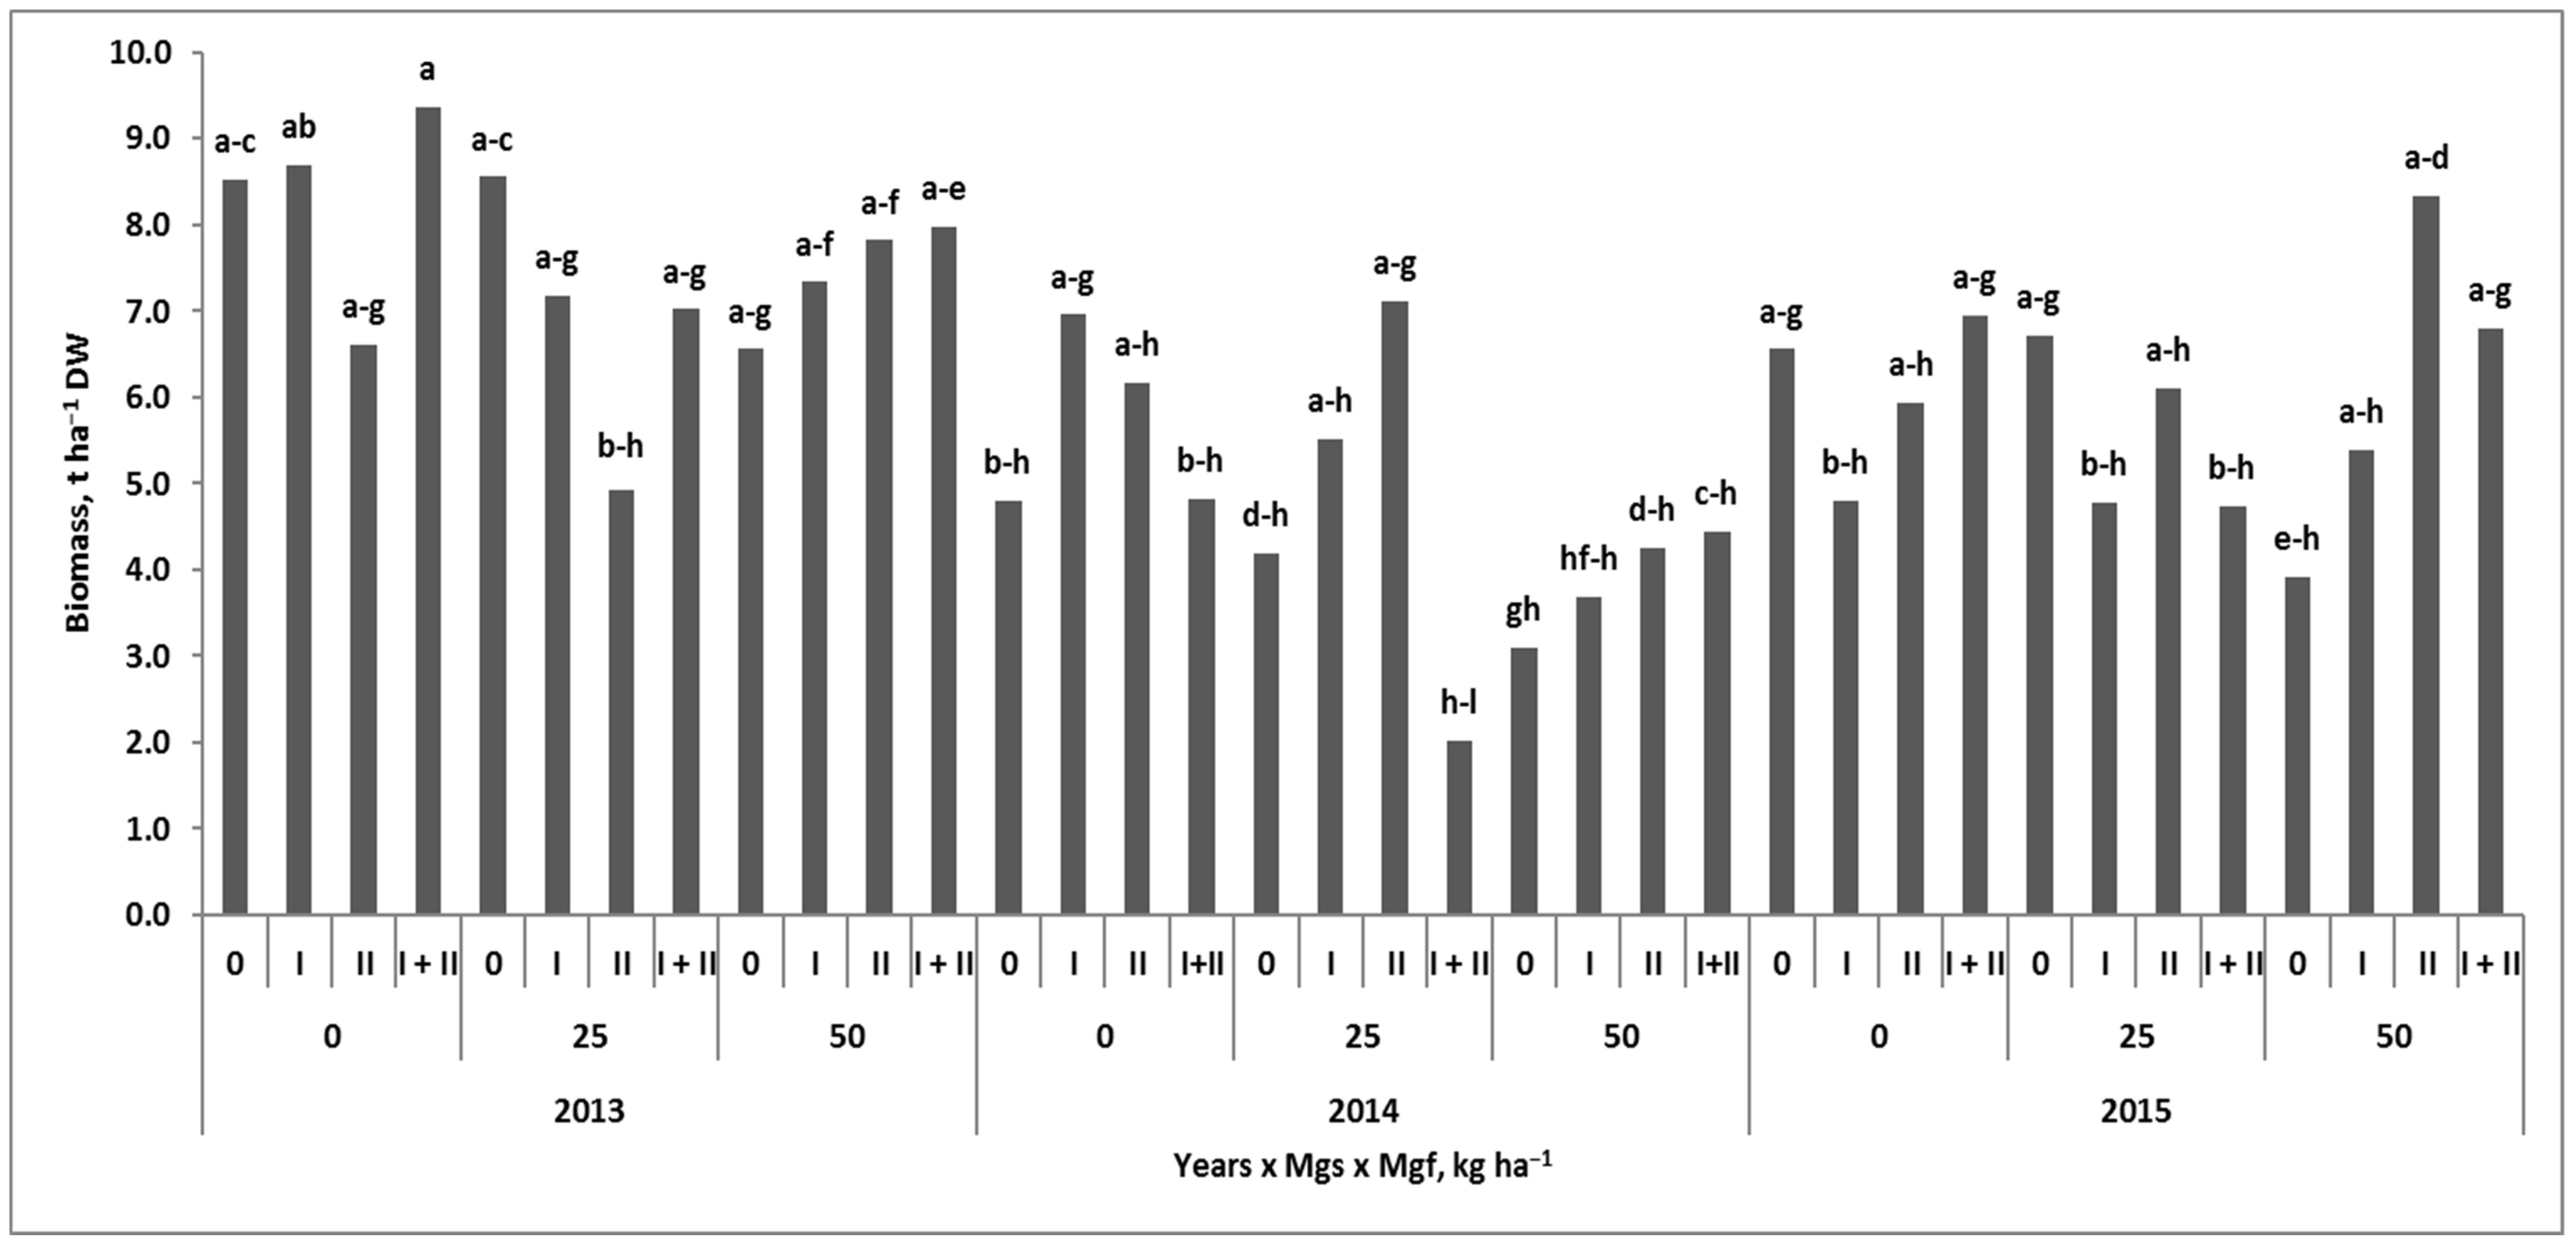
The current photosynthesis (CP) showed much less sensitivity to years and Mg-FSs than REQ89 (Table 5). CP values were almost the same in the first two years of the study, averaging around 6.0 t ha−1. In 2015, the value of this index was 10% lower. In 2013 and 2014, the highest CP was recorded on the Mg-soil control plot, provided that Mg-FF was carried out at the BBCH 30 stage (Figure 7). The obtained values were 27.5% and 45.5% higher in comparison to the absolute Mg-control. In 2015, the increased dose of the soil-applied Mg resulted in a significant decrease in CP. The positive and significant effect of Mg-FF was noted only on the plot fertilized with 50 kg Mg ha−1. The efficiency of the current photosynthesis (CPE) was the highest in 2013, exceeding 70%. In the remaining years, it ranged from 40% to 50%. The soil-applied Mg caused a significant decrease the index value. No significant response of CPE to Mg-FF was found. The contribution of both assimilate sources in the grain yield (CPG) was very variable, ranging from 65% in 2014 and 2015 to 84% in 2013. The values of the index decreased significantly in response to Mg-FF.
The two-stage analysis of dry matter management by wheat during GFP showed much more complicated patterns of studied parameters of dry matter management during the GFP in response to Mg-FSs (Table 6). In 2013, REQ79 values were negative, which indicates a net increase in wheat biomass in the period from BBCH 58 to BBCH 79 (Figure 8). The net REQ value of 1.2 t ha−1 was recorded only on the plot with 25 kg Mg ha−1 and Mg-FF at BBCH 49/50. The opposite trend was observed in 2014 and 2015. The effect of Mg-FF on REQ79 was nonsignificant compared to the effect of the soil-applied Mg. In both years, the values of REQ79 gradually increased in response to the increased soil-applied Mg doses. The exception was the plot fertilized with 25 kg Mg ha−1 and with two-stage Mg-FF in 2014, showing the highest value of the index. The efficiency of dry matter remobilization (ReE79) was negative in 2013. In the remaining years, it was positive, but below 20%. The share of remobilized dry matter to the grain yield (ReG79) was around 33% in 2014, and 26% in 2015. It 2013, it reached negative values.
The values of the current photosynthesis at BBCH 79 (CP79) showed large differences between years (Table 6). In 2014, the index value was 37%, and 21.6% lower in 2015 than the highest recorded in 2013. The effect of Mg-FSs was variable in the studied years (Figure 9). In 2013, the highest CP values were recorded on the Mg-soil control plot, and that fertilized with 25 kg Mg ha−1. The higher dose of Mg applied to the soil resulted in a decrease in CP. A significant effect of Mg-FF was observed on the Mg-soil control plot, in which the two-stage Mg-FF resulted in the highest CP value. In 2014, CP values gradually decreased in response to the increasing dose of the soil-applied Mg. This negative effect was reversed by Mg-FF. As in 2013, the lowest CP values were recorded on the plot treated with 50 kg Mg ha−1. In 2015, the patterns of CP response to the soil-applied Mg were very similar to those observed in 2013. The effect of Mg-FF was much stronger on the plot with 50 kg Mg ha−1.
The efficiency of CP (CPE79) was the highest in 2013, reaching around 45%. In 2014, it was 20% lower, and in 2015, 15% lower. The share of CP in the grain yield (CPG79) was high, exceeding 100% in 2013, 67% in 2014, and 74% in 2015. It is worth emphasizing that all indicators were significantly lower on plots with soil-applied Mg. The decrease in the CP79 value by about 0.9 t ha−1, which was noted on the plots with soil-applied Mg, compared to the Mg-soil control, resulted in a significant decrease in other CP indices.
The remobilization indices showed a positive relationships with the yield components, except TGW, which was negative. The reverse relationships were usually observed for CP indices (Table A3). The values of REQ79 and its derivatives significantly depended on the wheat biomass at BBCH 58. The linear regression model looks similar to the following:
REQ79 = −0.91T58 − 9.553 for n = 36. R2 = 0.87 and p ≤ 0.01
This model reports that the maximum wheat biomass of 9.553 t ha−1 at BBCH 58 was critical to obtain positive REQ79 values. The grain yield at BBCH 79 and BBCH 89 was positive, but poorly correlated with the remobilization indices (Table A3):
GY79 = −0.048REQ792 + 0.29REQ79 + 7.032 for n = 36, R2 = 0.39 and p ≤ 0.05
GY89 = 0.323REQ79 + 8.01 for n = 36, R2 = 0.53 and p ≤ 0.05
The first equation (Equation (9)) clearly shows that GY79 increases gradually to 7.475 t ha−1, but only provided the simultaneous increase in REQ79 up to 3.046 t ha−1. Any higher value of REQ79 resulted in a slight GY79 decrease. The second equation (Equation (10)) clearly shows that any increase in REQ79 resulted in a linear increase in the final grain yield. The relationships between CP indices and wheat biomass at BBCH 58 were as strong as in the case of REQ indices but showed a negative sign. The relationship between CP and GY79 was nonsignificant, but at the same time significant for GY89, and especially for dGY89. The negative sign of the correlation coefficient informs that each increase in CP value at BBCH 79 resulted in a decrease in the grain yield.
The values of REQ89 in the wheat maturation phase (dREQ89), averaged for the experimental factors, were positive. The highest value was recorded in 2013. In 2014, dREQ89 reached 42.3%, and in 2015 only 37.5% of that in 2013 (Table 6). The effect of Mg-FSs on this index was very variable in the subsequent years of the study (Figure 10). In 2013, dREQ89 depended on the Mg applied dose, and was significantly lower on the plot fertilized with 50 kg Mg ha−1. On the Mg-soil control, the highest dREQ89 was recorded on a plot with the two-stage Mg-FF application. The depressive effect of Mg-FF on this index was recorded on the plot with 25 kg Mg ha−1. On the plot with 50 kg Mg ha−1, foliar-treated plants significantly increased dREQ89 compared to the Mg-foliar control. In 2014, this index showed a slight increase along the increasing dose of the soil-applied Mg. The highest dREQ89 was recorded on the plot with 25 kg Mg ha−1 and with Mg-FF at BBCH 30. In 2015, the positive effect of the soil-applied Mg was most visible on the plot with 25 kg Mg ha−1. The effect of Mg-FF was most significant on the plot fertilized with 50 kg Mg ha−1. The efficiency of dREQ89 (dReE89) was low. In 2013, this index reached approximately 15%, and was three times higher than in the other two years. The values of the next index, i.e., the contribution of remobilized dry matter in the grain yield (dReG89), were extremely high, and ranged from 50% in 2014 to over 100% in the remaining years of the study. The value of the current photosynthesis of wheat during the maturation phase (dCP89) was positive only in 2014. The effect of Mg-FF was revealed only at BBCH 30. There was no effect of the interaction between Mg-FSs and years on CP values.

4. Discussion

4.1. Magnesium Fertilization Systems and Grain Yield Development during the Grain-Filling Period

A frequently proposed agronomic option for increasing fertilizer N productivity, irrespective of the region of the world, is to reduce its dose [32,39,40]. However, the rigid solution, based on experimentally developed quadratic regression models, does not lead to the N rate optimization. The productivity of the fertilizer N can be compared, using the index of the partial factor of N productivity (PFP-N) [41]. PFP-N values for optimal N dose in the study by Belete et al. [40] and Tabak et al. [39] were 25 and 39 kg grain kg−1 N, respectively. In our study, the value of PFP-N was 48 kg grain per kg−1 N on a plot fertilized only with nitrogen in the rate of 190 kg ha−1. This index on the plot with the soil-applied Mg and the two-stage Mg-FF, i.e., conducted at BBCH 30 and repeated at BBCH 49/50, reached the value of 53 kg grain kg−1 N. The relative increase in the value of PFP-N due to Mg fertilization was +10.4% (9.082 → 9.998 t ha−1)
The study clearly showed that the application of Mg, regardless on the fertilization system, resulted in a significant increase in the wheat yield. The effect of sulfur in the applied Mg fertilizers (Mg sulfates) was eliminated by using its balanced dose in the NS fertilizers. Wheat cultivated on soil with a medium content of available Mg responded to both soil and foliar application of Mg. Its dose of 25 kg ha−1 increased the yield by 0.5 t ha−1. A slightly better effect was achieved with the foliar Mg application, which resulted in the yield gain of +0.7 t ha−1. However, the highest increase in the grain yield of 0.9 t ha−1 was recorded, provided applying 50 kg Mg ha−1 to the soil, and foliar fertilization with Mg in two stages of wheat growth, i.e., BBCH 30 and BBCH 49/50. The increase in the yield due to Mg application in this system was in the upper part of the often noted range (5–15%) [35].
The positive effect of Mg application on the grain yield of wheat can be explained by its influence on the structural components of the yield. The study clearly showed that the use of Mg, regardless of the method of its application, resulted in an increase of grain density (GD). The variability in this wheat trait explained 95% of the grain yield variability (Equation (1). The wheat grain yield was negatively correlated with TGW (r = −0.79, Table A1). This phenomenon was due to the compensation mechanisms between GD and TGW. The lower GD in 2013 resulted in the significantly higher TGW compared to 2014 (+12.2%). The dominated effect of GD on the grain yield confirms the importance of this trait for high-yielding wheat varieties [16,42]. The increase in GD depended on the response of two basic yield components, i.e., ear density (ED) and the number of grains per ear (GR), to magnesium fertilization systems (Mg-FSs). Both these traits showed a significant, and positive response to Mg-FSs (Table 3). The greatest increase in GD, observed at BBCH 30, resulted from the simultaneous response of basic yield components, i.e., ED and GR to magnesium application. A further increase in GD was obtained under the condition of repeated foliar fertilization of wheat with magnesium at both BBCH 30 and BBCH 49/50. This type of GD response indirectly stresses the effect of Mg on the processes responsible for ear formation during the booting phase. This phase is crucial for the ear formation [7,43].
The temporary grain yield of wheat, as determined at BBCH 79, as well as its increment in the wheat maturation phase, was significantly influenced by interaction of Mg-FSs. The temporary grain yield, i.e., GY79, showed a positive relationship with ED, but at the same time negative correlation with TGW. It should be added that ED was the dominant factor affecting GY79. The increase in wheat grain yield during the maturation phase showed a positive relationship with GR. At the same time, the correlation with TGW was negligible. This set of relationships directly emphasizes the importance of GD as a yield component that determines the yield of wheat. This confirms that the physiological sink dominates over the source in the development of the wheat grain yield [44,45,46].
The grain yield at BBCH 79 was the highest in 2015, reaching 7.9 t ha−1 DW, and constituted 95% of its final yield, i.e., at wheat maturity. The yield increment in the maturation phase was low, reached an average of 0.41 t ha−1, mainly due to foliar-applied Mg (Figure 6). The main reason for the low yield increase in this phase was the drought, covering periods responsible for both GR and TGW [7,47]. The negative effect of drought, often associated with the thermal stress, is a strong factor, leading to grain abortion and a decrease in TGW [15]. In our study, the effect of drought revealed a relatively low TGW, despite the low GR, indirectly suggesting no compensation effect. The highest yield increment in wheat maturation, amounting to 2.3 t ha−1, was recorded in 2014. The GY79 on average reached 7.1 t ha−1 and constituted 76% of the final wheat yield at maturity. The key reasons for the high yield increase were as follows:
a.
Very high GD, which increased due to Mg application from 24,000 to 30,000 grains per m2.
b.
Favorable growth conditions throughout the whole wheat vegetation.
The first point clearly indicates that the use of Mg resulted in the increase of the size of the wheat physiological sink. The net yield increase was 0.7–0.8 t ha−1 compared the absolute Mg-control, i.e., for plants fertilized only with N. This increase was recorded on the plots fertilized with Mg in the dual way, i.e., soil and foliar.

4.2. Magnesium Fertilization Systems and Sink–Source Relationships during the Grain-Filling Period

The critical period of wheat grain yield development begins about 20 days before the onset of flowering [45]. The study takes into account the structure of wheat biomass in the period from BBCH 58 to BBCH 89. At the beginning of this period, the main constituents of wheat were leaves, which are the pure physiological source, stems as a storage for assimilates, and ears as a temporary sink and final source of assimilates for the growing grains, which are a pure physiological sink. The end of heading and flowering are generally considered to be decisive for the final size of the wheat sink, i.e., GD [18,48]. Overall, both GY79 and GY89 were significantly dependent on total wheat biomass at BBCH 58 (Table A2). The regression models are as follows:
GY79 = −0.053T582 + 1.453T58 − 2.44 for n = 36. R2 = 0.56 and p ≤ 0.05
GY89 = −0.053T58 + 4.327 for n = 36. R2 = 0.64 and p ≤ 0.01
This first model reports that the maximum GY79 of 7.517 t ha−1 was obtained provided the T58 reached 13.7 t ha−1 DW. The second model is a linear GY89 response to the total wheat biomass at BBCH 58. The detailed analysis of the effect of wheat constituents on GY79 showed that both leaves and ears/chaffs at BBCH 58/79 were the key organs of wheat, affecting both the temporary and the final wheat grain yield at BBCH 79 (Figure 6). The obtained model clearly shows that in the period covering the key stages of grain yield development, i.e., late heading, flowering, and milking, the leaf biomass was highly stable. The observed persistence in leaf biomass indirectly indicates high photosynthetic activity of leaves [49,50]. The observed reduction of this wheat trait was stronger in the maturation phase than in the grain growth phase. The stem biomass during GFP did not prove to be a significant yield prognostics factor, but it was an important source of assimilates to the growing grains during the GFP. The yield-forming effect of dry matter recovered from the stem is well understood [21,22,23]. In our study, the importance of this source of assimilates depended on the course of the weather. It was the weakest in the dry 2015, which is contradictory to the hypothesis by van Herwaarden et al. [51]. The conducted study has clearly shown that chaffs are the first source of assimilates to the growing grains. The negative impact of the chaff biomass on GY79 reflects the degree of remobilization of the biomass from the ear. This process was the strongest (−43%) in 2015 in the phase of the grain growth. In 2014, there was also a slight decrease in ear biomass in this period. This set of processes clearly confirms the yield-forming role of the ear in the early stages of the grain formation [13,16].
The temporary wheat yield, i.e., GY79, was significantly dependent on ED, but, at the same time, not on GD. This trait was positively correlated with the wheat biomass at BBCH 58 and its constituents. Each year, wheat biomass at the onset of flowering significantly responded to Mg-FSs. The soil-applied Mg showed an advantage over foliar application on grain components of wheat yield. The only exception was the leaf biomass, which had the highest values each year, provided soil-applied Mg at the rate of 25 kg ha−1 and concomitant foliar Mg application. Therefore, ED can be treated as the main efficiency factor, affecting the size of the physiological wheat sink at BBCH 79. Positive relationships between the increase in grain yield in the wheat maturation phase and GD resulted from the effect of Mg on GR. It can be, therefore, concluded that the effect of Mg, regardless of the application method, results in both an increase in the sink strength and the durability of the leaves. This is possibly an agronomic way to increase the grain yield. This study clearly confirms the hypothesis by Körner [46] that sink strength affects the activity of the source.

4.3. Magnesium Fertilization Systems and Indices of Dry Matter Management during the Grain-Filling Phase

An important objective of the study was to assess the impact of Mg fertilization systems on the contribution of both sources of assimilates, i.e., the remobilized dry matter (REQ) and the current photosynthesis (CP) in the grain yield. The studies carried out so far have shown that the activation of carbohydrate from the vegetative parts of wheat takes place under optimal environmental conditions only 20–50 days after the beginning of flowering. Thus, for most of the period of grain growth, the key determinant of the yield increment is CP [52,53]. The conducted study clearly showed that CP was the main source of assimilates for developing grains, determining, on average, 66% of the final grain yield. The remaining part, i.e., 34%, was supplied from dry matter remobilized from vegetative wheat parts.
The key question, however, is what the effect of these two sources of assimilates is on the grain yield formation. The applied two-stage analysis showed a high complexity of this process. Hence, the impact of Mg-FSs on the formation of wheat grain yield during the grain-filling period was assessed by analyzing the following:
(1)
The size of the sink, expressed as the ED, GR, and finally by GD.
(2)
Weather conditions in the periods responsible for the formation of wheat yield components.
(3)
Phases of grain growth.
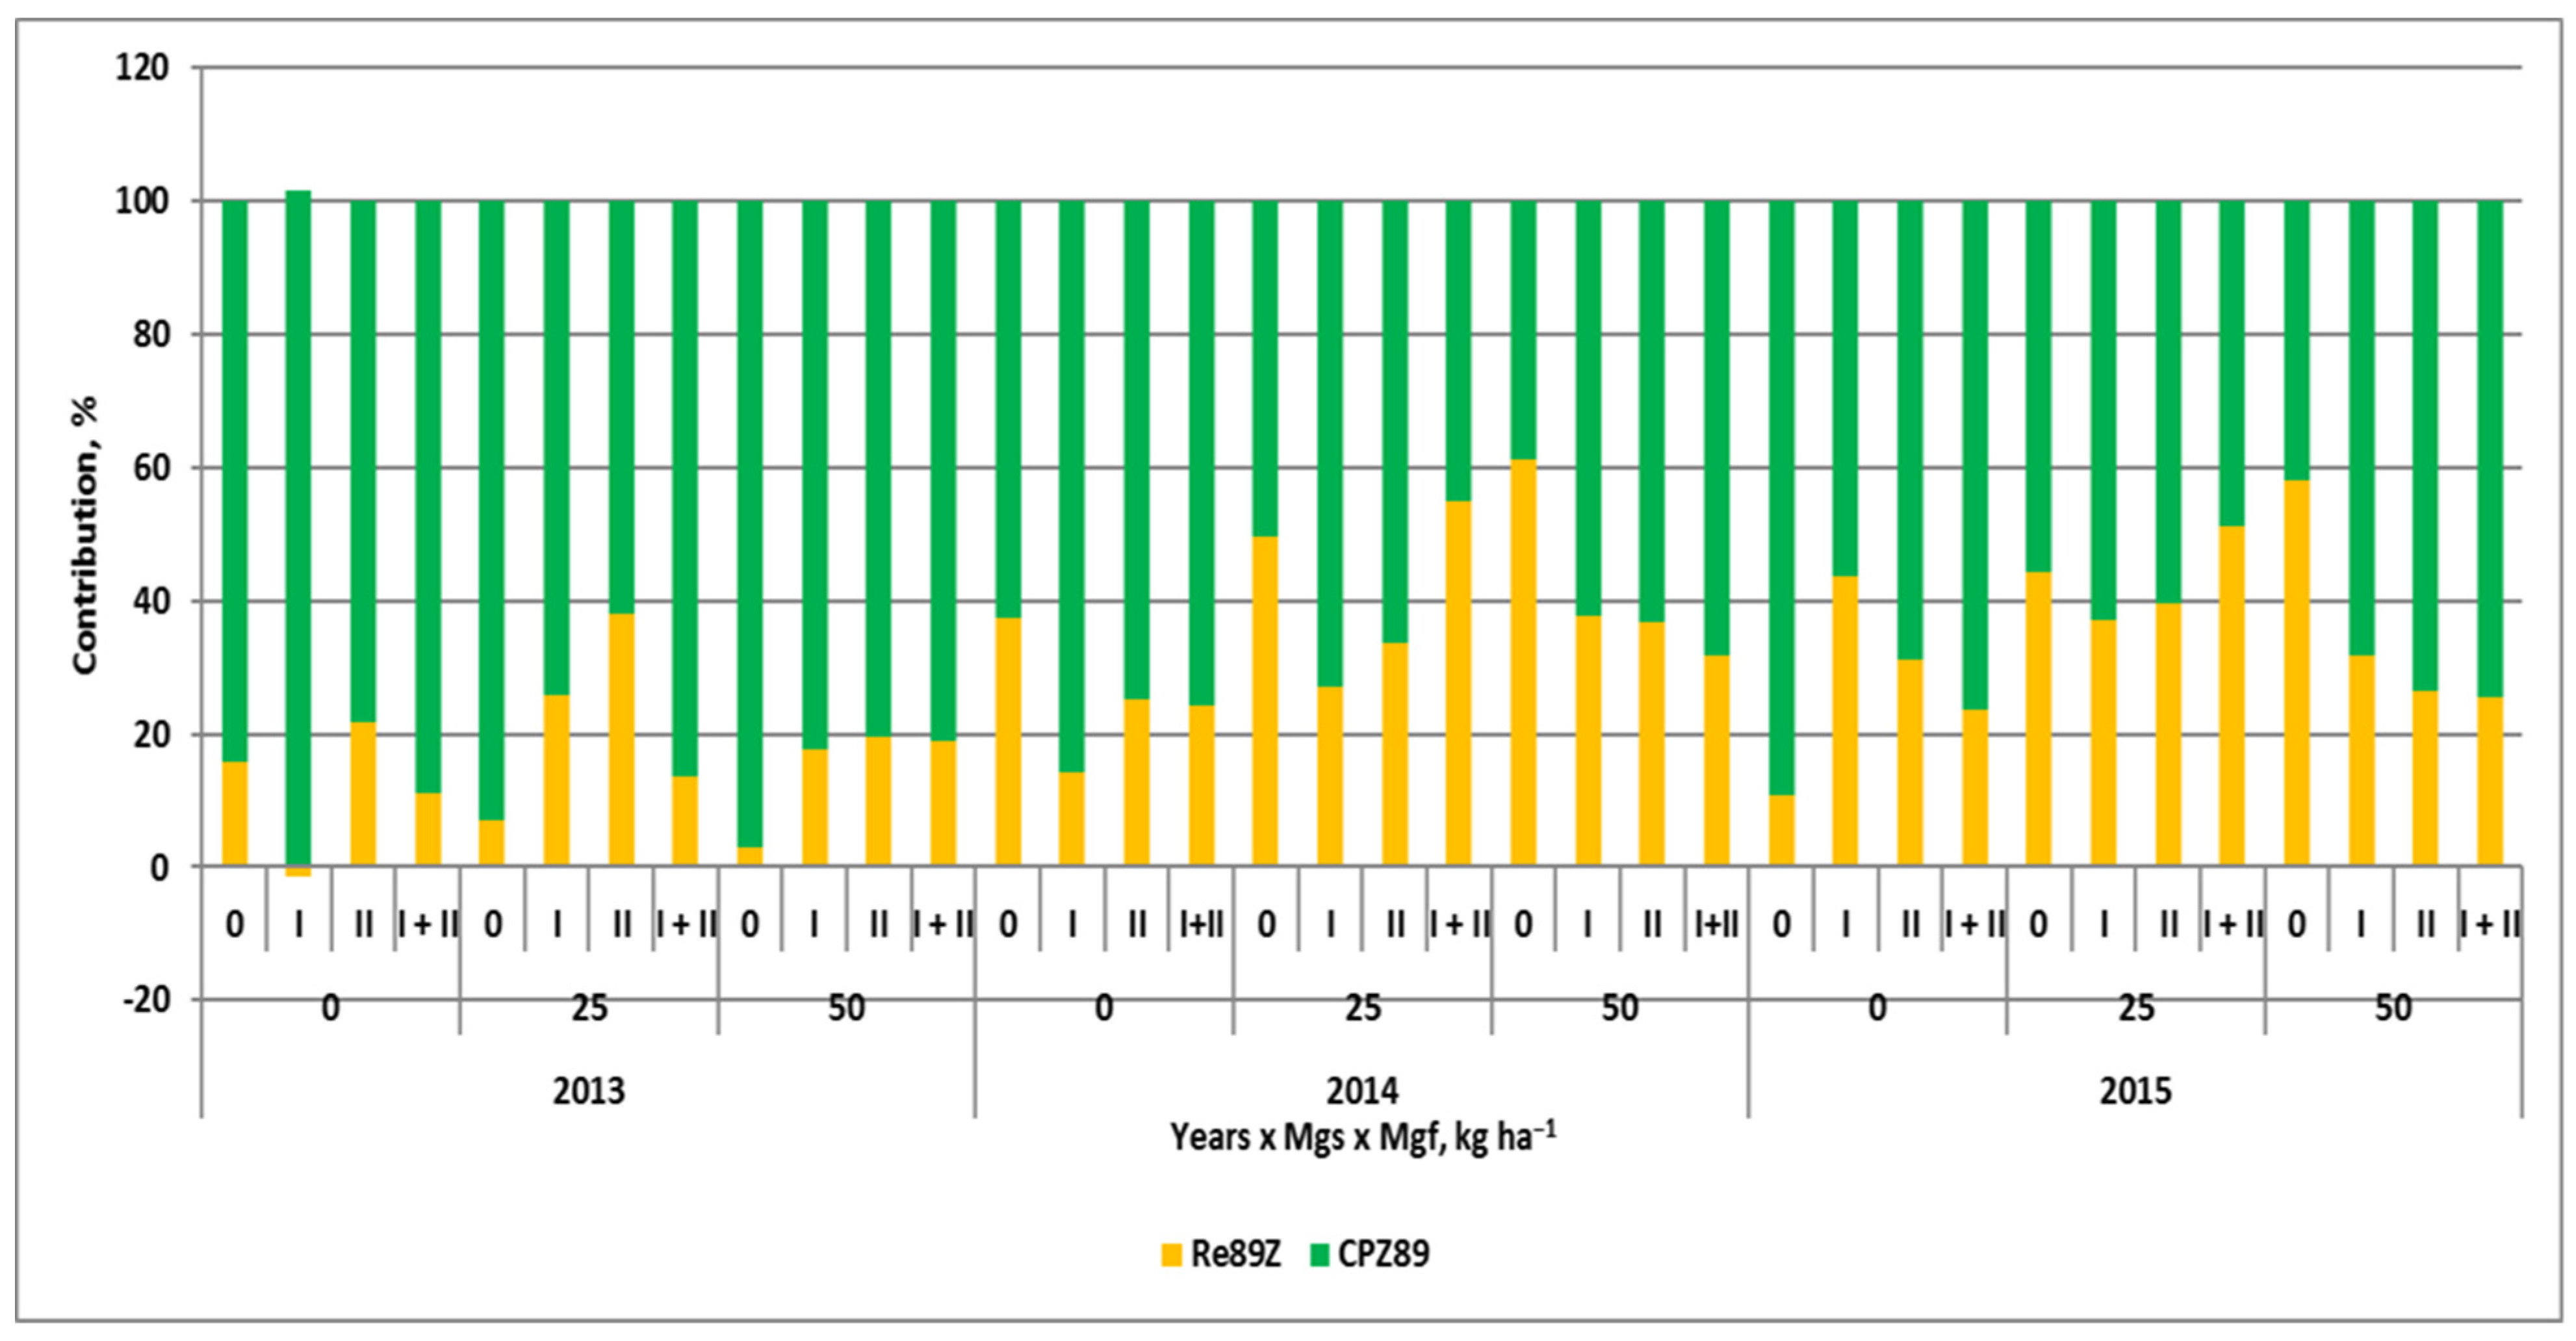
The effect of the sink size on the amount of dry matter remobilized from the vegetative wheat organs was the strongest in 2013 and 2014. The key reason for the significantly lower yield in 2013 was a too-insufficient sink size, expressed by GD. Grain density in 2013 was 32.5% lower than in 2014, but the difference between the yields was only 21.6%. It has been well documented that the amount of assimilates at the beginning of wheat flowering supplied to the growing grains, as a rule, must be large enough to cover the demand of the growing grain [54]. In 2013, the resources of assimilates in the vegetative parts of wheat were not used by plants in the early stages of grain enlargement. The key reason was a too-low size of the sink, i.e., GD. Thus, the main source of assimilates was the current photosynthesis (Figure 11). In 2014, reverse processes were observed. A much-larger GD caused the activation of assimilate resources from all vegetative parts of wheat, but most was from the stem. The importance of the stem as a source of assimilates is confirmed by a 23% decrease in the stem biomass from BBCH 58 to BBCH 79. The impact of Mg-FSs was very specific. As a rule, the soil-applied Mg increased the share of the remobilized dry matter from 30% by 41% to 56% on the Mg-soil control, and plots fertilized with 25 and 50 kg Mg ha−1, respectively.
The second point concerns the impact of contrastive weather conditions on the relative share of both assimilate sources in the wheat grain yield. The explanation requires focusing on the development stage of the grain yield formation. The temporary grain yield, as assessed at BBCH 79, responded differently to the weather course. In 2014, favorable for wheat, as explained in the previous section, the share of remobilized dry matter was significantly affected by the application of magnesium, reaching maximum of 72% on the plot treated with 25 kg Mg ha−1 and its repeated foliar fertilization at BBCH 30 and BBCH 49/50 (Figure 12). In the dry 2015, the maximum share of remobilized dry matter in the grain yield was 51% on the plot fertilized with the soil-applied Mg in the dose of 50 kg Mg ha−1. Foliar fertilization with Mg increased the share of remobilized dry matter, but only on plots without or with a low rate of the soil-applied magnesium.
In the wheat maturation phase, in two of three years of the study, the main source of assimilates was their resources in the vegetative organs (Figure 12). The main organs, supplying assimilate to growing grains, were leaves and stems (Table 2). The average decline in the leaf biomass was 26% in 2013 and 16% in 2015. In 2013, the key source was stems, as indicated by the substantial decrease in dry matter content of 34%. However, these processes did not result a significant increase in the final grain yield. The largest increase in the yield, as recorded in 2014, resulted from the photosynthetic activity of plants, which contributed 50% to the increase in the total grain yield. In this year, in contrast to the other two, the share of CP in the grain yield increased on plots fertilized intensively with magnesium, i.e., responding to both soil and foliar its application.
The dry matter remobilization indices in the period from BBCH 58 to BBCH 89 were significantly correlated with wheat biomass at the beginning of this period, i.e., BBCH 58 (Table A2). This strong correlation indirectly confirms the conclusion presented in the previous chapter about the importance of this stage of wheat growth for the final grain yield. Hence, the trends recorded in the BBCH 58–BBCH 79 period determined the final structure of assimilate sources for growing grain. This conclusion is supported by the significant dependence of the total share of remobilized dry matter on its share in the grain growth phase:
ReG89 = 0.43ReG79 + 23.6 for n = 36, R2 = 0.69 and p ≤ 0.01
The presented results contradict the common opinion that such a large activation of assimilate reserves takes place only under stressful conditions [19,20]. The observed phenomenon can be only explained by the luxurious status of wheat resulting from the supply of Mg to wheat from the beginning of its growth. Magnesium in a seed plant is responsible for phloem-loading and long-distance transport of photoassimilates [55]. The increase in the share of CP in the grain yield in response to foliar Mg application, as observed on both the plot with high dose of the soil-applied Mg and its application to the wheat foliage, can be explained by the induction of the rate of starch transport from leaves to grains [56].
The conducted study concerned the response of one wheat variety to Mg fertilization systems, i.e., in soil and foliar. The lack of Mg-FSs interaction with years suggests a stable effect of magnesium fertilization on the yield of wheat grain, regardless of weather conditions. This conclusion corresponds with Grzebisz’s [34] early studies. However, modern wheat genotypes are very sensitive to environmental factors [57]. Ljubicic et al. [58] showed that wheat genotypes differ in their response both to stressful environmental conditions and the applied ameliorative measures. In the light of the data obtained, further study is needed on the response of various wheat genotypes to confirm the spectacular effect of magnesium used in wheat cultivation.

5. Conclusions

Fertilizing winter wheat with magnesium, regardless of the method of application, i.e., in soil or foliar, resulted in a significant increase in the grain yield. The interaction of these methods enabled an increase in the grain yield by 10%, compared to the effect of nitrogen fertilizer applied alone. The increase in the grain yield was due to the increase in grain density (GD). This wheat trait was driven by the ear density (ED), and/or by the number of grains per ear (GR). The soil-applied Mg, concomitant with the two-stage Mg foliar fertilization, i.e., carried out at BBCH 30 and repeated at BBCH 49/50, resulted in the highest sink density, expressed by GD. The temporary grain yield of wheat determined at BBCH 79 was 6.2, 7.1, and 7.9 t ha−1, in 2013, 2014, and 2015, respectively. The corresponding grain yield increase in the maturation phase of wheat was 1.0, 2.3, and 0.4 t ha−1, respectively. The average share of the remobilized dry matter (REQ) and current photosynthesis (CP) in the final grain yield was 34% and 66%. The share of REQ in the grain yield significantly depended on the stage of the grain yield formation, the magnesium fertilization system, and the course of the weather in a given growing season. The grain yield and its structural components depended on the wheat biomass at the onset of flowering (BBCH 58). The increase in the share of REQ in the yield was enormous and ranged from 30%/18% on the Mg-control to 56%/51% on the plot with Mg 50 kg ha−1 in 2014 and 2015, respectively. The foliar application of Mg resulted in the increased participation of CP in the grain yield, simultaneously decreasing the share of REQ. The increase in the grain yield in the wheat maturation phase in the years with low GD or under stress conditions (2013, 2015) depended on REQ. In a year with favorable growth conditions (2014), characterized by a well-formed GD, both source of assimilates contributed to the increase in yield.

Author Contributions

Conceptualization, W.G. and J.P.; methodology, W.G. and J.P.; software, J.P.; validation, J.P. and W.G.; formal analysis, W.G.; investigation, J.P.; data curation, W.G.; writing—original draft preparation, J.P.; writing—review and editing, W.G.; visualization, W.G.; supervision, W.G.; project administration, J.P. All authors have read and agreed to the published version of the manuscript.

Funding

This research received no external funding.

Institutional Review Board Statement

Not applicable.

Informed Consent Statement

Not applicable.

Data Availability Statement

Not applicable.

Conflicts of Interest

The authors declare no conflict of interest.

Appendix A

Table A1. Matrix of correlation indices for winter wheat biomass components, n = 36.
TraitST58EA58LE79ST79CH79GY79LE89ST89CH89GY89EDGRGDTGW
LE580.89 ***0.66 ***0.77 ***−0.35 *0.35 *0.55 ***0.79 ***0.48 **0.270.91 ***0.70 ***0.42 *0.84 ***−0.81 ***
ST581.000.70 ***0.67 ***−0.320.250.61 ***0.76 ***0.56 ***0.150.83 ***0.74 ***0.300.77 ***−0.80 ***
EA58 1.000.61 ***0.17−0.240.77 ***0.70 ***0.75 ***−0.38 *0.47 **0.76 ***−0.260.34 *−0.69 ***
LE79 1.00−0.080.290.70 ***0.86 ***0.63 ***0.060.79 ***0.73 ***0.210.70 ***−0.78 ***
ST79 1.00−0.330.18−0.150.15−0.42 *−0.41 *−0.12−0.51 **−0.49 **0.24
Ch79 1.00−0.170.14−0.220.72 ***0.49 **−0.040.72 ***0.55 **−0.11
GY79 1.000.81 ***0.85 ***−0.41 *0.46 **0.83 ***−0.35 *0.32−0.73 ***
LE89 1.000.78 ***−0.090.77 ***0.88 ***0.070.70 ***−0.90 ***
ST89 1.00−0.42 *0.41 *0.86 ***−0.41 *0.30−0.72 ***
Ch89 1.000.42 *−0.190.85 ***0.55 ***0.05
GY89 1.000.68 ***0.58 ***0.95 ***−0.79 ***
ED 1.00−0.140.62 ***−0.87 ***
GR 1.000.69 ***−0.10
GD 1.00−0.71 ***
***, **, and * indicate significant differences at p < 0.001, p < 0.01, and p < 0.05, respectively; n.s. = not significant. Legend: LE, ST, EA, CH, T—biomass of leaves, stems, ears, chaffs, total, grain; 58, 78, 89—growth stages of winter wheat in accordance with the BBCH scale; ED—ears density; GR—grain per ear; GD—grain density; TGW—thousand grain weight.
Table A2. Matrix of correlation indices for winter wheat remobilization indices during the grain-filling period, n = 36.
TraitT79vGY79T79Tv89GY89REQ89RE89Re89ZCP89CPC89CPZ89EDGRGDTGW
T580.240.70 ***0.56 ***0.79 ***0.80 ***0.89 ***0.82 ***0.85 ***−0.51 **−0.90 ***−0.85 ***0.80 ***0.160.70 ***−0.84 ***
T79v1.000.43 **0.86 ***0.37 *0.230.090.060.070.08−0.13−0.070.24−0.050.14−0.26
GY79 1.000.84 ***0.80 ***0.46 **0.45 **0.36 *0.44 **−0.20−0.57 ***−0.440.83 ***−0.35 *0.32−0.73 ***
T79 1.000.70 ***0.40 *0.310.250.30−0.07−0.41 *−0.300.63 ***−0.230.27−0.56 ***
Tv89 1.000.70 ***0.42 *0.300.36 *0.04−0.49 **−0.36 *0.91 ***−0.050.63 ***−0.84 ***
GY89 1.000.66 ***0.60 ***0.54 **−0.02−0.54 **−0.54 **0.68 ***0.58 ***0.95 ***−0.79 ***
REQ89 1.000.98 ***0.99 ***−0.77 ***−0.96 ***−0.99 ***0.51 **0.270.57 ***−0.61 ***
RE89 1.000.98 ***−0.79 ***−0.94 ***−0.98 ***0.43 *0.280.52 **−0.53 **
Re89Z 1.00−0.85 ***−0.98 ***−1.00 ***0.48 **0.160.46 **−0.56 **
CP89 1.000.81 ***0.85 ***−0.110.130.050.14
CPC89 1.000.98 ***−0.59 ***−0.03−0.44 **0.63 ***
CPZ89 1.00−0.48 **−0.16−0.45 **0.55 **
ED 1.00−0.140.62 ***−0.87 ***
GR 1.000.69 ***−0.10
GD 1.00−0.71 ***
***, **, and * indicate significant differences at p < 0.001, p < 0.01, and p < 0.05, respectively; n.s. = not significant. Legend: T58, T79, T89—total wheat biomass at BBCH 58, 79, 89; GY79, GY89—grain yield at BBCH 79 and 89; T79v, T89v, total vegetative biomass of wheat; REQ—remobilization quota; RE—remobilization efficiency; ReG—contribution of remobilized dry matter to grain mass; CP—current photosynthesis; CPE—efficiency of current photosynthesis; CPG—contribution of CP to grain mass; 78. 89—growth stages of winter wheat in accordance with the BBCH scale; ED—ears density; GR—grain per ear; GD—grain density; TGW—thousand grain weight.
Table A3. Matrix of correlation indices for winter wheat remobilization indices during the period of grain formation and maturation, n = 36.
TraitGY89dGY89Tv79Tv89REQ
d79
ReE
d79
ReG
d79
CP
d79
CPE
d79
CPG
d79
REQ
d89
RE
d89
ReG
d89
CP
d89
CPC
d89
CPG
d89
EDGRGDTGW
GY790.46 **−0.40 **0.43 **0.81 ***0.56 ***0.59 ***0.55 ***−0.22−0.35 *−0.55 **−0.49 **−0.55 ***−0.55 **0.54 **0.39 *0.55 **0.83 ***0.35 *0.32−0.73 ***
GY891.000.63 ***0.230.70 ***0.73 ***0.74 ***0.75 ***−0.66 ***−0.76 ***−0.75 ***−0.53 **−0.56 ***−0.63 ***0.86 ***0.73 ***0.64 ***0.68 ***0.58 ***0.95 ***−0.79 ***
dGY89 1.00−0.140.020.260.250.30−0.49 **−0.48 **−0.30−0.12−0.10−0.180.41 *0.42 *0.18−0.020.90 ***0.70 ***−0.17
T79v 1.000.37 *−0.13−0.12−0.130.34 *0.070.130.36 *0.270.28−0.10−0.04 *−0.280.24−0.050.14−0.22
Tv89 1.000.66 ***0.69 ***0.67 ***−0.43 **−0.55 **−0.67 ***−0.73 ***−0.79 ***−0.78 ***0.82 ***0.66 ***0.78 ***0.91 ***−0.050.63 ***−0.84 ***
REQ79 1.000.99 ***1.00 ***−0.93 ***−0.95 ***−1.00 ***−0.76 ***−0.76 ***−0.81 ***0.86 ***0.82 ***0.81 ***0.73 ***0.180.67 ***−0.78 ***
RE79 1.000.99 **−0.90 ***−0.92 ***−0.99 ***−0.78 ***−0.78 ***−0.84 ***0.87 ***0.85 ***0.84 ***0.77 ***0.160.67 ***−0.80 ***
ReE79 1.00−0.94 ***−0.95 ***1.00−0.76 ***−0.76 ***−0.81 ***0.86 ***0.84 ***0.81 ***0.72 ***0.220.69 ***−0.78 ***
CP79 1.000.96 ***0.94 ***0.68 ***0.65 ***0.71 ***−0.76 ***−0.80 ***−0.71 **−0.50 **−0.37 *−0.65 ***0.59 ***
CPE79 1.000.95 ***0.60 ***0.60 ***0.66 ***−0.77 ***−0.73 ***−0.66 ***−0.66 ***−0.31−0.72 ***0.74 ***
CP9 1.000.76 ***0.76 ***0.81 ***−0.86 ***−0.84 ***−0.81 ***−0.72 ***−0.22−0.69 ***0.78 ***
REQ89 1.000.99 ***0.99 ***−0.90 ***−0.93 ***−0.99 ***−0.74 ***0.01−0.53 **0.68 ***
RE89 1.000.99 ***−0.90 ***−0.92 ***−0.99 ***−0.79 ***0.03−0.56 ***0.73 ***
Re89Z 1.00−0.94 ***−0.95 ***−1.000.01−0.11−0.070.03
CP89 1.000.960.940.52 **0.54 **0.80 ***−0.60 ***
CPC89 1.000.950.57 ***0.49 **0.80 ***−0.64 ***
CPZ89 1.00−0.010.110.07−0.03
ED 1.000.140.62 ***−0.10
Gr 1.000.69 ***−0.10
GD 1.00−0.71***
***, **, and * indicate significant differences at p < 0.001, p < 0.01, and p < 0.05, respectively; n.s. = not significant. Legend: T58, T79, T89—total wheat biomass at BBCH 58, 79, 89; GY79, GY89—grain yield at BBCH 79 and 89; dGY89—grain yield increment in the period BBCH 79–89; T79v, T89v, total vegetative biomass of wheat; REQ—remobilization quota; RE—remobilization efficiency; ReG—contribution of remobilized dry matter in the grain yield; CP—current photosynthesis; CPE—efficiency of current photosynthesis; CPG—contribution of CP in the grain yield; d79, d89—growth stages of winter wheat in accordance with the BBCH scale, referring to the respective periods of BBCH 58–BBCH 79 and BBCH 79–BBCH 89; ED—ears density; GR—grain per ear; GD—grain density; TGW—thousand grain weight.

References

  1. Hunter, M.C.; Smith, R.G.; Schipanski, M.E.; Atwood, L.W.; Mortensen, D.A. Agriculture in 2050: Recalibrating targets for sustainable intensification. BioScience 2017, 67, 386–391. [Google Scholar] [CrossRef] [Green Version]
  2. Ray, D.K.; Ramankutty, N.; Mueller, N.D.; West, P.C.; Foley, J.A. Recent patterns of crop yield growth and stagnation. Nat. Commun. 2012, 3, 1293. [Google Scholar] [CrossRef] [PubMed] [Green Version]
  3. Shewry, P.R.; Hey, S.J. The contribution of wheat to human diet and health. Food Energy Sec. 2015, 493, 178–202. [Google Scholar] [CrossRef]
  4. Available online: https://www.guinnessworldrecords.com/world–records/highest–wheat–yield (accessed on 18 November 2021).
  5. Supit, I.; van Diepen, C.A.; de Wit, A.J.W.; Kabat, P.; Baruth, B.; Ludwig, F. Recent changes in the climatic yield potential of various crops in Europe. Agric. Syst. 2010, 103, 683–694. [Google Scholar] [CrossRef]
  6. FAOSTAT. 2021. Available online: https://www.fao.org/statistics (accessed on 18 November 2021).
  7. Klepper, B.; Rickman, R.W.; Waldman, S.; Chevalier, P. The physiological life cycle of wheat: Its use in breeding and crop management. Euphytica 1998, 100, 341–347. [Google Scholar] [CrossRef]
  8. Rickman, R.W.; Waldman, S.E.; Klepper, B. MODWht3: A development driven wheat growth simulation. Agron. J. 1996, 88, 176–185. [Google Scholar] [CrossRef]
  9. Fisher, R.A. Wheat physiology: A review of recent developments. Crop Pasture Sci. 2011, 62, 95–114. [Google Scholar] [CrossRef] [Green Version]
  10. Serrago, R.A.; Alzueta, I.; Savin, R.; Slafer, G.A. Understanding grain yield responses to source–sink ratios during grain filling in wheat and barley under constraining environments. Field Crop. Res. 2013, 150, 42–51. [Google Scholar] [CrossRef] [Green Version]
  11. Gaju, O.; Allard, V.; Martre, P.; Le Gouis, J.; Moreau, D.; Bogard, M.; Hubbart, S.; Foulkes, M.J. Nitrogen partitioning and remobilization in relation to leaf senescence, grain yield and grain nitrogen concentration in wheat cultivars. Field Crop. Res. 2014, 155, 213–223. [Google Scholar] [CrossRef]
  12. Sadras, V.O.; Lawson, C. Genetic gain in yield and associated changes in phenotype, trait plasticity and competitive ability of South Australian wheat varieties released between 1958 and 2007. Crop Pasture Sci. 2011, 62, 533–549. [Google Scholar] [CrossRef]
  13. Slafer, G.A.; Elia, M.; Savin, R.; Garcia, G.A.; Terrile, I.I.; Ferrante, A.; Miralles, D.J.; González, F.G. Fruiting efficiency: An alternative trait to further rise in wheat yield. Food Energy Sec. 2015, 4, 92–109. [Google Scholar] [CrossRef]
  14. Kong, L.G.; Xie, Y.; Hu, L.; Feng, B.; Li, S.D. Remobilization of vegetative nitrogen to developing grain in wheat (Triticum aestivum L.). Field Crop. Res. 2016, 196, 134–144. [Google Scholar] [CrossRef]
  15. Farooq, M.; Hussainf, M.; Siddique, K.H.M. Drought stress in wheat during flowering and grain–filling periods. Crit. Rev. Plant Sci. 2014, 33, 331–349. [Google Scholar] [CrossRef]
  16. Duan, J.; Wu, Y.; Zhou, Y.; Ren, X.; Shao, Y.; Feng, W.; Zhu, Y.; Wang, Y.; Guo, T. Grain number response to pre–anthesis dry matter and nitrogen in improving wheat yield in the Huang–Huai Plain. Sci. Rep. 2018, 8, 7126. [Google Scholar] [CrossRef] [PubMed]
  17. Sinclair, T.R.; Jamieson, P.D. Yield and grain number of wheat: A correlation or causal relationship? Authors’ response to „The importance of grain or kernel number in wheta: A replair to Sinclair and Jamieson by R.A. Fisher. Field Crop. Res. 2008, 105, 22–26. [Google Scholar] [CrossRef]
  18. Xie, Q.; Mayes, S.; Sparkes, D.L. Preanthesis biomass accumulation and plant organs defines yield components in wheat. Eur. J. Agron. 2016, 81, 15–26. [Google Scholar] [CrossRef]
  19. Blum, A. Improving wheat grain filling under stress by stem reserve mobilization. Euphytica 1998, 100, 77–83. [Google Scholar] [CrossRef]
  20. Masoni, A.; Ercoli, L.; Mariotti, M.; Arduini, I. Post–anthesis accumulation and remobilization of dry matter, nitrogen and phosphorus in durum wheat as affected by soil type. Eur. J. Agron. 2007, 26, 179–186. [Google Scholar] [CrossRef]
  21. Ehdaie, B.; Alloush, G.; Madore, M.; Waines, J. Genotypic variation for stem reserves and mobilization in wheat: II.Postanthesis changes in internode water–soluble carbohydrates. Crop Sci. 2006, 46, 2093–2103. [Google Scholar] [CrossRef]
  22. Ma, J.; Huang, G.B.; Yang, D.L.; Chai, Q. Dry matter remobilization and compensatory effects in various internodes of spring wheat under water stress. Crop Sci. 2014, 53, 331–339. [Google Scholar] [CrossRef]
  23. Zhang, J.; Chen, W.; Dell, B.; Vergauwen, R.; Zhang, X.; Mayer, J.E.; Van den Ende, W. Wheat genotypic variation in dynamic fluxes of WSC components in different stem segments under drought during grain filling. Front. Plant Sci. 2015, 6, 624. [Google Scholar] [CrossRef] [Green Version]
  24. Liu, E.K.; Mei, X.R.; Yan, C.R.; Gong, D.Z.; Zhang, Y.Q. Effects of water stress on phytosynteetic characteristics, dry matter translocation and WUE in two winter wheat genotypes. Agric. Water Manag. 2016, 167, 75–85. [Google Scholar] [CrossRef]
  25. Grafton, R.Q.; Williams, J.; Jiang, Q. Food and water gaps to 2050: Preliminary results from the global food and water systems (GFWS) platform. Food Sec. 2015, 7, 209–220. [Google Scholar] [CrossRef] [Green Version]
  26. Liu, J.; Williams, J.R.; Zehnder, A.J.B.; Yang, H. GEPIC—modelling wheat yield and crop water productivity with high resolution on a global scale. Agric. Syst. 2007, 94, 478–493. [Google Scholar] [CrossRef]
  27. Johnston, A.M.; Bruulsema, T.W. 4R nutrient stewardship for improved nutrient use efficiency. Procedia Eng. 2014, 83, 365–370. [Google Scholar] [CrossRef] [Green Version]
  28. Ma, G.; Liu, W.; Li, S.; Zhang, P.; Wang, C.; Lu, H.; Wang, L.; Xie, Y.; Ma, D.; Kang, G. Determining the optimal N input to improve grain yield and Quality in winter wheat with reduced apparent N loss in the North China. Front. Plant Sci. 2019, 10, 181. [Google Scholar] [CrossRef] [Green Version]
  29. Kostić, M.M.; Tagarakis, A.C.; Ljubičić, N.; Blagojević, D.; Radulović, M.; Ivoševic, B.; Rakić, D. The Effect of N Fertilizer Application Timing on Wheat Yield on Chernozem Soil. Agronomy 2021, 11, 1413. [Google Scholar] [CrossRef]
  30. Schauberger, B.; Ben–Ari, T.; Makowski, D.; Kato, T.; Kato, H.; Ciais, P. Yield trends, variability and stagnation analysis of major crops in France over more than a century. Sci. Rep. 2018, 8, 16865. [Google Scholar] [CrossRef]
  31. Vargas, M.; Glaz, B.; Alvarado, G.; Pietragalla, J.; Morgounov, A.; Zelenskiy, Y.; Crossa, J. Analysis and Interpretation of Interactions in Agricultural Research. Agron. J. 2015, 107, 748–762. [Google Scholar] [CrossRef] [Green Version]
  32. Tabak, M.; Lepiarczyk, A.; Filipek–Mazur, B.; Lisowska, A. Efficiency of Nitrogen Fertilization of Winter Wheat Depending on Sulfur Fertilization. Agronomy 2020, 10, 1304. [Google Scholar] [CrossRef]
  33. Klikocka, H.; Marks, M.; Barczak, B.; Szostak, B.; Podleśna, A.; Podleśny, J. Response of spring wheat to NPK and S fertilization. The content and uptake of macronutrients and the value of ionic ratios. Open Chem. 2018, 16, 1059–1065. [Google Scholar] [CrossRef]
  34. Grzebisz, W. Crop response to magnesium fertilization as affected by nitrogen supply. Plant Soil 2013, 368, 23–39. [Google Scholar] [CrossRef]
  35. Wang, Z.; Hassan, M.U.; Nadeem, F.; Wu, L.; Zhang, F.; Li, X. Magnesium fertilization improves crop yield in most prodyuction systems: A meta–analysis. Front. Plant Sci. 2020, 10, 1727. [Google Scholar] [CrossRef] [Green Version]
  36. Kabała, C.; Charzyński, P.; Chodorowski, J.; Drewnik, M.; Glina, B.; Greinert, A.; Hulisz, P.; Jaknkowski, M.; Jonczak, J.; Łabaz, B.; et al. Polish Soil Classification: Principles, classification scheme and correlation. Soil Sci. Annu. 2019, 70, 71–97. [Google Scholar] [CrossRef] [Green Version]
  37. Meier, U. (Ed.) Growth stages of mono- and dicotyledonous plants. In BBCH Monograph, 4th ed.; Federal Biological Research Centre for Agriculture and Forestry, Julius Kuhn-Institut: Quedlinburg, Germany, 2018; p. 204. [Google Scholar]
  38. Papakosta, D.K.; Gagianas, A.A. Nitrogen and dry matter accumulation, remobilization, and losses for Mediterranean wheat during grain filling. Agron. J. 1991, 83, 864–870. [Google Scholar] [CrossRef]
  39. Lu, D.; Lu, F.; Pan, J.; Cui, Z.; Zou, C.; Chen, X.; He, M.; Wang, Z. The effects of cultivar and nitrogen management on wheat yield and nitrogen use efficiency in the North China Plain. Field Crop. Res. 2015, 171, 157–164. [Google Scholar] [CrossRef]
  40. Belete, F.; Dechassa, N.; Molla, A.; Tana, T. Effect of split application of different N rates on productivity and nitrogen use effciency of bread wheat (Triticum aestivum L.). Agric. Food Sec. 2018, 7, 92. [Google Scholar] [CrossRef]
  41. Grzebisz, W.; Diatta, J. Constrains and solutions to maintain soil productivity, a case study from Central Europe. In Soil Fertility Improvement and Integrated Nutrient Management—A Global Perspective; Whalen, J., Ed.; InTech: London, UK, 2012; pp. 159–183. [Google Scholar]
  42. Würschum, T.; Leiser, W.L.; Langner, S.M.; Tucker, M.R.; Longin, C.F.H. Phenotypic anf genetic analysis of spike and kernel characteristics in wheat reveals long-term genetic trends of grain yield components. Theor. Appl. Genet. 2018, 131, 2071–2084. [Google Scholar] [CrossRef]
  43. Hodgkinson, L.; Dodd, I.C.; Binley, A.; Ashton, R.W.; White, R.P.; Watts, C.W.; Whalley, W.R. Root growth in field grown winter wheat: Some effects of soil conditions, season and genotype. Eur. J. Agron. 2017, 91, 74–83. [Google Scholar] [CrossRef] [PubMed]
  44. Shearman, V.J.; Sylvester–Bradley, R.; Scott, R.K.; Foulkes, M.J. Physiological processes associated with wheat yield progress in the UK. Crop Sci. 2005, 45, 175–185. [Google Scholar]
  45. Fisher, R.A. The importance of grain or kernel number in wheat: A reply to Sinclair and Jamieson. Field Crop. Res. 2008, 105, 15–21. [Google Scholar] [CrossRef]
  46. Körner, C. Paradigm shift in plant growth control. Curr. Opin. Plant Biol. 2015, 25, 107–114. [Google Scholar] [CrossRef] [PubMed]
  47. Guo, Z.; Chen, D.; Schnurbusch, T. Plant and floret growth at distinct developmental stages during the stem elongation phase in wheat. Front. Plant Sci. 2018, 9, 330. [Google Scholar] [CrossRef] [PubMed] [Green Version]
  48. Bindraban, P.S.; Sayre, K.D.; Solismoya, E. Identifying factors that determine kernel number in wheat. Field Crop. Res. 1998, 58, 223–234. [Google Scholar] [CrossRef]
  49. Gebbing, T.; Schnyder, H. Pre–anthesis reserve utilization for protein and carbohydrate synthesis in grains of wheat. Plant Physiol. 1999, 121, 871–878. [Google Scholar] [CrossRef] [Green Version]
  50. Estrada-Campuzano, G.; Slafer, G.A.; Miralles, D.J. Differences in yield, biomass and their components between triticale and wheat grown under contrasting water and nitrogen environments. Field Crop. Res. 2012, 128, 167–179. [Google Scholar] [CrossRef]
  51. Van Herwaarden, A.F.; Farquhar, G.D.; Angus, J.F.; Richards, R.A.; Howe, G.N. ‘Haying-off’ the negative grain yield response of dryland wheat to nitrogen fertiliser. I. Biomass, grain yield, and water use. Aust. J. Agric. Res. 1998, 49, 1067–1081. [Google Scholar] [CrossRef]
  52. Schnyder, H. The role of carbohydrate storage and redistribution in the source–sink relations of wheat and barley during grain filling. A review. New Phytol. 1993, 123, 233–245. [Google Scholar] [CrossRef]
  53. Liang, X.; Liu, Y.; Chen, Y.; Adams, C. Late–season photosynthetic rate and senescence were associated with grain yield in winter wheat of diverse origin. J. Agron. Crop. Sci. 2018, 204, 1–12. [Google Scholar] [CrossRef]
  54. Acreche, M.M.; Slafer, G.A. Grain weight, radiation interception and use efficiency as affected by sink–strength in Mediterranean wheats released from 1940 to 2005. Field Crop. Res. 2009, 110, 98–105. [Google Scholar] [CrossRef]
  55. Tränkner, M.; Tavakol, E.; Jákli, B. Functioning of potassium and magnesium in photosynthesis, photosynthate translocation and photoprotection. Physiol. Plant. 2018, 163, 414–431. [Google Scholar] [CrossRef] [PubMed] [Green Version]
  56. Ceylan, Y.; Kutman, U.B.; Mengutay, M.; Cakmak, I. Magnesium application to growth medium and foliage affect the starch distribution, increase the grain size and improve the seed germination in wheat. Plant Soil 2016, 406, 145–156. [Google Scholar] [CrossRef]
  57. Popović, V.; Ljubičić, N.; Kostić, M.; Radulović, M.; Blagojević, D.; Ugrenović, V.; Popović, D.; Ivošević, B. Genotype × Environment Interaction for Wheat Yield Traits Suitable for Selection in Different Seed Priming Conditions. Plants 2020, 9, 1804. [Google Scholar] [CrossRef] [PubMed]
  58. Ljubičić, N.; Popović, V.; Ćirić, V.; Kostić, M.; Ivošević, B.; Popović, D.; Pandžić, M.; El Musafah, S.; Janković, S. Multivariate Interaction Analysis of Winter Wheat Grown in Environment of Limited Soil Conditions. Plants 2021, 10, 604. [Google Scholar] [CrossRef] [PubMed]
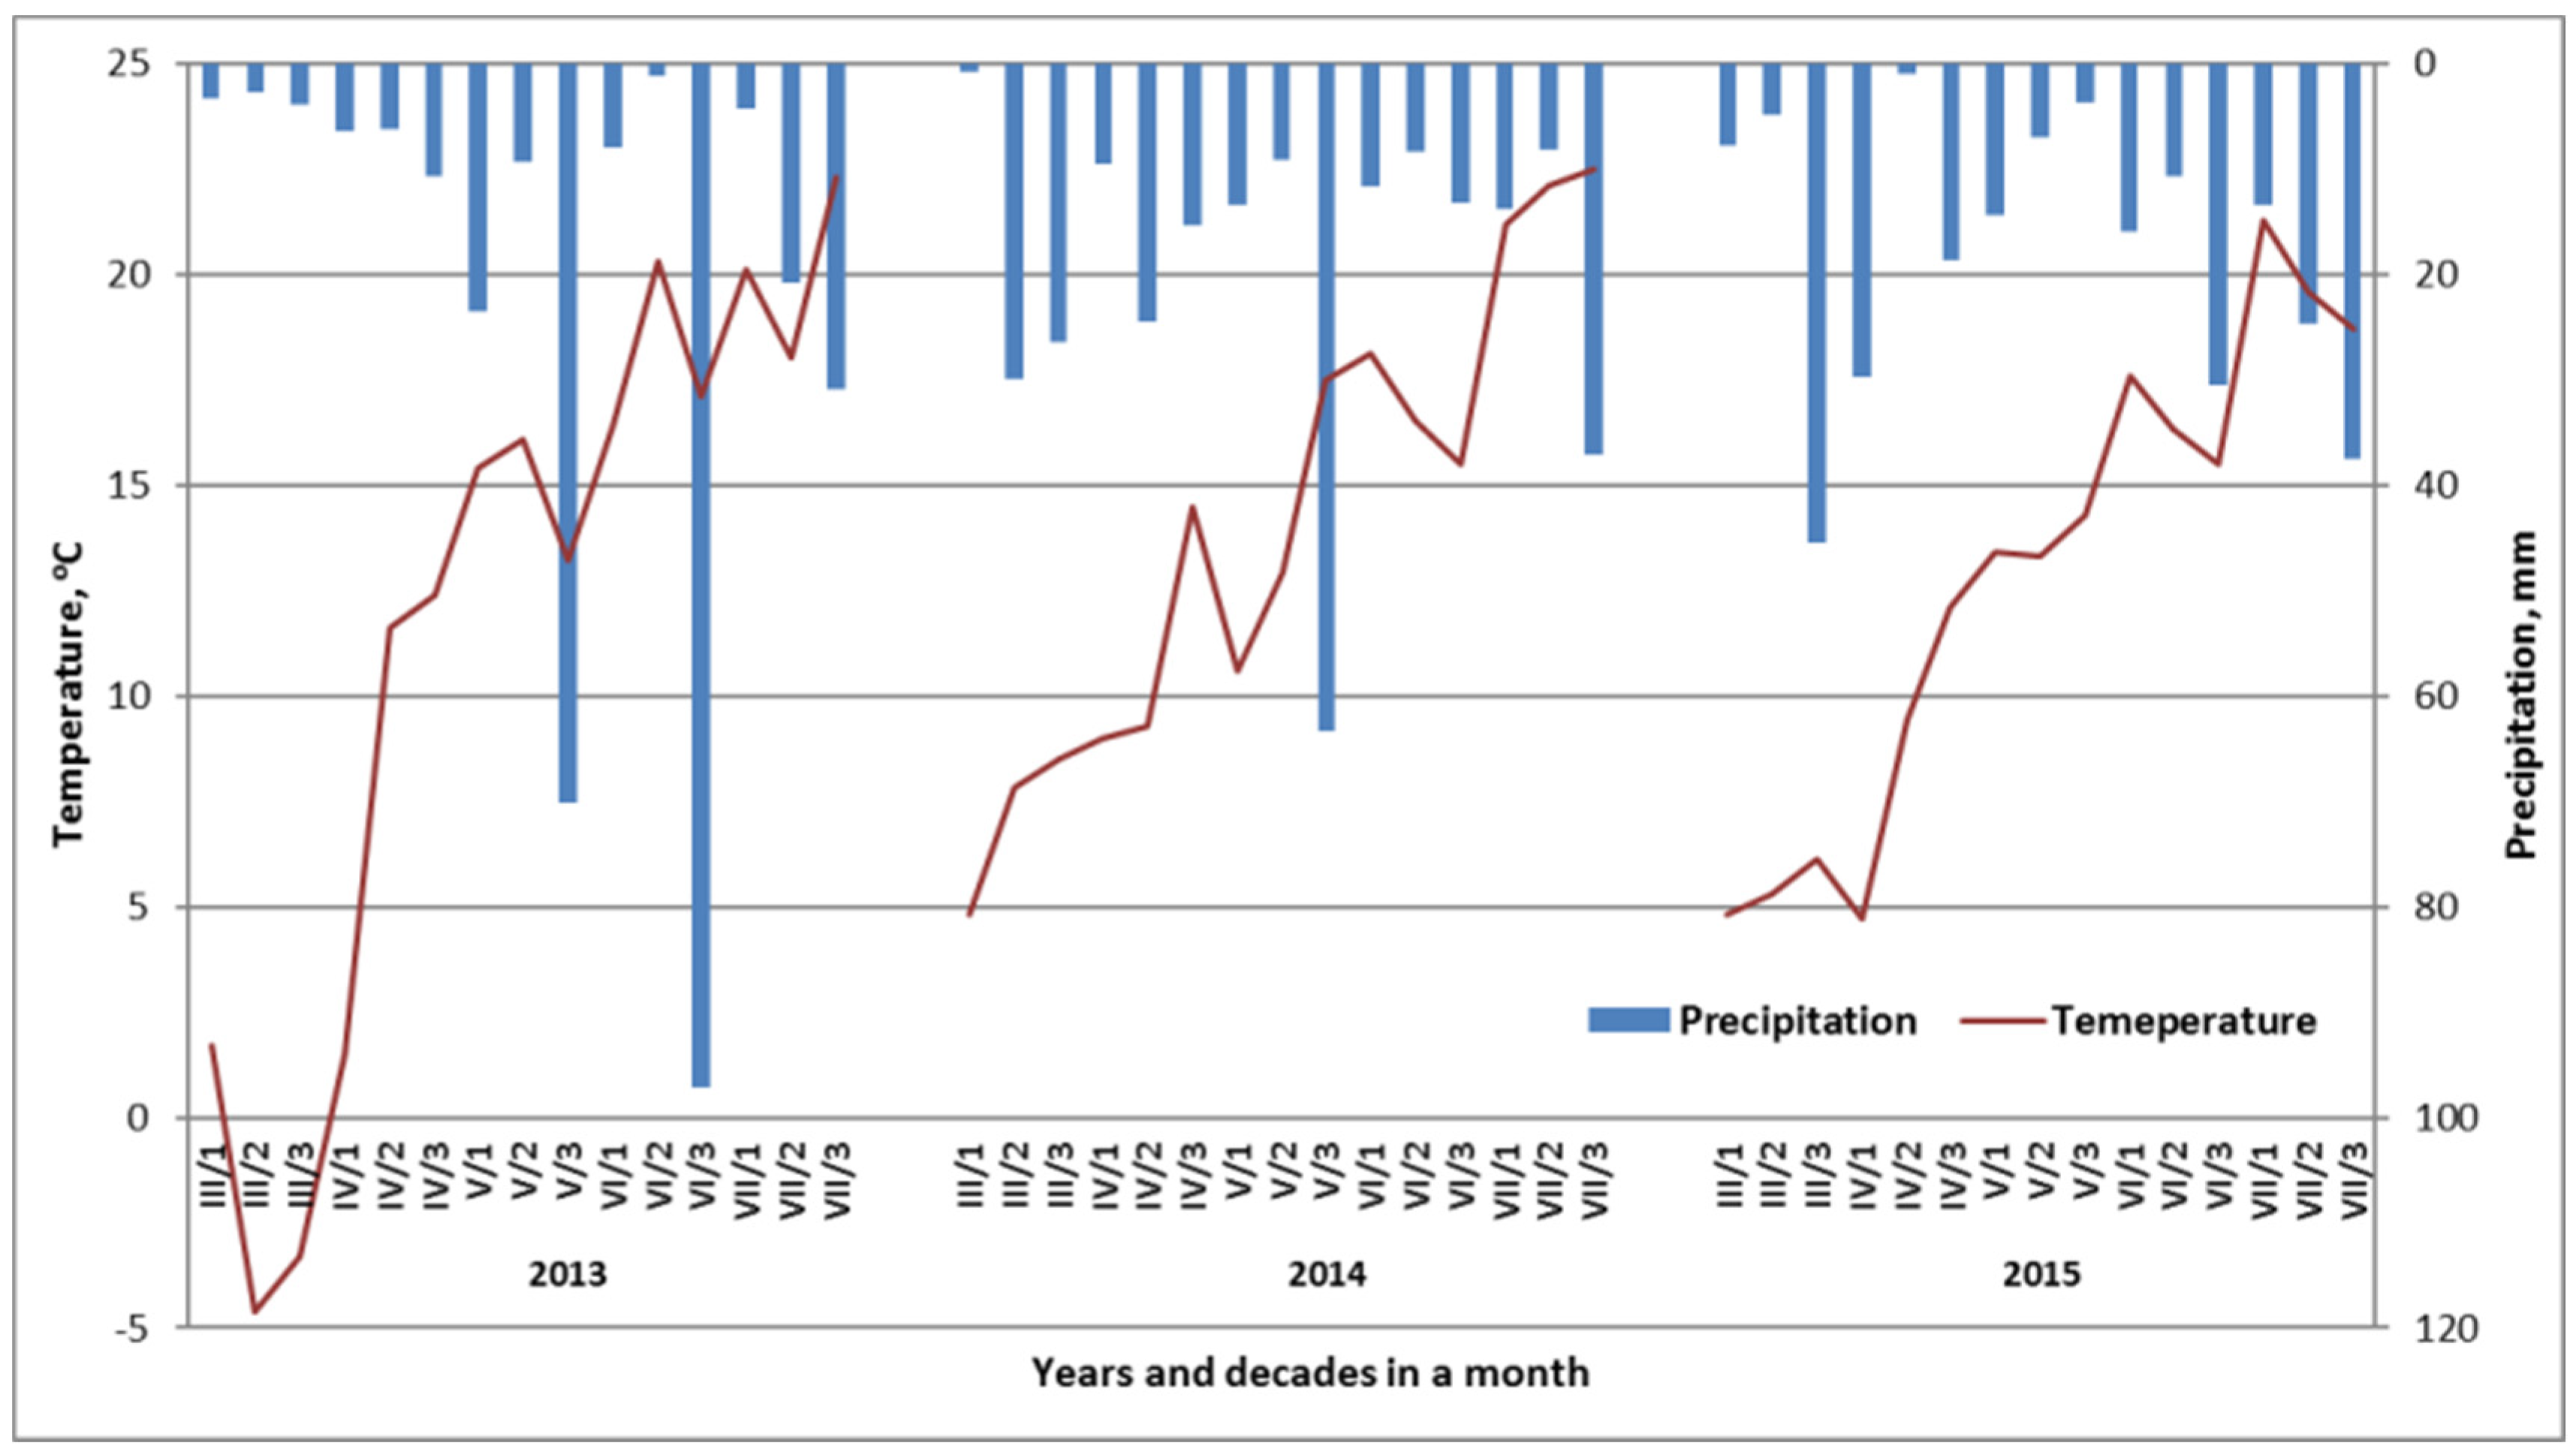
Figure 1. Weather conditions during the consecutive growing seasons.
Agronomy 12 00012 g001
Figure 2. Effect of magnesium fertilization systems on the grain yield of wheat. a, b, c similar letters mean a lack of significant differences using Tukey’s test; Legend: Mgs, Mgf—soil and foliar Mg fertilization system, respectively.
Agronomy 12 00012 g002
Figure 3. Effect of magnesium fertilization systems on the background of years on the leaf biomass of winter wheat at the BBCH 58 stage. Similar letters mean a lack of significant differences using Tukey’s test. Legend: Mgs, Mgf—soil and foliar Mg fertilization systems, respectively; I—BBCH 30; II—BBCH 49/50.
Agronomy 12 00012 g003
Figure 4. Effect of magnesium fertilization systems on the background of years on the temporary grain yield of winter wheat at the BBCH 79 stage. Similar letters mean a lack of significant differences using Tukey’s test. Legend: Mgs, Mgf—soil and foliar Mg fertilization systems, respectively; I—BBCH 30; II—BBCH 49/50.
Agronomy 12 00012 g004
Figure 5. Effect of magnesium fertilization systems on the background of years on the increment of the grain yield of winter wheat in the maturation phase. Similar letters mean a lack of significant differences using Tukey’s test. Legend: Mgs, Mgf—soil and foliar Mg fertilization systems, respectively; I—BBCH 30; II—BBCH 49/50.
Agronomy 12 00012 g005
Figure 6. Effect of magnesium fertilization systems on the background of years on the remobilized dry matter of winter wheat in the grain-filling period. Similar letters mean a lack of significant differences using Tukey’s test. Legend: Mgs, Mgf—soil and foliar Mg fertilization systems, respectively; I—BBCH 30; II—BBCH 49/50.
Agronomy 12 00012 g006
Figure 7. Effect of magnesium fertilization systems on the background of years on the current photosynthesis of winter wheat in the grain-filling period. Similar letters mean a lack of significant differences using Tukey’s test. Legend: Mgs, Mgf—soil and foliar Mg fertilization systems, respectively; I—BBCH 30; II—BBCH 49/50.
Agronomy 12 00012 g007
Figure 8. To BBCH 79. a,b,c similar letters mean a lack of significant differences using Tukey’s test. Legend: Mgs, Mgf—soil and foliar Mg fertilization systems, respectively; I—BBCH 30; II—BBCH 49/50.
Agronomy 12 00012 g008
Figure 9. Effect of magnesium fertilization systems on the background of years on the current photosynthesis of winter wheat from BBCH 58 to BBCH 79. Similar letters mean a lack of significant differences using Tukey’s test. Legend: Mgs, Mgf—soil and foliar Mg fertilization systems, respectively; I—BBCH 30; II—BBCH 49/50.
Agronomy 12 00012 g009
Figure 10. Effect of magnesium fertilization systems on the background of years on the remobilized dry matter of winter wheat in the maturation phase. Similar letters mean a lack of significant differences using Tukey’s test. Legend: Mgs, Mgf—soil and foliar Mg fertilization systems, respectively; I—BBCH 30; II—BBCH 49/50.
Agronomy 12 00012 g010
Figure 11. Effect of magnesium fertilization systems, on the background of years, on contribution of the remobilized dry matter and the current photosynthesis in the temporary grain yield at BBCH 79. Legend: Mgs, Mgf—soil and foliar Mg fertilization systems, respectively; I—BBCH 30; II—BBCH 49/50.
Agronomy 12 00012 g011
Figure 12. Effect of magnesium fertilization systems, on the background of years, on contribution of the remobilized dry matter and the current photosynthesis in the grain yield at BBCH 89. Legend: Mgs, Mgf—soil and foliar Mg fertilization systems, respectively; I—BBCH 30; II—BBCH 49/50.
Agronomy 12 00012 g012
Table 1. Soil characteristics of the experimental plots during 2012–2015 growing seasons.
YearSoil LayerpHP 1K 1Mg 2Nmin
(cm)1 M KClmg kg−1 soilkg ha−1
2012/20130–306.563.2 1 M 3157.7 M33.2 H76 4
30–6059.7 1 M107.9 M25.3 M
2013/20140–306.791.6 1 H168.0 M30.2 M74
30–6091.6 1 H153.6 M24.7 M
2014/20150–306.687.2 1 H182.6 H24.1 M57
30–6095.9 1 H149.9 M30.2 M
1 Egner–Riehm method; 2 Schachtschabel method; 3 Classes of the available nutrient content: M—medium, H—high; 4 Layer 0–90 cm (measured in 0.01 M CaCl2).
Table 2. Fertilization schedule.
TreatmentFertilization ScheduleN–P2O5–K2OMg—SoilMg—Foliar
kg ha−1
1.1NPK190-70-8000
2.1NPK—Mg foliar BBCH 30190-70-8002.4
2.2NPK—Mg foliar BBCH 49/50190-70-8004.0
2.3NPK—Mg foliar BBCH 30 + 49.50190-70-8006.4
3.1NPK—Mg soil190-70-80250
3.2NPK—Mg soil + foliar BBCH 30190-70-80252.4
3.3NPK—Mg soil + foliar BBCH 49/50190-70-80254.0
3.4NPK—Mg soil + foliar BBCH 30 + 49/50190-70-80256.4
4.1NPK—Mg soil190-70-80500
4.2NPK—Mg soil + foliar BBCH 30190-70-80502.4
4.3NPK—Mg soil + foliar BBCH 49/50190-70-80504.0
4.4NPK—Mg soil + foliar BBCH 30 + 49/50190-70-80506.4
Table 3. Statistical evaluation of factors affecting in-season yields of winter wheat and yield basic parameters.
FactorLevel of
Factor
GY 2EDGRGDTGW
t ha−1No. m−2No. ear−1No. m−2g
Year
(Y)
20138.459 c496.6 c36.4 b18,073 c51.4 a
201410.934 a639.9 b43.2 a27,668 a45.8 b
20159.689 b684.2 a31.5 c21,554 b45.9 b
P************
Mg soil
(MgS)
kg ha−1
09.536 b606.7 ab35.8 b21,676 c47.7
259.716 a595.9 b37.6 a22,438 ab47.9
509.830 a618.1 a37.8 a23,181 a47.5
P********n.s.n.s.
Mg foliar 1
(MgF)
terms
09.428 b595.3 b36.1 c21,374 c47.2 b
I9.793 a624.5 a37.2 b23,094 ab47.4 ab
II9.713 a597.3 b36.9 bc21,976 bc48.1 a
I + II9.842 a610.4 ab38.1 a23,283 a48.1 a
P************
Source of variation for interactions
Y × MgSn.s. *****n.s.n.s.
Y × MgFn.s.*****n.s.n.s.
MgS × MgF*n.s.n.s.*n.s.
Y × MgS × MgFn.s.**n.s.n.s.n.s.
a, b, c similar letters mean a lack of significant differences using Tukey’s test; ***, **, and * indicate significant differences at p < 0.001, p < 0.01, and p < 0.05, respectively; n.s. = not significant. Legend: 1 I—BBCH 30; II—BBCH 49/50; GY 2—grain yield (86% DW); ED—ears’ density; GR—grain per ear; GD—grain density per m2; TGW—thousand grain weight.
Table 4. Statistical evaluation of factors affecting wheat biomass at critical stages of the grain-filling period.
Factor Level of FactorLE58ST58EA58T58LE79ST79CH79GY79T79LE89ST89CH89GY89dGYT89
t ha−1 DW
Year
(Y)
20131.35 c5.27 c2.36 c8.99 b1.37 b6.52 a2.42 b6.22 c16.54 c1.01 c4.33 c2.49 b7.27 c1.05 b15.11 c
20142.40 a7.41 a3.15 b12.97 a2.10 a5.73 b2.79 a7.10 b17.73 b1.64 b5.16 b2.78 a9.40 a2.30 a18.98 a
20152.04 b6.97 b3.88 a12.88 a2.00 a6.66 a2.22 c7.92 a18.80 a1.67 a6.19 a2.09 c8.33 b0.41 c18.28 b
P*********************************************
Mg soil
(MgS)
kg ha−1
01.79 b6.26 b2.80 b10.85 b1.816.232.437.0617.531.415.24 ab2.408.20 a1.1417.25 b
252.04 a6.68 a3.28 a12.00 a1.796.342.487.1217.741.465.09 b2.448.36 b1.2317.35 b
501.96 a6.71 a3.32 a11.99 a1.866.342.527.0717.791.455.35 a2.528.45 b1.3917.77 a
P************n.s.n.s.n.s.n.s.n.s.n.s.*n.s.***n.s.**
Mg foliar
(MgF)
01.88 b6.573.1111.561.71 b6.152.467.1217.441.405.072.368.11 b0.99 b16.94 b
I1.93 ab6.503.0411.481.76 b6.252.427.0817.511.445.272.538.42 a1.35 a17.67 a
II1.90 ab6.473.3011.671.97 a6.512.507.0618.041.435.272.438.35 a1.30 ab17.49 a
I + II2.01 a6.663.0711.741.85 ab6.302.527.0817.761.485.292.498.46 ba1.38 a17.73 a
P*n.s.n.s.n.s.***n.s.n.s.n.s.n.sn.s.n.s.n.s.********
Source of variation for interactions between factors
Y × MgS****n.s.n.s.**n.s. n.s***n.s.n.sn.sn.s.n.s.**n.s.
Y × MgF****n.s*****n.s.*******n.s.n.s.n.s.***
MgS × MgF*n.s. n.s.n.s.n.s.**n.s.*n.s.***n.s.*n.sn.s.
Y × MgS × MgF*********n.s.*****n.s. **n.s.n.s.n.s.*n.s.
a, b, c similar letters mean a lack of significant differences using Tukey’s test; ***, **, and * indicate significant differences at p < 0.001, p < 0.01, and p < 0.05, respectively; n.s. not significant. Legend: Mgs, Mgf—soil and foliar Mg fertilization systems, respectively; I—BBCH 30; II—BBCH 49/50; GY—grain yield; LE, ST, EA, CH, T—biomass of leaves, stems, ears, chaffs, total grain; dGY89—grain yield increment during the period BBCH 79–89; 58, 78, 89—growth stages of winter wheat in accordance with the BBCH scale.
Table 5. Indices of winter wheat biomass partitioning during the grain-filling period.
Factor Level
of Factor
Tv79Tv89REQ89RE89ReG89CP89CPC89CPG89
t ha−1%t ha−1%
Year201310.3 b7.8 c1.2 b11.8 b15.9 b6.1 a70.1 a84.1 a
(Y)201410.6 ab9.6 b3.4 a25.4 a36.1 a6.0 ab47.9 b63.9 b
201510.9 a9.9 a2.9 a21.9 a35.3 a5.4 b43,4 b64.7 b
P********************
Mg soil010.59.11.8 b15.2 b21.5 b6.4 a61.7 a78.5 a
(MgS)2510.69.03.0 a23.3 a35.2 a5.4 b48.1 b64.8 b
kg ha−15010.79.32.7 a20.6 a30.6 a5.8 b51.6 b69.4 b
Pnsns******************
Mg foliar1010.3 b8.8 b2.720.731.95.451.768.1
(MgF)I10.4 ab9.2 a2.217.625.96.257.574.1
II11.0 a9.1 a2.521.130.25.851.569.8
I + II10.7 ab9.3 a2.519.328.46.054.771.6
P**nsnsnsnsnsns
Source of variation for interactions between factors
Y × MgSnsnsnsnsnsnsnsns
Y × MgF***************
MgS × MgF*nsnsnsnsnsnsns
Y × MgS × MgFnsns***********
a, b, c similar letters mean a lack of significant differences using Tukey’s test; ***, **, and * indicate significant differences at p < 0.001, p < 0.01, and p < 0.05, respectively; ns—nonsignificant. Legend: Mgs, Mgf—soil and foliar Mg fertilization systems, respectively 1 I—BBCH 30; II—BBCH 49/50; Tv79, Tv89—total biomass of wheat vegetative organs; REQ—remobilization quota; RE—remobilization efficiency of REQ; ReG—contribution of REQ in the grain yield; CP—current photosynthesis; CPE—efficiency of CP; CPG—contribution of CP in the grain yield; 79, 89—growth stages of winter wheat in accordance with the BBCH scale.
Table 6. Indices of winter wheat biomass partitioning during the periods of grain formation and maturation.
FactorLevel of FactorREQ
d79
RE
d79
ReE
d79
CPd
d79
CPE
d79
CPG
d79
REQ
d89
RE
d89
ReG
d89
CP
d89
CPE
d89
CPG
d89
t ha−1%t ha−1%t ha−1%t ha−1%
Year
(Y)
2013−1.32 a−15.9 a−21.0 a7.55 c45.3 a121.0 b2.48 b14.5 b117.1 b−1.42 a−9.68 a−77.1 a
20142.35 b17.0 b33.4 b4.76 a26.3 a66.5 a1.05 a5.6 a50.2 a1.25 c6.39 c49.8 b
20152.01 b14.9 b25.8 b5.92 b31.2 b74.2 a0.93 a4.59 a301.3 a−0.52 b−2.92 b−201.3 b
P*********************************n.s.
Mg soil
(MgS)
kg ha−1
00.38 a0.6 a4.1 a6.68 b37.07 b95.9 b1.427.9856.5−0.28−2.6643.5
251.38 b8.3 b17.9 b5.74 a32.29 a82.1 a1.628.9557.8−0.39−2.7742.2
501.27 b7.2 b16.4 b5.80 a32.44 a83.6 a1.427.79414.3−0.03−0.79−314.3
P*************n.s.n.s.n.s.n.s.n.s.n.s.
Mg foliar 1
(MgF)
01.246.515.45.8833.884.61.498.32−97.3−0.50−3.50197.3
I1.045.913.76.0434.486.31.196.7417.30.150.1082.7
II0.694.28.76.3635.291.31.8510.13467.5−0.55−3.61−367.5
I + II1.074.813.56.0233.786.51.417.77317.3−0.03−1.26−217.3
Pn.s.n.s.n.s.n.s.n.s.n.s.n.s.n.s.n.s.*n.s.n.s.
Source of variation for interactions between factors
Y × MgSnsnsnsnsnsnsnsnsnsnsnsns
Y × MgF******************nsnsnsnsnsns
MgS × MgF*****************nsnsnsnsnsns
Y × MgS × MgF***ns *****nsns *ns
a, b, c similar letters mean a lack of significant differences using Tukey’s test; ***, **, and * indicate significant differences at p < 0.001, p < 0.01, and p < 0.05, respectively; ns—nonsignificant. Legend: Mgs, Mgf—soil and foliar Mg fertilization systems, respectively; 1 I—BBCH 30; II—BBCH 49/50; REQ—remobilization quota; RE—remobilization efficiency; ReG—contribution of REQ in the grain yield; CP—current photosynthesis; CPE—efficiency of CP; CPG—contribution of CP in the grain yield; d79, d89—growth stages of winter wheat in accordance with the BBCH scale, referring to the respective periods of BBCH 58–BBCH 79 and BBCH 79–BBCH 89.
Publisher’s Note: MDPI stays neutral with regard to jurisdictional claims in published maps and institutional affiliations.