Article

Responses of the Lodging Resistance of Summer Maize with Different Gene Types to Plant Density

1
College of Agronomy, Jilin Agricultural University, Changchun 130118, China
2
State Key Laboratory of Crop Biology, College of Agronomy, Shandong Agricultural University, Tai’an 271018, China
*
Authors to whom correspondence should be addressed.
These authors contributed equally to this work.
Agronomy 2022, 12(1), 10; https://doi.org/10.3390/agronomy12010010
Submission received: 13 November 2021 / Revised: 13 December 2021 / Accepted: 16 December 2021 / Published: 22 December 2021

Abstract

:
The appropriate increase of planting densities is the key to the obtainment of high-yield maize (Zea mays L.). However, lodging is a major constraint to limit grain yield under increased planting density in present maize production. Effects of population density on stalk lodging and agronomic traits were investigated using two maize cultivars Denghai 618 (DH618, low stalk with low spike height) and Xianyu335 (XY335, high stalk with high spike height). Four levels of density treatment were imposed by 1.5, 6.0, 7.5, and 9.0 × 10⁴ plants ha−1. Results showed that bending strength, rind penetration strength, maximum bending strength, dry weight, and internode diameter of maize were significantly decreased with the increase of planting density. The change range of XY335 with the increase of planting density was significantly larger than that of DH618, showing a high sensitivity to planting density. In addition, the thickness of cortex and vascular bundle sclerenchyma cells was significantly reduced with the increase of planting density. Compared with 1.5 × 10⁴ plants ha−1, the thickness of the above-ground third internode stem cortex was decreased by 9.64%, 12.72%, and 20.77% for DH618, and 19.26%, 30.49%, and 37.45% for XY335 at 6.0, 7.5, and 9.0 × 10⁴ plants ha−1, respectively. The thickness of vascular bundle sclerenchyma cells at 1.5 × 10⁴ plants ha−1 was decreased by 7.75%, 12.44%%, and 17.89% for DH618, 10.18%, 15.21%, and 24.73% for XY335, compared to those at 6.0, 7.5, and 9.0 × 10⁴ plants ha−1, respectively. Visibly, with the increase of planting density, the thickness of cortex and vascular bundle sclerenchyma cells, and the number of vascular bundles were all significantly decreased, resulting in the increase of lodging rate. However, the extent of variation in these parameters for short-plant height hybrid was less than those for high-plant height hybrid, and the yield of short-plant height hybrid was greater than that of high-plant height hybrid, indicating that short-plant height hybrid has better resistance to lodging with higher yield at higher planting density. Therefore, lodging resistance and yield can be improved through selection and breeding strategies that achieving synergistic development of diameter, dry weight per unit, and cortex thickness in maize basal internodes.

1. Introduction

Maize (Zea mays L.) is one of the most important food and economic crops cultivated worldwide, with the development of social production, the demand for maize will greatly increase. However, lodging has always been the main problem facing maize production [1]. Maize lodging is affected by many factors, such as variety, planting density, pests and diseases, and disastrous weather [2]. The precipitation is mostly concentrated in the growing season of summer maize in the Huang-Huai-Hai area, where it is easy to cause water accumulation in farmland during the rainy season. As a high stalk crop, maize is prone to lodging after waterlogging. In addition, with the increase of planting density, population quality was greatly affected, and lodging has become one of the important limiting factors for the increase of summer maize yield in this region [3,4]. Therefore, planting density and lodging resistant is the key to high and stable yield of maize. The most important measures to improve crop potential yield include the increase of plant density, high-efficiency utilization of light and temperature resources, and improving tolerance to crowing stress [5,6,7]. One of the important ways to achieve a high-yield breakthrough is to select and breed maize hybrids with high density planting resistant in China. In recent decades, the improvement of summer maize yields is mainly due to the increase of plant population density and single plant productivity [8,9]. Increasing planting density is one of the key techniques to further increase maize yield. At present, the average planting density in the United States is 67,500~82,500 plants ha−1 [10], while it is only 52,500~60,000 plants ha−1 in China. Compared with the evolution and development of maize production technology in the world and China, it is shown that increasing planting density is one of the key cultivation measures to increase maize yield in the past 50 years [6,9]. The competition for various resources—such as light and fertilizer—is more intense, which leads to the weak stem of maize plant, the inhibition of root extension, and the easy lodging. Some high plant hybrids often fall over, resulting in a greater yield reduction [11,12]. Lodging is one of main limiting factors for high maize yield. From jointing stage to mature stage, stalk lodging may occur in maize [13,14,15]. It is important to find out the mechanism of stalk lodging for high-yield maize at high plant density.
After maize lodging, the population structure is destroyed, the normal distribution order of leaves in space is disturbed, and the photosynthetic efficiency of leaves decrease significantly [16], while the transportation system of stem is limited after stem fold, which affects the transportation of water and nutrients from roots to leaves. It also affects the transportation of photosynthate from leaf to ear, resulting in a significant reduction of yield. If the stem fold is serious, the above part of the wound will dry and die, leading to the inhibition of photosynthate and grain filling, and the decrease of yield becoming more serious, with potentially no grain yield at all [16,17]. Lodging is one of the important limiting factors that affecting the yield of summer maize. Lodging can occur in different stages [18], and the yield of 108 kg ha−1 decreases with the increase of the lodging rate [19]. Lodging not only causes great difficulty to harvest, but it also results in great loss of grain yield and quality. The loss of corn production for the U.S. due to lodging is reported to be between 5% and 25%, and up to 40% with barley [13].
The persistent breeding efforts in recent years for high grain yield under crowding stress has not only led to incremental yield increase but also elucidated underlying key traits, which played an important role to impart tolerance to lodging stress [20]. Germplasm creation can be used to improve lodging resistance, and comprehensive analysis of hybrids and cultivation techniques is the key to further increase planting density and yield [21].
Lodging resistance of maize have been explored from the aspects of lodging type, planting density, mechanical strength of stem, etc., while it was limited to the effect of lodging phenomenon on maize plant development and maize production. Moreover, there were few reports on the mechanism of anti-lodging. Our study was to determine the lodging resistance of two different types of maize varieties under different population densities. The physiological factors affecting lodging resistance are also studied in order to provide a theoretical basis for high yield cultivation of maize.

2. Materials and Methods

2.1. Research Site and Experimental Design

The field experiment was conducted in 2014 and 2016 at the high-yield test field of Shandong Denghai Seeds Co., Ltd. (E: 119° 56.6′, N: 37° 20.7′), Yantai, China. The previous crop in the test plot was winter wheat. The soil type was sandy loam. Concentrations of organic matter, total N, available nitrogen, rapidly available phosphorous (P), and rapidly available potassium (K) in the upper 20 cm of soil were 1.15%, 0.096%, 69.7 mg kg−1, 48.5 mg kg−1, and 118.6 mg kg−1, respectively. Two summer maize hybrids with different plant types: Denghai 618 (DH618, low stalk with low spike height) and Xianyu335 (XY335, high stalk with high spike height) were selected as experimental materials. Four planting densities of 1.50 × 10⁴, 6.0 × 10⁴, 7.5 × 10⁴, and 9.0 × 10⁴ plants ha−1 were established respectively. The plot area was 18 × 3.6 m. A row spacing of 60 cm was used for all planting densities, while plant spacing within rows was set at 111.1, 27.8, 22.2, and 18.5 cm, for 1.50 × 10⁴, 6.0 × 10⁴, 7.5 × 10⁴, and 9.0 × 10⁴ plants ha−1, respectively. Each treatment was replicated three times, in a completely randomized block design.
A total of 300 kg ha−1 N (urea, 46% N), 100 kg ha−1 P (superphosphate, 17% P2O5), and 200 kg ha−1 K (potassium chloride, 60% K2O) were applied aiming at a yield of 11,250 kg ha−1. Nitrogen fertilizer was split into two applications, 40% at BBCH code 16 and 60% at BBCH code 22. Total P and K doses were applied in a single application at BBCH code 16. Disease, weeds, and pests were well controlled in each treatment. The herbicide of 90% atrazine acetochlor was diluted 2000–3000 times and sprayed on the whole field surface by 600 L ha−1 before BBCH code 09 to control weeds; the pesticides of 50% phoxim emulsifiable concentrate were diluted 1000 times by water and sprayed by 750 L ha−1 at BBCH code 19 to control maize borers. Other management methods are carried out at the level of high-yield fields.

2.2. External Morphology

At 35 days after tasseling stage (VT + 35 d), 15 representative plants were randomly selected in the field to measure plant height and ear height by steel tape measure, the diameters of internode from the third to sixth internode by vernier caliper, and the corresponding length of internode by steel tape measure. The method of measuring the barycenter height was as follows: lift the whole plant horizontally with a thin rope and measure the distance from the base of the stem to the balance fulcrum with a steel tape gauge as the height of the gravity center.

2.3. Maximum Bending Resistance and Field Lodging Rate

At the 12th leaf stage (V12), tasseling stage (VT), and VT + 35 d, 4 representative plants were randomly selected in the field, and the vertical stem was thrust at the center of the sixth section of the plant with a YYD-1 stalk strength tester (Zhejiang Top Instrument Co., Ltd., Hangzhou, China). The maximum applied pressure (peak value) is the maximum bending resistance of the stem until the culm was folded upside down.
At physiological maturity stage (R6), the numbers of lodging plants (<30° to the ground) and the total numbers of plants were surveyed to calculate lodging rate.
Field lodging rate = number of lodging plants/total number of plants.

2.4. Rind Penetration Strength and Bending Strength

At V12, VT, and VT + 35 d, 10 representative plants were randomly sampled in the field, and the leaf sheath was peeled off. The test head with a certain cross-sectional area (for example, 0.01 cm2) was inserted in the middle of the stem of the stem, and the maximum value of the penetration stem epidermis was read and the average value was repeated 3 times. The 1, 3, 5 rind penetration strength and the 2, 4, 6 internodes bending strength were measured respectively.

2.5. Dry Weight and Dry Weight per Unit of Internode

At VT + 35 d, 4 representative plants were randomly selected in the field, and the leaf sheath was peeled off. The third to sixth internode was excised from each plant and placed into paper bags. Internodes were subjected to enzyme deactivation at 105 °C for 30 min followed by drying at 80 °C to a constant weight. The internode dry weight per unit was calculated with the formula
Dry weight per unit (g cm−1) = dry weight/internode length

2.6. Micro-Structure of the Stem

At VT + 35 d, 4 representative plants were randomly selected in the field, and the middle part of the third node of stem was fixed with 70% ethanol in FAA fixed solution handslicing and saffron staining were used. The vascular bundle structure in stem was observed by OlympusBX51 fluorescence microscope and the structure of vascular bundle was observed and photographed. Indices, such as the thickness of cortex and sclerenchyma cells in the vascular bundle, were measured by micrometer.

2.7. Biological Yield and Grain Yield

At R6, 15 representative plants were selected in the field, and the aboveground biomass of plants was sampled to determine the dry weight and dry kernel weight per plant. The plants in the middle two rows of each plot, where no previous sampling occurred, were counted and harvested for assessing grain yield.

2.8. Statistical Analysis

The data for each year were analyzed separately. SPSS 17.0 were used for testing different treatments by one-way analysis of variance (ANOVA) and the least significant difference (LSD) test at p < 0.05 probability. The interaction effect between hybrid and planting density was analyzed using general linear model in SPSS 17.0. Correlations were estimated by using Pearson’s test at p < 0.05, after Bonferroni’s adjustment for multiple comparisons. Correlations were calculated using an average of two years of data.

3. Results

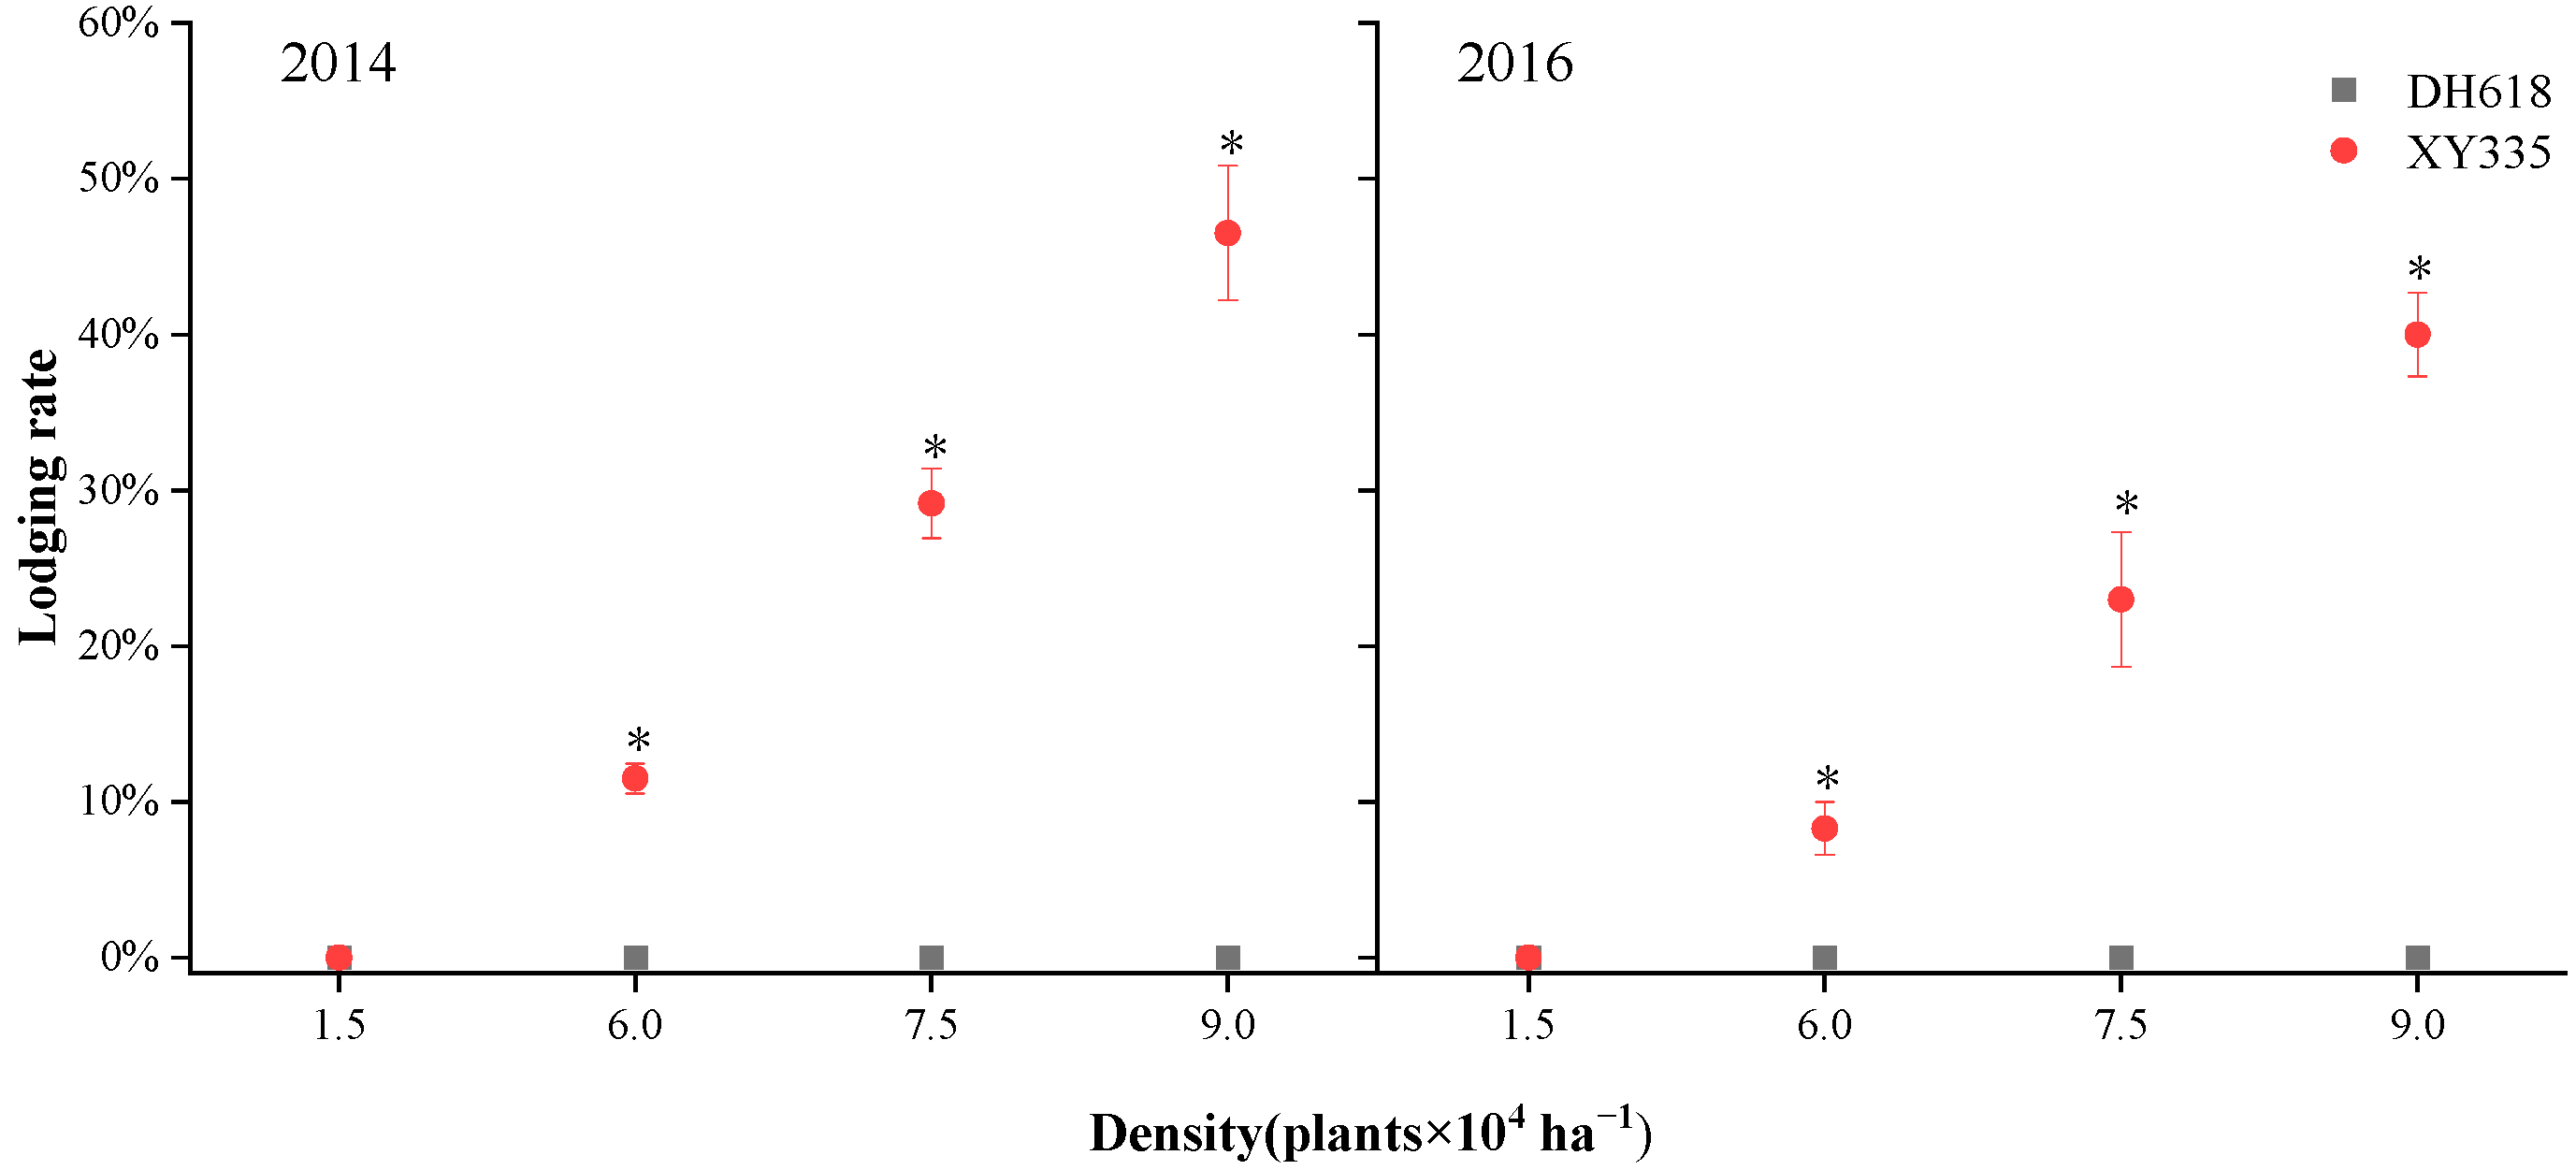
3.1. Maximum Bending Strength and Field Lodging Rate

There was no field lodging in both cultivars under low density. With the increase of density, there was no lodging in DH618, while the lodging rate of XY335 increased linearly. When the planting density increased to 90,000 plants of ha−1, the lodging rate of XY335 reached 43.3% across years (Figure 1). As growth proceeded, the maximum lodging resistance of four densities of DH618 increased in varying degrees, while that of XY335 at 15,000 plants ha−1 and 60,000 plants ha−1 increased as growth proceeded. At 75,000 plants ha−1 and 90,000 plants ha−1, the maximum lodging resistance in the field was found at VT + 35d (Table 1). With the increase of density, the bending strength of two varieties decreased significantly (Figure 2). Under different densities, the two varieties had different lodging resistance. At low density (15,000 plants ha−1), XY335 was significantly higher than DH618, and the maximum resistance to reverse folding of XY335 was significantly lower than that of DH618 after the density increased to 60,000 plants ha−1 (Table 1). It could be seen that the plant development of XY335 was superior to that of DH618 under the condition of sufficient light and no competition for survival. However, the plant development of XY335 quickly appeared to be poor, and the ability of resisting lodging was obviously lower than that of DH618, with the increase of planting density.

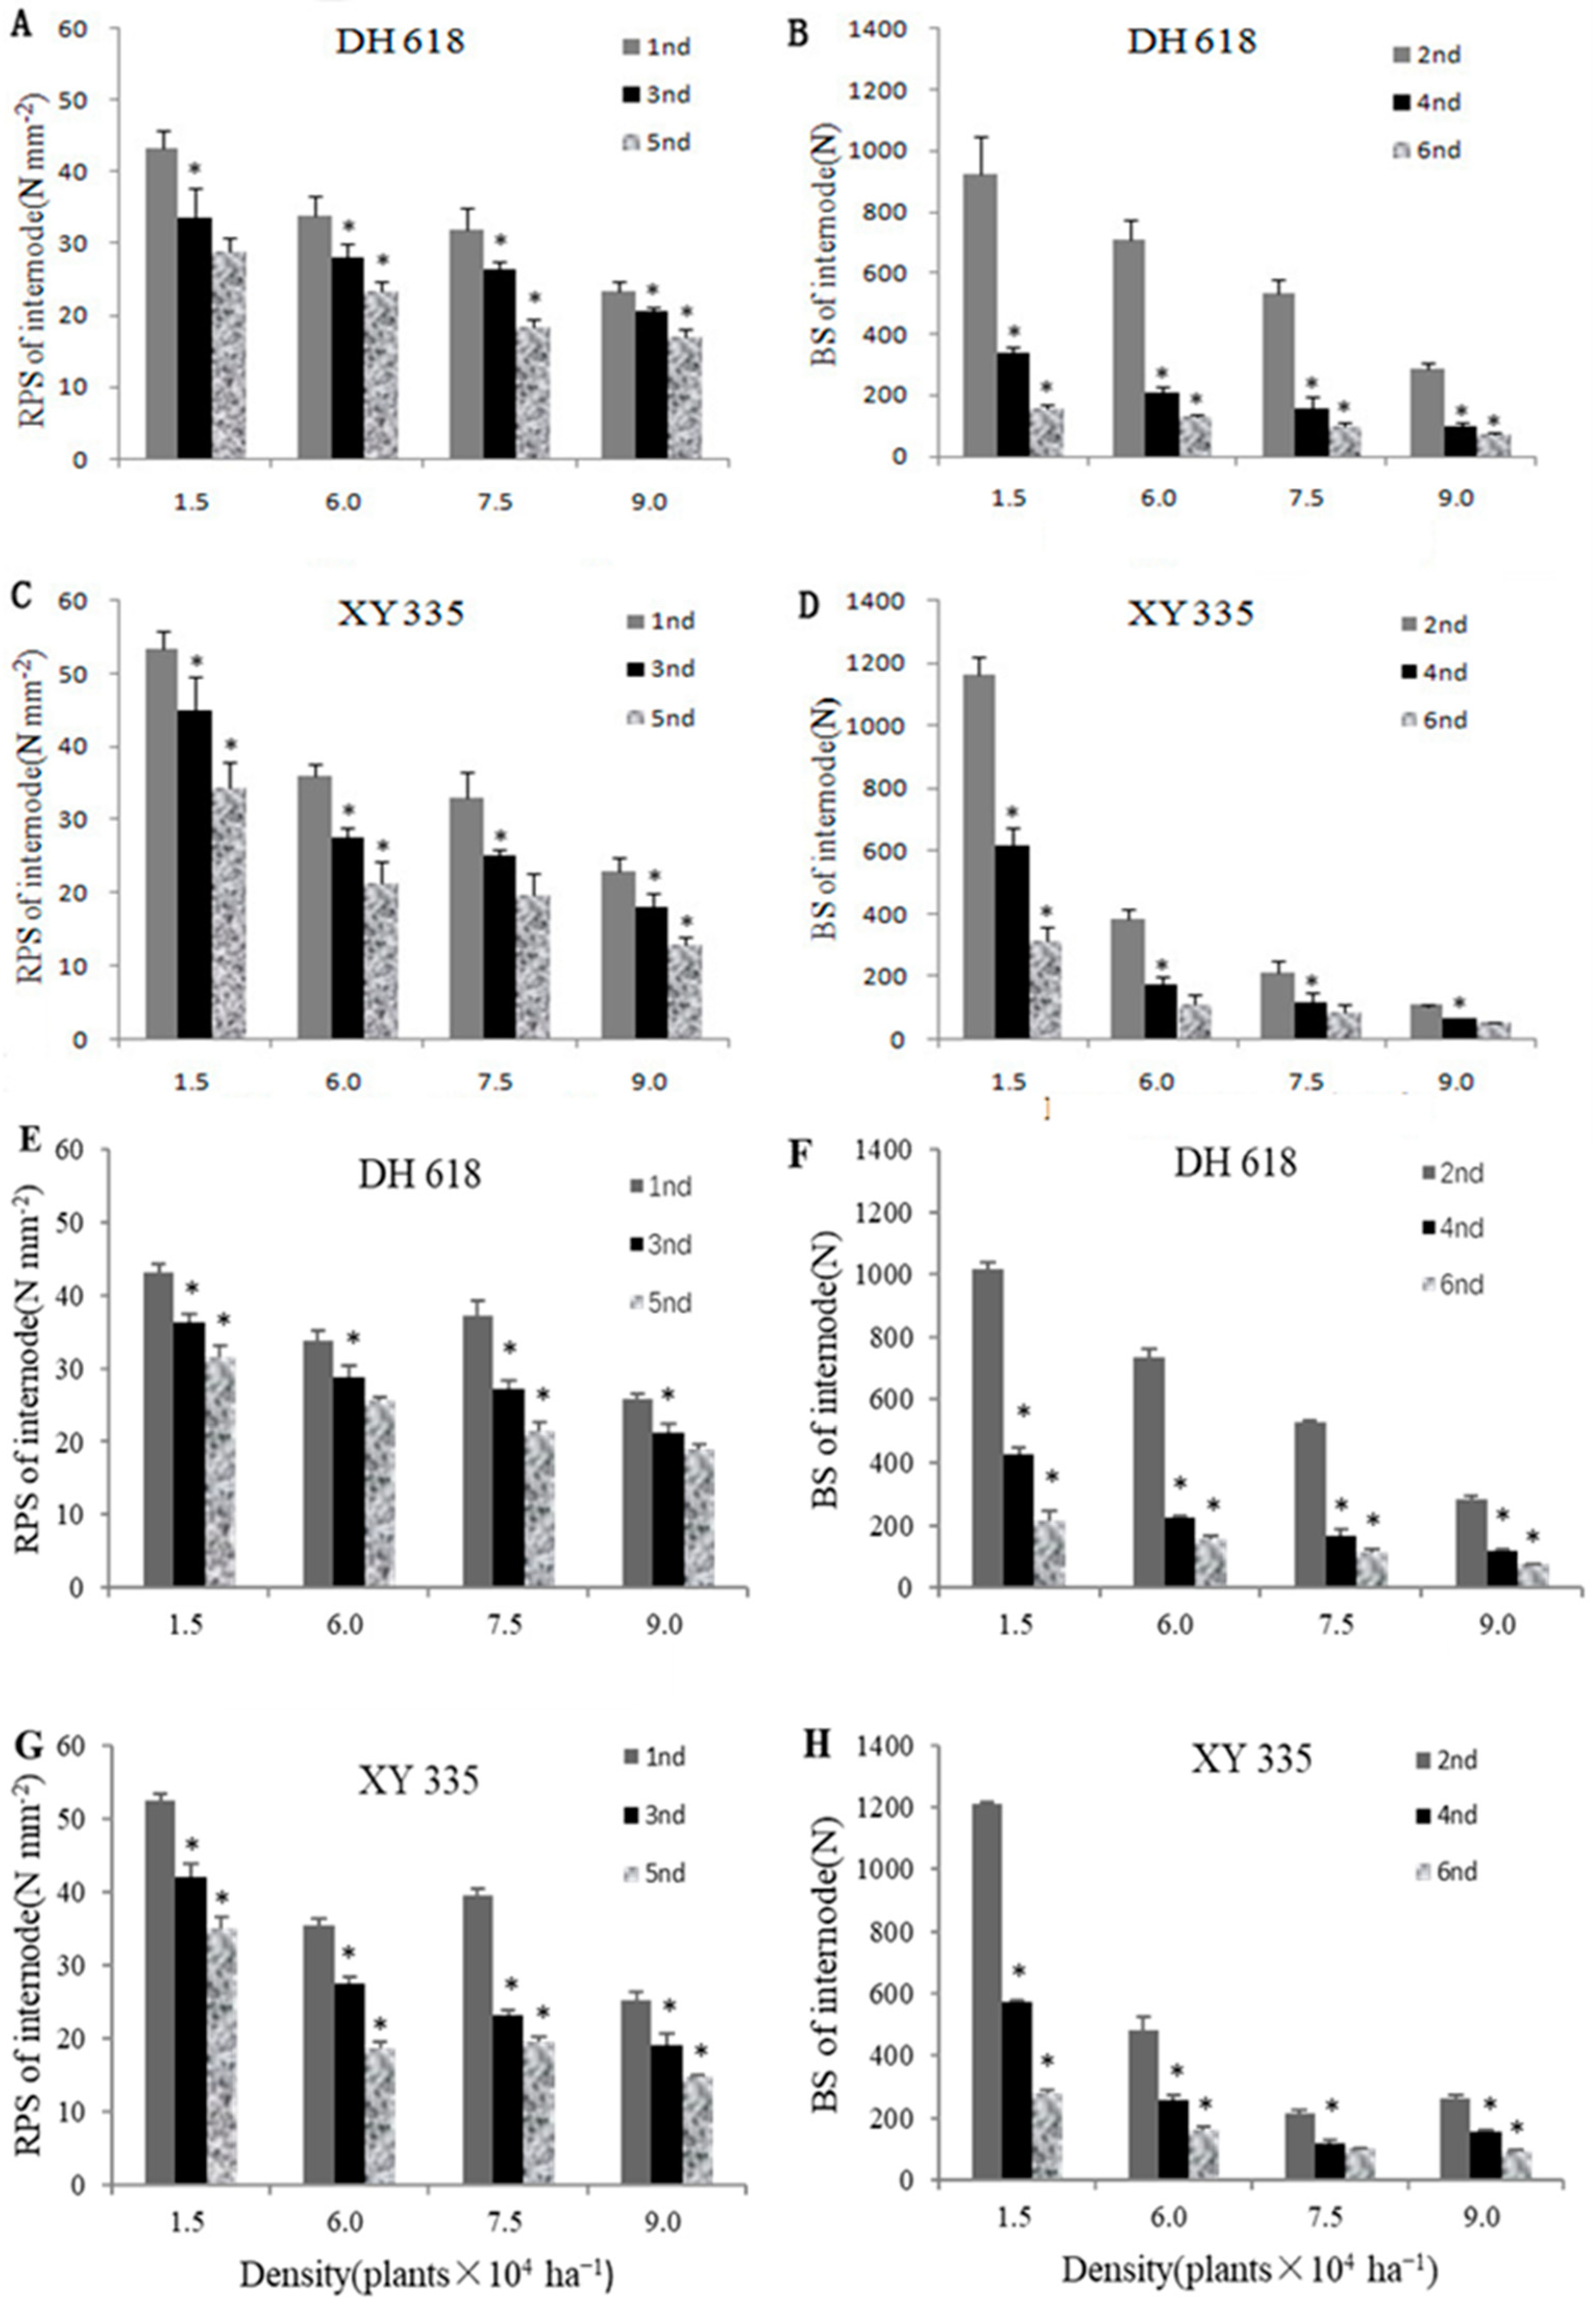
3.2. Stem Rind Penetration Strength (RPS) and Bending Strength (BS)

The rind penetration strength (RPS) of the third internode of two hybrids was higher than that of the fifth internode (Table 2). At low density (15,000 plants ha−1), the RPS of the third internode for XY335 was significantly higher than that of DH618. At the density (60,000 plants ha−1 and 75,000 plants ha−1), there was no significant difference between internodes of DH618 and XY335, but when the density increased to 90,000 plants ha−1, the RPS of DH618 was higher than that of XY335, and the fifth internode reached a very significant level (p < 0.01) (Figure 3A,C,E,G). Although XY335 has a higher RPS at a density of 15,000 ha−1, with the increases of planting density, the RPS of each internode was significantly decreased (p < 0.05). It can be seen that XY 335 was more sensitive to density.
The bending strength (BS) of stem decreased gradually with the increase of planting density. At VT + 35 d, the BS of the fourth and sixth internode of XY335 at low density (15,000 plants ha−1) was 57.73% (p < 0.01) and 63.35% (p < 0.01) higher than that of DH618, respectively. While DH618 had significantly or extremely higher internode BS than that of XY335 at 60,000, 75,000, and 90,000 plants ha−1 (Table 3). In addition, both DH618 and XY335 showed that the BS of the sixth internode was significantly lower than that of the fourth internode at four densities (Figure 3B,D,F,H).

3.3. Plant Character

The plant height, ear height, and height of center gravity of the two hybrids were increased with the increase of planting density (Table 4). For XY335, the height of gravity center was increased significantly with the increase of planting density, but the ear height did not significantly increase at the middle and low densities, indicating that the basal internode length of XY335 did not increase significantly with the increase of density. In addition, ear coefficient of DH618 increased with the increase of planting density. That of DH618 at 15,000 plants ha−1 was decreased by 20.0%, compared to that at 90,000 plants ha−1. Moreover, plant height, ear height, and the height of gravity center for XY335 were 33.3%, 54.2%, and 36.6% higher than those of DH618, respectively.

3.4. Stem Character

3.4.1. Length and Diameter of Internode

The basal internodes of DH618 have different degrees of elongation with the increase of density. The basal internodes of DH618 were significantly elongated when the density was increased from 15,000 plants ha−1 to 75,000 plants ha−1. However, when the density was increased from 75,000 plants ha−1 to 90,000 plants ha−1, there was no significant change in the internode length of the lower base for DH618. With the increase of planting density, the basal internode diameters of DH618 and XY335 decreased significantly, and the general trend was that of XY335 was obviously larger than that of DH618. The length and diameters of basal internodes were different between the two hybrids, and the responses of basal internodes and diameters to density were different. The average internode length of XY335 was 19.22% longer than that of DH618 under medium density. The diameter of basal internode of XY335 decreased with the increase of planting density. When the planting density increased to 90,000 plants ha−1, the average internode diameter was 1.69 cm, which was 15.56% lower than that of DH618 (Table 5).

3.4.2. Dry Weight and Dry Weight per Unit of Internode

The accumulation of dry matter at basal internode of XY335 was significantly higher than that of DH618 under low density. The average dry matter accumulation of XY335, at 15,000 plants ha−1, was 171.86% higher than that of DH618, while the average dry weight of internode of XY335 was 3.27% less than that of DH618 when the planting density increased to 90,000 plants ha−1. In addition, the dry weight and dry weight per unit of basal internode of two hybrids decreased significantly with the increase of planting density, and the extent of XY335 decrease with the increase of planting density was significantly higher than that of DH618. When the planting density increased from 60,000 plants ha−1 to 90,000 plants ha−1, the internode dry weight and dry weight per unit of XY335 decreased by 53.14% and 54.35%, respectively, which were 120.71% and 72.50% higher than that of DH618, respectively. It could be seen that planting density has a great effect on the dry weight and dry weight per unit of internode of XY335. With the increase of planting density, the dry weight of internodes at the base of XY335 decreased sharply (Table 6).

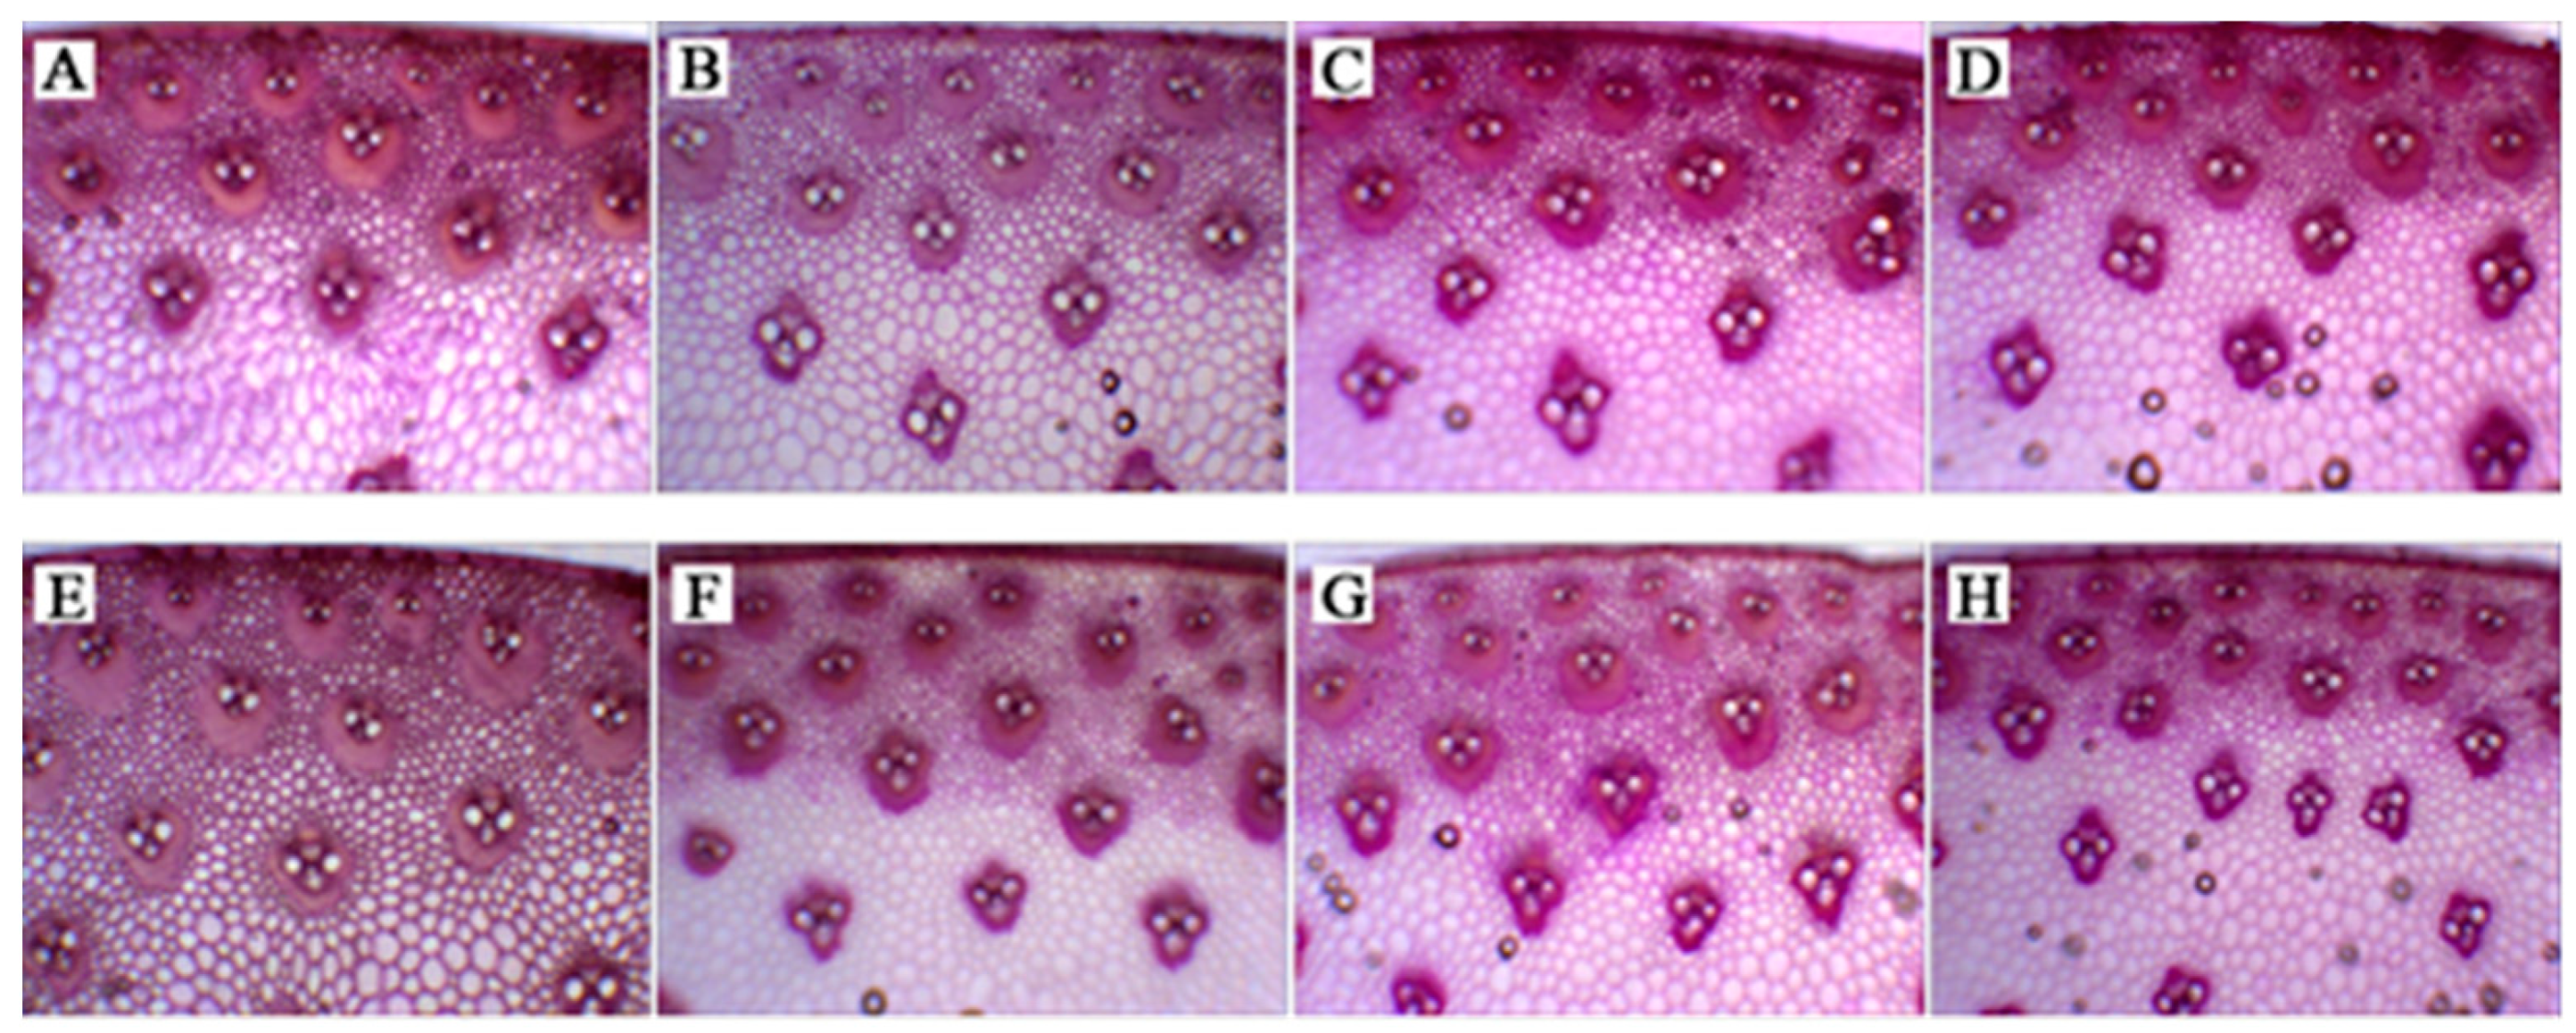
3.4.3. Stem Vascular Bundle Structure

The total number of vascular bundles decreased significantly with the increase of planting density, while the density of vascular bundles was gradually increased, and the trend of change of XY335 was obviously larger than that of DH618 (Figure 4). This might be related to the decrease of stem diameter with the increase of planting density. The decrease of stem diameter for XY335 was obviously larger than that of DH618. In addition, with the increase of planting density, both the thickness of cortex and the thickness of sclerenchyma cells of vascular bundle decreased significantly. Compared with 15,000 plants ha−1, the thickness of third internode stem cortex above ground was decreased by 9.64%, 12.72%, and 20.77% for DH618, while it was decreased by 19.26%, 30.49%, and 37.45% for XY335 at 60,000 plants ha−1, 75,000 plants ha−1, and 90,000 plants ha−1, respectively. The thickness of vascular bundle sclerenchyma cells was decreased by 7.75%, 12.44%, and 17.89% for DH618 and 10.18%, 15.21%, and 24.73% for XY335 at 60,000 plants ha−1, 75,000 plants ha−1, 90,000 plants ha−1, respectively, compared to those at 15,000 plants ha−1. The thickness of stem cortex and vascular bundle sclerenchyma cells also decreased significantly with the increase of planting density, and the change of XY335 with planting density was greater than that of DH618, which showed that the thickness of stem cortex and the thickness of vascular bundle sclerenchyma cells were more sensitive to planting density than that of DH618 (Table 7).

3.5. Biological Yield and Grain Yield

The biological yield per plant of two hybrids decreased significantly with the increase of planting density (Table 8). The biological yield of XY335 was significantly higher than that of DH618 at low and medium planting density, but the change trend gradually decreased with the increase of planting density. When the planting density increased to 90,000 plants ha−1, the difference between two hybrids was not significant. When planting density increased from 15,000 plants ha−1 to 60,000 plants ha−1, the biological yield of XY335 per plant decreased by 41.76%, which was 21.62% higher than that of DH618. However, the biological yield of XY335 decreased by 14.26% with the further increase of planting density, and the decline was 4.79% higher than that of DH618. Moreover, grain yields of two hybrids increased firstly and then decreased with the increase of planting density. DH618 and XY335 achieved maximum at 75,000 plants ha−1 and 60,000 plants ha−1, respectively. Grain yield of DH618 is lower 10.74% than that of XY335 at 60,000 plants ha−1, but at 90,000 plants ha−1, DH618 is higher 13.64% than XY335. When planting density increased from 60,000 plants ha−1 to 75,000 plants ha−1, the grain yield of DH618 and XY335 increased by 8.95% and decreased by 6.82%, respectively. When planting density increased from 75,000 plants ha−1 to 90,000 plants ha−1, the grain yield of XY335 decreased by 13.53%, which was 150.12% higher than that of DH618. Therefore, the increase of grain yield for DH618 was larger than that for XY335, with the increase of planting density.

3.6. Correlation Analysis

There was a significant negative correlation between maximum bending strength and height of gravity center (r = −0.64). Furthermore, maximum bending strength was consistently negatively and significantly correlated with average internode length (r = −0.81). Increasing ear height and ear coefficient significantly reduced maximum bending strength. The correlation coefficients for ear height and ear coefficient monomers for maximum bending strength were −0.54 and −0.60, respectively. These observations clearly indicated that plant morphological characteristics was closely related to lodging resistance in maize. Significant positive correlations were recorded between maximum bending strength and average internode diameter. Coincidentally, the average dry weight of internode and average dry weight per unit of internode both had a significant positive correlation with maximum bending strength and r-values were 0.91 and 0.79, respectively (Figure 5).

4. Discussion

In recent years, the former studies mainly focused on the morphological characteristics [11,16,22], internal structure [23,24], and mechanical strength [12,25] of maize stalk. Previous results showed that stem rind penetration strength, crushing strength, internode diameter, internode dry weight, and internode dry weight per unit of maize were significantly decreased with the increase of planting density [12,25,26]. The mechanical tissue thickness and cortical thickness of stem were also decreased significantly with the increase of plant density. In this study, there was no stalk lodging for DH618 (low stalk with low spike height) in all treatment conditions, while XY335 (high stalk with high spike height) occurred lodging at higher density. Moreover, the lodging rate of XY335 increased with the increase of planting density (Figure 1). In addition, the maximum bending strength of two hybrids was significantly decreased with the increase of planting density, but the decrease for XY335 was larger with more fragile stalk (Table 1). These results indicated that the lodging resistance of DH618 was significantly higher than that of XY335 as the increase of planting density showed low density-sensitivity. The plant height increased significantly, while the diameter of the basal internode, internode dry weight per unit decreased sharply, the thickness of cortex and vascular bundles of sclerenchyma cell wall thickness were significantly reduced for XY335, with the increase of plant density, resulting in the rapid decrease of rind penetration strength and bending strength. It was also found that the effect of planting density on the internode diameter was significantly larger than that of internode length. The internode diameter of the two hybrids decreased significantly with the increase of density, which might be the main reason that the density of stem vascular bundle increased significantly with the increase of planting density, while the diameter of internode decreased significantly, which led to the sharp decrease of mechanical strength of stalk. This might be one of the important causes of severe lodging in XY335, which was consistent with previous results [24]. In addition, the effect of planting density on basal internode length of DH618 was much higher than that of XY335. With the increase of planting density, plant height of XY335 increased significantly, while the change of basal internode length has not reached significant levels. However, basal internode length of DH618 changed significantly with increasing density, which might be related to the hybrid characteristics between two hybrids. These results showed that effect of basal internode length on maize lodging resistance was smaller than basal internode diameter [15,27]. Stem rind penetration strength was a good index to measure the stem lodging resistance [26,28,29] and negatively related to the lodging rate of maize [30,31]. Previous studies showed that stem rind penetration strength decreased significantly, with the increase of planting density, reducing crop lodging resistance [25,27,31]. This study showed that the rind penetration strength of the third internode decreased with the increase of planting density, resulting in the significantly increase of lodging risk of summer maize, but the low stalk with low spike height hybrid decreased less than the tall thin planting hybrids. The thickness of sclerenchyma cells and vascular bundle cortex was negatively correlated with lodging rate in the field [27], and the number of vascular bundles was positively correlated with lodging resistance of maize [23]. However, with the increase of planting density, the total number of vascular bundles for the third internode and spike internode was significantly reduced, the number proportion of big vascular bundle was significantly decreased, the thickness of vascular internal sclerenchyma cell wall and cortex was also decreased significantly, resulting in the significant decrease of lodging resistance. However, the extent of variation of stem microstructure for maize that low stalk with low spike height was less than that for maize that high stalk with high spike height, with the increasing plant density. In addition, stem diameter, the number of vascular bundles, and the thickness of sclerenchyma cells inside the vascular bundles and cortex for maize that low stalk with low spike height was significantly greater than those for maize that high stalk with high spike height.
Improving maize yield by planting density had to coordinate the relationship of lodging and yield. In this study, increasing planting density could increase maize yield to a certain extent, mainly by making full use of the population advantages of the increasing plant number per unit area. However, lodging rate would increase with the increase of planting density, and grain weight would lessen. Consistent with previous research results [32]. DH618 can achieve higher yield at 75,000 plants ha−1 and shows better adaptability than XY335. The yield of both hybrids would be reduced at 90,000 plants ha−1, it may be due to fierce group competition. It can be seen that maize plants would happen to form selective reaction to the increasing planting density, while the responses of different hybrids to density was not the same. Therefore, according to the characteristics of different hybrids of maize, ascertaining the optimum planting density was an important means to realize the cultivation of maize lodging resistance. Maize hybrid that low stalk with low spike height had better lodging resistance, and their yields changed less with the increasing plant density, which presents a good basis for planting high yield with high planting density.

5. Conclusions

Under the condition of this study, with the increase of planting density, the stem diameter, stem rind penetration strength, and vascular bundle number of summer maize decreased significantly, but the decrease of the hybrid that low stalk with low spike height was less than that of high stem sparse type. However, the increase of yield for the yield that low stalk with low spike height was larger than that of the hybrid that high stalk with high spike height, with the increase of planting density, which indicated that hybrid that low stalk with low spike height could maintain better lodging resistance and lower lodging risk under high density, which was helpful to obtain high and stable yields under close planting conditions.
In addition, the effect of planting density on diameter of basal internode was significantly greater than that on length of basal internode, which might be a morphological selectivity for maize plants to adapt to high planting density. The diameter of basal internodes, internode dry matter per unit, and thickness of stem cortex has great influence on lodging resistance of maize plants, and can better reflect the differences among different hybrids. Thus, maize breeders could target these properties for selection of high-yield and lodging-resistant maize hybrids in future efforts.

Author Contributions

Conceptualization, J.Y. and L.W.; Methodology, J.Y. and J.Z.; Investigation, B.R. and L.W.; Data analysis, J.Y. and W.G.; Writing—original draft preparation, J.Y. and W.G.; Writing—review and editing, J.Y. and J.Z.; Supervision, J.Y. and L.W.; Project administration, L.W. All authors have read and agreed to the published version of the manuscript.

Funding

This study was funded by Major Scientific and Technological Innovation Project of Shandong Province (2019JZZY010716; 2016GGH4506), Leading Talents Project of Taishan industry in Shandong Province (LJNY2015009), National Modern Agricultural Technology & Industry System (CARS-02-18).

Institutional Review Board Statement

Not applicable.

Informed Consent Statement

Not applicable.

Data Availability Statement

All data generated or analyzed during this study are included in this published article.

Conflicts of Interest

The authors declare no conflict of interest. The funder had no role in the design of the study; in the collection, analyses, or interpretation of data; in the writing of the manuscript, or in the decision to publish the results.

References

  1. Yang, D.G.; Ma, D.Z.; Yu, Q.Q.; Sun, Y.J.; Gu, W.R.; Chai, M.Z.; Zhang, Q. Researchi progress on influencing factors of lodging and lodging resistance in maize. J. China Agric. Univ. 2020, 25, 28–38. [Google Scholar]
  2. Xue, J.; Gou, L.; Zhao, Y.S.; Yao, M.N.; Yao, H.S.; Tian, J.S.; Zhang, W.F. Effects of light intensity within the canopy on maize lodging. Field Crop. Res. 2016, 188, 133–141. [Google Scholar] [CrossRef]
  3. Gou, L.; Huang, J.J.; Sun, R.; Ding, Z.S.; Dong, Z.Q.; Zhao, M. Variation characteristic of stalk penetration strength of maize with different density-tolerance varieties. Trans. CSAE 2010, 26, 156–162. [Google Scholar]
  4. Yang, Y.; Yang, J.Y.; Li, S.M.; Zhang, X.D.; Zhu, D.H.; Liu, Z.; Mi, C.Q.; Xiao, K.N. Spatial regression analysis on influence factors of maize lodging stress. Trans. CSAE 2011, 27, 244–249. [Google Scholar]
  5. Dai, J.R. The review and prospects of maize genetics and breeding. In Prospects of Maize Genetics an Breeding for the 21st Century-Paper Collection of International Maize Genetics an Breeding Symposium; China Agricultural Science and Technology Press: Changchun, China, 2000; Volume 9, pp. 1–7. [Google Scholar]
  6. Li, S.K.; Wang, C.T. Evolution and Development of Maize Production Techniques in China. Sci. Agric. Sin. 2009, 13, 1941–1951. [Google Scholar]
  7. Ren, B.Z.; Liu, W.; Zhang, J.W.; Dong, S.T.; Liu, P.; Zhao, B. Effects of plant density on the photosynthetic and chloroplast characteristics of maize under high-yielding conditions. Sci. Nat. 2017, 104, 12. [Google Scholar] [CrossRef]
  8. Tollenaar, M.; Deen, W.; Echarte, L.; Liu, W. Effect of crowding stress on dry matter accumulation and harvest index in maize. Agron. J. 2006, 98, 930–937. [Google Scholar] [CrossRef]
  9. Tollenaar, M.; Lee, E.A. Yield potential, yield stability and stress tolerance in maize. Field Crop. Res. 2002, 75, 161–169. [Google Scholar] [CrossRef]
  10. Zhang, S.H. The comparison between China and US in technical level of maize breeding. Seed World 2007, 4, 9–10. [Google Scholar]
  11. Gao, X.; Gao, J.L.; Yu, X.F.; Wang, Z.G.; Sun, J.Y.; Su, Z.J.; Hu, S.P.; Ye, J.; Wang, H.Y.; Cui, C.; et al. Stalks Lodging-resistance Characteristics and Yield Traits among Different Maize Varieties under High Close Planting. J. Maize Sci. 2012, 20, 69–73. [Google Scholar]
  12. Ren, B.Z.; Li, L.L.; Dong, S.T.; Liu, P.; Zhao, B.; Yang, J.S.; Wang, D.B.; Zhang, J.W. Effects of Plant Density on Stem Traits and Lodging Resistance of Summer Maize Hybrids with Different Plant Heights. Acta Agron. Sin. 2016, 42, 1864–1872. [Google Scholar] [CrossRef]
  13. Minami, M.; Ujihara, A. Effects of Lodging on Dry Matter Production, Grain Yield and Nutritional Composition at Different Growth Stages in Maize (Zea mays L.). Jpn. J. Crop. Sci. 2008, 60, 107–115. [Google Scholar] [CrossRef] [Green Version]
  14. Cheng, F.L.; Du, X.; Liu, M.X.; Jin, X.L.; Cui, Y.H. Lodging of summer maize and the effects on grain yield. J. Maize Sci. 2011, 19, 105–108. [Google Scholar]
  15. Xu, C.L.; Gao, Y.B.; Tian, B.J.; Ren, J.H.; Meng, Q.F.; Wang, P. Effects of EDAH, a novel plant growth regulator, on mechanical strength, stalk vascular bundles and grain yield of summer maize at high densities. Field Crop. Res. 2017, 200, 71–79. [Google Scholar] [CrossRef]
  16. Gou, L.; Huang, J.J.; Zhang, B.; Li, T.; Zhao, M. Effects of population density on stalk lodging resistant mechanism and agronomic characteristics of maize. Acta Agron. Sin. 2007, 10, 1688–1695. [Google Scholar]
  17. Novacek, M.J.; Mason, S.C.; Galusha, T.D.; Yaseen, M. Twin Rows Minimally Impact Irrigated Maize Yield, Morphology, and Lodging. Agron. J. 2013, 105, 268–276. [Google Scholar] [CrossRef]
  18. Norberg, O.S.; Mason, S.C.; Lowry, S.R. Ethephon Influence on Harvestable Yield, Grain Quality, and Lodging of Corn. Agron. J. 1988, 80, 768–772. [Google Scholar] [CrossRef]
  19. Sun, S.X.; Dai, J.Y.; Gu, W.L. Effect of nitrogen, phosphate and potash fertilizers on lodging and yield in maize. Sci. Agric. Sin. 1989, 22, 28–33, 96–97. [Google Scholar]
  20. Wang, X.Q.; Song, W.; Zhang, R.Y.; Chen, Y.N.; Sun, X.; Zhao, J.R. Gesearch Advances on Maize Stalk Lodging Resistance. Sci. Agric. Sin. 2021, 54, 2261–2272. [Google Scholar]
  21. Xue, J.; Xie, R.Z.; Zhang, W.F.; Wang, K.R.; Hou, P.; Ming, B.; Gou, L.; Li, S.K. Research progress on reduced lodging of high-yield and -density maize. J. Integr. Agric. 2017, 16, 2717–2725. [Google Scholar] [CrossRef]
  22. Mi, C.Q.; Zhang, X.D.; Li, S.M.; Zhu, D.H.; Yang, J.Y. Analysis of Lodging Resistance Competitiveness of Maize Cultivars in Target Growing Environments. Sens. Lett. 2013, 11, 1282–1287. [Google Scholar] [CrossRef]
  23. Wang, Q.Y.; Hu, C.H. Studies on the anatomical structures of the stalks of maize with different resistance to lodging. Acta Agron. Sin. 1991, 17, 70–75. [Google Scholar]
  24. Yao, M.N.; Shi, Z.G.; Xue, J.; Yang, Z.W.; Gou, L.; Zhang, W.F. The Effects of different planting densities on the cortex structure of steam and lodging resistance in maize. Xinjiang Agric. Sci. 2013, 50, 2006–2014. [Google Scholar]
  25. Dudley, J.W. Selection for Rind Puncture Resistance in Two Maize Populations. Crop. Sci. 1994, 34, 1458–1460. [Google Scholar] [CrossRef]
  26. Li, S.Y.; Ma, W.; Peng, J.Y.; Chen, Z.M. Study on Yield Loss of Summer Maize Due to Lodging at the Big Flare Stage and Grain Filling Stage. Sci. Agric. Sin. 2015, 48, 3952–3964. [Google Scholar]
  27. Xue, J.; Wang, K.R.; Xie, R.Z.; Gou, L.; Zhang, W.F.; Ming, B.; Hou, P.; Li, S.K. Research Progress of Maize Lodging During Late Stage. Sci. Agric. Sin. 2018, 51, 1845–1854. [Google Scholar]
  28. Albrecht, B.; Dudley, J.W. Divergent Selection for Stalk Quality and Grain Yield in an Adapted ✕ Exotic Maize Population Cross1. Crop. Sci. 1987, 27, 487–494. [Google Scholar] [CrossRef]
  29. Flint-Garcia, S.A.; Darrah, L.L.; McMullen, M.D.; Hibbard, B.E. Phenotypic versus marker-assisted selection for stalk strength and second-generation European corn borer resistance in maize. Theor. Appl. Genet. 2003, 107, 1331–1336. [Google Scholar] [CrossRef]
  30. Sibale, E.M.; Darrah, L.L.; Zuber, M.S. Comparison of two rind penetrometers for measurement of stalk strength in maize. Maydica 1992, 37, 111–114. [Google Scholar]
  31. Martin, S.A.; Darrah, L.L.; Hibbard, B.E. Divergent Selection for Rind Penetrometer Resistance and Its Effects on European Corn Borer Damage and Stalk Traits in Corn. Crop. Sci. 2004, 44, 711–717. [Google Scholar] [CrossRef] [Green Version]
  32. Sangoi, L.; Gracietti, M.A.; Rampazzo, C.; Bianchetti, P. Response of brazilian maize hybrids from different eras to changes in plant density. Field Crop. Res. 2002, 79, 39–51. [Google Scholar] [CrossRef]
Figure 1. Field lodging rate of DH618 and XY335 under different planting densities in 2014 and 2016. * Significant difference at p < 0.05.
Agronomy 12 00010 g001
Figure 2. Maximum bending strength of DH618 and XY335 under different planting densities in 2014 and 2016. * Significant difference at p < 0.05.
Agronomy 12 00010 g002
Figure 3. Stalk mechanical strength of DH618 and XY335 at VT + 35d. (A) RPS of internode for DH618 under different planting densities in 2014. (B) BS of internode for DH618 under different planting densities in 2014. (C) RPS of internode for XY335 under different planting densities in 2014. (D) BS of internode for XY335 under different planting densities in 2014. (E) RPS of internode for DH618 under different planting densities in 2016. (F) BS of internode for DH618 under different planting densities in 2016. (G) RPS of internode for XY335 under different planting densities in 2016. (H) BS of internode for XY335 under different planting densities in 2016. * Significant difference at p < 0.05.
Agronomy 12 00010 g003
Figure 4. Lateral section of the third basal internodes of stem (×40) in 2014. (AD) represent 1.5, 6.0, 7.5, 9.0 × 10⁴ plants ha−1 for DH618, respectively; (EH) represent 1.5, 6.0, 7.5, 9.0 × 10⁴ plants ha−1 for XY335, respectively.
Agronomy 12 00010 g004
Figure 5. Correlation analysis. MBS: maximum bending strength, PH: plant height, EH: ear height; HCG: height of gravity center, EC: ear coefficient, AIL: average internode length, AID: average internode diameter, AIDW: average internode dry weight, AIRDWL: average of internode ratio of dry weight to length (average of internode dry weight per unit). * and ** indicate significant differences different at the 0.05 and 0.01 probability levels, respectively.
Agronomy 12 00010 g005
Table 1. Field maximum bending strength of DH618 and XY335 at different growth stages in 2014 and 2016.
YearHybridPlant Density
(×104 ha−1)
V12 (N)VT (N)VT + 35 d (N)
2014DH6181.512.80 a25.93 a38.37 a
610.87 ab19.91 b25.53 b
7.510.00 ab18.60 b20.53 c
98.80 b11.30 c11.57 d
XY3351.519.40 a31.47 a45.53 a
69.60 b17.07 b19.07 b
7.57.73 c15.17 b14.50 c
97.77 c9.60 c7.83 d
2016DH6181.513.43 a30.27 a48.40 a
611.40 b20.40 b27.20 b
7.510.50 b19.17 b21.57 c
910.37 b11.57 c11.23 d
XY3351.520.37 a31.50 a42.20 a
610.07 b19.47 b20.90 c
7.58.70 bc14.07 c13.03 c
98.17 c10.23 d8.67 d
Interaction
Hybrid (H) *****
Density (D) ******
H × D **nsns
(1) Values followed by a different small letter within a column are significantly different at 5% probability level. Differences between treatments were calculated within the hybrids. (2) * and ** indicate significant differences different at the 0.05 and 0.01 probability levels, respectively. ns, not significant.
Table 2. Rind penetration strength of DH618 and XY335 at different growth stages in 2014 and 2016.
YearHybridPlant Density (×104 ha−1)Third InternodeFifth Internode
V12 (N)VT (N)VT + 35d (N)V12 (N)VT (N)VT + 35d (N)
2014DH6181.513.33 a29.07 a33.67 a7.10 ab21.13 a29.00 a
613.43 a20.67 b28.00 b5.53 b15.93 b23.33 b
7.511.47 b20.67 b26.33 b7.43 a18.27 b18.33 c
910.17 b16.05 c20.67 c6.97 ab15.00 b17.00 c
XY3351.514.77 a30.00 a45.00 a7.40 a25.00 a34.33 a
610.70 c26.00 a27.67 b4.05 b23.00 a21.33 b
7.512.40 b19.33 b25.00 b2.85 b15.67 b19.67 b
99.47 c15.00 c18.00 c0.00 c11.67 b13.00 c
2016DH6181.515.33 a30.50 a36.33 a9.00 a22.67 a31.50 a
615.17 a21.67 b28.70 b8.77 a19.97 b25.53 b
7.513.43 ab21.70 b27.17 b8.57 a17.20 c21.43 c
912.40 b18.90 c21.17 c8.10 a14.57 d18.90 d
XY3351.516.83 a31.50 a42.07 a8.07 a23.17 a34.93 a
614.40 ab27.27 b27.57 b5.07 b25.20 a18.70 b
7.512.17 bc20.33 c23.20 c2.90 c14.07 b19.43 b
910.17 c15.77 d19.17 d1.77 c12.93 b14.67 c
Interaction
Hybrid (H) *****ns*
Density (D) ************
H × D *nsnsns**ns
(1) Values followed by a different small letter within a column are significantly different at 5% probability level. Differences between treatments were calculated within the hybrids. (2) * and ** indicate significant differences different at the 0.05 and 0.01 probability levels, respectively. ns, not significant.
Table 3. Bending strength of DH618 and XY335 at different growth stages in 2014 and 2016.
YearHybridPlant Density (×104 ha−1)Fourth InternodeSixth Internode
V12 (N)VT (N)VT + 35d (N)V12 (N)VT (N)VT + 35d (N)
2014DH6181.5203.67 a277.20 a338.67 a59.90 a153.97 a159.33 a
6110.33 b138.03 b209.67 b54.13 b106.93 b129.67 b
7.594.87 c110.27 c156.67 c34.55 a81.90 c97.33 c
984.57 d100.60 d100.00 d32.30 b68.30 c69.33 c
XY3351.5210.87 a399.00 a616.33 a60.15 a239.00 a311.33 a
683.90 b228.67 b174.00 b44.20 b128.67 b122.00 b
7.578.60 b177.33 c117.67 c28.47 c95.67 c87.67 c
962.93 c136.67 d61.67 d20.63 d67.33 d73.33 d
2016DH6181.5213.70 a318.57 a427.77 a69.93 a209.63 a213.53 a
6115.87 b172.37 b224.43 b55.80 b135.30 b157.03 b
7.599.50 b129.03 c164.70 c35.40 c95.87 c111.23 c
999.67 b112.63 c117.00 d33.07 c74.57 c72.83 c
XY3351.5221.40 a454.87 a570.97 a60.22 a243.03 a280.37 a
688.00 b265.03 b256.13 b50.40 b155.17 b159.97 b
7.582.67 b202.47 c116.23 c26.40 c99.57 c100.83 c
966.17 c146.43 d154.93 d21.97 c85.90 c91.77 c
Interaction
Hybrid (H) ************
Density (D) ************
H × D *nsnsnsnsns
(1) Values followed by a different small letter within a column are significantly different at 5% probability level. Differences between treatments were calculated within the hybrids. (2) * and ** indicate significant differences different at the 0.05 and 0.01 probability levels, respectively. ns, not significant.
Table 4. Plant morphological characteristics of DH618 and XY335 under different planting densities in 2014 and 2016.
YearHybridPlant Density
(×104 ha−1)
Plant Height
(cm)
Ear Height
(cm)
Height of Gravity Center (cm)Ear Coefficient
2014DH6181.5223.67 c65.50 c74.67 c0.29 b
6262.67 b79.00 b96.33 b0.30 b
7.5269.00 b80.00 b97.67 b0.30 b
9282.00 a102.33 a108.00 a0.36 a
XY3351.5325.67 d118.33 c114.67 c0.37 a
6334.67 c118.67 c124.67 b0.35 a
7.5353.00 b126.00 b133.33 a0.36 a
9363.33 a131.33 a137.00 a0.36 a
2016DH6181.5218.67 c58.00 d67.33 c0.27 d
6246.33 b76.00 c85.67 b0.31 c
7.5250.67 b80.67 b90.67 b0.32 b
9261.00 a89.33 a98.33 a0.34 a
XY3351.5297.33 c89.33 c95.67 c0.30 b
6302.00 bc106.67 b114.00 b0.35 a
7.5310.33 b109.00 b115.67 b0.35 a
9321.33 a116.00 a120.33 a0.36 a
Interaction
Hybrid (H) ********
Density (D) ********
H × D **nsnsns
(1) Values followed by a different small letter within a column are significantly different at 5% probability level. Differences between treatments were calculated within the hybrids. (2) * and ** indicate significant differences different at the 0.05 and 0.01 probability levels, respectively. ns, not significant.
Table 5. Length and diameter of internode of DH618 and XY335 under different planting densities in 2014 and 2016.
YearHybridPlant Density (×104 ha−1)Length of Internode (cm)Diameter of Internode (cm)
34563456
2014DH6181.59.10 c12.90 c14.63 c15.20 c2.71 a2.56 a2.37 a2.20 a
611.67 b16.27 b19.00 b20.00 b2.48 b2.38 b2.22 b2.06 b
7.512.73 b16.83 b19.50 ac21.33 a2.20 c2.18 c2.03 c1.87 c
914.57 a18.50 a20.33 a21.67 a2.12 c2.03 c1.88 d1.75 d
XY3351.514.00 b16.83 b18.83 c19.53 b3.10 a2.91 a2.79 a2.61 a
617.83 a19.90 a22.73 b22.53 a2.44 b2.32 b2.29 b2.07 b
7.518.33 a20.33 a23.47 a22.33 a2.24 c2.06 c1.95 c1.80 c
918.50 a20.50 a23.63 a22.57 a1.84 d1.70 d1.63 d1.48 d
2016DH6181.59.31 d11.50 c13.20 b12.10 b2.83 a2.67 a2.45 a2.26 a
610.98 c15.87 b18.48 a19.50 a2.49 b2.38 b2.31 b2.14 a
7.511.98 b16.45 ab19.10 a20.98 a2.32 c2.22 bc2.09 c1.88 b
913.12 a17.67 a18.12 a20.40 a2.21 d2.16 c1.93 d1.79 b
XY3351.512.80 b15.68 b16.33 b17.12 c3.17 a3.07 a2.85 a2.67 a
616.21 a18.65 a21.54 a20.13 b2.63 b2.36 b2.32 b2.14 b
7.516.33 a19.49 a22.89 a20.11 b2.28 c2.12 c2.02 c1.88 c
917.88 a19.21 a21.73 a22.89 a1.91 d1.71 d1.62 d1.51 d
Interaction
Hybrid (H) **************
Density (D) ****************
H × D nsnsns**ns**nsns
(1) Values followed by a different small letter within a column are significantly different at 5% probability level. Differences between treatments were calculated within the hybrids. (2) * and ** indicate significant differences different at the 0.05 and 0.01 probability levels, respectively. Ns, not significant.
Table 6. Change of the internode dry matter accumulation under different planting densities in 2014 and 2016.
YearHybridPlant Density
(×104 ha−1)
Dry Weight of Internode
(g)
Dry Weight per Unit of Internode
(g cm−1)
34563456
2014DH6181.56.68 a6.75 a7.19 a5.96 a0.73 a0.52 a0.49 a0.39 a
65.03 b6.08 b6.46 b5.52 b0.43 b0.37 b0.34 b0.28 b
7.54.18 c5.11 c5.46 c5.17 b0.33 c0.30 c0.28 c0.24 bc
93.87 d4.37 d4.67 d4.39 c0.26 d0.24 d0.23 d0.20 c
XY3351.516.71 a18.67 a18.13 a14.77 a1.19 a1.11 a0.96 a0.76 a
68.96 b9.69 b9.38 b8.37 b0.50 b0.49 b0.41 b0.37 b
7.56.09 c6.43 c6.58 c5.81 c0.33 c0.32 c0.28 c0.26 c
94.04 d4.30 c4.43 d3.89 d0.22 d0.21 d0.19 d0.17 d
2016DH6181.57.25 a7.78 a7.54 a5.99 a0.78 a0.68 a0.57 a0.50 a
64.67 b6.36 b6.92 b5.64 a0.43 b0.40 b0.37 b0.29 b
7.54.18 b4.65 c4.73 c4.96 a0.35 c0.28 c0.25 c0.24 b
94.28 b4.09 d4.55 c5.18 a0.33 c0.23 d0.25 c0.25 b
XY3351.522.67 a22.66 a19.77 a16.59 a1.77 a1.45 a1.21 a0.97 a
68.53 b9.80 b10.32 b8.12 b0.53 b0.53 b0.48 b0.40 b
7.56.71 b7.42 c7.57 c6.47 c0.41 b0.38 c0.33 bc0.32 c
94.42 c4.38 d4.63 d4.15 d0.25 c0.23 d0.21 c0.18 d
Interaction
Hybrid (H) ****************
Density (D) ****************
H × D **nsnsnsns**nsns
(1) Values followed by a different small letter within a column are significantly different at 5% probability level. Differences between treatments were calculated within the hybrids. (2) * and ** indicate significant differences different at the 0.05 and 0.01 probability levels, respectively. ns, not significant.
Table 7. Stem micro-structure of DH618 and XY335 under different planting densities in 2014.
HybridPlant Density
(×104 ha−1)
Vascular Bundle NumberDensity of Vascular Bundle
(Number/mm2)
Cortex Thickness
(μm)
Vascular Bundle Sclerenchyma Thickness
(μm)
DH6181.5751 a1.31 d50.61 a49.52 a
6711 b1.48 c45.73 b45.68 b
7.5631 c1.67 b44.17 b43.36 c
9625 c1.78 a40.10 c40.66 d
XY3351.5826 a1.10 d50.58 a51.68 a
6781 b1.68 c40.84 b46.42 b
7.5756 c1.93 b35.16 c43.82 c
9566 d2.14 a31.64 d38.90 d
Values followed by a different small letter within a column are significantly different at 5% probability level. Differences between treatments were calculated within the hybrids.
Table 8. Biological yield and grain yield of DH618 and XY335 under different planting densities in 2014 and 2016.
YearHybridPlant Density
(×104 ha−1)
Dry Weight per Plant (g p−1)Dry Kernel Weight per Plant (g p−1)Grain Yield
(kg ha−1)
2014DH6181.5572.37 a334.83 a5028.00 b
6386.54 b211.52 b12,263.25 a
7.5327.06 c184.28 bc13,220.40 a
9289.68 c147.74 c12,493.95 a
XY3351.5738.21 a402.47 a5996.85 c
6440.08 b236.39 b13,972.65 a
7.5361.33 c180.95 c12,912.60 a
9311.23 d163.3 c11,005.65 b
2016DH6181.5613.94 a358.97 a5387.40 c
6411.59 b227.53 b13,109.85 b
7.5351.57 c198.14 bc14,424.60 a
9305.84 c158.31 c13,665.55 ab
XY3351.5801.92 a437.91 a6527.85 c
6456.90 b246.06 b14,453.85 a
7.5388.63 bc190.98 b13,698.60 a
9347.74 c175.29 b12,004.85 b
Interaction
Hybrid (H) *****
Density (D) ******
H × D **nsns
(1) Values followed by a different small letter within a column are significantly different at 5% probability level. Differences between treatments were calculated within the hybrids. (2) * and ** indicate significant differences different at the 0.05 and 0.01 probability levels, respectively. ns, not significant.
Publisher’s Note: MDPI stays neutral with regard to jurisdictional claims in published maps and institutional affiliations.

