Article

Intercropping Pattern and N Fertilizer Schedule Affect the Performance of Additively Intercropped Maize and Forage Cowpea in the Mediterranean Region

1
Crop Science Department, Faculty of Agriculture (El-Shatby), Alexandria University, Alexandria 21545, Egypt
2
Crop Intensification Department, Field Crop Research Institute, ARC, Giza 12411, Egypt
*
Author to whom correspondence should be addressed.
Agronomy 2022, 12(1), 107; https://doi.org/10.3390/agronomy12010107
Submission received: 22 November 2021 / Revised: 26 December 2021 / Accepted: 30 December 2021 / Published: 2 January 2022
(This article belongs to the Special Issue Alternative Cropping Systems for Climate Change)

Abstract

:
Intercropping maize and forage cowpea is a widely proposed strategy to improve land use efficiency, and maximize the economic value of the farming system, especially in developing countries with restricted resources. The current study was carried out during the successive summers of 2020 and 2021 in Northern Egypt. The main objective was to evaluate the effect of three N schedules (NS1, NS2, NS3), when three different maize–cowpea intercropping patterns (IP1, IP2, IP3) were applied, on the grain yield of maize, forage yield and quality of forage cowpea. In addition, yield gain and land use efficiency were evaluated using the land equivalent ratio (LER) and dry matter equivalent ratio (DMER) indices. Results revealed that the intercropping patterns that provided wider spacings for the component crops and reduced the competition between them, mainly IP3, resulted in the best performances for the two crops. This was clear for maize ear and grain yields, 100-grain weight and harvest index, in addition to cowpea fresh and dry forage yields, crude protein and non-fiber carbohydrates of the three cuts. Regarding the applied N schedules, NS1 which included the application of a N starter dose with sowing proved to be the most efficient schedule that led to the best performance for both crops. Maize produced 9.07 t ha−1 grain yield under IP3 and NS1. In addition, the application of IP3 resulted in the highest significant cowpea dry forage yield (DFY), with the highest crude protein (CP) content. The DFY of cuts 1, 2, and 3 amounted to 1.27, 0.45, and 0.24 t ha−1, while the CP content for the three respective cuts reached 159.49, 157.96, and 148.91 g kg−1. Nonetheless, NS1 produced a reasonable amount of DFY with high CP content. It is recommended to follow the third proposed intercropping pattern (IP3) and to include a nitrogen starter dose (NS1) in the fertilization scheme to ensure highest productivity from the intercropped maize and forage cowpea.

1. Introduction

Intercropping, as a mean of agricultural intensification, has proved to be a vital practice in increasing land use efficiency and, thus, uplifting the yield gain and increasing the economic value of the agricultural system. Recently, intercropping has been considered an effective strategy to enhance the resilience of the farming system to climate change hazards [1]. Cereal–legume intercropping is a widely proposed strategy to develop a sustainable food and forage production system [2,3] to replenish the food and feed gaps, especially in developing countries with restricted agricultural inputs [4,5].
The integration of both cereals and legumes in the same cropping system gives many advantages to the farming practice, such as reducing the damage caused by pests, diseases and weeds, securing better financial stability for the farmers and improving soil fertility [6,7,8]. In addition, the morphological and physiological differences between the component crops allow for their complementarity in using the environmental resources resulting in a better yield and land use efficiency [9,10]. Generally, cereal–legume intercropping systems are receiving increased attention in both developing as well as developed countries to attain sustainability in grain and forage production [11,12] while avoiding the degradation associated with the extensive use of non-renewable recourses [13].
In the cropping systems in Northern Egypt, maize (Zea mays L.) is a principal summer cereal crop, widely grown for grain production [14]. With a considerable area annually devoted to maize production, it is recognized for its significant contribution to enhancing rural livelihood and economy [15]. Forage cowpea (Vigna unguiculata) is an annual multi-cut forage legume with a climbing growth habit, and a high protein content that is successfully grown in arable irrigated lands of the Mediterranean basin [16]. As a legume crop, capable of fixing the atmospheric N, forage cowpea contributes to increasing the soil nutrients’ balance. [17] reported an increase in the soil’s organic carbon from 0.37 to 0.82% when forage cowpea was intercropped with maize, compared to maize sole cropping. In addition, due to its cover nature, it is highly effective in reducing soil erosion and conserving the soil moisture content. Dramatic reductions in soil moisture content usually accompany sole maize cropping due to increased evapotranspiration, which is distinguishably low in the case of cowpea cropping [2]. Nonetheless, the different root architecture of maize and cowpea allows the crops to capture soil moisture at different depths, and increases the water-use efficiency of the system [4]. Thus, there is evidence that intercropping cowpea with maize is effective in conserving soil’s moisture content, which may reach 15.98% during the active period of crop development and 16.70% after crop removal [2,18]. Therefore, maize–forage cowpea intercropping is specially recommended in countries suffering from escalating water issues, such as Egypt. Nonetheless, since the arable land area is limited and not enough for the cultivation of the main grain crops, it is not possible to completely devote an area to forage production. In this case, utilizing the wide spacings between maize plants to grow a promising forage legume like cowpea would be a wise farm management decision [19].
In the intercropping practice, each of the component crops needs enough surrounding space to adjust to the competition between the plants, keep this to the minimum and guarantee a reasonable amount of yield from each crop [20]. In the maize–legume intercropping system, maize has a reported advantage due to its rapid initial growth [21], taller stems and larger root system, which results in its exposure to more limited competition than the companion legume crop [22]. In this regard, refs. [5,10] suggested appropriate spatial arrangements to be among the most important factors enhancing maize–legume intercropping over maize sole cropping. Hence, the intercropping pattern should impact the growth and performance of cowpea because it determines the optimum space available for it to fulfill its needs from the different growth inputs.
Nitrogen (N) is an essential nutrient for crop growth and development, and in addition it is a basic input in the Egyptian farming system [23]. To achieve the maximum productivity from an intercropping practice, N needs to be carefully adjusted in terms of its rate and time of application [24]. Current recommendations concerning N fertilizer application are based upon maize sole cropping; however, the recommendations regarding N fertilizer management in case of maize–legume intercropping systems have not been adequately studied [25]. While most of the research on N management in intercropping systems has focused on the optimal rate, the N schedule and time of application in relation to plant stage of maturity is also crucial in determining impact on the crop’s productivity. Therefore, N application needs to be planned based on the most appropriate application timing [25]. It is evident that splitting the total N rate into several applications promoted N uptake and, thus, maize crop yield [26]. Hence, splitting N may provide high-N demanding crops like maize with sufficient amount of N to fulfill its needs, and thus close the N cycle and reduce environmental complications associated with N application [25].
The objective of this study was to evaluate the effects of three N schedules for the same total N rate, when three different maize-forage cowpea intercropping patterns were applied, on the grain and forage yields of maize and forage cowpea, respectively. In addition, yield gain and land use efficiency were evaluated using the land equivalent ratio (LER) and dry matter equivalent ratio (DMER) indices. We hypothesized that manipulating the N application schedule in combination with the different intercropping patterns would give the maize main crop a better chance to benefit from both the soil-applied N and the biologically fixed N along with the companion forage cowpea crop. We thus, aimed at finding out the best combination between the intercropping patterns and N fertilizer schedules that would increase the overall efficiency of the system and result in improved performances of both crops.

2. Materials and Methods

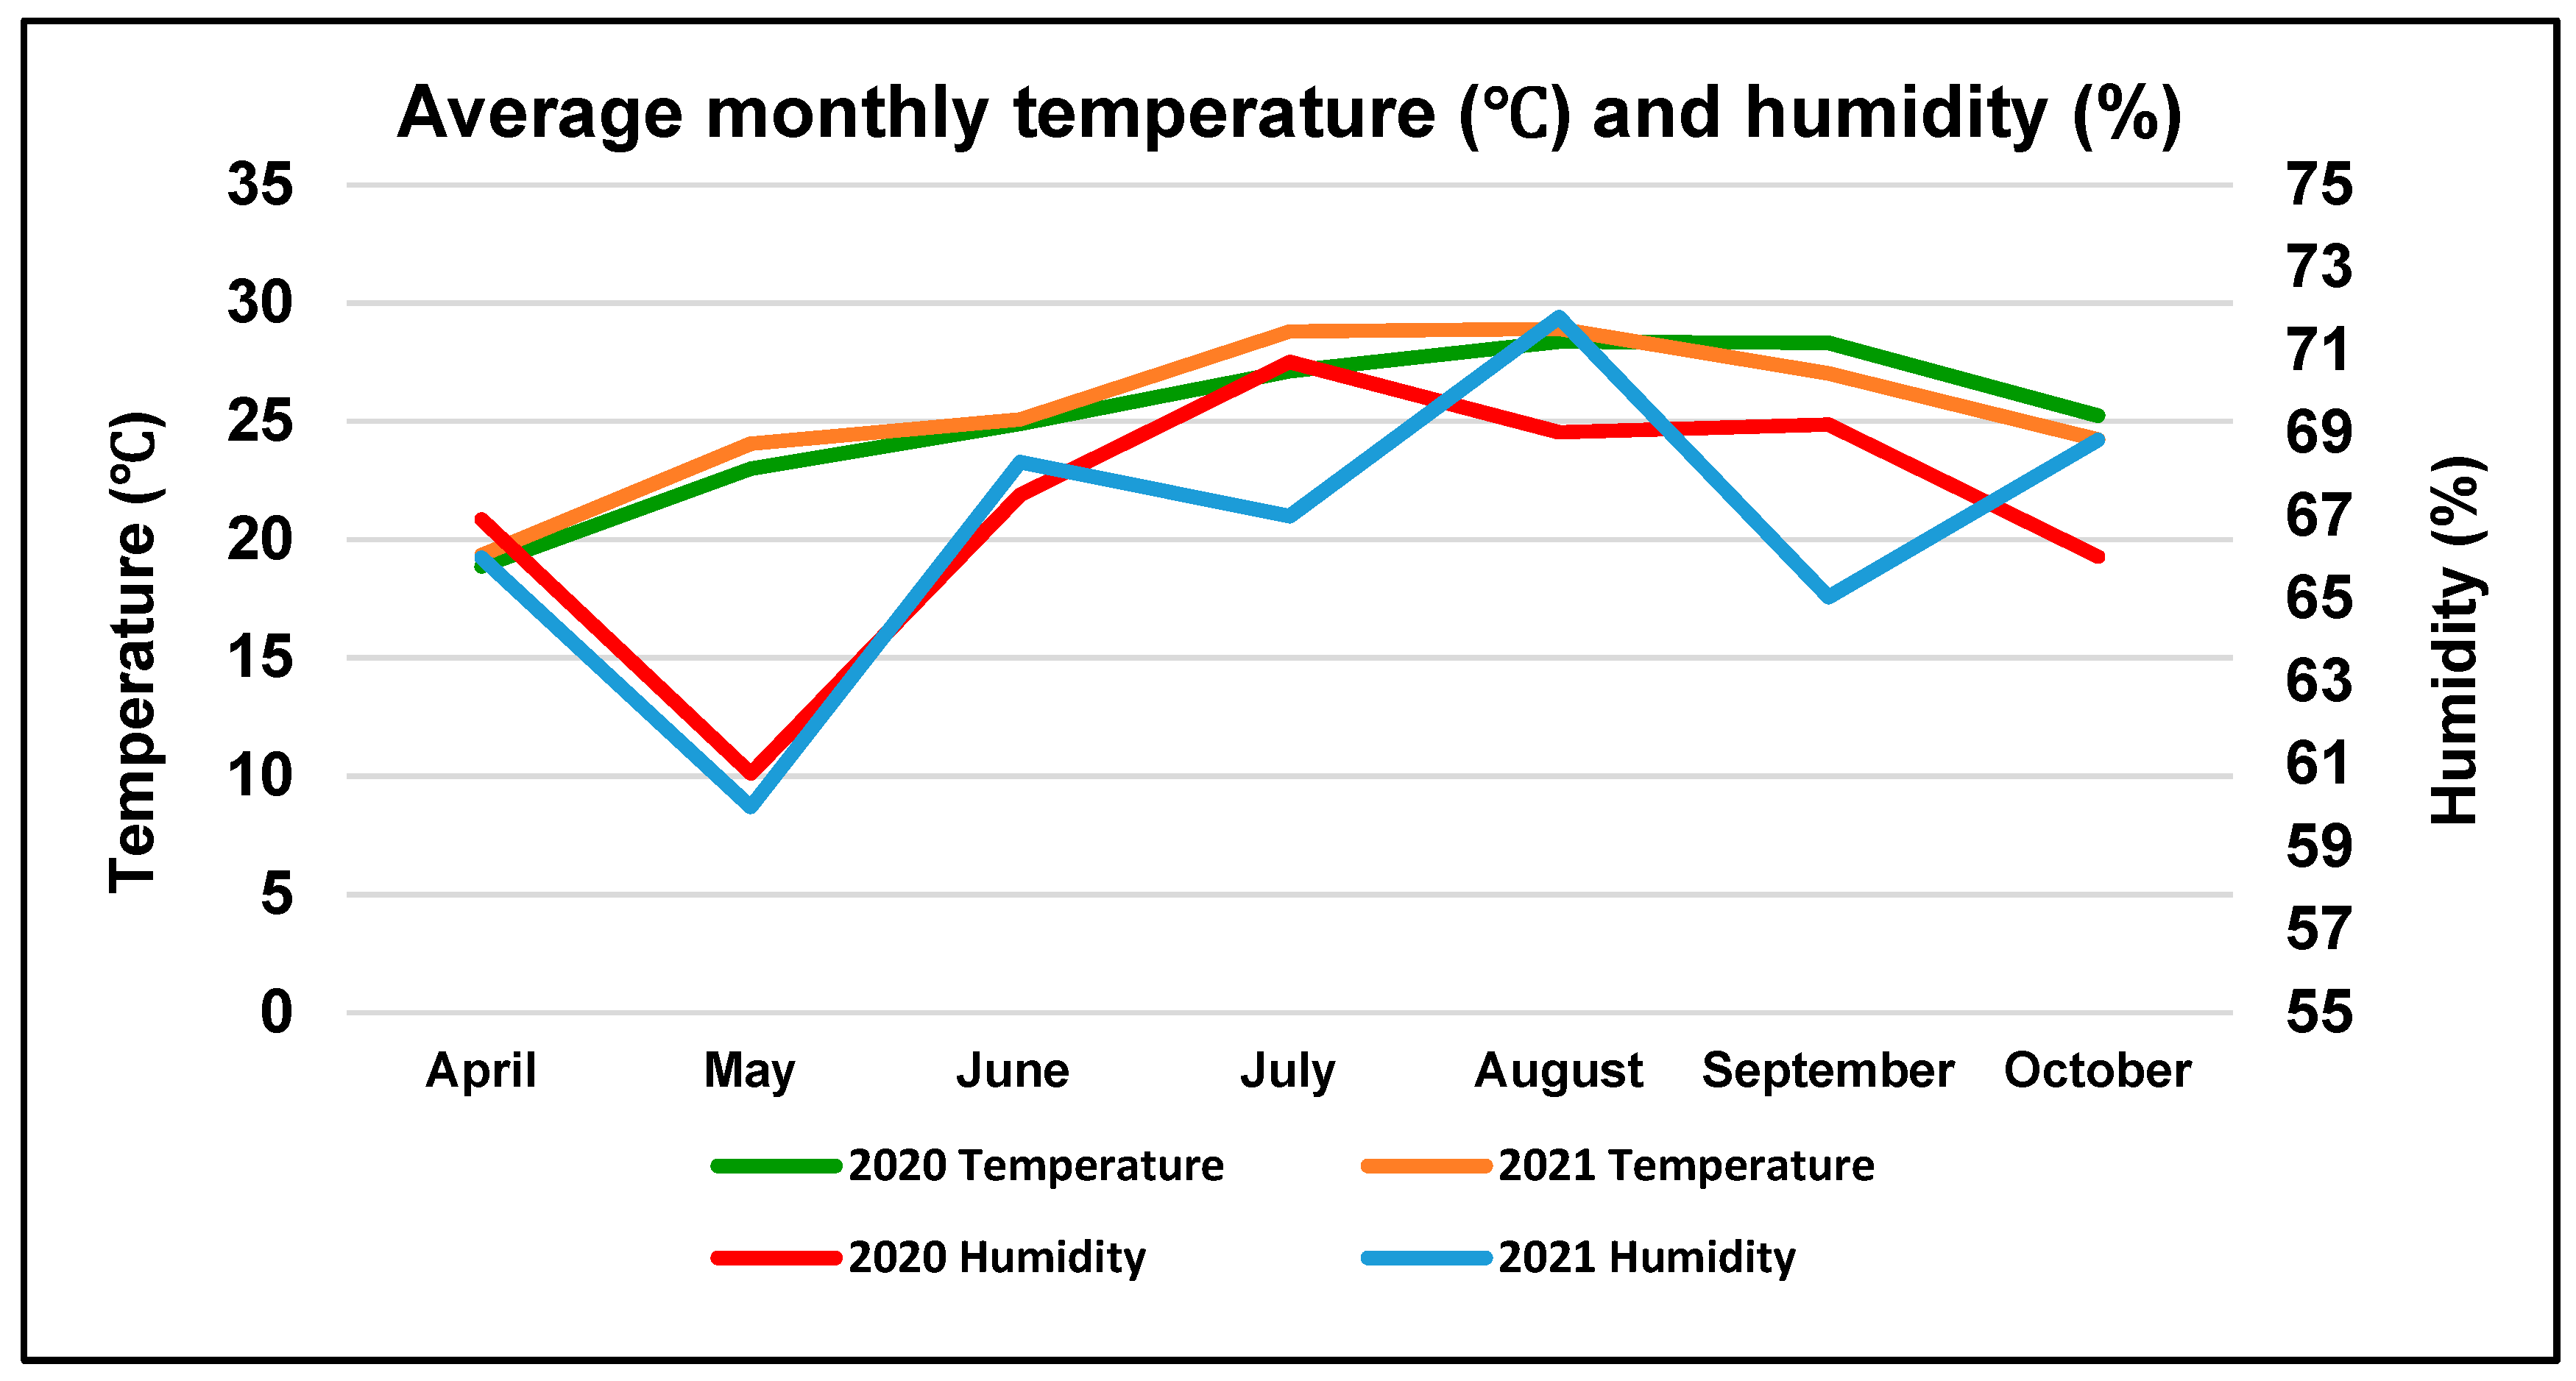
2.1. Experimental Location

A two-year field trial was conducted at the experimental station of the Faculty of Agriculture, Alexandria University, Alexandria, Egypt (31°, 20′N, 30°E), during 2020 and 2021 summer seasons. The soil of the experimental location is sandy loam in texture, consisting of sand, silt, and clay at 54%, 30%, and 16%, respectively. Soil pH was 8.15, with 1.30 dS m−1 electrical conductivity, and 7.50% CaCO3. The top 25 cm of soil contained 1.50% organic matter and 100, 4.80, and 290 mg kg−1 available N, P, and K, respectively. The experimental location is characterized by its hot, arid Mediterranean climate with zero precipitation during the summer season. Average monthly temperature and humidity during both experimental seasons are illustrated in Figure 1. Weather data presented in Figure 1 revealed homogeneity in the average monthly temperature and humidity between the two growing seasons. Minimum and maximum temperatures reached 18.87 and 28.37 °C for 2020 and 19.35, and 28.91 °C for 2021, respectively, while minimum and maximum humidity reached 60.78 and 70.72% for 2020 and 65.99, and 71.80% for 2021, respectively.

2.2. Seedbed Preparation and Agricultural Practices

After ploughing, disking and levelling, the seedbed was divided into experimental plots, each 5.6 m2 and containing 4 ridges, 70 cm apart and 2 m long. In both seasons, the maize three-way hybrid 368 and a local cultivar of forage cowpea were sown on 20 April. Seeds of both crops were produced and provided by the Agricultural Research Center, Giza, Egypt. Maize was sown in hills 25 cm apart, two seeds were placed in each hill, then thinned to one plant per hill 14 days after sowing to maintain the optimum plant density of 57600 plant ha−1. Forage cowpea was sown in hills 20 cm apart at the rate of 48 kg ha−1. This sowing pattern was followed to maintain 100% plant density for maize, in addition to 50% plant density for forage cowpea, in an additive intercropping model. All plots received the same amount of water as surface irrigation, applied on a weekly basis. Calcium monophosphate (15.5% P2O5) was applied, at the rate of 200 kg ha−1, once, along with seedbed preparation. Maize was sprayed with 720 g Lannate (C5H10N2O2S) dissolved in 480 L water ha−1, 30 days after sowing (DAS) to protect against stem borers, while weeds were hand-hoed when necessary.

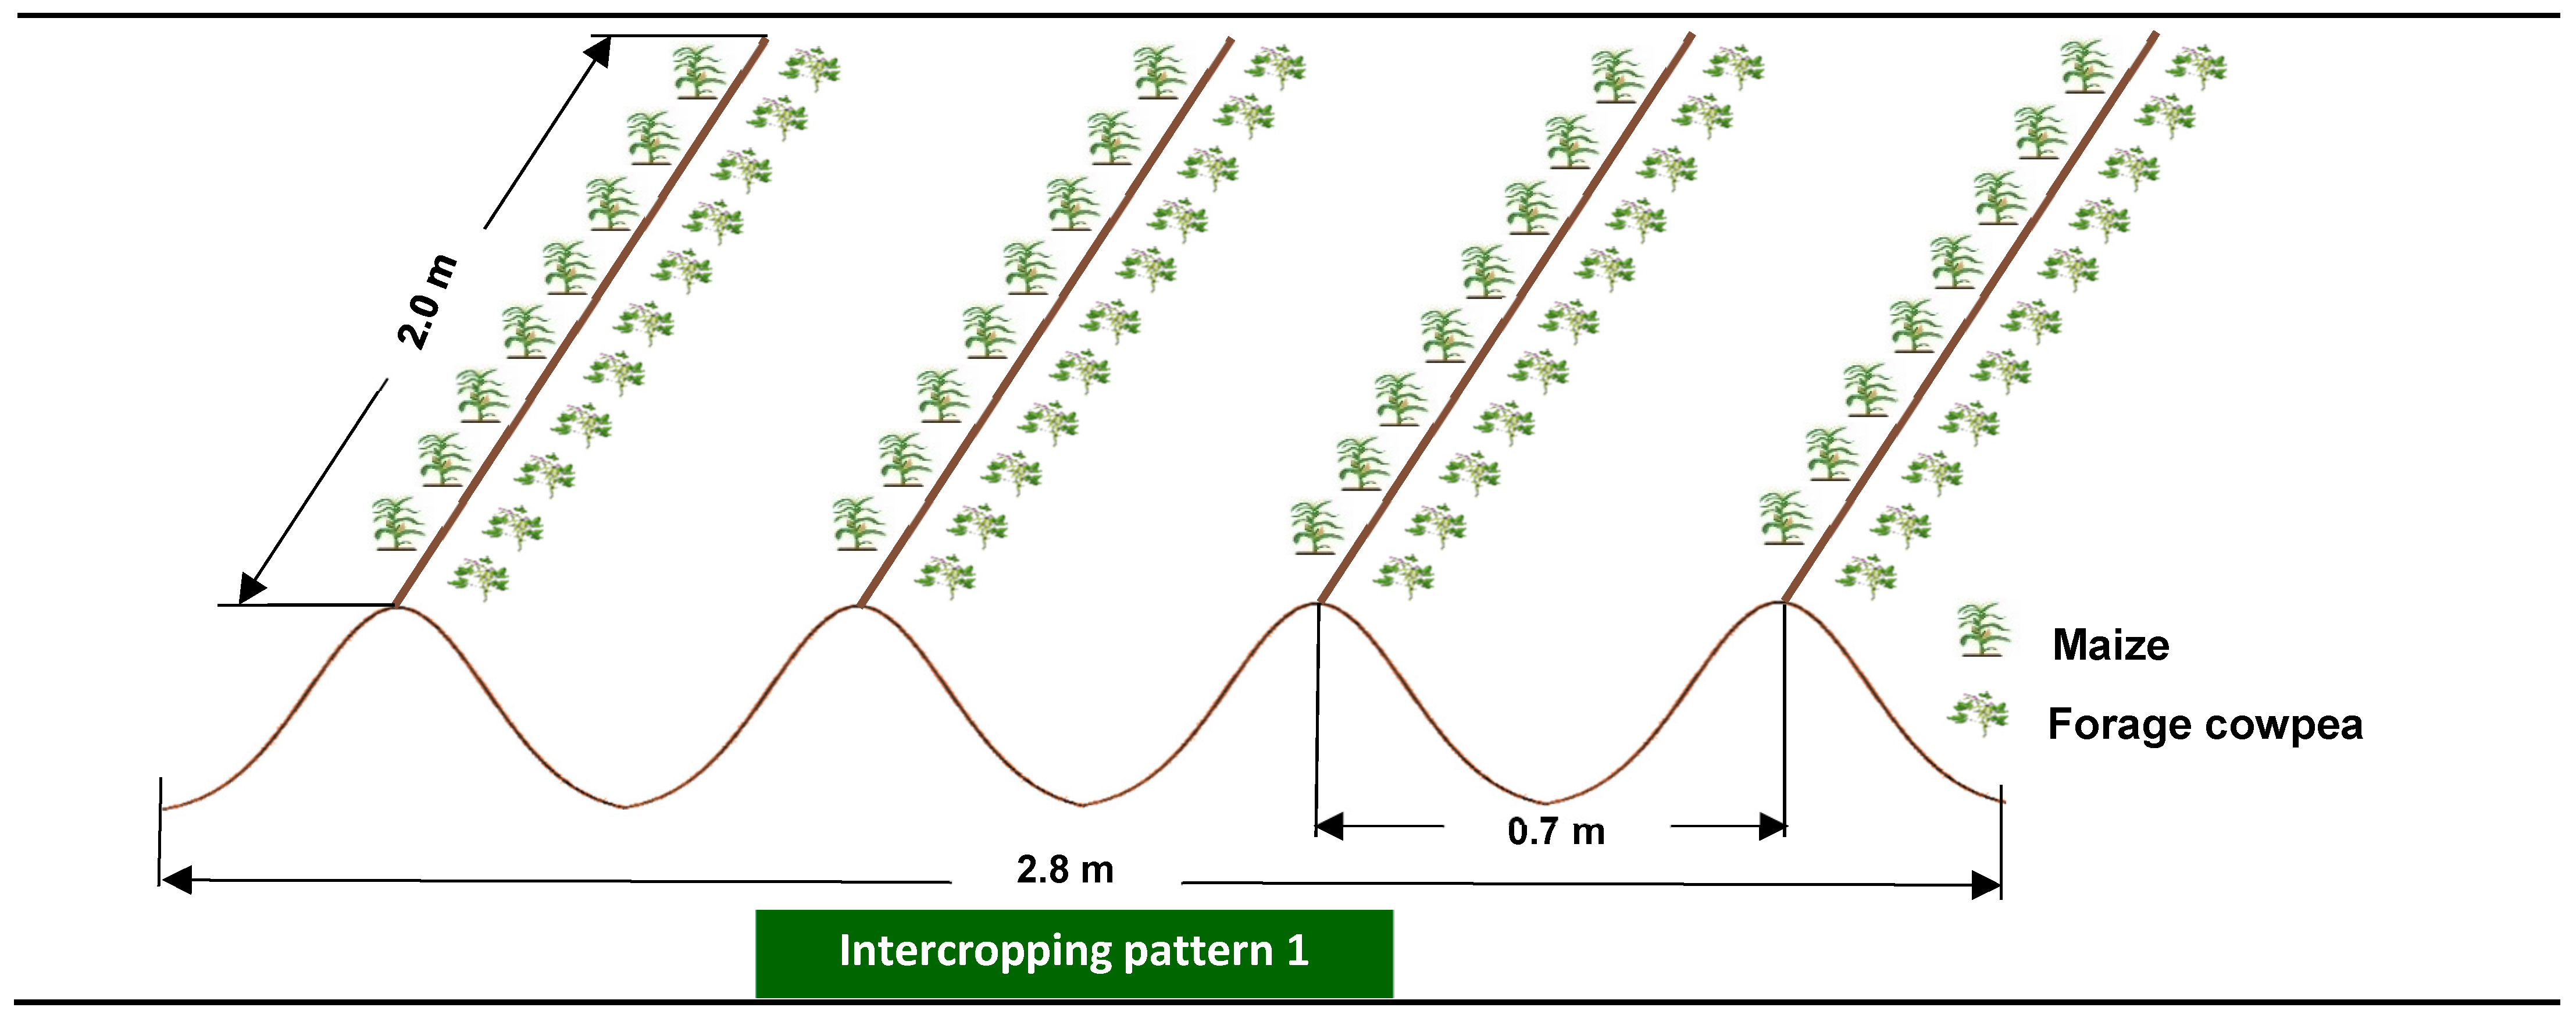
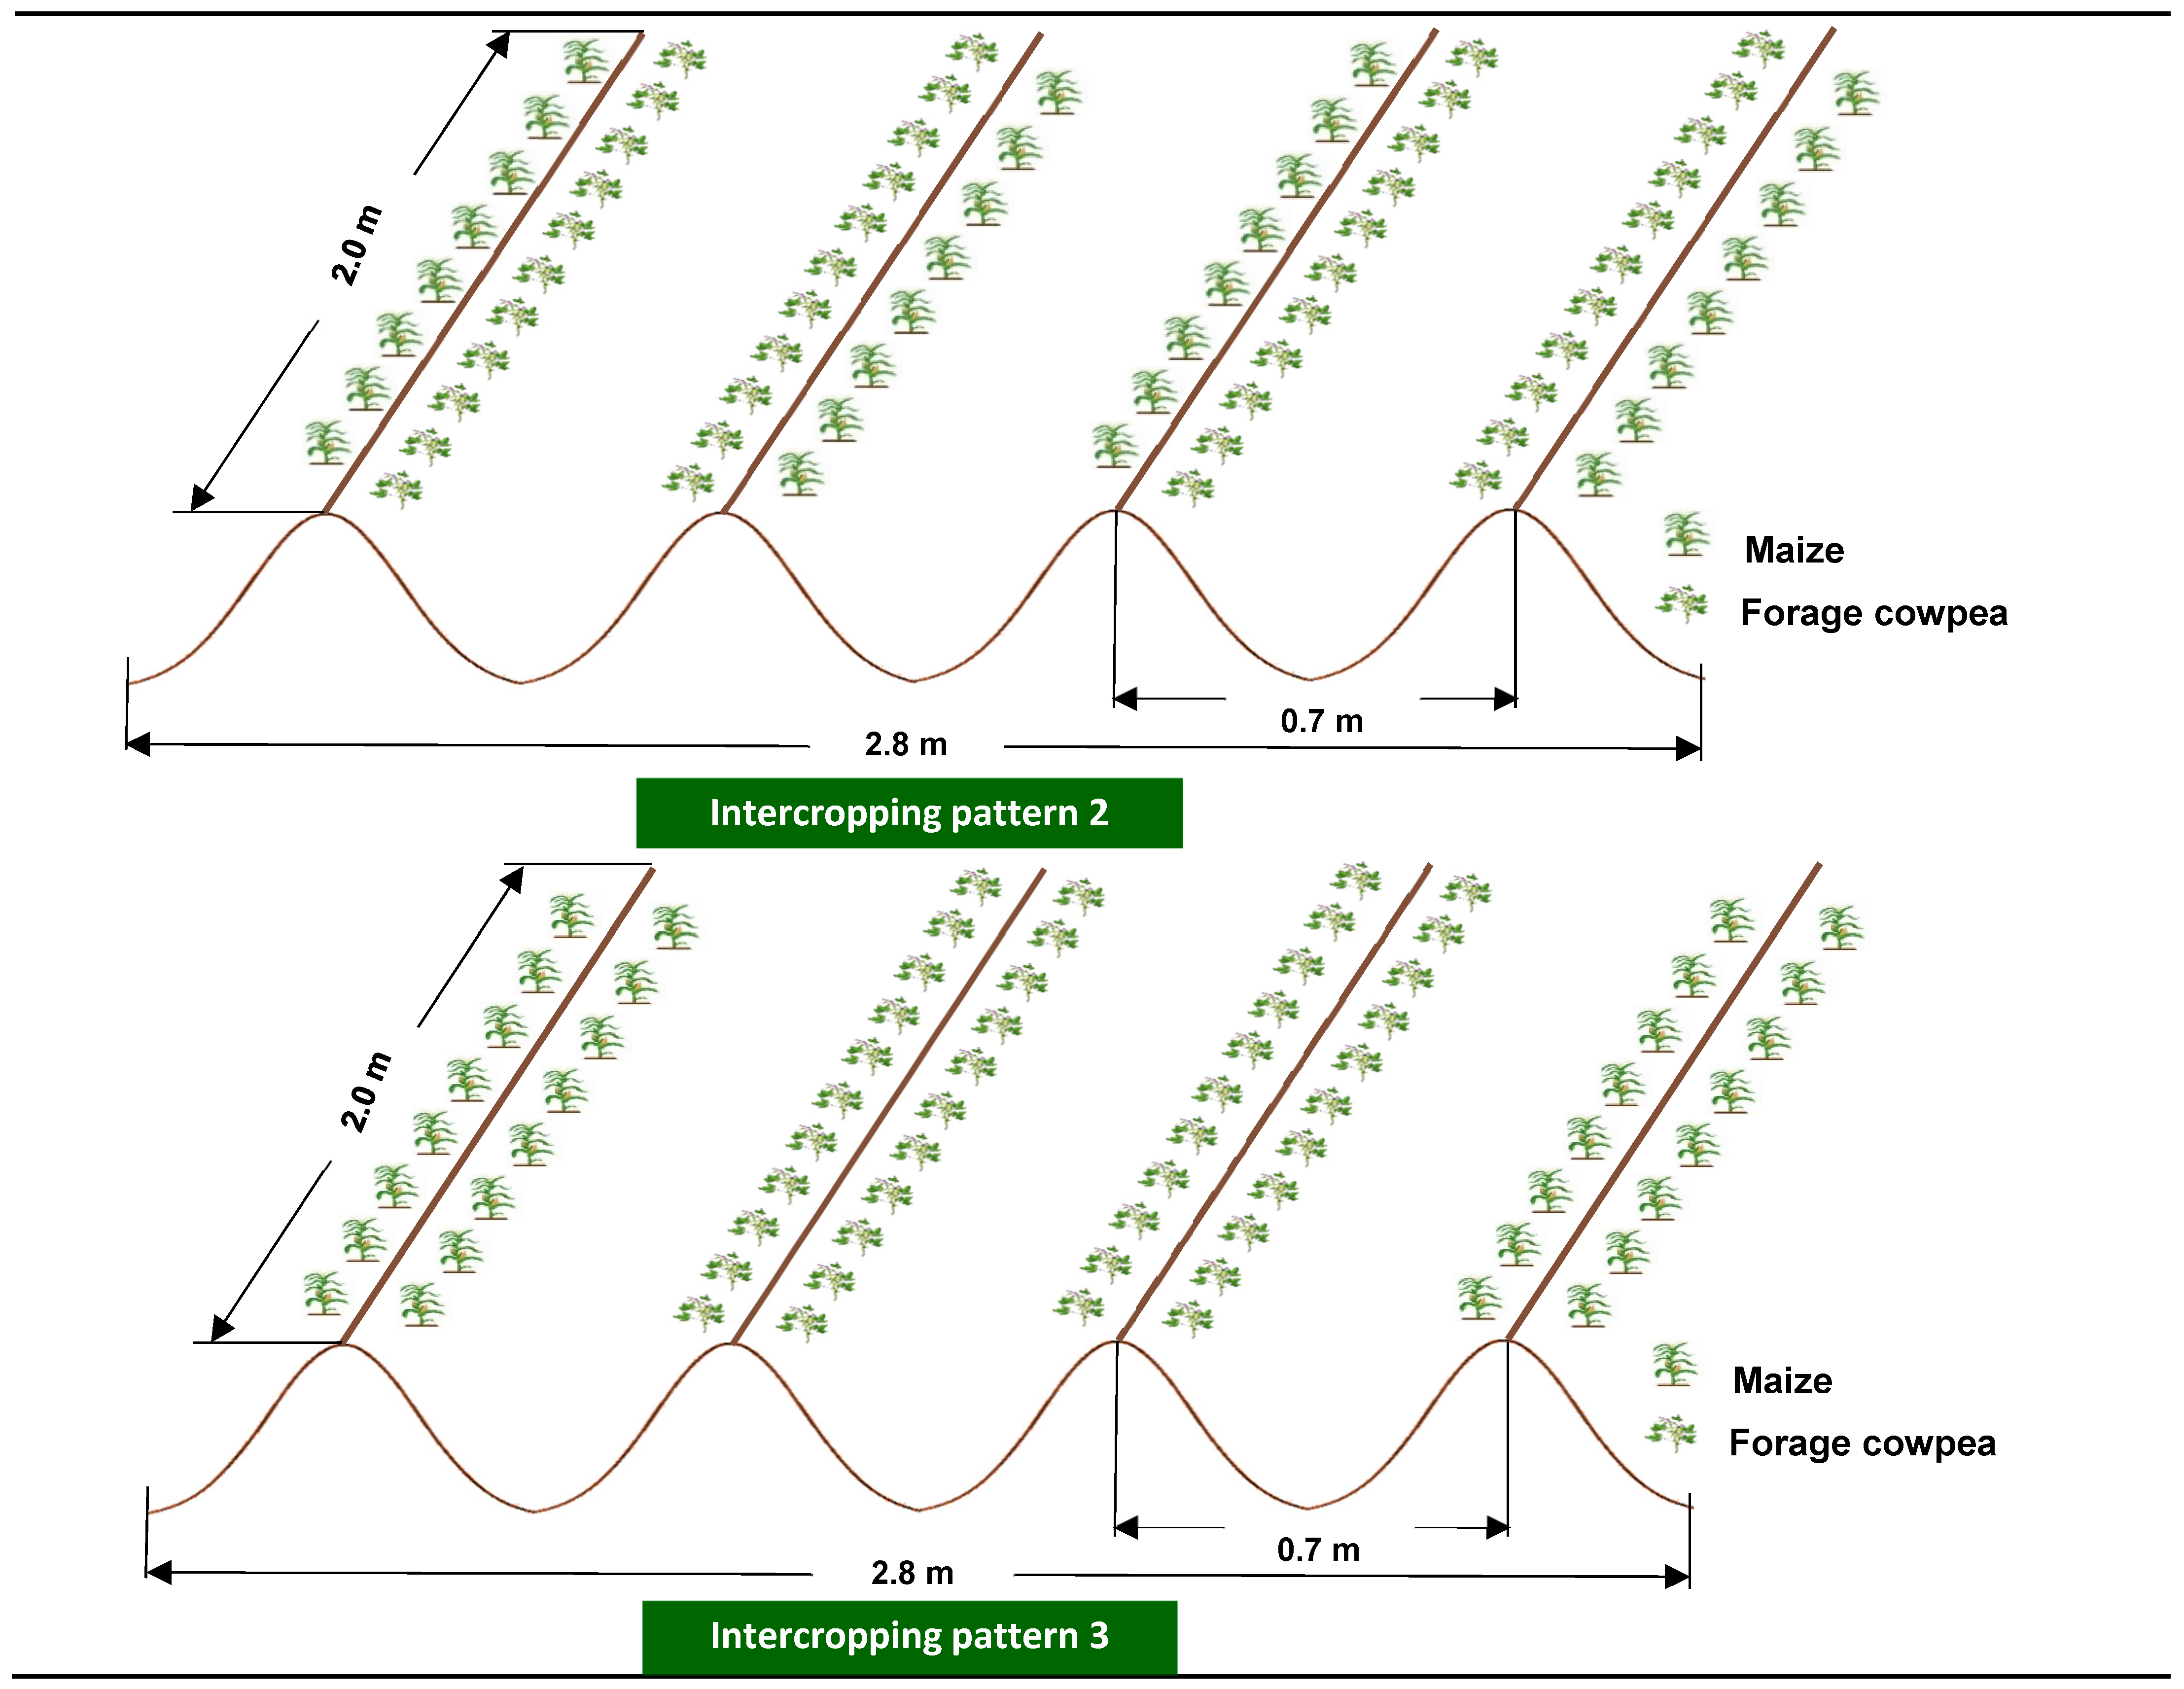
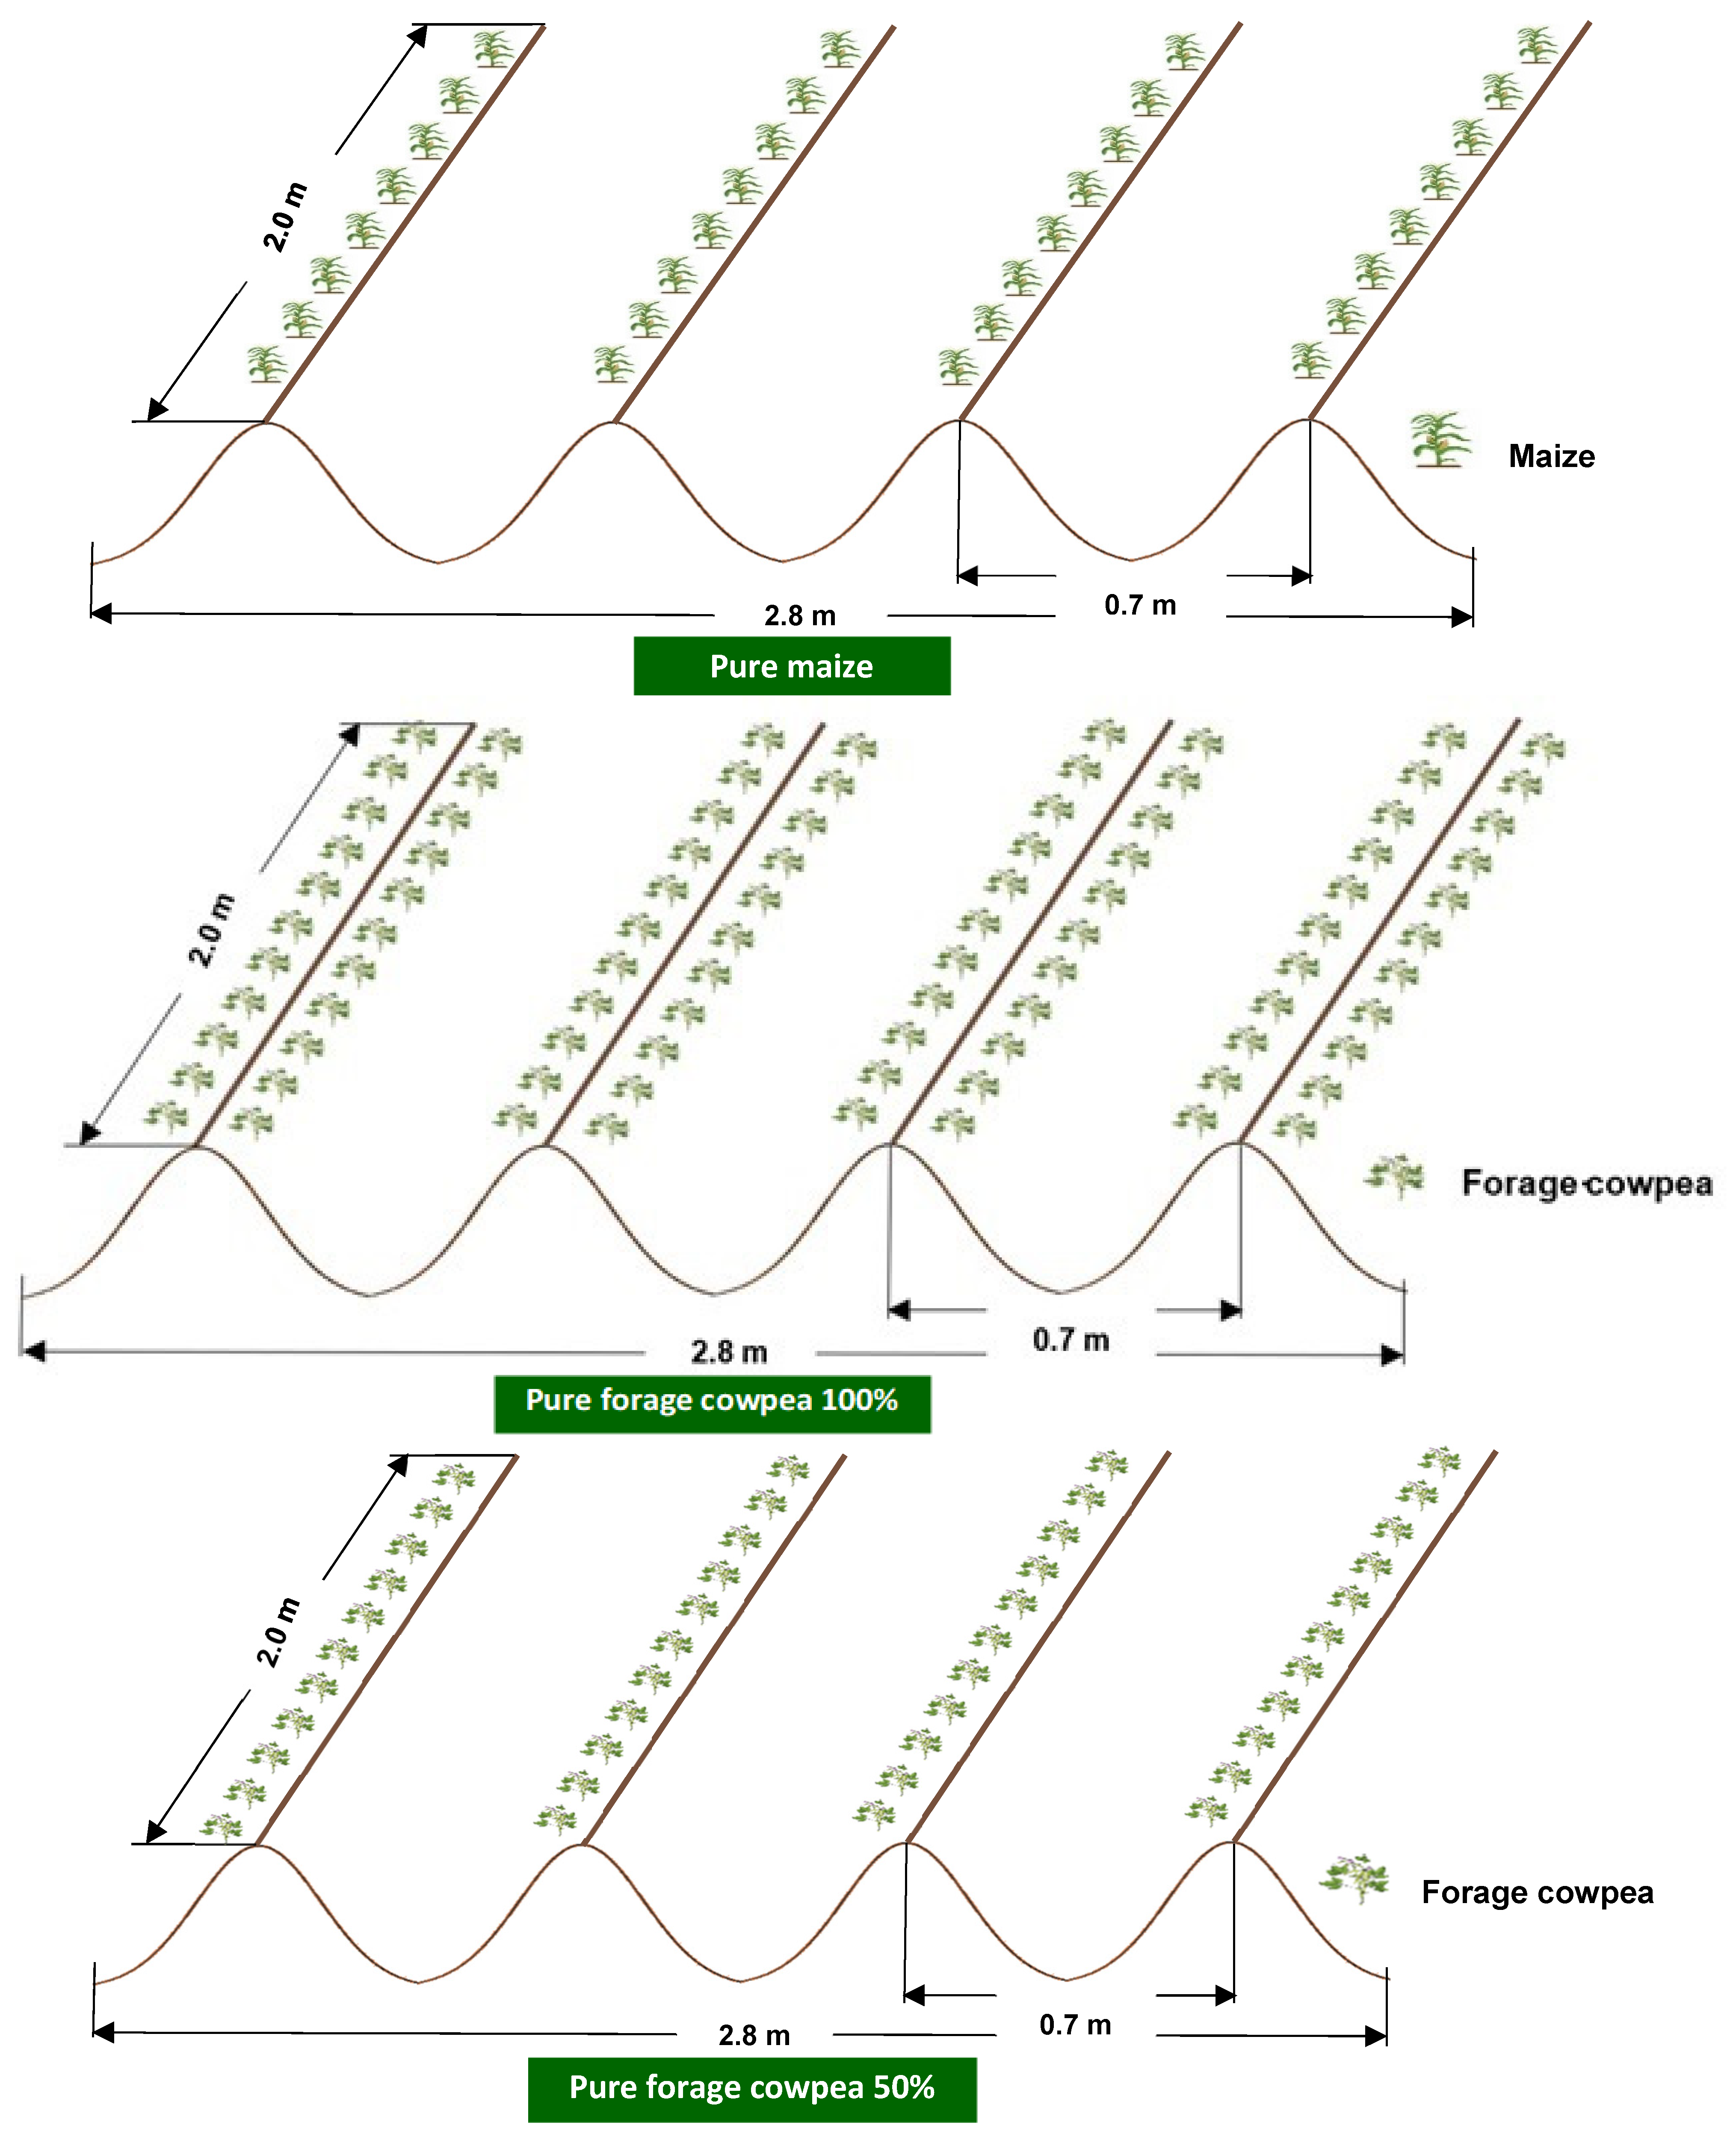
2.3. Design and Treatments

A factorial experimental design with three field replications was used to examine the performances of both crops sown with three intercropping patterns (IP) and subject to three N fertilizer schedules (NS). The evaluated intercropping patterns (Figure 2) were:
  • IP1: Maize was sown on one side of the ridge and forage cowpea was sown on the other side of the same ridge. This was repeated for the four ridges in the plot.
  • IP2: Outer borders of the plot were sown with maize, while inside the plot two adjacent rows of maize were enclosed within four forage cowpea rows, each two adjacent to each other.
  • IP3: The two outer ridges in the plot were sown with maize on both sides of the ridge, while the two inner ridges were sown with forage cowpea on both sides of the ridge.
Nitrogen fertilizer was applied as ammonium nitrate (33.5% N) at the rate of 288 kg N ha−1, distributed according to the three tested N schedules (NS) as follows:
  • NS1: 72 units at sowing + 72 units at 25 DAS + 72 units at 50 DAS + 72 units at 90 DAS
  • NS2: 108 units at 25 DAS + 108 units at 120 DAS + 72 units at 90 DAS
  • NS3: 120 units at 25 DAS + 120 units at 50 DAS + 48 units at 90 DAS
Pure maize and forage cowpea plots were included in each field replicate. Pure maize was sown in hills 20 cm apart on the upper third part of one side of the ridge, with the recommended plant density of 57,600 plant ha−1. Pure forage cowpea plots were seeded at 48 and 96 kg ha−1, to maintain 50, and 100% plant densities, respectively (Figure 3).

2.4. Forage Cowpea Harvesting and Measurements

Three cuts were taken from the forage cowpea along the growing season, the first cut at 50 DAS, the second cut was taken after 40 days, and then 30 days were left before the third cut. At the time of cutting, forage cowpea was clipped 10 cm above ground surface with a sickle and fresh forage yield (FFY) was immediately weighed in the field. A representative random sample of around 1 kg was taken from each plot and oven-dried at 60 °C for 72 h, then dry matter content was determined, upon which dry forage yield (DFY) was estimated.
For forage quality analyses, the dried samples were milled to a 1 mm particle size. The contents of neutral detergent fiber (NDF), acid detergent fiber (ADF), and acid detergent lignin (ADL) were sequentially determined using ANKOM200 Fiber analyzer (ANKOM Technology, Macedon, NY, USA) as described by [27]. The nitrogen (N) content was analyzed using the Kjeldahl procedure [28], then crude protein (CP) was calculated as N × 6.25. The crude ash (CA) content was determined by incinerating the samples in a muffle oven at 550 °C for 3 h [28]. The crude fat (CF) content was determined using the Soxhlet procedure [28]. Non-fiber carbohydrates (NFC) content (g kg−1) was calculated as follows:
N F C = 1000 ( C P + C F + N D F + C A )

2.5. Maize Harvesting and Measurements

At grain full maturation, prior to harvesting, plant height (cm), stem diameter (mm), number of leaves per plant, ear leaf area (cm2), and ear length (cm) were determined as an average of five randomly chosen plants from each plot. Maize was then manually harvested by cutting the stalks directly above ground level. Fresh matter yield (FMY) per plot was weighed immediately in the field. After that, ears per each plot were separated and weighed to determine ear yield (t ha−1), then shelled to determine grain yield (t ha−1). The 100-grain weight was determined as an average of three samples per plot. Shelling percentage was calculated as weight of grains per ear divided by total ear weight and multiplied by 100. Harvest index was calculated as grain yield divided by FMY and expressed as percentage. Maize grain oil content was determined using the Soxhlet procedure [28].

2.6. Land Use Efficiency and Yield Advantage

Land equivalent ratio (LER) was determined as the sum of the fractions of the yield (t ha−1) of maize and forage cowpea intercrops relative to their sole crop yields [29,30]:
L E R = Y a b Y a a + Y b a Y b b
where Yab is yield of maize “a” intercropped with forage cowpea “b”, Yaa is pure stand yield of maize “a”, Yba is yield of forage cowpea “b” intercropped with maize “a”, and Ybb is pure stand yield of forage cowpea “b”.
Land equivalent ratio was calculated twice, i.e., using both the 50% and 100% pure cowpea stands.
Dry matter equivalent ratio (DMER) was determined as the sum of the DM yield of the main maize crop and the forage cowpea companion crop relative to the DM yield of the sole main maize crop [31,32]:
D M E R = D M Y a b + D M Y b a D M Y a a
where DMYab is DMY of maize “a” intercropped with forage cowpea “b”, DMYba is DMY of forage cowpea “b” intercropped with maize “a”, and DMYaa is pure stand DMY of maize “a”.

2.7. Statistical Procedures

The PROC Mixed in SAS version 9.4 [33] was used for analysis of variance (ANOVA), with only replicates considered random. The statistical analysis was conducted separately for maize and forage cowpea, and for each cut of forage cowpea. The investigated variables (V) were analysed according to the following model:
Vijk = µ + Ri + IPj + NSk + (IP × NS)jk + eijk
where µ is the overall mean, Ri is the replication (i = 1, 2, 3), IPj is the intercropping pattern effect (j = 1, 2, 3), NSk is the nitrogen schedule effect (k = 1, 2, 3), (IP × NS)ij is the effect of the interaction between the intercropping pattern and nitrogen schedule, and eijk is the experimental error.
Prior to the statistical analysis of the data, number of leaves per plant−1, and number of ears per plot−1 were subjected to square root transformation, while shelling percentage and harvest index were arcsine transformed. Means were compared using the least significant difference (LSD) procedure, with significances declared at p < 0.05.
Results will be presented and discussed, combined over the two growing seasons, upon homogeneity of variance’s error, as tested following [34].

3. Results

3.1. Performance of Maize

Statistical analysis revealed that plant height, stem diameter, number of ears per plot, 100-grain weight, and harvest index (HI) were significantly variable among the evaluated IPs (p < 0.01), while number of leaves per plant, ear length, grain oil content and shelling percentage were not significantly different (p > 0.05) as affected by the IPs. Meanwhile, the tested NSs exerted non-significant influence on all the above-mentioned parameters (p > 0.05), except number of ears per plot, 100-grain weight and HI (p < 0.05). Only ear leaf area (ELA), total biological yield, ear yield and grain yield of maize were significantly (p < 0.01) affected by the two-way interaction between the IPs and NSs.
Means presented in Table 1 indicated that the significantly tallest maize plants were produced with IP2 (289.45 cm) and IP3 (283.52 cm), while, on the other hand, IP1 resulted in the highest significant stem diameter (24.15 mm), accompanying the shortest significant plants (278.55 cm). Plant height and stem diameter were non-significantly affected by the NSs. Number of leaves per plant was approximately the same for all tested IPs and NSs, averaging 16.18. Maximum significant number of ears per plot was reached with IP2 (26.44), which represented 42.46 and 23.96% increase over the number of ears achieved with IP1 and IP3. Similarly, NS1 resulted in the highest significant number of ears (25.33), with an increase of 25.96, and 21.25% over NS2, and NS3, respectively. Ear length and grain oil content were non-significantly affected by the tested IPs and NSs, and reached 25.19 cm, and 65.93 g kg−1, respectively, as the average of all treatments.
Ear leaf area (ELA) was significantly variable as affected by the IP × NS interaction. Means in Table 2 highlighted the superiority of NS3 in producing the significantly largest ELA only when IP1 was applied, while with IP2 and IP3, the three NSs were non-significantly different. Meanwhile, with NS1 and NS2, IP3 was superior to the other IPs in the production of the largest significant ELA, while with NS3, IP1 was the best pattern. Generally, the treatment combinations that resulted in the highest significant ELA were IP1 × NS3 (734.70 cm2), IP3 × NS1 (716.13 cm2), and IP3 × NS2 (703.88 cm2).
Means of total biological, ear and grain yields of maize as affected by the IP × NS interaction are presented in Table 3. A consistent trend was observed in the three parameters in response to the significant interaction. It was clear that NS1 was superior to NS2 and NS3 in uplifting the productivity of maize, when IP1 and IP3 were applied. The percentage increase in the biological, ear and grain yields of maize that accompanied the application of NS1 reached 15.89, 11.71 and 16.29% over NS2, and 18.06, 17.30 and 29.21% over NS3, for the three respective productivity parameters. Meanwhile, under IP2, all NSs produced non-significantly different maize yields, amounting to 45.93, 13.55, and 9.16 t ha−1, for biological, ear, and grain yields, respectively. Comparing the different IPs under the same NS revealed that, at NS1, IP2 and IP3, in general, were superior to IP1 for ear and grain yields. On the other hand, with NS2 and NS3, IP2 was always superior to IP1 and IP3 for the three tested productivity parameters.
Means of 100-grain weight, presented in Table 4, revealed that IP2 (38.03 g) and IP3 (36.47 g) were superior to IP1 (34.46 g) in the production of significantly heaviest maize grains, compared to IP1. Nonetheless, NS1 resulted in the production of the significantly heaviest 100-grain weight (38.02 g). Similarly, IP2 and IP3 resulted in the significantly highest HI, amounting to 21.03, and 19.82%, respectively. Among the tested NSs, NS1 produced the significantly highest HI (21.10%). On the other hand, shelling % was non-significantly variable neither among the tested IPs, nor among the NSs, and reached 68.93%, in average of all treatments.

3.2. Performance of Forage Cowpea

Analysis of variance for the three separate forage cowpea cuts demonstrated highly significant influence (p < 0.001) of the tested factors (IPs and NSs) on FFY, DFY, CP and NFC, while the three fiber fractions (NDF, ADF, and ADL), were not significantly variable among the treatments (p > 0.05).
Means of the first cut yield and quality revealed that the highest significant FFY and DFY were achieved for IP3, amounting to 10.61 and 1.27 t ha−1, respectively, followed by IP2, while the least significant FFY, and DFY were reported for IP1 (Table 5). Similarly, IP3 was superior to the other IPs with respect to the CP (159.49 g kg−1) and NFC (286.26 g kg−1) contents. Highest significant FFY and DFY were reported for NS3. On the contrary, NS1 resulted in the highest significant CP (160.87 g kg−1), and NFC (286.26 g kg1), compared to NS2, and NS3. The three fiber fractions were non-significantly variable in response to the tested IPs and NSs, and averaged 407.07, 259.48, and 47.35 g kg−1, for NDF, ADF, and ADL, respectively (Table 5). Variations of yield and quality of the second cut followed the same trend as the first cut, with IP3 producing the highest significant FFY (3.41 t ha−1), and DFY (0.45 t ha−1). In addition, IP3 resulted in the highest significant CP (15.96 g kg−1), and NFC (207.72 g kg−1) contents. Nonetheless, NS3 was superior to NS1 and NS2, concerning the FFY and DFY, while NS1 was superior concerning CP and NFC contents. Average means of NDF, ADF, and ADL, were 470.86, 321.68, and 53.50 g kg−1, respectively, and were non-significantly affected by the different IPs and NSs (Table 6). Same trend was followed by the third cut of forage cowpea, yet values for yield, CP, and NFC were observably less than the first and second cuts (Table 7). Maximum significant values for FFY, DFY, CP and NFC were reached with IP3, amounting to 1.86 and 0.24 t ha−1, 148.91, and 178.38 g kg−1, respectively. Unlike the first and second cuts, maximum FFY and DFY were reached with NS1, 1.81, and 0.23 t ha−1, respectively, which was, meanwhile, superior with the CP (151.90 g kg−1) and NFC (182.80 g kg−1) contents. Third cut produced higher fiber fractions than the first and second cuts, that were again non-significantly affected by the treatments. Average values for the three fiber fractions were 487.84, 350.20, and 56.89 g kg−1, for NDF, ADF, and ADL, respectively.
Means in Table 8 confirmed that, similar to the FFY and DFY of the three cuts, highest significant annual FFY and annual DFY were associated with IP3 and reached 15.88 and 1.96 t ha−1, respectively. The percentage increase in annual FFY with IP3 over IP1 and IP2 reached 32.33 and 17.28%, respectively. This led to an increase of around 29.80, and 20.25% in the annual DFY when IP3 was applied over IP1 and IP2, respectively. As for the effect of NSs on annual FFY and DFY, NS1 and NS3 produced the highest significant annual FFY, while NS3 was superior for annual DFY.

3.3. Yield Gain and Land Use Effeciency

Data presented in Table 9 revealed that the highest relative yield of maize (RYM) was achieved at NS1 for the three applied intercropping patters. On the other hand, the relative yield of cowpea (RYC) was the highest with NS3 across the three intercropping patterns. Data of LER indicated yield advantage (LER > 1) for all applied treatments. Yet, values of LER50 were greater than values of LER100, obviously due to the decreased competition between the component crops when related to only 50% cowpea stands rather than 100% pure cowpea stands. Even though all LER values were more than one, a clear advantage was reported for IP3 compared to IP1 and IP2. Estimating the yield advantage in terms of DMER showed a clear advantage for NS1 in uplifting the DMER over the other two N schedules. In addition, IP3 was superior to the other intercropping patters in producing the highest DMER values across all N schedules. In line with the analysis of the performances of the two component crops, the lowest yield gain (DMER < 1) was achieved with the combination of IP1 with NS3. In general, DMER values were lower than LER values for the same treatments.

4. Discussion

4.1. Impact of Intercropping Pattern

In the intercropping practice, competition among the component crops, mainly for light, soil water and nutrients, is among the crucial factors that determines the variations in their productivity [35]. Several previous studies reported lower yields for cereal–legume intercrops compared to sole crops [4,9,24]. They attributed this to the interspecific competition between the different component crops. The successful intercropping system should give each of the component crops a fair chance to exploit its potential and maximize its performance. This is greatly dependent on the utilized intercropping pattern that decides the canopy architecture, especially in case of cereal–legume crop components.
In the maize–cowpea intercropping system, physiological and morphological differences between the two crops significantly affect their ability to utilize the environmental resources [36,37]. Maize is usually taller and faster in its growth than cowpea, and this is known to reduce the light interception into the cowpea canopy grown under maize, negatively affecting the cowpea productivity [6]. It was, thus, clear in the current study that with advanced maize maturity the negative effect on cowpea productivity increased, denoted by the progressive decrease in cowpea fresh and dry yields from the first to the third cuts. Nonetheless, this was probably the main reason behind the deteriorated cowpea yields when IP1 and IP2 were applied, as cowpea was subject to the severe shading effect caused by the closely surrounding tall maize plants. On the other hand, applying IP3 seemed to allow for a more comfortable canopy architecture especially for cowpea plants by allowing more space for them and reducing the shade caused by maize plants, and that was clearly reflected in cowpea yields. The better light interception reaching the cowpea canopy in case of IP3 allowed for more efficient photosynthesis to take place that resulted in higher CP and NFC contents of the produced forage in the three cuts. [38] reported a close association between the increased radiation interception in the maize–cowpea intercropping system and the resulting dry weight of the component crops. Meanwhile, ref. [39] concluded that maize–cowpea intercropping system would be more productive if the shade caused by maize plants could be reduced. Similar results were reported by [20] for maize–soybean intercropping system. They stated that better yields from both crops were achieved at wider interrow seeding space, that allowed for better light interception into the plant canopy. Regarding the maize crop, previous studies on maize–legume intercropping confirmed that, compared to sole maize cropping, intercropping improved the canopy transmittance of maize by increasing the exposure of the ear leaves to light which enhances the photosynthetic activities resulting in better grain formation [40]. The IP3, in this regard, would be more useful for maize plants as it reduces the self-shading and, thus, permits more light into the maize canopy.
The root system morphology and distribution of the intercrops is another important determinant for the belowground competition between the component crops [36]. On the one hand, intercropping cereal and legume crops of variable rooting habits that are capable of exploiting soil moisture and nutrients at different depths results in a more efficient intercropping system [41]. On the other hand, intercropped maize is usually characterized by a deeply proliferated root system with a larger mass of fine roots that could support better access to soil nutrients [42,43], which gives it a competitive advantage over cowpea [44,45], especially when applying IP1 and IP2. Hence, an addition to the advantages of IP3 is that it prevented close contact between maize and cowpea root systems and gave the root system of cowpea more space to grow and spread, which was directly reflected in higher productivity at the different cuts.
In their study of maize-cowpea mixtures upon same-row and alternate-row sowing patterns, ref. [46] concluded that sowing alternate-rows resulted in a better yield performance for both crops, due to more available space, especially for cowpea, resulting in reduced competition with maize [47]. They also recommended climbing-type legumes, such as cowpea, to be intercropped with maize rather than dwarf-type legumes, due to their higher biomass production. In the current study, IP2 and IP3, that favored the growth and productivity of cowpea by providing more space for its plants, resulted in the taller maize plants, probably because the plants were densely populated in a limited area in the experimental plots that forced them to strive for more solar radiation through internode elongation [24]. It is evident that maize is also sensitive to the spatial arrangement of the intercropping component crops [20], which justifies the highest significant number of ears per plot and 100-grain weight associated in the current study with the application of IP2 and IP3, and consequently, reflected in the highest significant ear and grain yields and harvest index.

4.2. Impact of Nitrogen Schedule

Experimental evidence in the current study indicated marked variations in the performances of the intercropped maize and cowpea, dependent on the N schedule, despite that same total amount of mineral N was applied in the three evaluated N schedules. The total amount of N fertilizer applied in the current study (288 kg N ha−1) was based upon the recommendations for mono-cropped maize, yet different splitting regimes (N schedules) significantly affected the response of the intercrops to the applied N fertilizer. Maize and cowpea have complementarity in N consumption, with maize having higher demands for N fertilizer than cowpea [48]. It usually acquires its high N needs from the soil, while forage cowpea mainly fulfills its needs from the biological N fixation [6,49]. Atmospheric N fixation by forage cowpea would, thus contribute to reducing the competition of both crops for soil-applied N, and therefore, allow maize to use more of this [10,36]. In addition, maize might also use some of the biologically fixed N from cowpea [50]. Hence, under lower N rates than those recommended, cowpea plants may fail to fix the adequate amount of atmospheric N, and would consume all fixed N and compete with maize for soil-applied N, resulting in reduction in maize yield [51]. Therefore, the aim of the current study was not to reduce the total amount of applied N, but to reach the most appropriate N application schedule that enhances the biological N fixation for the benefit of both crops. Therefore, all the treatments that would support biological N fixation by forage cowpea, would, in turn, uplift the performance of the component crops in the intercropping system.
The shading caused by the tall maize crop on the short cowpea canopy in the intercropping system would reduce light interception by cowpea plants, negatively affecting the biological N fixation by the nodules [36]. Consequently, a reduction in the yield of both crops and quality of forage cowpea (in terms of CP content), were observed accompanying IP1. However, this negative effect was counterbalanced under NS1. Nevertheless, the effective N utilization by maize plants usually occurs in the first half of its life cycle until silking (approximately at 60 DAS). Delayed application of N beyond that stage would not be beneficial for maize productivity [52,53]. It was, thus, expected that the best maize performance would accompany NS3, with 240 out of 288 kg N ha−1 applied before maize silking, ensuring maximum benefit for the crop. Results of ELA were in line with this assumption only at IP1, while applying IP2 and IP3 equalized the effects of the three N schedules. On the other hand, the other maize yield attributes like number of ears per plot and 100-kermel weight were the highest with NS1, that was reflected on a higher ear and grain yields and harvest index. This result was achieved despite the fact that NS1 provided maize with only 192 kg N ha−1 by the time of heading. This was probably attributed to the inclusion of a 48 kg N ha−1 starter dose in this schedule.
In close agreement with the current results, ref. [25] highlighted the importance of the N starter dose applied at sowing on intercropped maize productivity. They reported a clear reduction in number of ears per plant, shoot dry weight and grain yield of maize when zero N was applied at sowing. In their study, to emphasize the importance of the N starter dose on the legume crop growth and development, ref. [54] stated that in the early growth stages the legume crop relies mainly on N in seeds and soil fulfilling its requirements until the seedling stage, whereas, in later growth stages, N requirements are fulfilled mainly from biological N fixation. Therefore, deficiency of N in the soil in the seedling stage and/or limited biological N fixation at later stages might induce N deficiency symptoms on the legume plant. The authors suggested that to eliminate N deficiency and enhance plant initial growth, a N starter dose is required. However, this should be wisely managed as high N doses would negatively impact nodulation and N fixation [55].

4.3. Yield Gain and Land Use Effeciency

Farmers in Egypt are nowadays interested in practicing intercropping as a vital strategy to increase land use efficiency. In the present study, maize and forage cowpea were additively intercropped at the rates of 100 and 50% of the recommended plant density, respectively, to maintain a total plant density of 150% in an additive series. Analysis of yield gain and land use efficiency for the maize–forage cowpea intercropping system revealed that the highest relative maize yield was associated with the application of N starter dose (NS1), while the highest relative cowpea yield was achieved with NS3, where the highest N dose (240 kg ha−1) was applied early in the season and only 48 kg ha−1 was applied later in the growing season. In general, the relatively high intercropped maize yield compared to sole maize cropping highlights the ability of maize to effectively utilize the intercropping inputs for its own benefit and interpret that in terms of high grain yield. In a similar maize-cowpea intercropping system, ref. [6] reported that intercropped maize was able to uptake 1.34 times more N than sole maize. Meanwhile, the higher maize relative yield compared to cowpea relative yield indicated that a bonus amount of forage cowpea could be achieved without severely affecting the grain yield of the main maize crop. For example, at IP3 and NS3, 40% forage cowpea could be achieved with a 106% gain in maize yield, compared to maize pure stands, confirming the usefulness of the applied additive intercropping system.
Values of LER were greater than 1 for all treatments when calculated based on 50 and 100% pure cowpea stands, indicating a clear yield advantage in the intercropping system. Similar results were reported by [2,8] for maize–cowpea intercropping systems. Obviously, LER values calculated based on 50% pure cowpea stands were greater than the values based on 100% pure cowpea stands. Despite the wide utilization of LER to judge the efficiency of intercropping systems, its adequacy for additive intercropping is being extensively questioned. A major drawback is that in the additive intercropping series the main crop is presented with its full 100% plant density in addition to an additional percentage of the companion crop, which ultimately results in a combined LER value of more than 1 [56,57,58], leading to overestimating of the yield gain [59]. Therefore, DMER was proposed by [31,32] to replace the traditionally used LER in case of additive intercropping series, whenever the target is maximization of the dry matter yield gain [59]. Results of the current study confirmed this assumption, with DMER values lower than LER values for all treatments. The highest DMER values were achieved with IP3 and NS1, confirming their superiority over the other treatments in uplifting the dry matter yield of the intercrops, which is the main target of the study.

5. Conclusions

The current study provided practical evidence that, when properly managed, the interspace in widely spaced crops such as maize could be used to grow short legumes such as forage cowpea without sacrificing the final maize grain yield. The highest significant productivity from both crops was achieved with IP3 due to the wide space provided for forage cowpea leading to less competition between the two crops. Maize produced 9.07 t ha−1 grain yield under IP3 and NS1. In addition, application of IP3 resulted in the highest significant forage cowpea dry yield, amounting to 1.27, 0.45, and 0.24 t ha−1, for the three respective cuts. Furthermore, this research confirmed that proper N management in the intercropping systems could improve the overall productivity of the system. In the current study, splitting the optimum N rate into several doses helped to meet the demands of both crops in their critical growth periods, and thus improved their responses, with NS1 resulting in the best yields of maize and forage cowpea due to the application of a N starter dose with sowing. When intercropping maize and forage cowpea, it is recommended to follow the third proposed intercropping pattern (IP3) and to include a nitrogen starter dose in the fertilization scheme (NS1) to ensure the highest productivity from the component crops.

Author Contributions

Conceptualization, H.S.A.S., A.I.N. and H.E.K.; methodology and investigation, H.S.A.S. and A.I.N.; resources, H.S.A.S. and A.I.N.; laboratory analyses, H.S.A.S.; data collection and statistical analysis, H.S.A.S.; writing—original draft preparation, H.S.A.S.; writing—review and editing, H.S.A.S., A.I.N. and H.E.K.; supervision, A.I.N.; project administration, H.S.A.S., A.I.N. and H.E.K.; funding acquisition, H.S.A.S. and A.I.N. All authors have read and agreed to the published version of the manuscript.

Funding

This research received no external funding.

Institutional Review Board Statement

Not applicable.

Informed Consent Statement

Not applicable.

Conflicts of Interest

The authors declare no conflict of interest.

References

  1. Xia, H.; Wang, L.; Xue, Y.; Kong, W.; Xue, Y.; Yu, R.; Xu, H.; Wang, X.; Wang, J.; Liu, Z.; et al. Impact of increasing maize densities on agronomic performances and the community stability of productivity of maize/peanut intercropping systems. Agronomy 2019, 9, 150. [Google Scholar] [CrossRef] [Green Version]
  2. Ayele, H.M. Evaluation of the effect of maize-legume intercropping on soil moisture improvement in arid area of Bena-Tsemay district, South omo zone, Southern Ethiopia. Int. J. Agric. Res. Innov. Technol. 2020, 10, 80–86. [Google Scholar] [CrossRef]
  3. Mishra, K. Evaluation of maize cowpea intercropping as fodder through front line demonstration. J. Med. Plants 2019, 7, 82–85. [Google Scholar]
  4. Salama, H.S.A.; Abdel-Moneim, M.H. Maximizing land use efficiency and productivity of soybean and fodder maize intercrops through manipulating sowing schedule and maize harvest regime. Agronomy 2021, 11, 863. [Google Scholar] [CrossRef]
  5. Yang, C.; Fan, Z.; Chai, Q. Agronomic and economic benefits of pea/maize intercropping systems in relation to N fertilizer and maize density. Agronomy 2018, 8, 52. [Google Scholar] [CrossRef] [Green Version]
  6. Eskandari, H.; Ghanbari, A. Intercropping of maize (Zea mays) and cowpea (Vigna sinensis) as whole-crop forage: Effect of different planting pattern on total dry matter production and maize forage quality. Not. Bot. Horti Agrobot. Cluj-Napoca 2009, 37, 152–155. [Google Scholar]
  7. Javanmard, A.; Nasab, A.M.; Javanshir, A.; Moghaddam, M.; Janmohammadi, H. Forage yield and quality in intercropping of maize with different legumes as double-cropped. J. Food Agric. Environ. 2009, 7, 163–166. [Google Scholar]
  8. Dahmardeh, M.; Ghanbari, A.; Syahsar, B.A.; Ramrodi, M. The role of intercropping maize (Zea mays L.) and cowpea (Vigna unguiculata L.) on yield and soil chemical properties. Afr. J. Agric. Res. 2010, 5, 631–636. [Google Scholar] [CrossRef]
  9. Bacchi, M.; Monti, M.; Calvi, A.; Lo Presti, E.; Pellicanò, A.; Preiti, G. Forage Potential of Cereal/Legume Intercrops: Agronomic Performances, Yield, Quality Forage and LER in Two Harvesting Times in a Mediterranean Environment. Agronomy 2021, 11, 121. [Google Scholar] [CrossRef]
  10. Horvatić, I.; Svečnjak, Z.; Maćešić, D.; Jareš, D.; Uher, D. Influence of intercropping maize with cowpea and fertilization with clinoptilolite on forage yield and quality. J. Environ. Sci. Eng. B 2018, 7, 337–343. [Google Scholar] [CrossRef]
  11. Kamalongo, D.M.; Cannon, N.D. Advantages of bicropping field beans (Vicia faba) and wheat (Triticum aestivum) on cereal forage yield and quality. Biol. Agric. Hortic. 2020, 36, 213–229. [Google Scholar] [CrossRef]
  12. Neugschwandtner, R.W.; Kaul, H.-P. Nitrogen uptake, use and utilization efficiency by oat–pea intercrops. Field Crop. Res. 2015, 179, 113–119. [Google Scholar] [CrossRef]
  13. Lithourgidis, A.S.; Vlachostergios, D.N.; Dordas, C.A.; Damalas, C.A. Dry matter yield, nitrogen content, and competition pea-cereal intercropping systems. Eur. J. Agron. 2011, 24, 287–294. [Google Scholar] [CrossRef]
  14. Salama, H.S.; Nawar, A.I.; Khalil, H.E.; Shaalan, A.M. Improvement of Maize Productivity and N Use Efficiency in a No-Tillage Irrigated Farming System: Effect of Cropping Sequence and Fertilization Management. Plants 2021, 10, 1459. [Google Scholar] [CrossRef]
  15. Salama, H.S.A. Yield and nutritive value of maize (Zea mays L.) forage as affected by plant density, sowing date and age at harvest. Ital. J. Agron. 2019, 14, 114–122. [Google Scholar] [CrossRef]
  16. Salama, H.S.A.; Zeid, M.M.K. Hay quality evaluation of summer grass and legume forage monocultures and mixtures grown under irrigated conditions. Aust. J. Crop Sci. 2016, 11, 1543. [Google Scholar] [CrossRef]
  17. Ofori, E.; Oteng-Darko, P.; Berchie, J.N.; Nimako, F.O.; Yeboah, S.; Danquah, E.O. Monitoring of soil moisture regime and water use efficiency under maize cowpea cropping system. Int. J. Curr. Microbiol. App. Sci. 2014, 3, 837–848. [Google Scholar]
  18. Bayer, C.; Mielniczuk, J.; Amado, T.J.; Martin- Neto, L.; Fernandes, S.V. Organic matter storage in a sandy clay loam Acrisol affected by tillage and cropping systems in southern Brazil. Soil Tillage Res. 2000, 54, 101–109. [Google Scholar] [CrossRef]
  19. Reddy, A.S.; Palled, Y.B. Effect of intercropped fodder cowpea on maize and system productivity in maize+ fodder cowpea intercropping systems. J. Farm. Sci. 2016, 29, 265–267. [Google Scholar]
  20. Kim, J.; Song, Y.; Kim, D.W.; Fiaz, M.; Kwon, C.H. Evaluating different interrow distance between corn and soybean for optimum growth, production and nutritive value of intercropped forages. J. Anim. Sci. Technol. 2018, 60, 1–6. [Google Scholar] [CrossRef] [Green Version]
  21. Kitonyo, O.M.; Chemining’wa, G.N.; Muthomi, J.W. Productivity of farmer-preferred maize varieties intercropped with beans in semi-arid Kenya. Int. J. Agron. Agric. Res. 2013, 3, 6–16. [Google Scholar]
  22. Mburu, M.W.K.; Mureithi, J.G.; Gachene, C.K.K. Water and Light Use in Maize Intercropped with Mucuna. In Proceedings of the aGRO 2011 Biennial Conference, Nairobi, Kenya, 20–28 September 2011; pp. 156–177. [Google Scholar]
  23. Salama, H.S.A.; Badry, H.H. Effect of partial substitution of bulk urea by nanoparticle urea fertilizer on productivity and nutritive value of teosinte varieties. Agron. Res. 2020, 18, 2568–2580. [Google Scholar] [CrossRef]
  24. Nawar, A.I.; Salama, H.S.; Khalil, H.E. Additive intercropping of sunflower and soybean to improve yield and land use efficiency: Effect of thinning interval and nitrogen fertilization. Chil. J. Agric. Res. 2020, 80, 142–152. [Google Scholar] [CrossRef]
  25. Crusciol, C.A.C.; Mateus, G.P.; Momesso, L.; Pariz, C.M.; Castilhos, A.M.; Calonego, J.C.; Borghi, E.; Costa, C.; Franzluebbers, A.J.; Cantarella, H. Nitrogen-fertilized systems of maize intercropped with tropical grasses for enhanced yields and estimated land use and meat production. Front. Sustain. Food Syst. 2020, 4, 544853. [Google Scholar] [CrossRef]
  26. Mateus, G.P.; Crusciol, C.A.C.; Pariz, C.M.; Borghi, E.; Costa, C.; Martello, J.M.; Franzluebbers, A.J.; Castilhos, A.M. Sidedress nitrogen application rates to sorghum intercropped with tropical perennial grasses. Agron. J. 2016, 108, 433–447. [Google Scholar] [CrossRef]
  27. Van Soest, P.J.; Robertson, J.B.; Lewis, B.A. Methods for dietary fiber, neutral detergent fiber, and non-starch polysaccharides in relation to animal nutrition. J. Dairy Sci. 1991, 74, 3583–3597. [Google Scholar] [CrossRef]
  28. AOAC. Official Methods of Analysis, 19th ed.; Association of Official Analytical Chemists (AOAC): Gaithersburg, MD, USA, 2012. [Google Scholar]
  29. De Wit, C.T. On competition. Versl. Landbouwkd. Onderz. 1960, 66, 1–82. [Google Scholar]
  30. De Wit, C.T.; Van den Bergh, J.P. Competition between herbage plants. Neth. J. Agric. Sci. 1965, 13, 212–221. [Google Scholar]
  31. Shaalan, A.M.; Khalil, H.E.; Nawar, A.I.; El-Salamouni, M.M. Intercropping of grain and fodder maize crops under different nitrogen levels and cutting dates. Alex. Sci. Exch. J. 2015, 36, 373–380. [Google Scholar] [CrossRef]
  32. Salama, H.S.A.; El-Karamity, D.E.; Nawar, A.I. Additive intercropping of wheat, barley, and faba bean with sugar beet: Impact on yield, quality and land use efficiency. Egypt. J. Agron. 2016, 38, 413–430. [Google Scholar] [CrossRef] [Green Version]
  33. SAS Institute, Inc. SAS/STAT User’s Guide, Version 9.4; SAS Institute: Cary, NC, USA, 2012. [Google Scholar]
  34. Winer, B.J. Statistical Principles in Experimental Design, 2nd ed.; McGraw-Hill Kogakusha, Ltd.: Tokyo, Japan, 1971. [Google Scholar]
  35. Atis, I.; Konuskan, O.; Duru, M.; Gozubenli, H.; Yilmaz, S. Effect of harvesting time on yield, composition and forage quality of some forage sorghum cultivars. Int. J. Agric. Biol. 2012, 14, 879–886. [Google Scholar]
  36. Eskandari, H. Intercropping of maize (Zea mays) with cowpea (Vigna sinensis) and mungbean (Vigna radiata): Effect of complementarity of intercrop components on resource consumption, dry matter production and legumes forage quality. J. Basic Appl. Sci. Res. 2012, 2, 355–360. [Google Scholar]
  37. Uher, D.; Horvatić, I.; Jareš, D.; Maćešić, D. Influence of Intercropping Maize with Cowpea on Forage Yield and Quality. Direct Res. J. Agric. Food Sci. 2019, 7, 77–80. [Google Scholar]
  38. Watiki, J.; Fukia, J.; Bauda, S.; Keating, A.B. Radiation interception and growth of maize-cow pea intercrop as affected by maize plant-density and cow pea cultivar. Field. Crops Res. 1993, 35, 123–133. [Google Scholar] [CrossRef]
  39. Ewansiha, S.U.; Kamara, A.Y.; Chiezey, U.F.; Onyibe, J.E. Performance of cowpea grown as an intercrop with maize of different populations. Afr. Crop Sci. J. 2015, 23, 113–122. [Google Scholar]
  40. Li, Y.H.; Shi, D.Y.; Li, G.H.; Zhao, B.; Zhang, J.W.; Liu, P.; Ren, B.; Dong, S.T. Maize/peanut intercropping increases photosynthetic characteristics, 13C-photosynthate distribution, and grain yield of summer maize. J. Integr. Agric. 2019, 18, 2219–2229. [Google Scholar] [CrossRef]
  41. Ahlawat, J.P.; Singh, A.; Sharma, R.P. Water and nitrogen management in wheat-lentil intercropping system under late season condition. Agric. Sci. 1985, 105, 697–701. [Google Scholar] [CrossRef]
  42. Li, L.; Sun, J.; Zhang, F.; Guo, T.; Bao, X.; Smith, F.A.; Smith, S.E. Root distribution and interactions between intercropped species. Oecologia 2006, 147, 280–290. [Google Scholar] [CrossRef]
  43. Zhang, G.G.; Zhang, C.Y.; Yang, Z.B.; Dong, S.T. Root distribution and N acquisition in an alfalfa and corn intercropping system. J. Agric. Sci. 2013, 5, 128–142. [Google Scholar] [CrossRef]
  44. Carr, P.M.; Martins, G.B.; Caton, J.S.; Poland, W.W. Forage and N yield of barley-pea and oat-pea intercrops. Agron. J. 1998, 90, 79–84. [Google Scholar] [CrossRef]
  45. Carruthers, K.; Prithiviraj, B.; Cloutler, O.F.D.; Martin, R.C.; Smith, D.L. Intercropping corn with soybean, lupin and forages: Yield component responses. Eur. J. Agron. 2000, 12, 103–115. [Google Scholar] [CrossRef]
  46. Geren, H.; Avcioglu, R.; Soya, H.; Kir, B. Intercropping of corn with cowpea and bean: Biomass yield and silage quality. Afr. J. Biotechnol. 2008, 7, 4100–4104. [Google Scholar]
  47. Smith, S. Growing Corn with Companion Crop Legumes for High Protein Silage. In Greenbook Energy and Sustainable Agriculture Program; Minnesota Department of Agriculture: St. Paul, MI, USA, 2000; pp. 68–70. [Google Scholar]
  48. Kumar, B.; Tiwana, U.S.; Singh, A.; Ram, H. Productivity and quality of intercropped maize (Zea mays L.) + cowpea [Vigna unguiculata (L.) Walp.] fodder as influenced by nitrogen and phosphorus levels. Range Manag. Agrofor. 2014, 35, 263–267. [Google Scholar]
  49. Maitra, S.; Hossain, A.; Brestic, M.; Skalicky, M.; Ondrisik, P.; Gitari, H.; Brahmachari, K.; Shankar, T.; Bhadra, P.; Palai, J.B.; et al. Intercropping—A Low Input Agricultural Strategy for Food and Environmental Security. Agronomy 2021, 11, 343. [Google Scholar] [CrossRef]
  50. Malhi, S.S.; Zentner, R.P.; Heier, K. Effectiveness of alfalfa in reducing fertilizer N input for optimum forage yield, protein concentration, returns and energy performance of bromegrass-alfalfa mixtures. Nutr. Cycl. Agroecosys. 2002, 62, 219–227. [Google Scholar] [CrossRef]
  51. Nadeem, M.A.; Iqbal, Z.; Ayub, M.; Mubeen, K.; Ibrahim, M. Effect of nitrogen application on forage yield and quality of maize sown alone and in mixture with legumes. Pak. J. Life Soc. Sci. 2009, 7, 161–167. [Google Scholar]
  52. Walsh, O.; Raun, W.; Klatt, A.; Solie, J. Effect of delayed nitrogen fertilization on maize (Zea mays L.) grain yields and nitrogen use efficiency. J. Plant Nutr. 2012, 35, 538–555. [Google Scholar] [CrossRef] [Green Version]
  53. Mueller, S.M.; Camberato, J.J.; Messina, C.; Shanahan, J.; Zhang, H.; Vyn, T.J. Late-split nitrogen applications increased maize plant nitrogen recovery but not yield under moderate to high nitrogen rates. Agron. J. 2017, 109, 2689–2699. [Google Scholar] [CrossRef] [Green Version]
  54. Dar, J.S.; Pushpa, M.I.A.R.; Abbassi, Z.A.; Magsi, A.G. 69. Effect of starter nitrogen on yield and yield components of chickpea (Cicer arietinum L.) at Dokri, Larkana. PAB Pure Appl. Biol. 2021, 5, 1296–1303. [Google Scholar] [CrossRef]
  55. Dogra, R.C.; Dudeja, S.S. Fertilizer N and nitrogen fixation in legume-Rhizobium symbiosis. Ann. Biol. 1993, 9, 149–164. [Google Scholar]
  56. Willey, R.W.; Osiru, D.S.O. Studies on mixtures of maize and beans (Phasrolus vulgaris) with particular reference to plant population. J. Agric. Sci. 1972, 79, 519–529. [Google Scholar] [CrossRef]
  57. Mead, R.; Willey, R.W. The concept of a “land equivalent ratio” and advantages in yields from intercropping. Exp. Agric. 1980, 16, 217–228. [Google Scholar] [CrossRef] [Green Version]
  58. Spitters, C.J.T. Competition Effects within Mixed Stands. In Opportunities for Increasing Crop Yields; Hurd, R.G., Biscoe, P.V., Dennis, C., Eds.; The Pitman Publ.: London, UK, 1980; pp. 219–231. [Google Scholar]
  59. Nawar, A.I.; Salama, H.S.A.; Shaalan, A.M.; Khalil, H.E. Land Equivalent Ratio Versus Dry Matter Equivalent Ratio: Adequacy for additive intercropping. In Proceedings of the 61st Annual conference of the German Society of Agronomy, Kiel, Germany, 8–9 October 2018; Volume 30, pp. 217–218. [Google Scholar]
Figure 1. Average monthly temperature (°C) and humidity (%) of the experimental site during summers 2020 and 2021.
Agronomy 12 00107 g001
Figure 2. Experimental plot design illustrating the three evaluated intercropping patters (IP) of maize and forage cowpea.
Agronomy 12 00107 g002aAgronomy 12 00107 g002b
Figure 3. Experimental plot design illustrating the sowing pattern of the pure maize (100%) and pure forage cowpea (100 and 50%).
Agronomy 12 00107 g003
Table 1. Variations of plant height (cm), stem diameter (mm), number of leaves plants−1, number of ears plot−1, ear length (cm), and grain oil content (g kg−1) of maize crop as affected by the intercropping pattern and nitrogen schedule combined over the two growing seasons.
TreatmentPlant HeightStem DiameterNumber of Leaves Plant−1Number of Ears Plot−1Ear LengthGrain Oil Content
Intercropping Pattern:
IP1278.55 b24.15 a16.19 a18.56 b24.19 a65.28 a
IP2289.45 a21.82 b16.30 a26.44 a25.82 a66.98 a
IP3283.52 ab20.96 b16.04 a21.33 b25.27 a65.54 a
Nitrogen Schedule:
NS1287.70 a22.07 a16.33 a25.33 a24.91 a64.66 a
NS2283.07 a22.04 a16.19 a20.11 b24.90 a66.22 a
NS3280.74 a22.82 a16.00 a20.89 b25.47 a66.93 a
Means followed by different small letter(s) within the same studied factor for each parameter, are significantly different according to the LSD test at 0.05 level of probability.
Table 2. Variations of the ear leaf area (cm2) as affected by the interaction between the intercropping pattern and nitrogen schedule combined over the two growing seasons.
Nitrogen ScheduleIntercropping Pattern
IP1IP2IP3
NS1616.13 bB609.91 aB716.13 aA
NS2601.80 bB691.56 aAB703.88 aA
NS3734.70 aA671.91 aAB634.18 aB
Means followed by different small letter(s) within the same intercropping pattern or different capital letter(s) within the same nitrogen schedule, are significantly different according to the LSD test at 0.05 level of probability.
Table 3. Variations of the total biological yield, ear and grain yields (t ha−1), as affected by the interaction between the intercropping pattern and nitrogen schedule combined over the two growing seasons.
Nitrogen ScheduleTotal Biological YieldEar YieldGrain Yield
Intercropping Pattern
IP1IP2IP3IP1IP2IP3IP1IP2IP3
NS142.30 aA45.33 aA43.91 aA10.78 aB13.79 aA13.17 aA8.14 aB9.48 aA9.07 aA
NS236.50 bB44.61 aA33.40 bB9.65 bB13.47 aA10.14 bB7.00 bB8.95 aA6.27 bB
NS335.83 bB47.86 aA36.52 bB9.19 bB13.38 aA10.32 bB6.30 bB9.04 aA7.14 bB
Means followed by different small letter(s) within the same intercropping pattern or different capital letter(s) within the same nitrogen schedule, are significantly different according to the LSD test at 0.05 level of probability.
Table 4. Variations of the 100-grain weight (g), shelling % and harvest index (%) of maize crop as affected by the intercropping pattern and nitrogen schedule combined over the two growing seasons.
Treatment100-Grain WeightShelling %Harvest Index %
Intercropping Pattern:
IP134.46 b70.51 a17.21 b
IP238.03 a68.43 a21.03 a
IP336.47 a67.84 a19.82 a
Nitrogen Schedule:
NS138.02 a70.14 a21.10 a
NS235.68 b68.07 a18.30 b
NS335.26 b68.56 a18.66 b
Means followed by different small letter(s) within the same studied factor for each parameter, are significantly different according to the LSD test at 0.05 level of probability.
Table 5. Variations of the 1st cut fresh and dry forage yields (t ha−1), neutral detergent fiber (NDF), acid detergent fiber (ADF) and acid detergent lignin (ADL), crude protein (CP), and non-fiber carbohydrates (NFC) contents (g kg−1) of forage cowpea as affected by the intercropping pattern and nitrogen schedule combined over the two growing seasons.
FFYDFYNDFADFADLCPNFC
Intercropping Pattern:
IP18.28 c1.03 c410.68 a266.08 a47.37 a145.06 b277.09 b
IP29.76 b1.15 b409.11 a256.67 a48.31 a157.22 a273.67 b
IP310.61 a1.27 a401.42 a255.69 a46.37 a159.49 a286.26 a
Nitrogen Schedule:
NS19.48 b 1.11 b 399.58 a251.01 a44.55 a160.87 a281.56 a
NS28.38 c1.03 b411.21 a262.64 a48.45 a150.96 b277.83 b
NS310.79 a1.31 a410.42 a264.80 a49.05 a149.94 b276.63 b
Means followed by different small letter(s) within the same studied factor for each parameter, are significantly different according to the LSD test at 0.05 level of probability.
Table 6. Variations of the 2nd cut fresh and dry forage yields (t ha−1), neutral detergent fiber (NDF), acid detergent fiber (ADF) and acid detergent lignin (ADL), crude protein (CP), and non-fiber carbohydrates (NFC) contents (g kg−1) of forage cowpea as affected by the intercropping pattern and nitrogen schedule combined over the two growing seasons.
FFYDFYNDFADFADLCPNFC
Intercropping Pattern:
IP12.45 b0.32 b474.58 a 322.00 a55.16 a146.12 b173.28 b
IP22.45 b0.31 b472.70 a324.26 a52.87 a154.53 a176.02 b
IP33.41 a0.45 a465.29 a318.78 a52.46 a157.96 a207.72 a
Nitrogen Schedule:
NS12.55 b0.33 b456.98 a 304.32 a 51.94 a 156.91 a196.86 a
NS22.60 b0.34 b474.12 a326.33 a53.04 a149.70 b181.78 b
NS33.16 a0.42 a481.47 a334.40 a55.51 a148.98 b178.38 b
Means followed by different small letter(s) within the same studied factor for each parameter, are significantly different according to the LSD test at 0.05 level of probability.
Table 7. Variations of the 3rd cut fresh and dry forage yields (kg ha−1), neutral detergent fiber (NDF), acid detergent fiber (ADF) and acid detergent lignin (ADL), crude protein (CP), and non-fiber carbohydrates (NFC) contents (g kg−1) of forage cowpea as affected by the intercropping pattern and nitrogen schedule combined over the two growing seasons.
FFYDFYNDFADFADLCPNFC
Intercropping Pattern:
IP11.27 b0.16 b491.32 a354.21 a58.09 a142.53 b166.47 b
IP21.33 b0.17 b500.86 a349.37 a56.81 a149.23 a166.20 b
IP31.86 a0.24 a472.03 a347.02 a55.77 a148.91 a178.38 a
Nitrogen Schedule:
NS11.81 a0.23 a462.38 a338.89 a52.93 a151.90 a182.80 a
NS21.34 b0.17 b483.09 a349.03 a56.89 a146.48 b163.00 b
NS31.31 b0.17 b518.04 a362.68 a60.85 a142.29 b165.25 b
Means followed by different small letter(s) within the same studied factor for each parameter, are significantly different according to the LSD test at 0.05 level of probability.
Table 8. Variations of annual fresh and dry forage yields (kg ha−1) of forage cowpea as affected by the intercropping pattern and nitrogen schedule combined over the two growing seasons.
TreatmentAnnual FFYAnnual DFY
Intercropping Pattern:
IP112.00 b1.51 b
IP213.54 ab1.63 b
IP315.88 a1.96 a
Nitrogen Schedule:
NS113.84 ab1.67 b
NS212.32 b1.54 b
NS315.26 a1.90 a
Means followed by different small letter(s) within the same studied factor for each parameter, are significantly different according to the LSD test at 0.05 level of probability.
Table 9. Relative yields of the main maize crop (RYM) and the companion forage cowpea crop based on 50 and 100% pure cowpea stands (RYC50 and RYC100), land equivalent ratio (LER), and dry matter equivalent ratio (DMER) for the evaluated intercropping pattern and nitrogen schedule.
Intercropping PatternNitrogen ScheduleRYMRYC50RYC100LER50LER100DMER
IP1NS10.940.300.191.231.131.14
NS20.810.320.211.121.021.00
NS30.790.380.251.181.040.96
IP2NS10.970.430.281.401.261.31
NS20.740.400.261.141.000.96
NS30.810.510.341.321.151.12
IP3NS11.000.330.221.341.221.31
NS20.990.400.271.391.251.27
NS31.060.400.261.451.321.28
Publisher’s Note: MDPI stays neutral with regard to jurisdictional claims in published maps and institutional affiliations.

