1. Introduction
Modern plant production systems depend on fossil energy use in the form of direct energy input (fuel and electricity used on the farm) and indirect energy input (energy required for the manufacture of fertilisers, plant protection agents, and machines) [
1,
2,
3,
4]. Along the production process, nearly all field operations (soil tillage, sowing, fertilising, crop protection, harvest, transport) require fossil energy. The energy input in agricultural production systems is therefore an indicator for production intensity [
1,
5].
In spite of a significant potential for fossil fuel substitution by bioenergy [
6,
7,
8], the production of bioenergy is linked to the use of fossil energy as well as the emission of greenhouse gases [
9]. Consequently, energy input, energy balance, and energy-use efficiency are commonly used as indicators to describe the ecological sustainability of agricultural production processes [
3,
10,
11,
12,
13]. The importance of energy balances for the sustainability assessment of crop production systems is the result of the complex interactions of fossil energy input, crop yield as well as economic and environmental effects.
In order to analyse, evaluate, and optimise the energy efficiency of plant production systems, methods of energy balancing have been developed and applied [
1,
14,
15]. An energetic process analysis is a mechanistic approach, attempting to trace all fossil energy inputs into an agricultural system based on physical matter flows. It is suitable for calculating energy balances, analysing energy-use efficiency, and improving farming systems [
1,
3,
16,
17]. There are several energy indicators of plant production systems such as (a) fossil energy input, (b) energy output, (c) net energy output (output-input), and (d) energy-use efficiency (output/input). These indicators can be used to examine the energy balance of different crop production systems, scaling from crop and crop rotation level [
3,
13,
18] to farm, value chain (food production) [
19], and process chain (bioenergy production) [
10,
12,
20] levels. In order to conserve finite resources and decrease greenhouse gas emissions, lower energy consumptions and higher energy-use efficiencies are necessary in all agricultural systems.
The main objective of the cultivation of energy crops is the production of renewable energy (e.g., electric power, fuel, heat, biomethane), the substitution of fossil energy resources, and a substantial contribution to energy supply [
21,
22]. The energy-use efficiency of biomass production exerts a decisive influence on the energy-use efficiency of the whole bioenergy value chain [
15,
23]. Depending on the cultivated crops, production systems, site and climatic conditions, and yield potential, the energy-use efficiency of bioenergy crops ranges from 2 to 45 [
5,
15,
24,
25,
26,
27,
28,
29,
30] and can be even higher in agroforestry systems [
31].
Differing energy crops and site-specific yield potentials have a vast influence on energy balances of biomass production. There is still dissent regarding the favourability of energy crops produced in intensive systems as opposed to extensive systems. Some authors argue that extensive low-input systems (e.g., extensive grassland) can achieve high energy-use efficiencies, albeit with low energy outputs [
32,
33].
Currently, maize is the most important energy crop for the global biofuel production [
34]. Furthermore, maize is the most important crop for biomethane production in Germany based on its high yield potential, high fermentability, storability, perfected technology, and low production cost [
35]. However, there is concern regarding the possibly negative effects of an increase in energy maize production area on soil erosion [
36], soil organic carbon stocks [
37], biodiversity [
38], nitrogen losses (e.g., nitrate leaching, nitrous oxide emissions) [
39], and landscape aesthetics [
40]. This raises the question of whether there are alternative crops that achieve net energy outputs and energy-use efficiencies comparable to maize under varying site conditions.
Previous studies of energy crops in Germany focused on comparisons of yield levels of bioenergy crops and crop rotations [
41]. So far, there have been few studies conducting systematic analyses of the energy-use efficiency and net energy output of energy crops under differentiated site conditions. For this paper, we assessed the detailed energy balances of maize (reference crop) and five other annual energy crops and crop combinations (consisting of catch crops and main crops) based on four-year experimental data obtained in field experiments at three sites in southern Germany (Bavaria) with differing soil and climate conditions.
The energy balances were conducted as process analyses. The indicators used for the assessment of energy crops, crop combinations, and crop management were energy input, energy output, net energy output, and energy-use efficiency. Based on these data, the following research questions were addressed: (A) Are there crops and crop combinations with a higher net energy output and/or energy-use efficiency compared to maize? (B) What is the impact of differentiated soil and climate conditions on energy-use efficiency and the ranking of crops/crop combinations? (C) What are causes of differences in crop energy-use efficiency and which factors influence energy input and output? (D) How can energy-use efficiency be improved further?
The results of this paper will contribute to a better understanding of the energy-use efficiency of energy cropping systems by supplying an extensive database (three sites × four years × six varieties) and an exhaustive and detailed energy balance based on a process analysis, allowing for the examination and evaluation of biomass production systems. In addition, the results of this paper aim to support recommendations for farmers and political decision-makers regarding the improvement in energy crop production.
3. Results
3.1. Energy Input
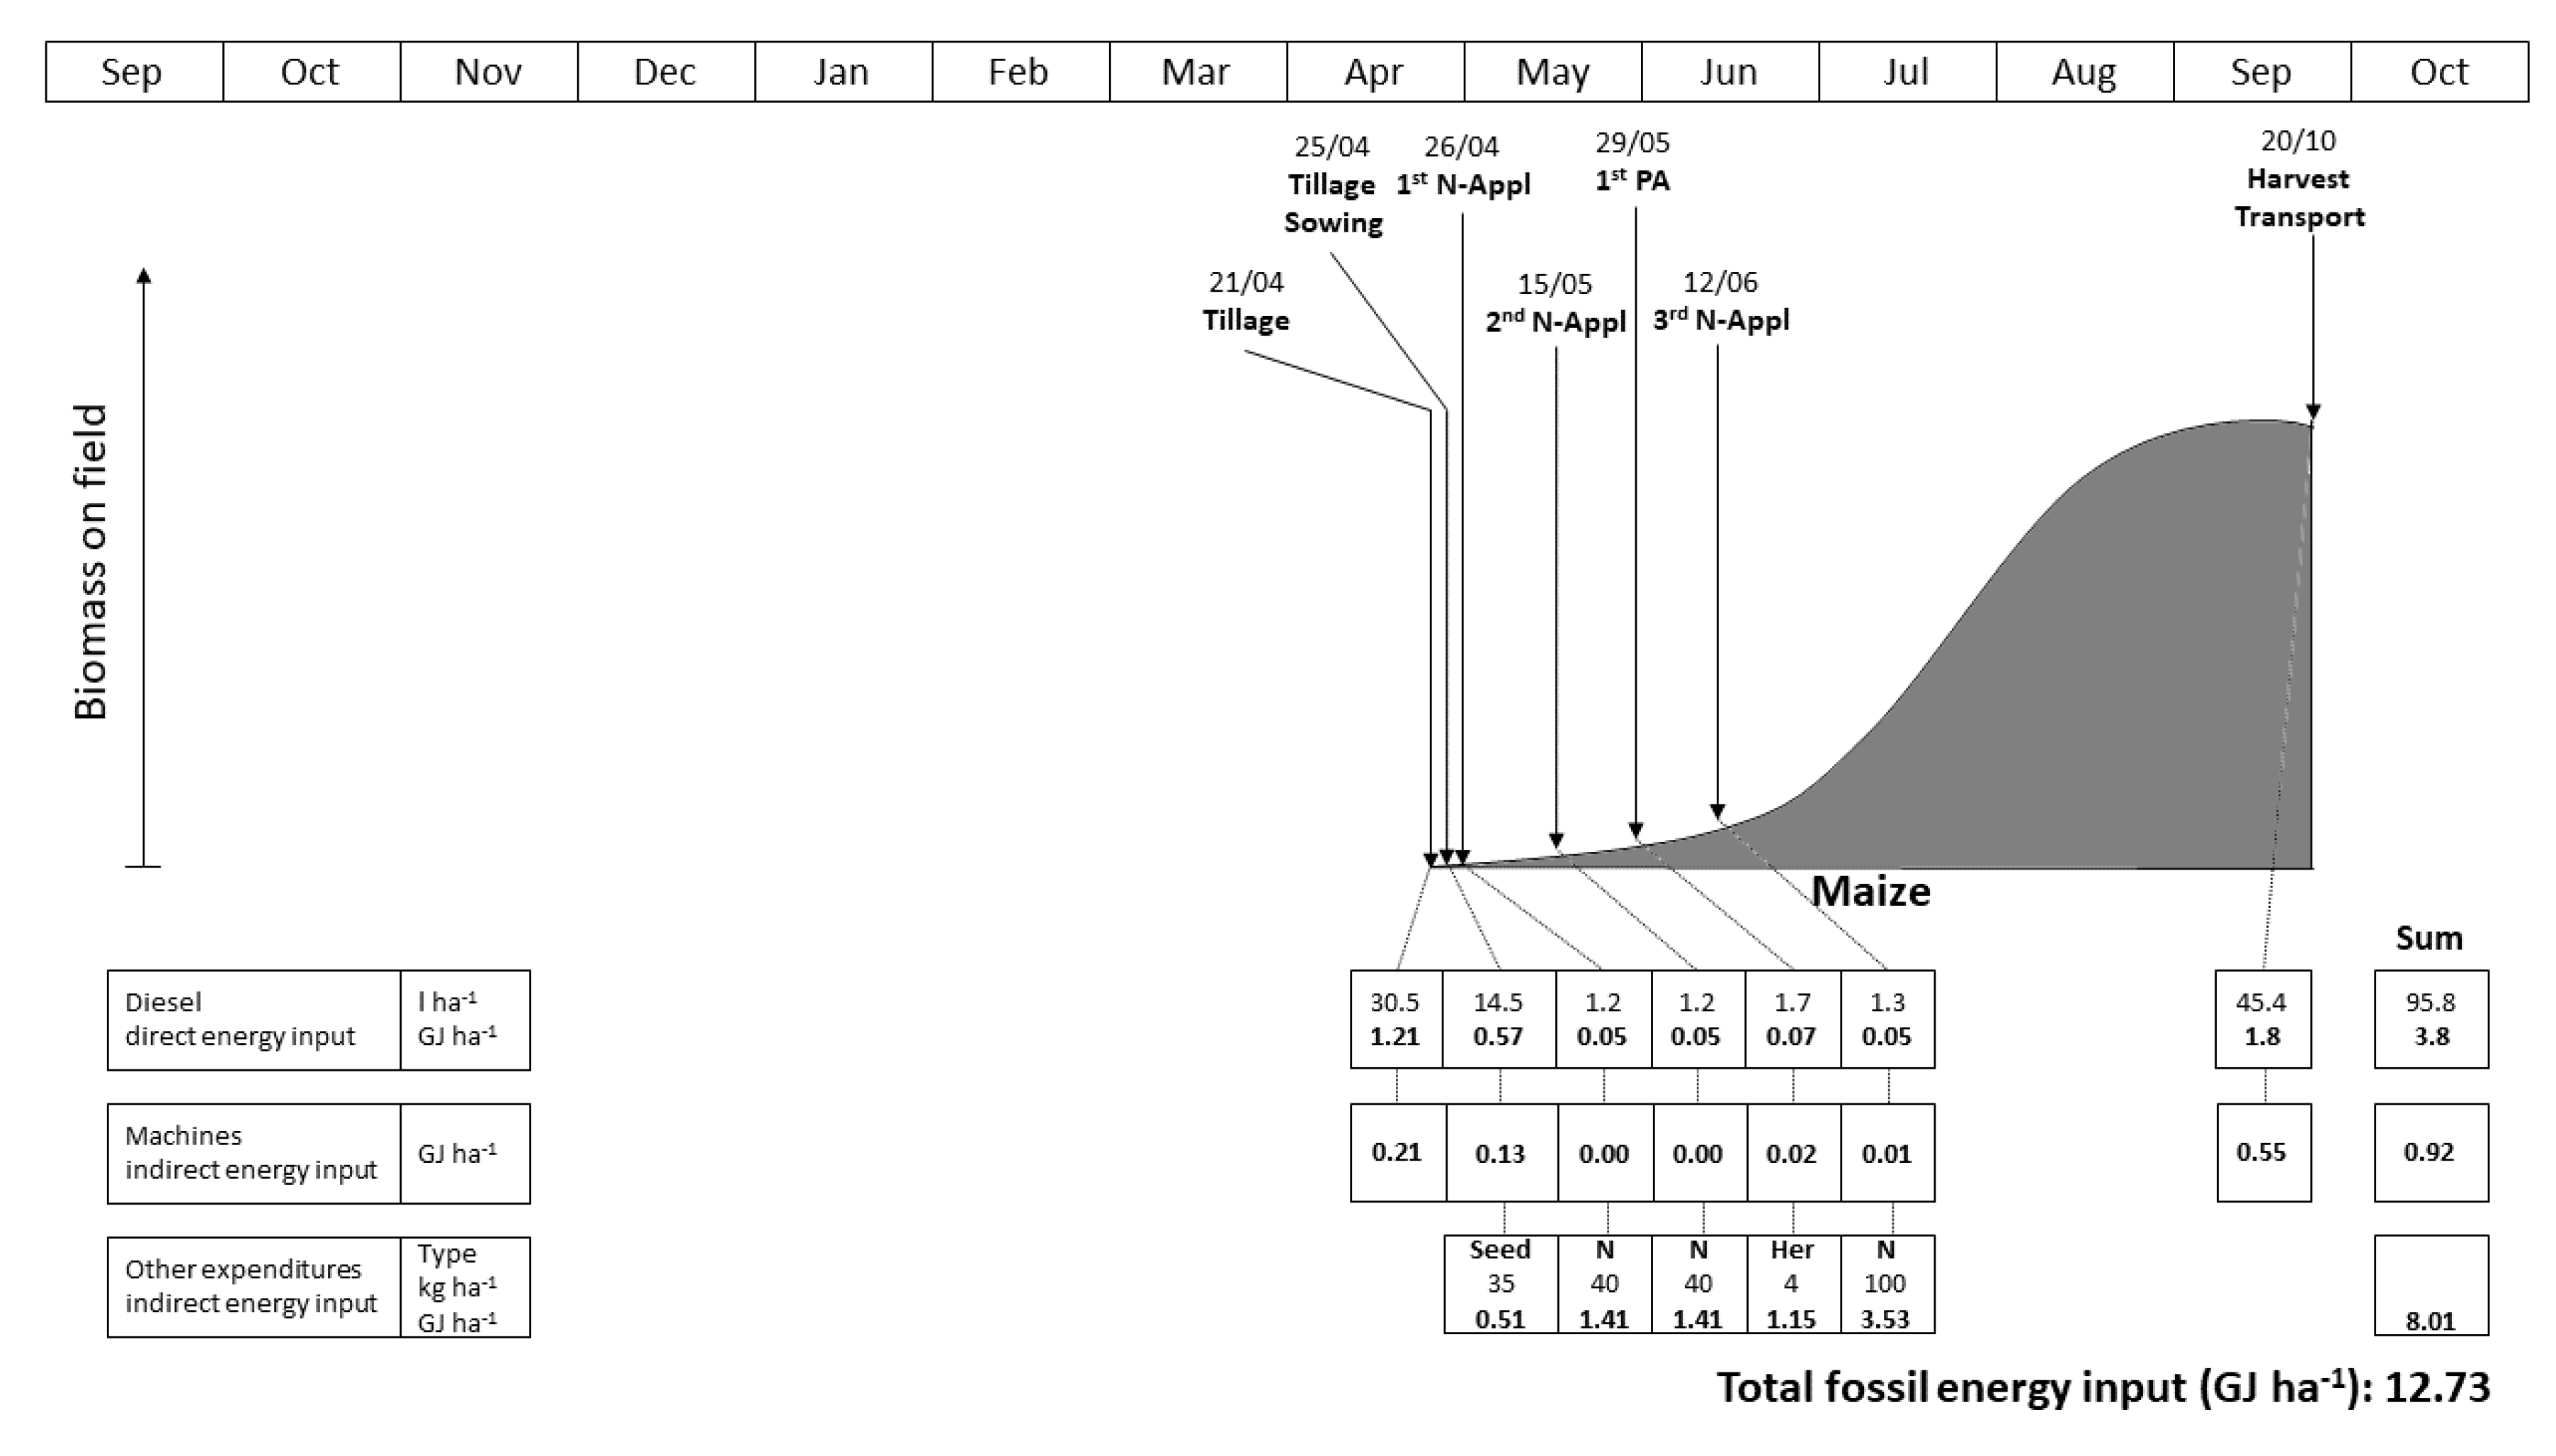
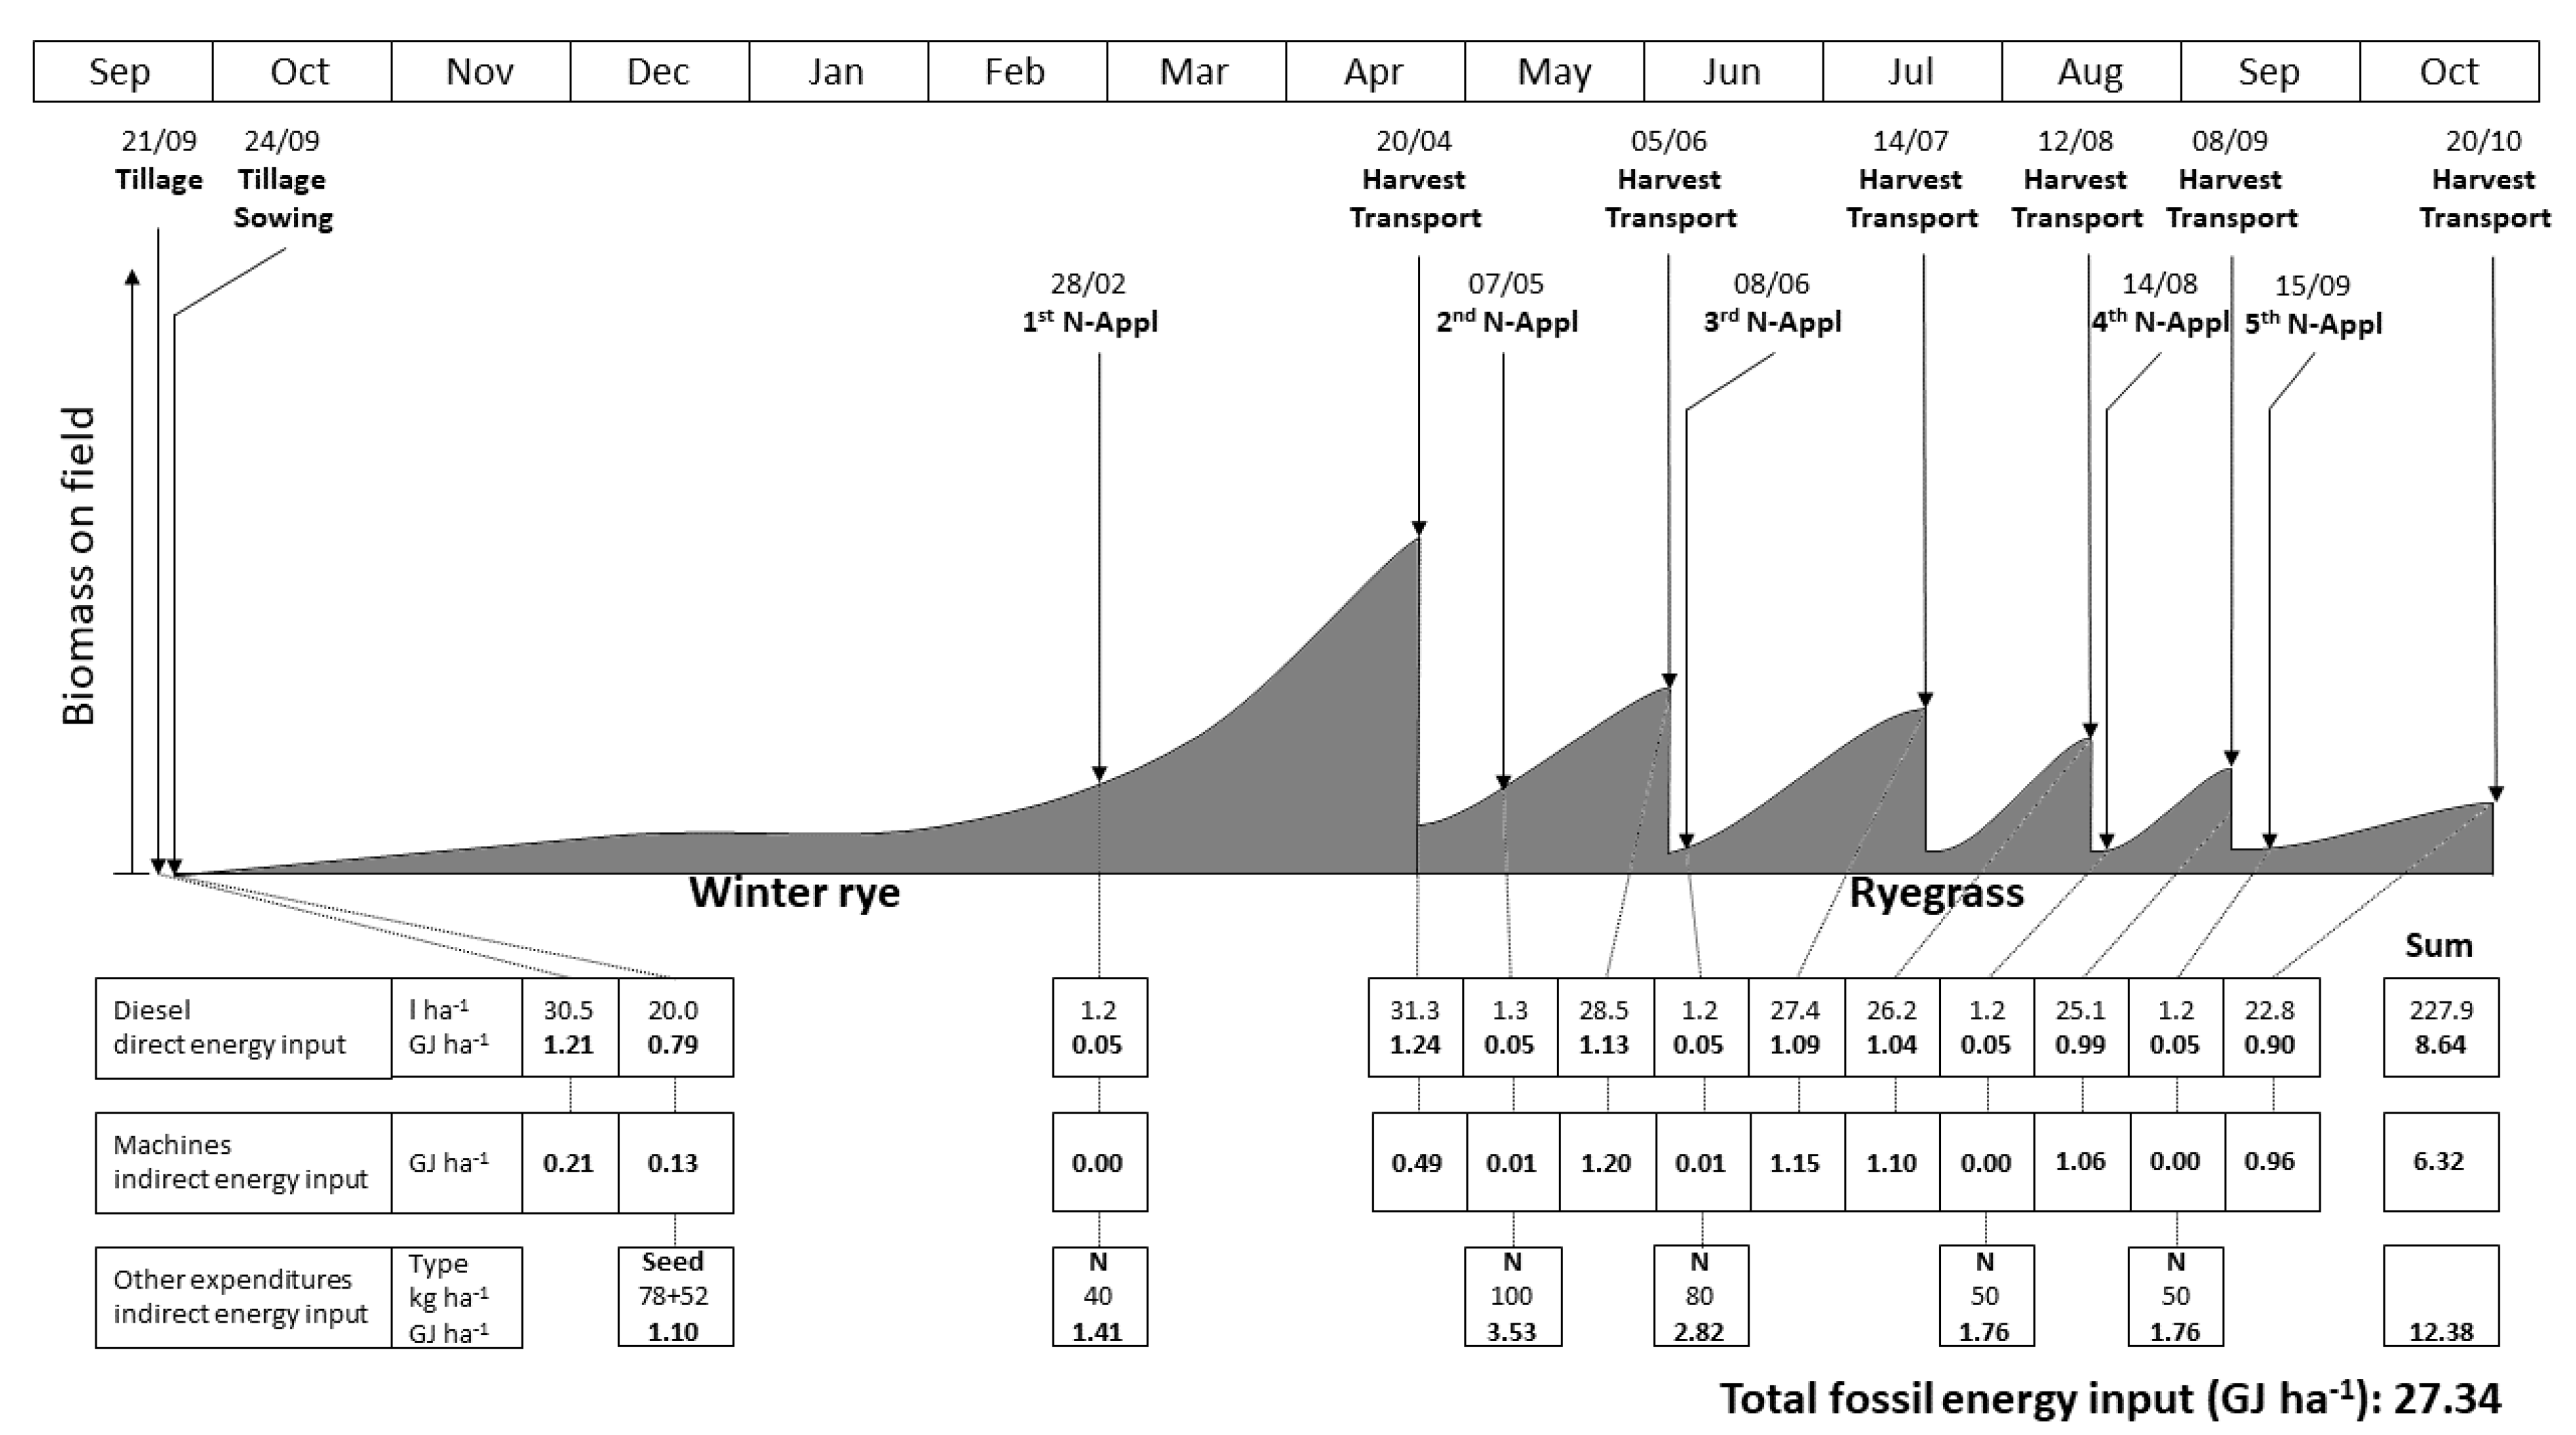
Figure 1 and
Figure 2 show on the basis of maize and winter rye with undersown ryegrass,
The energy crops examined in this study were distinguished by vastly different energy inputs, relating to site conditions (yield potential) and production processes (tillage, fertilisation, pesticide use) (
Table 4). The energy inputs of energy crops at the three field experiments differed due to site-specific management. Nitrogen and energy inputs reflect characteristic production intensities for each crop, aiming to realise site-specific yield potentials.
The reference crop maize (without catch crop) is characterised by a relatively low number of field operations in the spring and one harvest in the autumn (
Figure 1). The use of plant protection agents was low, consisting of only one herbicide application. Mineral nitrogen was used moderately (134–168 kg ha
−1). This resulted in an energy input of only 10.1–12.4 GJ ha
−1 (
Table 4).
In contrast, the combination of winter rye (catch crop) and undersown ryegrass (main crop) led to a continued soil cover and biomass formation in the autumn and winter months (
Figure 2). Field operations started in September and ended in October of the following year. All in all, five mineral nitrogen applications (167–343 kg ha
−1) and six harvests were performed. This resulted in an extremely high energy input (14.8–24.8 GJ ha
−1).
In general, the energy input was substantially increased by the addition of catch crops (additional field operations, additional resource inputs), amounting to an additional fossil energy use of 5.3–11.3 GJ ha−1. The energy input of the catch crops also increased with longer vegetation periods and biomass production, requiring higher N inputs. The energy input of some catch crops surpassed the energy input of main crops (e.g., winter barley (8.5–10.7 GJ ha−1)/sorghum (7.6–8.4 GJ ha−1)).
The energy input of maize (reference crop) was equal or higher compared to the energy input of maize as the main crop with a previous catch crop (
Table 4) because of their different yield potential and fertilisation levels. Sorghum as the main crop required a lower energy input (7.3–8.6 GJ ha
−1) compared to maize (with previous catch crop) because of the lower nitrogen fertilisation (100–120 kg ha
−1) and the lower yield potential.
Across all sites and crops, mineral fertiliser had the highest share of total energy input (34–50%, = 44%), followed by fuel (direct energy, 19–41%, = 32%). Compared to these two parameters, seeds, machines, and pesticides (where used) amounted to only a small share of the total energy input each (except for winter rye, where the energy input for the supply of machines reached or surpassed the direct energy), totalling 15–31% of the total energy input with a mean of 23%.
3.2. Crop Yields
The dry matter yields of the energy crops varied substantially, depending on the site and weather conditions (
Table 5). Maize (without previous catch crop, reference) mean dry matter yield varied between 19.9 Mg ha
−1 (Ansbach) and 27.5 Mg ha
−1 (Straubing) across all years. Dry matter yields differed significantly from year to year. In years with favourable weather conditions, maize dry matter yields even surpassed 30 Mg ha
−1 (Straubing). When combined with a catch crop, maize yield was lower at all sites and in all years. Due to different growing times of the catch crops, dry matter yield of maize after barley was significantly higher than after rye. While maize was the highest-yielding main crop at all sites, the dry matter yield of the other main crops varied strongly. At the Freising and Ansbach sites, mean sorghum yield was significantly lower than maize yield even with the same catch crop (9.5 Mg ha
−1, 10.2 Mg ha
−1, resp.), whereas at the Straubing site, sorghum yield was at the same level with maize (13.2 Mg ha
−1). Ryegrass was yielded highest at the Freising site (14.4 Mg ha
−1), followed by Straubing (10.2 Mg ha
−1), and Ansbach (6.6 Mg ha
−1). Winter triticale yielded between 12.6 Mg ha
−1 (Ansbach) and 15.6 Mg ha
−1 (Freising), ranging slightly lower than maize except at the Straubing site, where yields were comparable to maize with barley as the catch crop.
The mean catch crop yield was lower than the mean main crop yield in all variants except for sorghum (9.5 Mg ha−1) after winter barley (10.8 Mg ha−1) at the Freising site and ryegrass (6.6 Mg ha−1) after winter rye (7.1 Mg ha−1) at the Straubing site. Catch crop yield increased distinctly with later harvests, with winter barley yielding significantly more than winter rye due to the longer growing time.
The combination of winter rye and maize outperformed maize without a catch crop at every site. At the Ansbach site, the combination of winter barley and maize yielded was higher than maize. The yields at the Ansbach site showed a preference of cereals with low overall yields of ryegrass. In contrast, ryegrass yield was higher than sorghum at the Freising site.
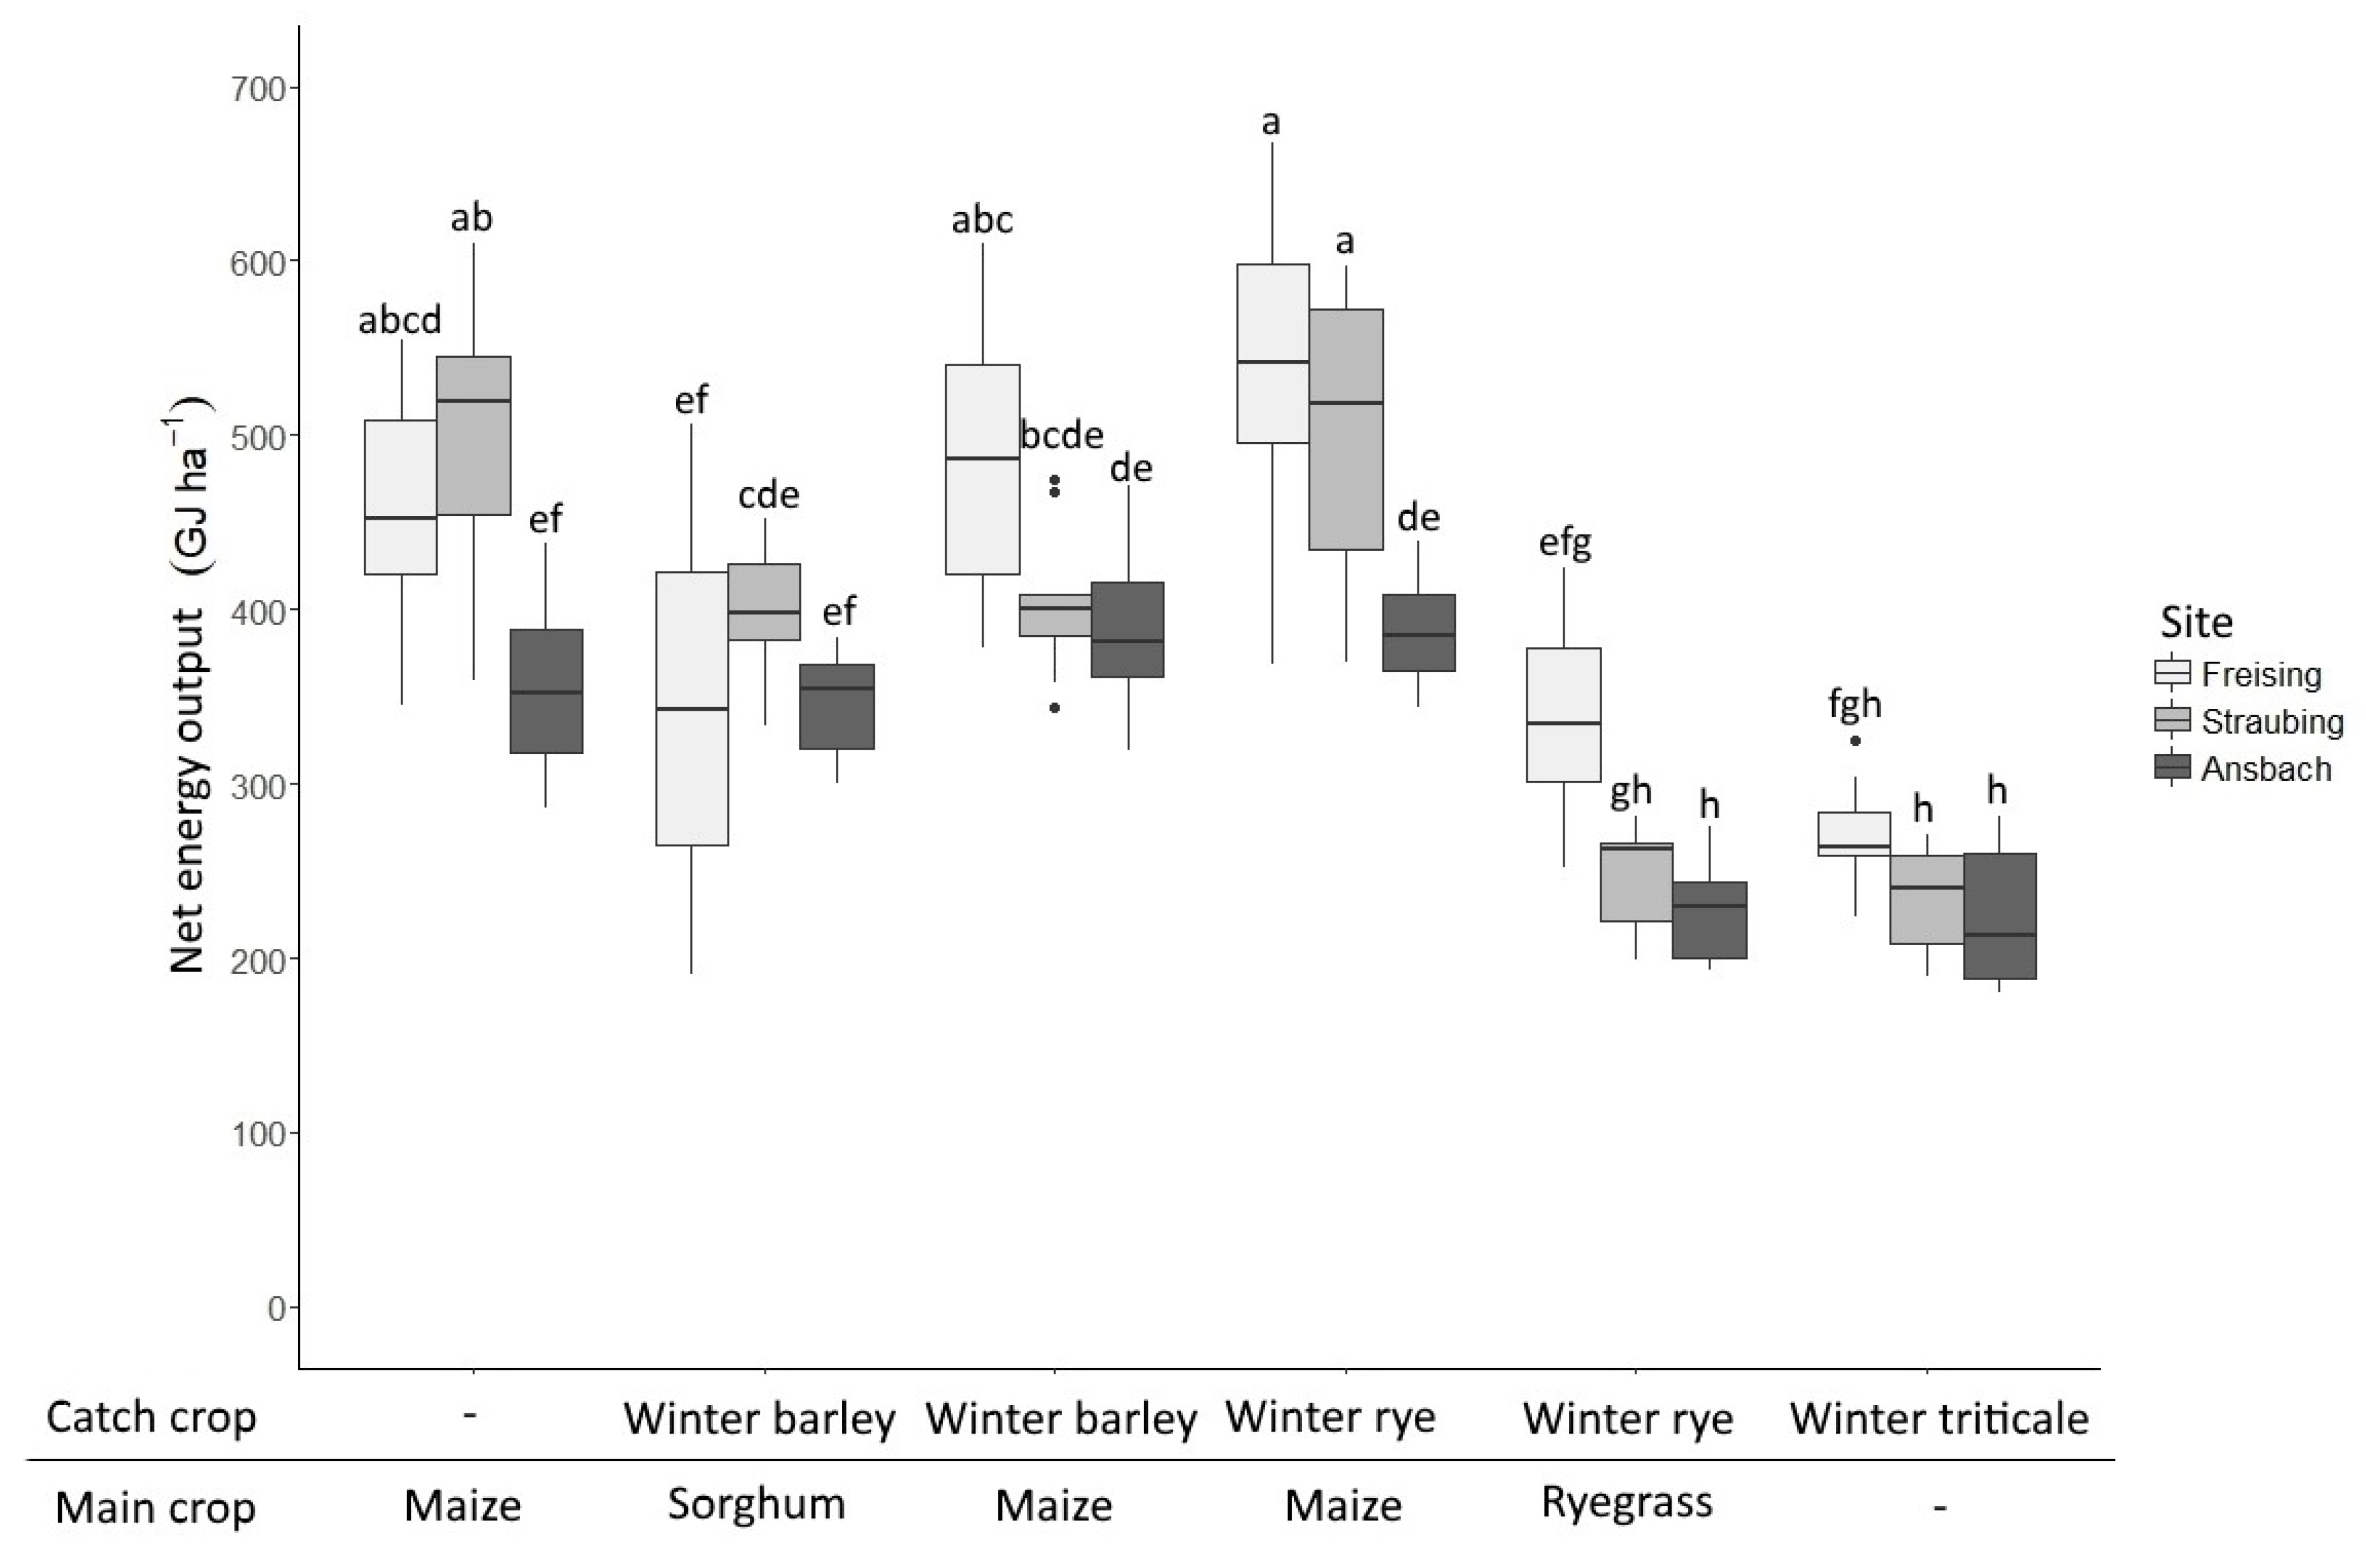
3.3. Net Energy Output
The highest net energy output of the main crops was found at all sites in maize without a catch crop, ranging from 354.2 GJ ha
−1 (Ansbach) to 493.4 GJ ha
−1 (Straubing) (
Table 6,
Figure 3). At the Freising site, sorghum (159.8 GJ ha
−1) had the lowest net energy output of all the main crops, while at the other sites, sorghum had moderate net energy outputs (Ansbach, 176.1 GJ ha
−1) or reached the level of maize after the catch crop (Straubing, 229.4 GJ ha
−1). In contrast, ryegrass generated the lowest net energy output at the Straubing (156.2 GJ ha
−1) and Ansbach (104.9 GJ ha
−1) sites. Winter triticale showed medium net energy outputs at all sites.
The net energy output of the catch crops correlated with their dry matter yields, winter barley (with longer growing time) generating higher net energy outputs compared to winter rye. The highest total net energy output was generated by the combination of maize with early harvested winter rye, ranging from 501.7 GJ ha−1 (Straubing) to 537.8 GJ ha−1 (Freising), except for Ansbach, where winter barley and maize achieved the highest net energy output (389.1 GJ ha−1, without significant differences to winter rye and maize). The results indicate large differences in energy binding potential depending on crop and site.
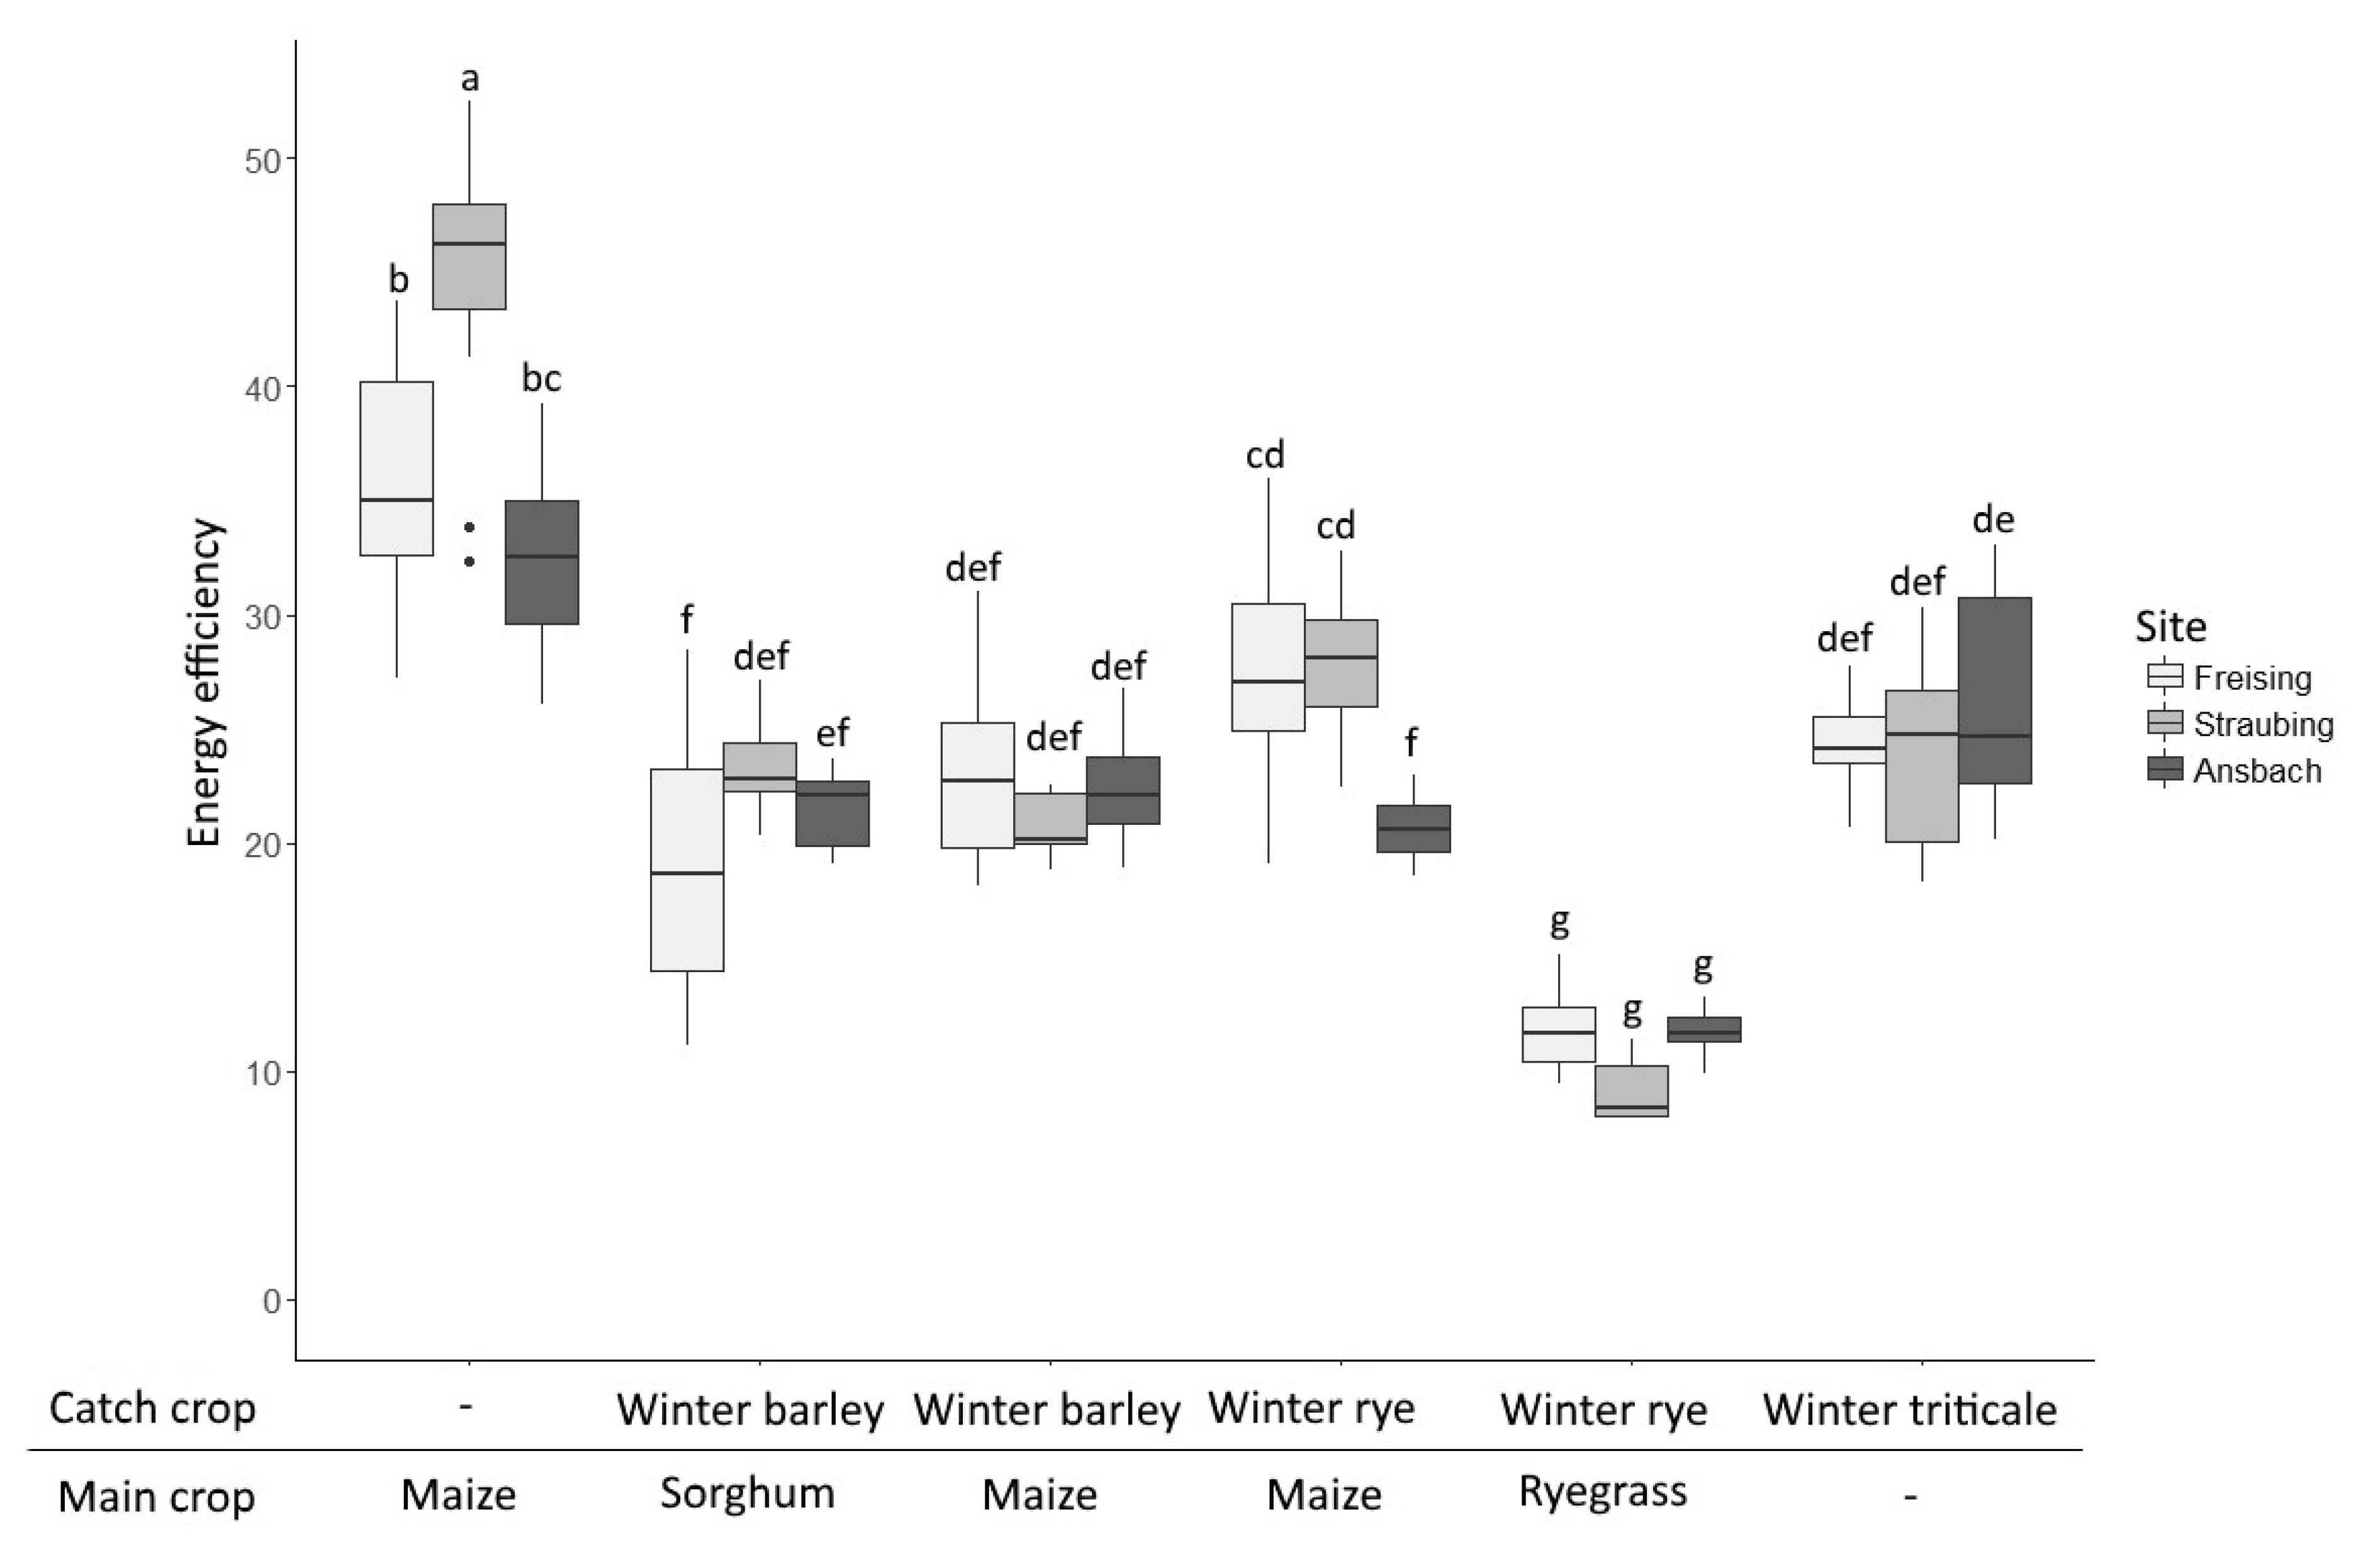
3.4. Energy Efficiency
The highest energy efficiency of the analysed main crops was achieved by maize without a catch crop, ranging from 32.4 (Ansbach) to 44.7 (Straubing) (
Table 6,
Figure 4). At the Freising and Straubing sites, maize after winter rye or winter barley as the catch crop had the second-highest energy efficiency (28.9–34.4 and 24.4–39.7, resp.); at the Ansbach site, winter triticale (26.1) showed no significant differences in energy efficiency to a catch crop maize combination (24.9–25.0). The lowest energy efficiency of the main crops was found in ryegrass, with energy efficiencies between 7.6 (Straubing) and 10.3 (Freising). Sorghum showed a strong site-dependency of energy efficiency, while at the Straubing site, sorghum surpassed maize after winter barley in energy efficiency and was on the same level at the Ansbach site, which showed the second-lowest energy efficiency at the Freising site.
At all sites, no combination of crops could surpass the energy efficiency of maize. Due to the low energy efficiency of the ryegrass, the combination of winter rye and ryegrass consistently showed the lowest energy efficiency across locations. Due to relatively high energy output and moderate energy input, winter triticale showed energy efficiencies near the combinations of the catch crop and maize or surpassed them.
4. Discussion
4.1. Methodology
This paper was based on 4-year field experiments, conducted at three sites and resulting in an extensive dataset consisting of catch crop/main crop combinations and representing important energy crops for biomass production in Germany, Western, and Central Europe. In this paper, the results of five catch crop/main crop combinations are presented compared to the reference crop maize.
The field trials included 28 variants in total, consisting of the variants presented in this paper as well as variants with other combinations of the examined crops with a wider range of harvest dates and the crops sunflower, oats, and clover grass. A comprehensive description of the variants is already available [
30]. The complete dataset (experimental data of all variants) will be published shortly in an appropriate repository.
For experimental reasons, the field trials were fertilised with mineral nitrogen. In biogas systems, nutrients are mainly supplied by biogas slurry, supplemented by mineral fertiliser. We used mineral nitrogen for a more precise nitrogen application in plot-scale trials due to the high variability of nutrient content of biogas slurry and in order to reduce ammonia losses [
52,
53]. Furthermore, due to the high number of nitrogen applications, we ensured compliance with the scheduled application dates.
Thus, the impact of organic fertiliser use has to be considered when interpreting energy input, energy output, and their derived parameters net energy output and energy efficiency. In reality, the energy efficiencies would have been significantly higher. Nitrogen applied via biogas slurry substitutes mineral nitrogen, leading to a reduction in energy input (the production of mineral nitrogen requires high amounts of energy use [
54]). On the other hand, organic fertiliser application requires substantially more energy use than mineral nitrogen application due to the higher mass of organic fertilisers (water content). In addition, there are challenges in the quantification of the energy value of biogas slurry. Energy equivalents for biogas slurry range from 0 (considering biogas slurry as undesirable waste) to 48 MJ kg
−1 (substitutional value considering nutrient contents and efficacy) [
55].
The yields of field experiments tend to outperform the yields on-farm significantly [
56,
57], restricting the transferability of our results to on-farm conditions somewhat. This difference is caused by several interacting factors (e.g., use of specialised experimental technology or use of separate harvest sub-plots).
In this study, we focused on energy crops cultivated large scale for in Germany. There have been several studies analysing relatively “new” crops for biomass production in recent years such as
Silphium perfoliatum,
Miscanthus,
Agropyron elongatum, or perennial wild crop mixtures [
58]. Although there are potential advantages compared to established crops such as continuous soil coverage, reduced tillage, and reduced pesticide use, the disadvantages (e.g., more difficult cultivation, higher cost, lower yield stability) prevent a widespread cultivation in practice. Due to higher lignin content, the fermentability of biomass from wild crop mixtures is significantly lower compared to maize [
58]. Thus, we decided not to include these crops in our experiments.
When conducting energy balance studies, utmost care has to go toward the definition of production processes such as intensity of tillage, number of harvests (e.g., for ryegrass), and other management parameters because of the strong influence on the energy input (and thus net energy output and energy efficiency). In this study, we attempted to simulate common practice for all of the crops and crop combinations represented in the field experiments. Thus, for the purpose of energy balancing, all management was calculated as if conducted on-farm with customary machines and equipment, even if plot-sized equipment was used in the trials. We tried to compromise between practicability in the field experiments and energy balances more appropriate to on-farm conditions.
The fundamental methodology for assessing the energy balance of crop production systems was developed decades ago [
59], but is subject to constant advancement (e.g., adjustment of energy equivalents to technical innovations and new processes) [
14,
15,
60,
61,
62]. In this study, we used the approach of a process analysis that has been widely utilised for the quantification of energy parameters in crop production systems [
1]. It is important that energy equivalents for direct (use of fossil energy on farm) and indirect (use of fossil energy for the supply of resources such as mineral fertiliser, seeds, pesticides, machines, and equipment [
44]) energy inputs are representative of industry standards in the trial area. As such, we chose energy equivalents representing relatively efficient production processes likely encountered in Western Europe [
47,
49,
54,
63]. The production of resources such as mineral fertilisers and plant protection agents is subject to efficiency improvements (changing energy mix, more renewable energies, more efficient production processes), so that continuous adjustments to energy equivalents used in agricultural energy balance studies are necessary in order to provide accurate results. This implies that the energy efficiency of energy crops will rise, even if yields stagnate or farming systems stay at the same level of efficiency as they are now, due only to higher efficiencies earlier in the production chain, especially the mineral fertiliser production.
4.2. Results
The parameters net energy output and energy efficiency are among the most important criteria for the assessment of bioenergy crops and bioenergy systems, serving as measures for the use efficiency of fossil fuel resources [
5,
26]. Thus, an energy balance can help to identify the optimisation potential of management and crop rotation design. A high net energy output at the crop production level is of extraordinary importance for the energy efficiency of the whole bioenergy process chain because of efficiency losses at every step along the production chain (e.g., energy efficiency of 20:1 at the crop production (field level) descending to 7:1 at the biogas plant level, [
15]).
However, since arable land is finite, the potential for the production of bioenergy is limited, possibly resulting in competition between energy and food production [
6,
7]. Because of the finite arable land and high associated costs (lease rents), an important target of bioenergy production is the maximising of energy recovery per hectare, expressed as high net energy output of the plant biomass. With respect to different cultivated crops, production systems, site conditions, and yield potential, net energy outputs of bioenergy crops range from 50 to 450 GJ ha
−1 [
5,
15,
24,
25,
26,
27,
28,
29,
30], potentially exceeding 500 GJ ha
−1 under optimal experimental conditions. This means that energy efficiency and net energy output are essential target criteria of biomass production systems.
The energy input into a crop production system is an important indicator not only as a basis for derived parameters such as net energy output or energy efficiency, but it can also serve as a measure for the fossil fuel needed for crop production [
59]. Because the energy input determines the CO
2 emissions of a production system, it also has a fundamental impact on the greenhouse gas balance of a farming system.
At all experimental sites, ryegrass demanded the highest energy input (Freising: 24.8 GJ ha−1, Straubing: 23.9 GJ ha−1, Ansbach: 14.8 GJ ha−1) due to the high number of field operations as well as the highest nitrogen fertiliser input. The energy input of maize was less than half of that of ryegrass at the Freising and Straubing sites.
The energy input is defined mainly by the mineral fertiliser input and the number of field operations necessary for the cultivation of a specific crop. Less labour intensive crops tend to require lower energy inputs. For example, maize can be grown in southern Germany with relatively low effort (seven field operations in the production process in our experiment,
Figure 1). In contrast, a combination of winter rye with undersown ryegrass (
Figure 2) required 13 field operations, with higher mineral nitrogen input (see
Table A3 for details on field operations).
Overall, the crops and crop combinations presented in this paper achieved different rankings depending on the results of energy balancing. Using the means of all years across all sites, the rankings were:
Energy input: winter rye/ryegrass > winter barley/maize > winter rye/maize > winter barley/sorghum > maize > winter triticale.
Yields: winter rye/maize > winter barley/maize > maize > winter barley/sorghum > winter rye/ryegrass > winter triticale.
Net energy output: winter rye/maize > maize > winter barley/maize > winter barley/sorghum > winter rye/ryegrass > winter triticale.
Energy efficiency: maize > winter rye/maize > winter triticale > winter barley/maize > winter barley/sorghum > winter rye/ryegrass.
Although there have been distinct site-dependent differences in the performance of energy crops, the best energy crops and crop combinations (maize, winter triticale, and sorghum) showed the best energy efficiencies as well as the highest net energy outputs.
When analysing bioenergy production systems, it is not yet completely understood whether biomass is better produced intensively or extensively. While some authors favour low-input extensive production systems [
32,
33], others have concluded that the use of high-yielding crops for the generation of bioenergy can result in high land-use efficiencies and energy efficiencies along the whole supply chain [
12,
15,
64]. Our results show that high-input cropping systems can achieve high energy use efficiencies as well as net energy output, provided that site-adapted crops are chosen. The results of the energy balance suggest a high favourability of maize as a bioenergy crop when a high energy efficiency of the bioenergy process is desired, with energy efficiencies outperforming every other crop or combination of crops and reaching values of up to 45.
5. Conclusions
The results of this work show a high potential for energy efficient bioenergy production in southern Germany. While maize had the highest single-crop net energy output as well as the best energy efficiency of all crops, there were crops or crop combinations that performed better at a certain site, highlighting the importance of site-specific crop rotation management. Still, farmers who choose maize for the production of bioenergy can regularly achieve high energy efficiency, in compliance with the results of this paper.
In this paper, the assessment of energy crop focused on energy input, dry matter yields, energy output, and energy efficiency. In addition, technological aspects and management of the production processes were taken into account due to the energy balance methodology (process analysis, see
Figure 1 and
Figure 2). Further criteria are significant for farmers when weighing management decisions such as suitability of biomass for ensiling and fermenting, or economic aspects. Regarding the environmental impacts of the energy crops, even more criteria have to be considered (e.g., biodiversity and soil erosion risk), where crops such as ryegrass could perform better than maize, possibly shifting rankings in integrated assessments. Ultimately, even energy crop rotations have to be designed in such a way that a sufficient crop diversity is ensured in order to avoid higher disease risk and further potential complications.
The energy efficiency of energy crops presented in this paper might improve soon because of further breeding progress (causing higher yields without higher energy inputs) and more energy efficient production processes for operating resources (fertiliser, plant protection, machinery, equipment) caused by more intensive use of regenerative energy sources in industrial processes (highlighting the need for continued adjustment of energy equivalents). This will lead to a rise in the energy efficiency of biomass and bioenergy production and increase the competitiveness of bioenergy.
We aim to publish nitrogen, carbon, and greenhouse gas balances based on the experimental data in the near future, allowing for an overall evaluation of the energy crops presented in this paper.


