1. Introduction
Pasta is one of the most common, most consumed, but also the most versatile foods in the world. In 2019, around 16 million tons of pasta were produced, and this production increased during the pandemic period. In Italy, the country representative for pasta, annual pasta consumption is 23.1 kg/per capita, in Greece 11.4 kg/per capita, and in France and Germany 8 kg/per capita [
1,
2]. Traditionally, pasta is a ready-to-eat product produced from durum wheat (semolina) [
3], but lately it is also produced from other flours, mixtures of flours with or without the addition of vegetables or other by-products, resulting in quality products that maintain a good consistency after cooking. Pasta is availablemainly in two forms: dry or fresh, in a variety of shapes and variants. Among the advantages of pasta is the extended shelf life, a large variety of recipes and short preparation time.
The good consistency of pasta after cooking is closely correlated with the content of gluten and protein, a good quality pasta havingprotein content between 13.5–14.5 g/100 g and a suitable glutenins and gliadins balance, which are the two components of gluten [
4].
One of the challenges of pasta with added ingredients is the color, because in the acceptability of consumers, pasta obtained from durum wheat must have a yellow color [
5]. New trends in food are moving in the direction of low-fat products, high-nutrition, and energy foods, with pasta successfully meeting these consumer requirements [
6].
In recent years, the sustainable use of organic waste and agri-food by-products has become one of the main principles of the circular economy and one of the most important challenges of food engineering. There are numerous research initiatives aimed at harnessing renewable resources resulting from food production by converting these materials into biopolymers, fertilizers, energy, human nutrition, animal nutrition, etc. Furthermore, food industry waste and by-products are a good source of protein, minerals, fatty acids, fibers and bioactive compounds that can prevent nutrition diseases and increase the physical and mental well-being of consumers [
7,
8,
9,
10].
Agro-industrial products account for about 30% of all globally produced foods. Spent grains (SG) is the main by-product of beer industry and the distillation industry, accounting for about 85% of the total by-products generated. This by-product results from the mashing process consisting of insoluble barley malt residues, which mainly include the grain coating [
8]. Spent grains has been scientifically proven to be a rich source of dietary fiber and protein, vitamins, minerals (silicon, calcium, and phosphorus), antioxidants, polyphenols and essential fatty acids. It consists mainly of dietary fibers (hemicellulose, cellulose and lignin) and proteins, which represent approximately 30–50% and 19–30% of its composition, respectively [
7]. Food by-products, such as spent grain, are rich in fiber, protein, amino acids, vitamins, fatty acids and can be added to improve the nutritional value of pasta, turning them into value-added ingredients [
11]. In order to obtain pasta, several researchers investigated the partial replacement of flour with ingredients obtained from agro-industrial by-products [
10,
12,
13,
14,
15].
The agricultural use of spent grain through compost production is commonly applied in the beer and distillation industry [
16]. Spent grains are more prone to composting than other by-products in the alcoholic beverage industry, mainly due to their relatively low moisture content. Their high protein and fiber content make the final product suitable for a wide range of applications, such as soil improvement and organic fertilizer. Spent grain is used to produce bioethanol, biobutanol, heat (dry spent grain up to 55% moisture) [
17], but also for the production of value-added compounds (e.g., xylitol, lactic acid, vitamins and antioxidants), as a medium for the production of micro-organisms and enzymes, as raw material for the extraction of sugars and proteins, as an adsorbent for the removal of organic materials from effluents and the immobilization of various substances [
9]. Due to its nutritional and functional properties, spent grain has been used to obtain food products, such as bakery products, cereal mixes, pastries and confectionery, snacks, pasta, etc. [
18,
19,
20]. Although research has intensified in recent times, the degree of recovery of this valuable by-product is still quite low, as it is often used in animal feed [
21].
Triticum aestivum var.
spelta (spelt flour) has a delicate nutty flavor and contains nutrients with health benefits (lowers cholesterol levels, helps eliminate toxins) [
22]. Spelt-based products are more digestible compared to those obtained from common wheat [
22]. Wang et al., 2020 found in their study that spelt flour is higher in antioxidant and mineral micronutrient and has more potential health benefits compared to common wheat flour [
23], the same result reported by Wójtowicz et al. [
22].
The circular economy involves turning by-products into useful resources by minimizing wastes, so it is very important to find the optimal process and percentage of substitute for obtaining high quality pasta [
11].
Nutritional values of pasta, such as high digestibility, slow-release carbohydrates and relatively low glycemic index compared to bread, pizza and other cereal foods, lead to ever-increasing consumption of this food worldwide. On the other hand, foods promoting health by incorporating ingredients of plant or animal origin into manufacturing recipes are considered to be nutritional products with added-value [
24]. Nutritional improvement of pasta mainly involves increasing the content of protein and dietary fiber and fortification with vitamins and minerals. In recent years, there has been a particular interest in the use of cereal by-products in manufacturing recipes for the incorporation of substances with beneficial physiological effects (folic acid, dietary fiber, polyphenols, arabinoxylans and lignans). These include spent grain from the beer industry and distillation industry [
25,
26,
27].
The novelty of this study is the use of spent grain flour from the whisky industry mixed with spelt flour in the production of pasta, a flour little used in this direction. Most studies are based on the use of brewers spent grain, but the novelty of this study is the use of distillery spent grain. The aim of this present work was spent grain valorization by use in pasta formulation made with spelt flour.
2. Materials and Methods
The spent grain flour was obtained from spent grain from whisky production kindly provided from a local factory, Alexandrion Group (Ploiesti, Romania). Spent grain was stored at −18 °C, dried at 50 °C for 24 h and then ground with the help of a mill and then sieved. For this study, the fraction of less than 200 µm was used. The ground spent grain was stored in paper bags at room temperature until further use. All chemicals used in this paper were of analytical grade and were purchased from Sigma Aldrich (St. Louis, MO, USA). Spelt flour was purchased from a local market and had Romanian origin.
2.1. Pasta Processing
Spelt flour and different percentages of spent grain flour (5%, 10%, 15%, and 20%) were mixed in a Kitchen Aid mixer (Whirlpool Corporation, Benton Harbor, MI, USA) with appropriate amount of water in order to obtain dough moisture of 32%. The temperature of the dough was maintained at 40 °C for a resting time of 45 min; the pasta was extruded using a Kitchen Aid accessory with a small macaroni mold. Pasta was dried at 40 °C in an air oven for 6 h.
2.2. Determination of Dough Properties
2.2.1. Dynamic Rheological Behavior
A Thermo-HAAKE, MARS 40 (Karlsruhe, Germany) with parallel plates geometry was used to determine the dynamic rheological behavior of pasta dough. Dough samples were tested for linear viscoelastic region (LVR). The complex modulus G* (Pa) was determined by frequency sweep test, in the linear viscoelastic region previously determined, at a strain of 15 Pa and a frequency range from 0.1 to 20 Hz, that was in the LVR [
4].
2.2.2. Dough Texture Profile Analysis
For the dough texture profile (TPA) analysis, was used a Perten TVT-6700 texturometer (Perten Instruments, Hägersten, Sweden). 50 g of dough were compressed twice at 50% height with a 35 mm cylinder probe, at 5.0 mm/s speed and a trigger force of 20 g [
13]. Firmness, adhesiveness, springiness and cohesiveness were analyzed in triplicate.
2.3. Pasta Quality Parameters
2.3.1. Dry Pasta/Cooked Pasta Color
The color of the dried pasta was evaluated with a Konica Minolta CR-400 colorimeter (Tokyo, Japan), using CIELab color space coordinates, where L* values describe black to white (0 to 100), a* is the degree of redness (positive) or greenness (negative), and b* is yellowness (positive) or blueness (negative). Four pasta samples were arranged over a white background and the colorimeter was placed over the samples to collect data [
28]. Samples were measured in triplicate and the Chroma meter was calibrated with a white-board of the device. Determination of the color change with the addition of spent grain is done with the equation described below [
15]:
where ∆L = L* sample – L* control, ∆a = a* sample – a* control, ∆b = b* sample – b* control
Khan et al., 2014 [
15] described ∆E as an index for determining visual color differences and described it in terms of related values as follows in
Table 1:
2.3.2. Dry Pasta Fracturability/Cooked Pasta Texture
Dry pasta fracturability was determined using the maximum force F (g) needed to break a pasta piece. A Perten TVT-6700 device (Perten Instruments, Hägersten, Sweden) equipped with an aluminum break rig set adjusted to 10 mm width was used. The test speed was 2 mm/s and the trigger force 5 g [
29].
For the determination of firmness, adhesiveness, stringiness and stickiness of cooked pasta was used a Perten TVT-6700 device (Perten Instruments, Hägersten, Sweden) equipped with a 35 mm cylinder probe using a double cycle compression at a speed of 0.2 mm/s. Measurements were made in duplicate.
2.3.3. Determination of Antioxidant Activity
Total polyphenolics (TP) content were analyzed according to the method described by Iuga and Mironeasa, 2021 [
13] with some modification. A sample of 2 g of raw pasta\were grinded and mixed with 20 mL methanol 80% (
v/
v) and sonicated for 40 min in a sonication bath at 37 °C and 45 Hz then the mix was centrifuged for 5 min at 4000 rpm. The phenolic content was determined using the Folin–Ciocalteau method as described: 0.2 mL of extract was mixed with 2 mL of Folin–Ciocalteau reagent, diluted 1:10, and 1.8 mL of sodium carbonate 7.5% (
w/
v) into a tube. The mixture was left for 30 min at room temperature in the dark. The total polyphenolic content was determined at 750 nm wavelength using a UV-VIS-NIR spectrophotometer (Shimadzu Corporation, Kyoto, Japan). The calibration curve of the polyphenols was performed by using gallic acid at concentrations of 10–200 mg/L with the regression coefficient R 2 = 0.99872 and equation y = 0.00949x + 0.02950. The samples were analyzed in triplicate and results were expressed in µg gallic acids equivalents per gram (µg GAE/g).
Total antioxidant activity was determined by 2,2-Diphenyl-1-picrylhydrazyl (DPPH) by adding 2 mL of extract described above with 2 mL of DPPH solution 0.1 mM in methanol (9.85 mg DPPH dissolved in 250 mL methanol), as described by Ikram et al., 2020 [
30]. The mixture was shaken for 2 min and kept for 30 min at room temperature, in a dark place, and then the absorbance was determined at 517 nm using a UV-VIS-NIR spectrophotometer (Schimadzu Corporation, Kyoto, Japan). The antioxidant capacity was measured in three repetitions for each sample, using distilled water as a blank sample, as described in Equation (2).
where A
s = absorbance of sample, A
b = absorbance of blank sample
2.3.4. Pasta Cooking Quality
The grams of water absorbed per gram of dry pasta (m
0), named swelling index is a good indication of the integrity of protein matrix that restricts water penetration. Determination of this index is performed by drying the cooked pasta (m
1) to constant weight and employing Equation (3) [
5].
where m
0 and m
1 were the weight of dry pasta and cooked, respectively.
A sample of 10 g of pasta was cooked to its optimum time, drained for 2 min and then dried in a laboratory oven at 105 °C to constant weight [
15]. A disrupted gluten network will allow granules to absorb more water and gelatinize, so that an increase of cooked weight and swelling index will be observed. Acceptable pasta quality is related to absorption of 50–200 g of water/100 g pasta and a swelling index of approximately 1.8, without considering pasta with additional ingredients that could affect both parameters, in addition to pasta microstructure [
5,
28]. The reported values were the average of at least two replicas for each sample.
Twenty-five grams of pasta were put into 300 mL of boiling water without salt addition and have been boiled. One piece of pasta was pressed between two glass plates at every 30 s. Optimal cooking time (OCT) is considered when the starchy central core was disappeared [
31,
32]. Cooking time was determined in duplicate.
Cooking loss (CL) was determined gravimetrically by weighting the residue after evaporating the cooking water because some parts of pasta were dissolved in the water during cooking. A small cooking loss indicates a better protein network developed [
31]. Cooking loss parameter is one of the most important attribute that affect consumer acceptance of fiber-enriched pasta [
33]. Ten grams of pasta were cooked in 100 mL of boiling water without salt addition. After boiling for optimal cooking time, the volume of water was brought to the initial volume. Dry matter was determined on 25 mL of cooking water, dried to constant weight at 105 °C [
14]. The residue was weighed and expressed as grams of matter los per 100 g of pasta [
31]. Cooking loss was determined in duplicate.
The swelling of the starch and its gelatinization represents the amount of water absorbed by the cooked pasta and is determined in relation to the dried pasta. Water absorption (WA) during cooking was calculated from the weight of pasta before cooking and after cooking at the optimal cooking time. WA was determined as described in Equation (4):
where w and w
0 were the weight of cooked and raw pasta, respectively.
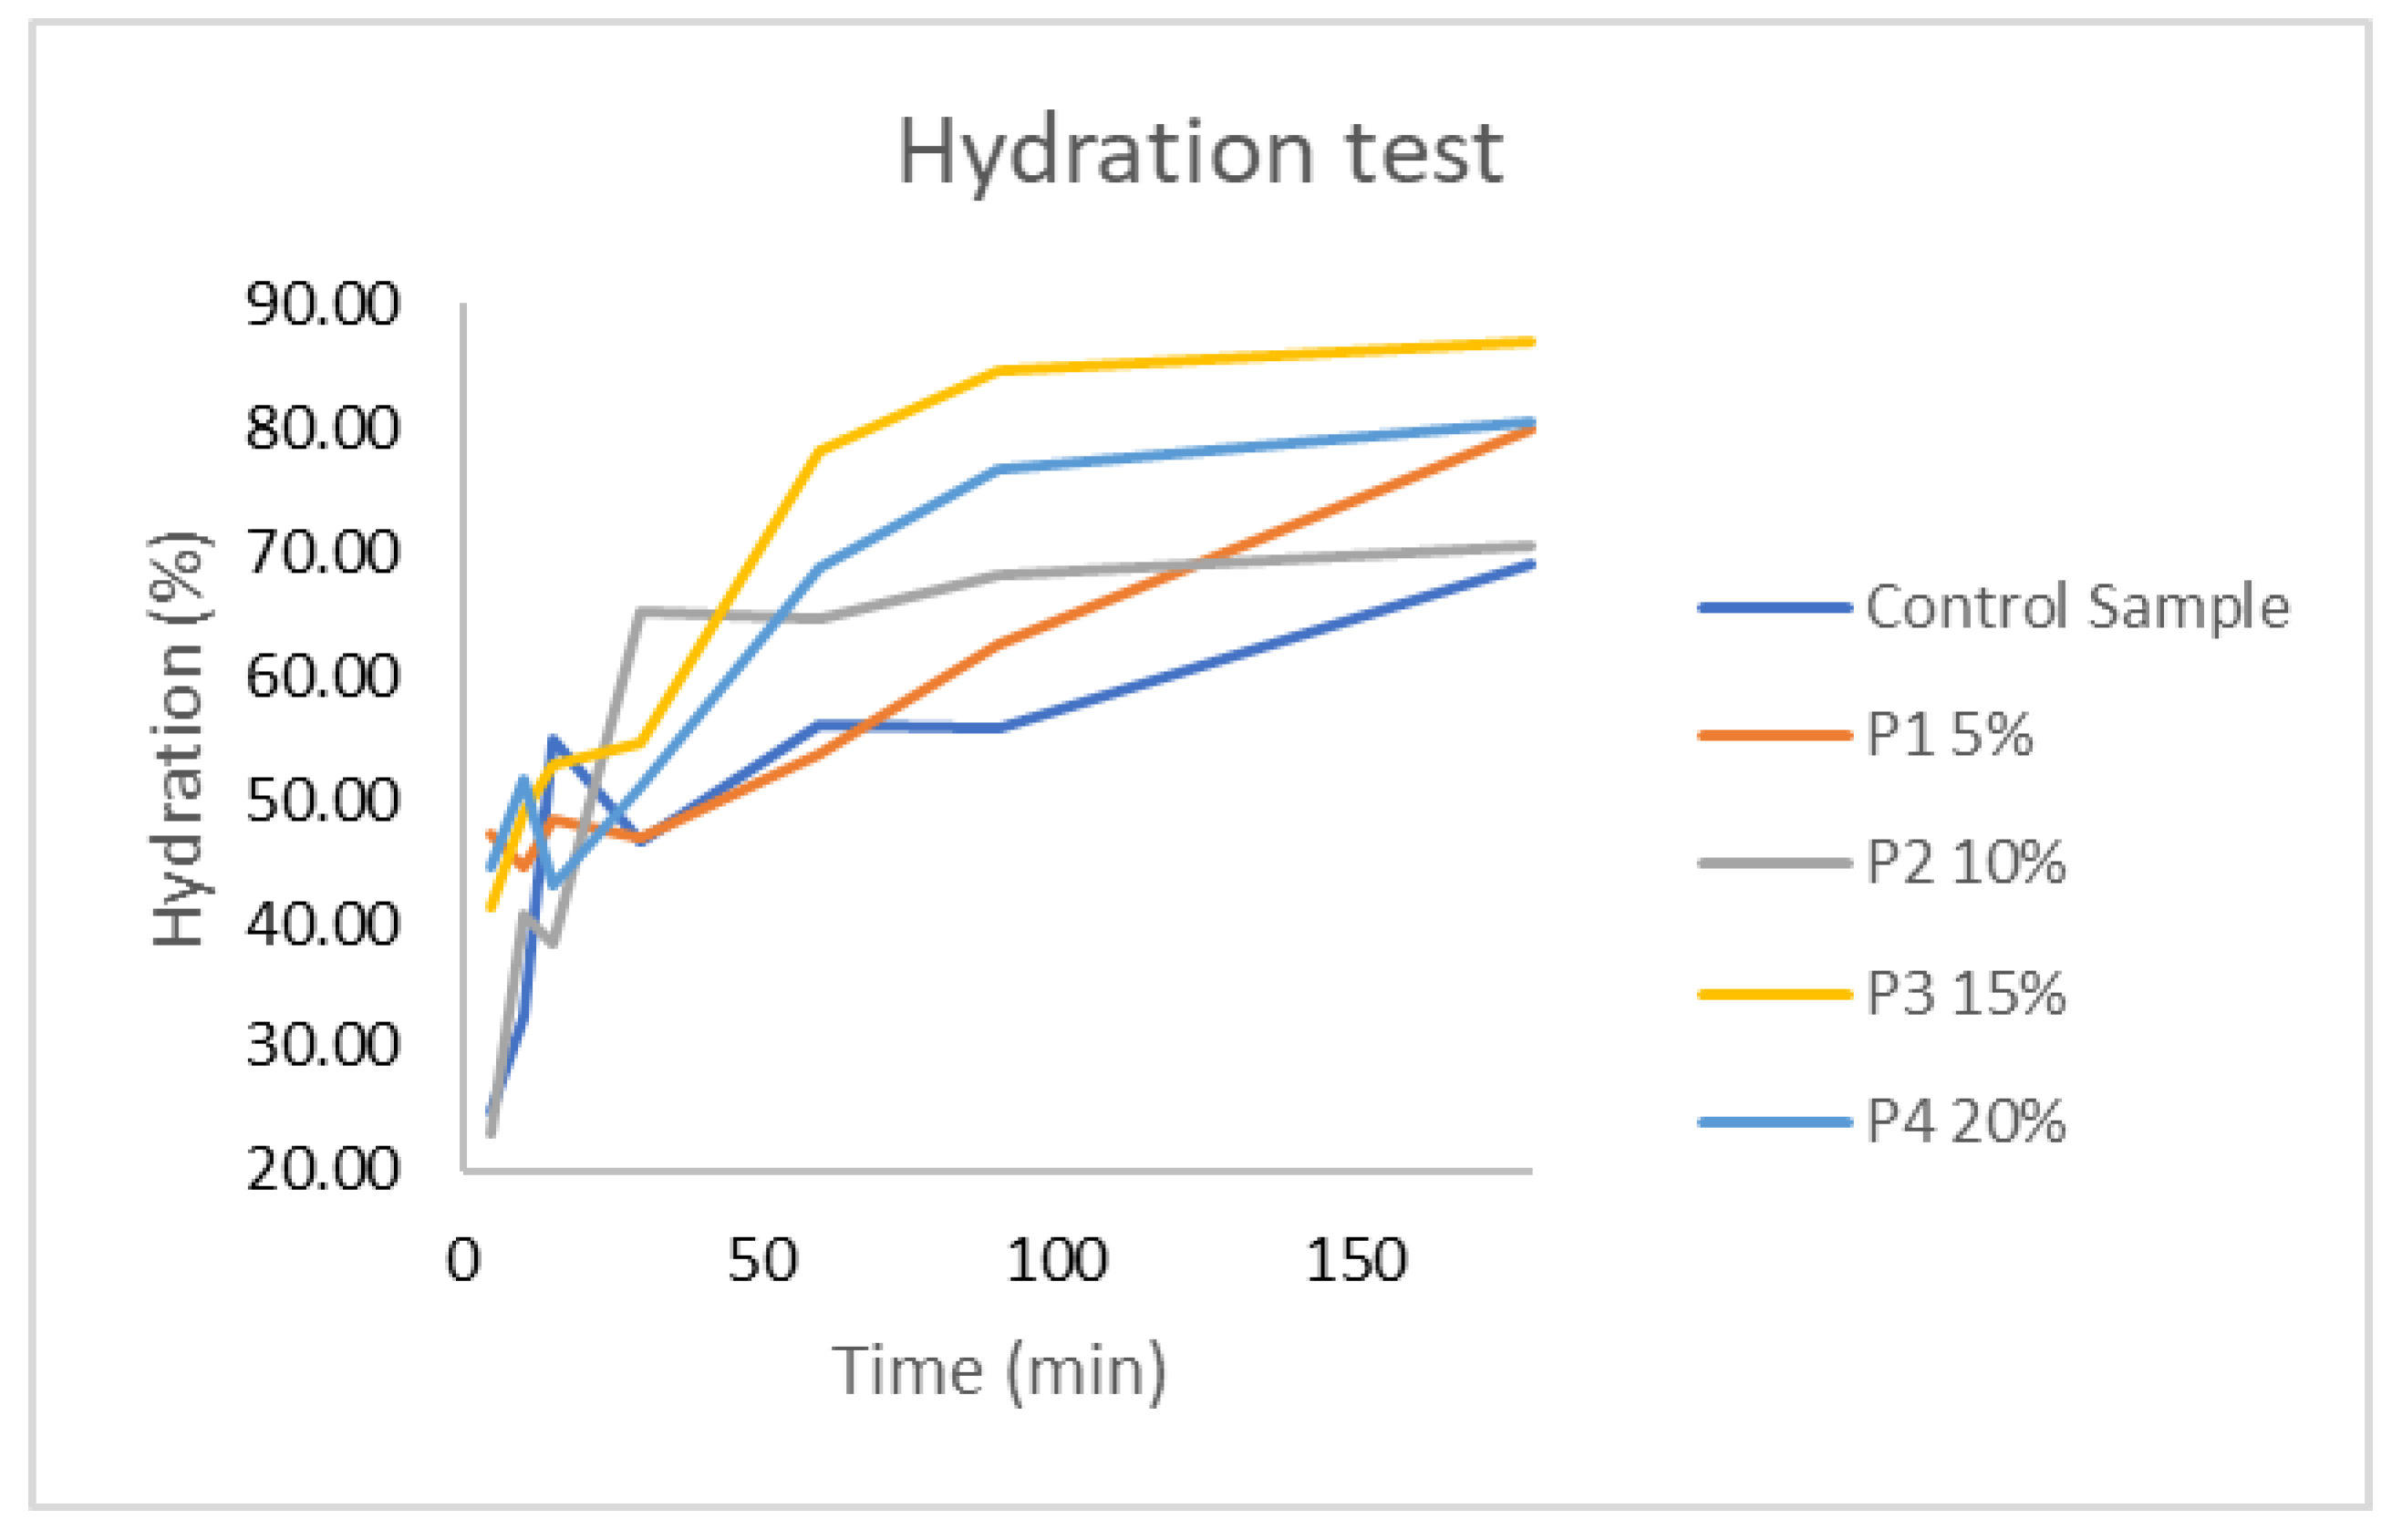
Hydration test (HT) was evaluated using a 1:20 ratio pasta: water, using the Schettino et al., 2021 [
31] method. Five grams of sample were placed in a glass containing 100 mL of water and placed in a thermostatic bath at 25 °C. Samples were removed after 5, 10, 15, 30, 60, 90, and 180 min of incubation and drained for 1 min and weighed. All samples were calculated in duplicate and expressed as (Equation (5)):
where w
1 was the weight of hydrated and raw pasta and w
0 was the weight of dry sample.
2.4. Proximate Analysis of Spent Grain Pasta
All samples were subjected to proximate analysis. The moisture of the pasta was determined by the method of drying in the air oven at 105 °C until the constant weight. The ash content was determined in an oven at 550 °C for 8 h, until a white or light grey residue is obtained, without traces of charcoal in the calcination furnace. Crude protein content was determined by standard Kjeldhal method, using 5.7 conversion factor (Velp Scientifica, Usmate, Italy) and lipids content was determined by standard Soxhlet method, using hexane as extraction solvent. Total dietary fiber was assessed by enzymatic method using the AOAC Method 2011.25 with a Megazyme total dietary fiber assay kit (Megazyme, Ireland). The carbohydrate content was calculated by the difference (carbohydrate content = 100 − protein content − lipids content − ash). All samples were measured in triplicate.
2.5. Water Activity
Water activity (Aw) measurement was done using the water activity meter AquaLab 4TE (Decagon Devices Inc., Pullman, WA, USA) at 25 °C. All samples were measured in triplicate.
2.6. Sensory Analysis of Cooked Pasta
Sensory evaluation took place on pasta samples cooked at optimal cooking time (OCT), paste: distilled water ratio 1:10 by a panel of seven experts selected according to their sensorial skills and trained in sensory vocabulary and identification of particular attributes. Parameters such as: firmness during chewing of the product, resistance to breaking after cooking, appearance, color, smell and taste, general acceptability were evaluated. For each attribute a nine-point hedonic rating scale was used, where one corresponded to low attribute intensity, and nine to high attribute intensity.
2.7. Microstructure
To determine the roughness and microstructure of the paste surface, a Mahr CWM100 microscope (Mahr, Gottingen, Germany) was used, and the images were processed using Mountain Map software 8 (digital Surf, Lavoisier, France) (trial version). The images were registered after scanning three different areas.
2.8. Statistical Analysis
Results are presented as mean ± Standard Deviation (SD). The obtained data were processed by using the SPSS 26.0 (trial version) software (IBM, New York, NY, USA). The differences between means were evaluated by analysis of variance (ANOVA) and Tukey’s test at 5% significance level, statistically significant differences being considered at p < 0.05.
3. Results
The most used flour for pasta processing is durum wheat semolina due to the specific properties of proteins and gluten, but also because of its yellow color [
34];while for the gluten-free pasta, the most used cereal is sorghum [
35]. Chemical composition of spelt flour was (%
w/
w, dry basis): 3 ± 0.01% lipids, 8 ± 0.05% fiber, 14 ± 0.09% protein, 64 ± 1.15% carbohydrates, 2.11 ± 0.04% ash, 11.26 ± 0.08% moisture, 313 ± 1.14 s falling number, 32.73 ± 2.14% wet gluten, 2 ± 0.02 mm gluten deformation index, and 74 ± 1.54% hydration capacity. Spent grain flour had the following characteristics (%
w/w, dry basis): moisture (5.04 ± 0.42%), ash (3.47 ± 0.02%), protein (18.88 ± 0.37%), lipids (7.11 ± 0.39%), and fibers (22.67 ± 0.42%), as we obtained from previous study [
20]. The addition of spent grain in pasta formulation was analyzed on rheological properties of dough, and on dry and cooked pasta. Cooking quality was evaluated by determining optimal cooking time, swelling index, cooking loss, water absorption, and hydration test.
3.1. Determination of Dough Properties
3.1.1. Dynamic Rheological Behavior
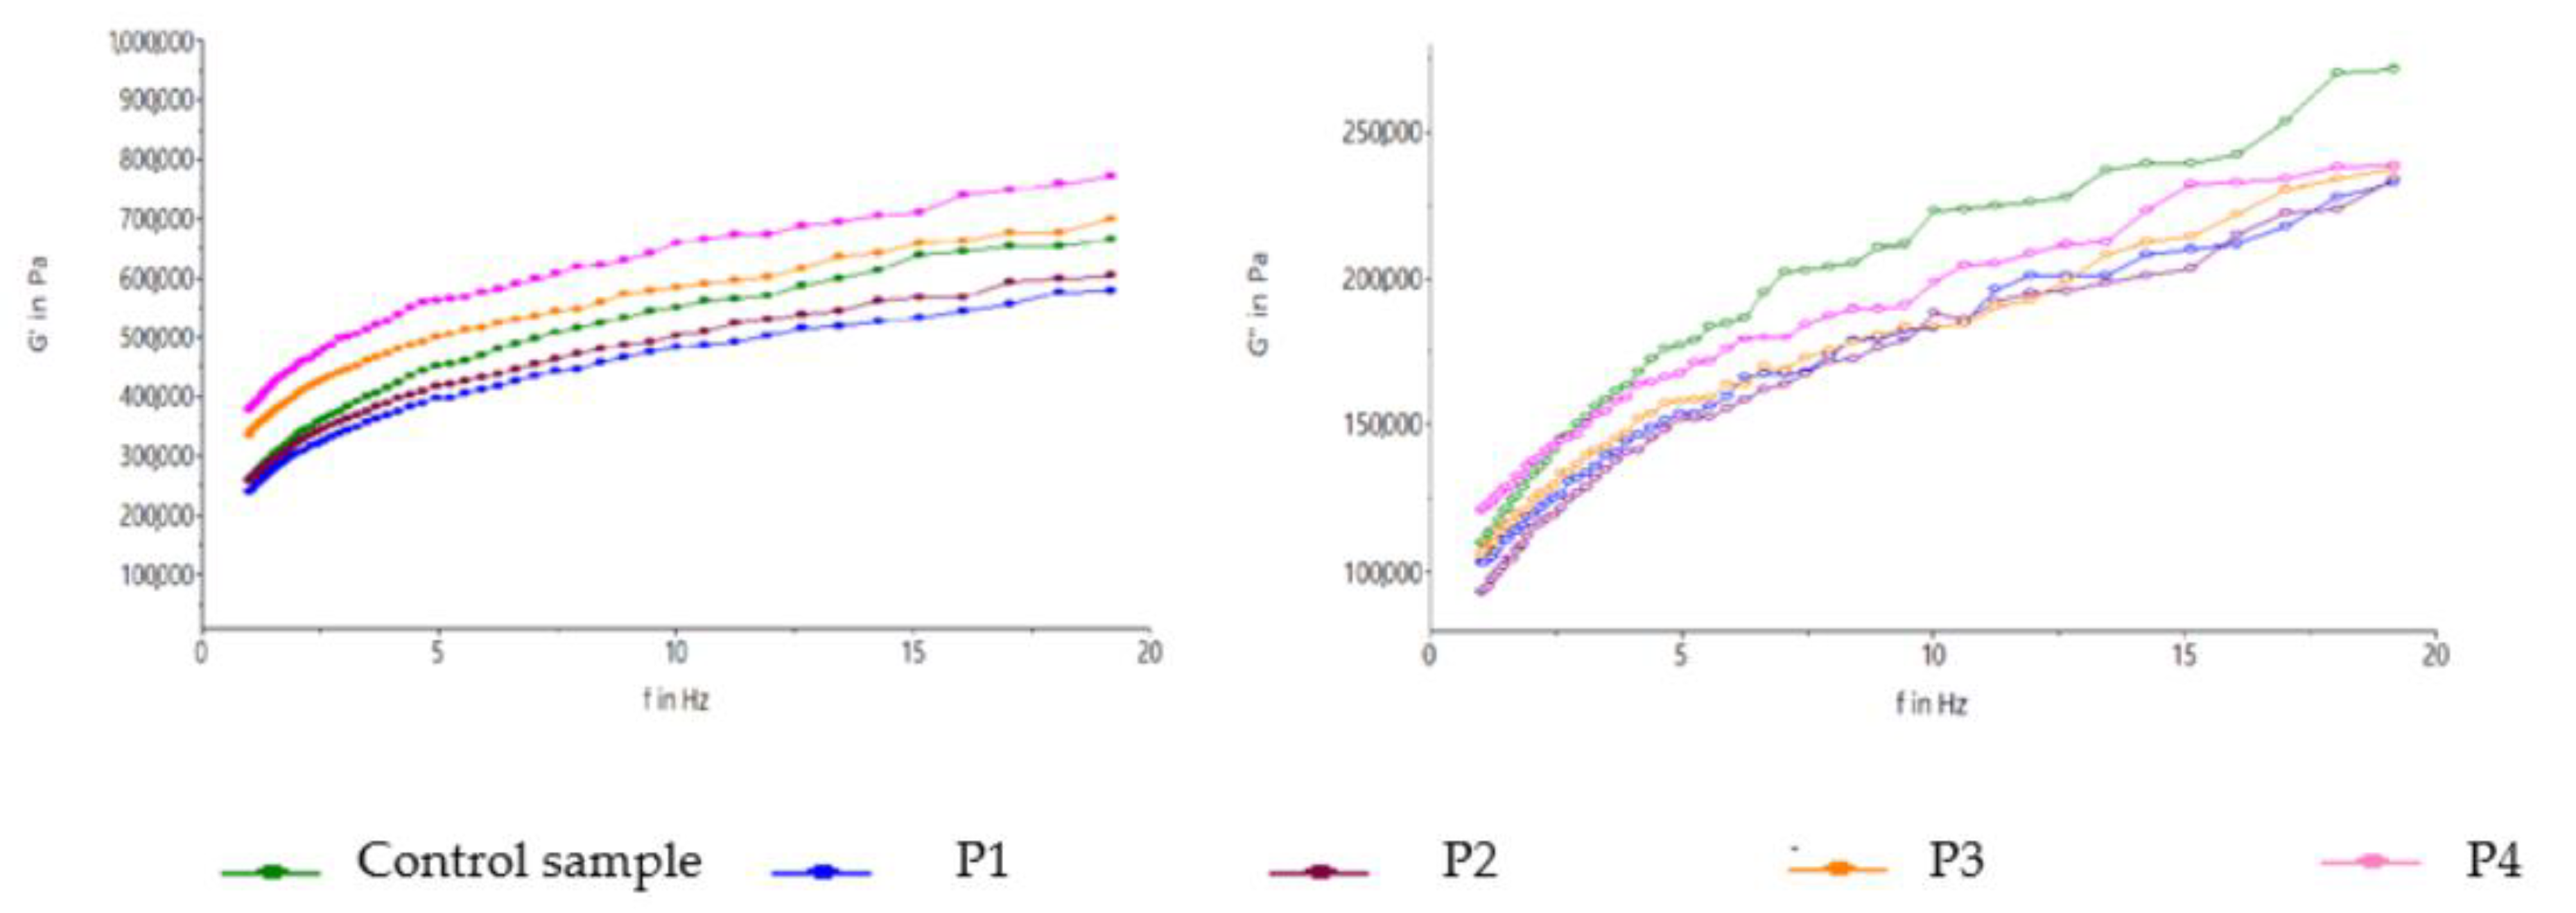
It is very important to find optimal forms in the pasta recipe and suitable technologies because the diversification of the raw materials used often significantly alters the rheological properties of the dough, with a consistent decrease in its technological capabilities. The elastic module (G’) and the viscous module (G”) can be obtained from dynamic oscillation tests, a useful method to study the effect of water content, proteins, different amount of gluten in the dough or mixing time. G’ represents a good determination of dough strength, decreasing with the increase in water content, and also changing depending on the protein/starch ratio [
4].
Spent grain has significant protein content, and proteins addition influences the growth of the elastic module by cross-linking.The sample with the highest content of spent grain (20%) has the highest values, as showed in
Figure 1. The larger G’ shows that the dough structure is more rigid and less elastic. Same results were obtained by Iuga & Mironeasa, 2021 in their study using grape peels by-product for pasta manufacturing [
13].
3.1.2. Dough Texture Profile Analysis
The addition of spent grain led to an increase of dough firmness with the level increase. The dough can be negatively influenced by the addition of high fiber products [
12]. No significant changes among samples were obtained for springiness and cohesiveness, the most elastic dough sample being the dough with 5% spent grain. Compared to the control sample, the highest firmness was obtained for the highest level of spent grain addition and the lowest adhesiveness. All samples were firmer than the control sample and had less adhesiveness [
7]. Pasta dough texture parameters are presented in
Table 2.
3.2. Pasta Quality Parameters
3.2.1. Dry Pasta/Cooked Pasta Color
In terms of color, both dried and cooked pasta samples were analyzed (
Table 3). The color became darker (L* value decreases) with the addition of spent grain. The addition of spent grain increased the redness-higher a* value and decreased the yellowness-lower b*. The presence of phenolic compounds may affect the modification of these color parameters. Those changes of pasta color parameters (decrease in L* and b*values and increase in a* value) has been observed before by Khan et al., 2014 [
15] in pasta enriched with sorghum flour, by Wood, 2009 [
36] in pasta enriched with chickpeas flour, and by Tazrart et al. 2016 [
37] in pasta with broad bean flour. ∆E was determined to evaluate the differences between the spent grain formulation and the control sample. With the increase of spent grain addition increases the ∆E values in uncooked form.
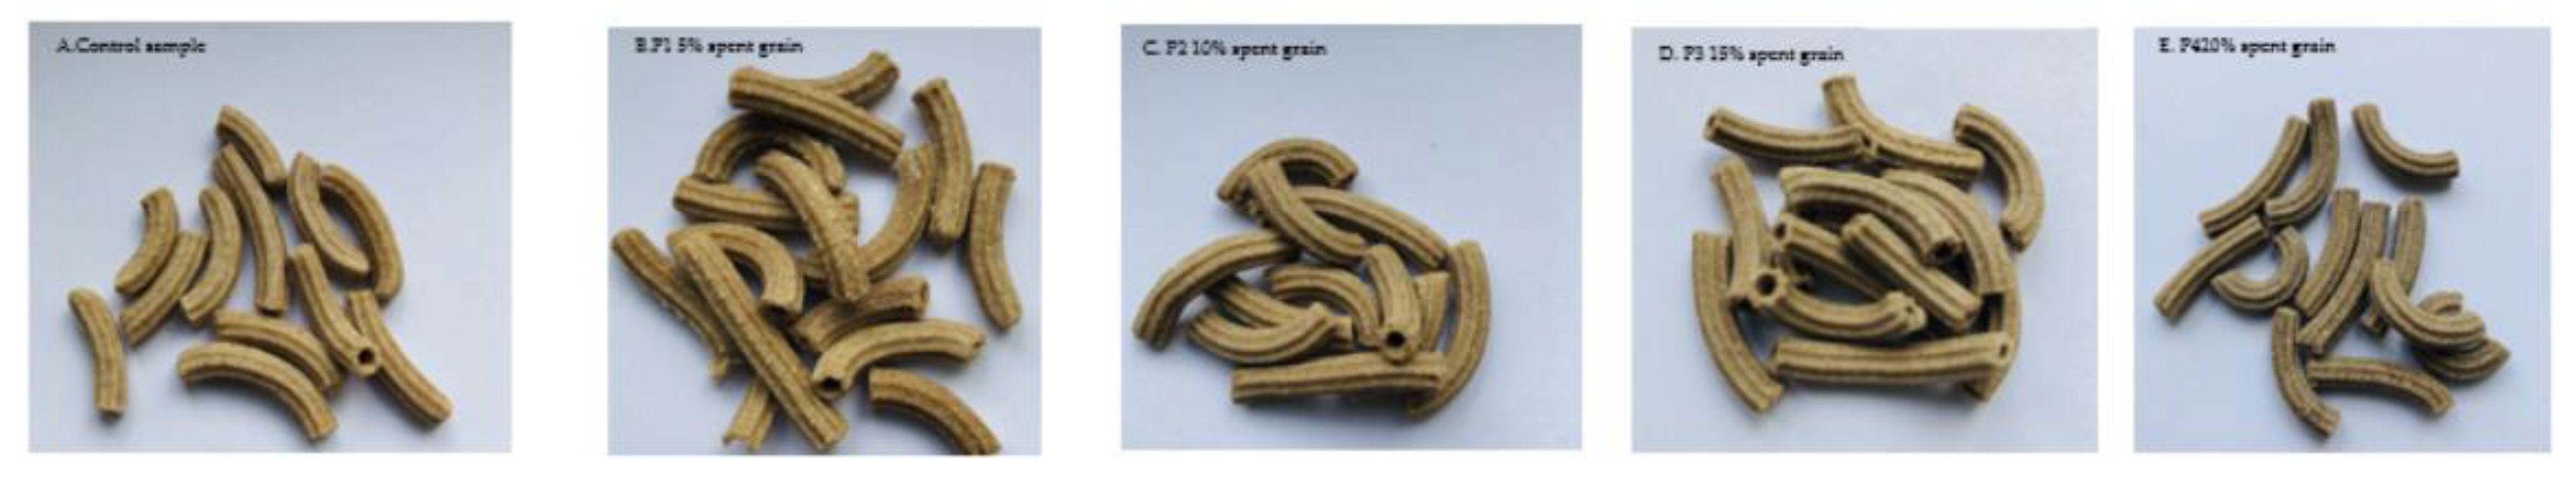
Although nowadays there are more and more pastas of all colors on supermarket shelves, the color of dry pasta is an important parameter of quality. The appearance of pasta is most often associated with color, being illustrated in
Figure 2.
Sobota et al., 2020 [
38] used vegetables concentrates and powders into pasta production to change pasta color. The addition of beet powder into pasta causes a decrease in L* value and an increase in a* value. Consumers who adopt a healthy lifestyle do not feel bothered by the brownish color of pasta and lack of yellowness. Nowadays, consumers are more open to healthy foods at the expense of foods that look pleasant and are no longer so sensitive to changing the color of pasta.
3.2.2. Dry Pasta Fracturability/Cooked Pasta Texture
A material is fragile if it can be fractured when under stress. That is, it has little tendency to deform (or tension) before the fracture and usually makes a quick sound. Fracturability means the force recorded at breakage/destruction of the sample, is the force measured at the first significant change in the first curve, the first maximum point.
The fracturability of dried pasta decreases with the increase of the addition of spent grain, as shown in
Table 4. Iuga, in 2020, [
12] obtained in her study a decrease in pasta fracturability with the increase in the content of whey powder and corn starch.
Cooked pasta textural parameters are highlighted in
Table 5. Firmness or hardness is the force required to penetrate the pasta samples with teeth and represents the degree of resistance to the first bite [
11], pasta firmness is associated with the ‘al-dente’ mouthfeel [
7]. Firmness decreased in barley spent grain pasta due to the high addition of fibers components which weaken the gluten matrices [
11]. This decrease in firmness may be due to the increase in starch gelatinization in pasta, but also with a reduced amount of added starch in the pasta [
11].
The chewing action can be imitated by contracting the cooked samples at the optimal cooking time, compressing them, returning to the original point and repeating the entire cycle [
11]. Compared to control sample, increased protein content was associated with decreased pasta stickiness [
33,
36], same like in our study. Hence, the reduced stickiness of the spent grain -fortified pasta is probably a result of both higher protein and higher amylose contents.
3.2.3. Total Polyphenolics Content and DPPH
Spent grain can be considered a potential available source of phenolic compounds. The analysis of the total phenolic compound was carried out on dry pasta.
Total polyphenolics content grew with the increase of spent grain addition on pasta samples, as shown in the
Table 6. Schettino et al., 2021 made a comparison between the total polyphenol content and the antioxidant activity for pasta with the addition of spent grain both in raw, cooked form, but also during gastric digestion. The differences between raw and cooked pasta were insignificant [
31]. Iuga & Mironeasa, 2021 used in their study grape peels addition to pasta and the addition of grapepeels also increased the content of phenols [
13].
3.2.4. Pasta Cooking Quality
The swelling index, optimum cooking times, cooking loss, and water absorption for examined spent grain enriched pasta were reported in
Table 7. According to this table, it follows that the optimal cooking time for the control sample is less than for the samples in which spent grain was added. The cooking time for spent grain pasta ranged between 9′10″ ± 3″ and 9′40″ ± 2″, which is in according with Schettino et al., 2021 [
31]. With the increase in the content of spent grain, the optimal cooking time reduced, which also implies increased water absorption, facilitating swelling of starch granules [
33,
37].
Cooking loss is considered a useful indicator of overall pasta cooking performance and a value less than 10% indicated good cooking quality products in all formulations [
5], which could be represented by soluble compounds like soluble carbohydrates and/or fiber [
37]. Cooking loss ranged between 5.010 ± 0.04 and 6.895 ± 0.06, those results were in according with pasta enriched with buckwheat flour obtained by Marti et al., 2011 [
14] and by Mahmoud et al., 2012 [
39]. The smaller the cooking loss, the more developed the protein network [
32]. A similar trend for OCT and WA were reported by Iuga, 2020 [
12] for corn-based pasta. A low cooking loss as possible is desired because the amount of dry substance is an important parameter for the quality of pasta.
The increase in the weight of the pasta after cooking and the swelling index is due to the broken gluten network that will allow the granules to absorb more water and gelatinize [
5].
The kinetics of water uptake at 25 °C are shown in
Figure 3. The sample of pasta containing 5% spent grain has the slowest water uptake compared to the pasta sample with 15% spent grain, which is characterized by the fastest water uptake.
3.3. Proximate Analysis
Table 8 shows the proximate analysis of spent grain pasta. In order to store the pasta safely, it must have a humidity of less than 12% [
3]. The fiber and protein content increases with the addition of spent grain, while the amount of lipids remains approximately constant.
Drying uses hot air as a vector to extract water from the dough and is a very important step in the process of obtaining pasta because it must obtain a value corresponding to the balance with the ambient air. Under these conditions, it is not necessary to use a particular package to prevent drying or watering of the final product [
4].
3.4. Water Activity
The stability of food is a feature related to the variation in the water content in them. The multiplication of microorganisms involves the presence of water in an accessible form in the food. Aw for pasta samples ranged between 0.5123 ± 0.11 and 0.5394 ± 0.15, the lowest aw at the pasta sample with the highest spent grain content, which was 20 percent.
3.5. Sensory Analysis of Cooked Pasta
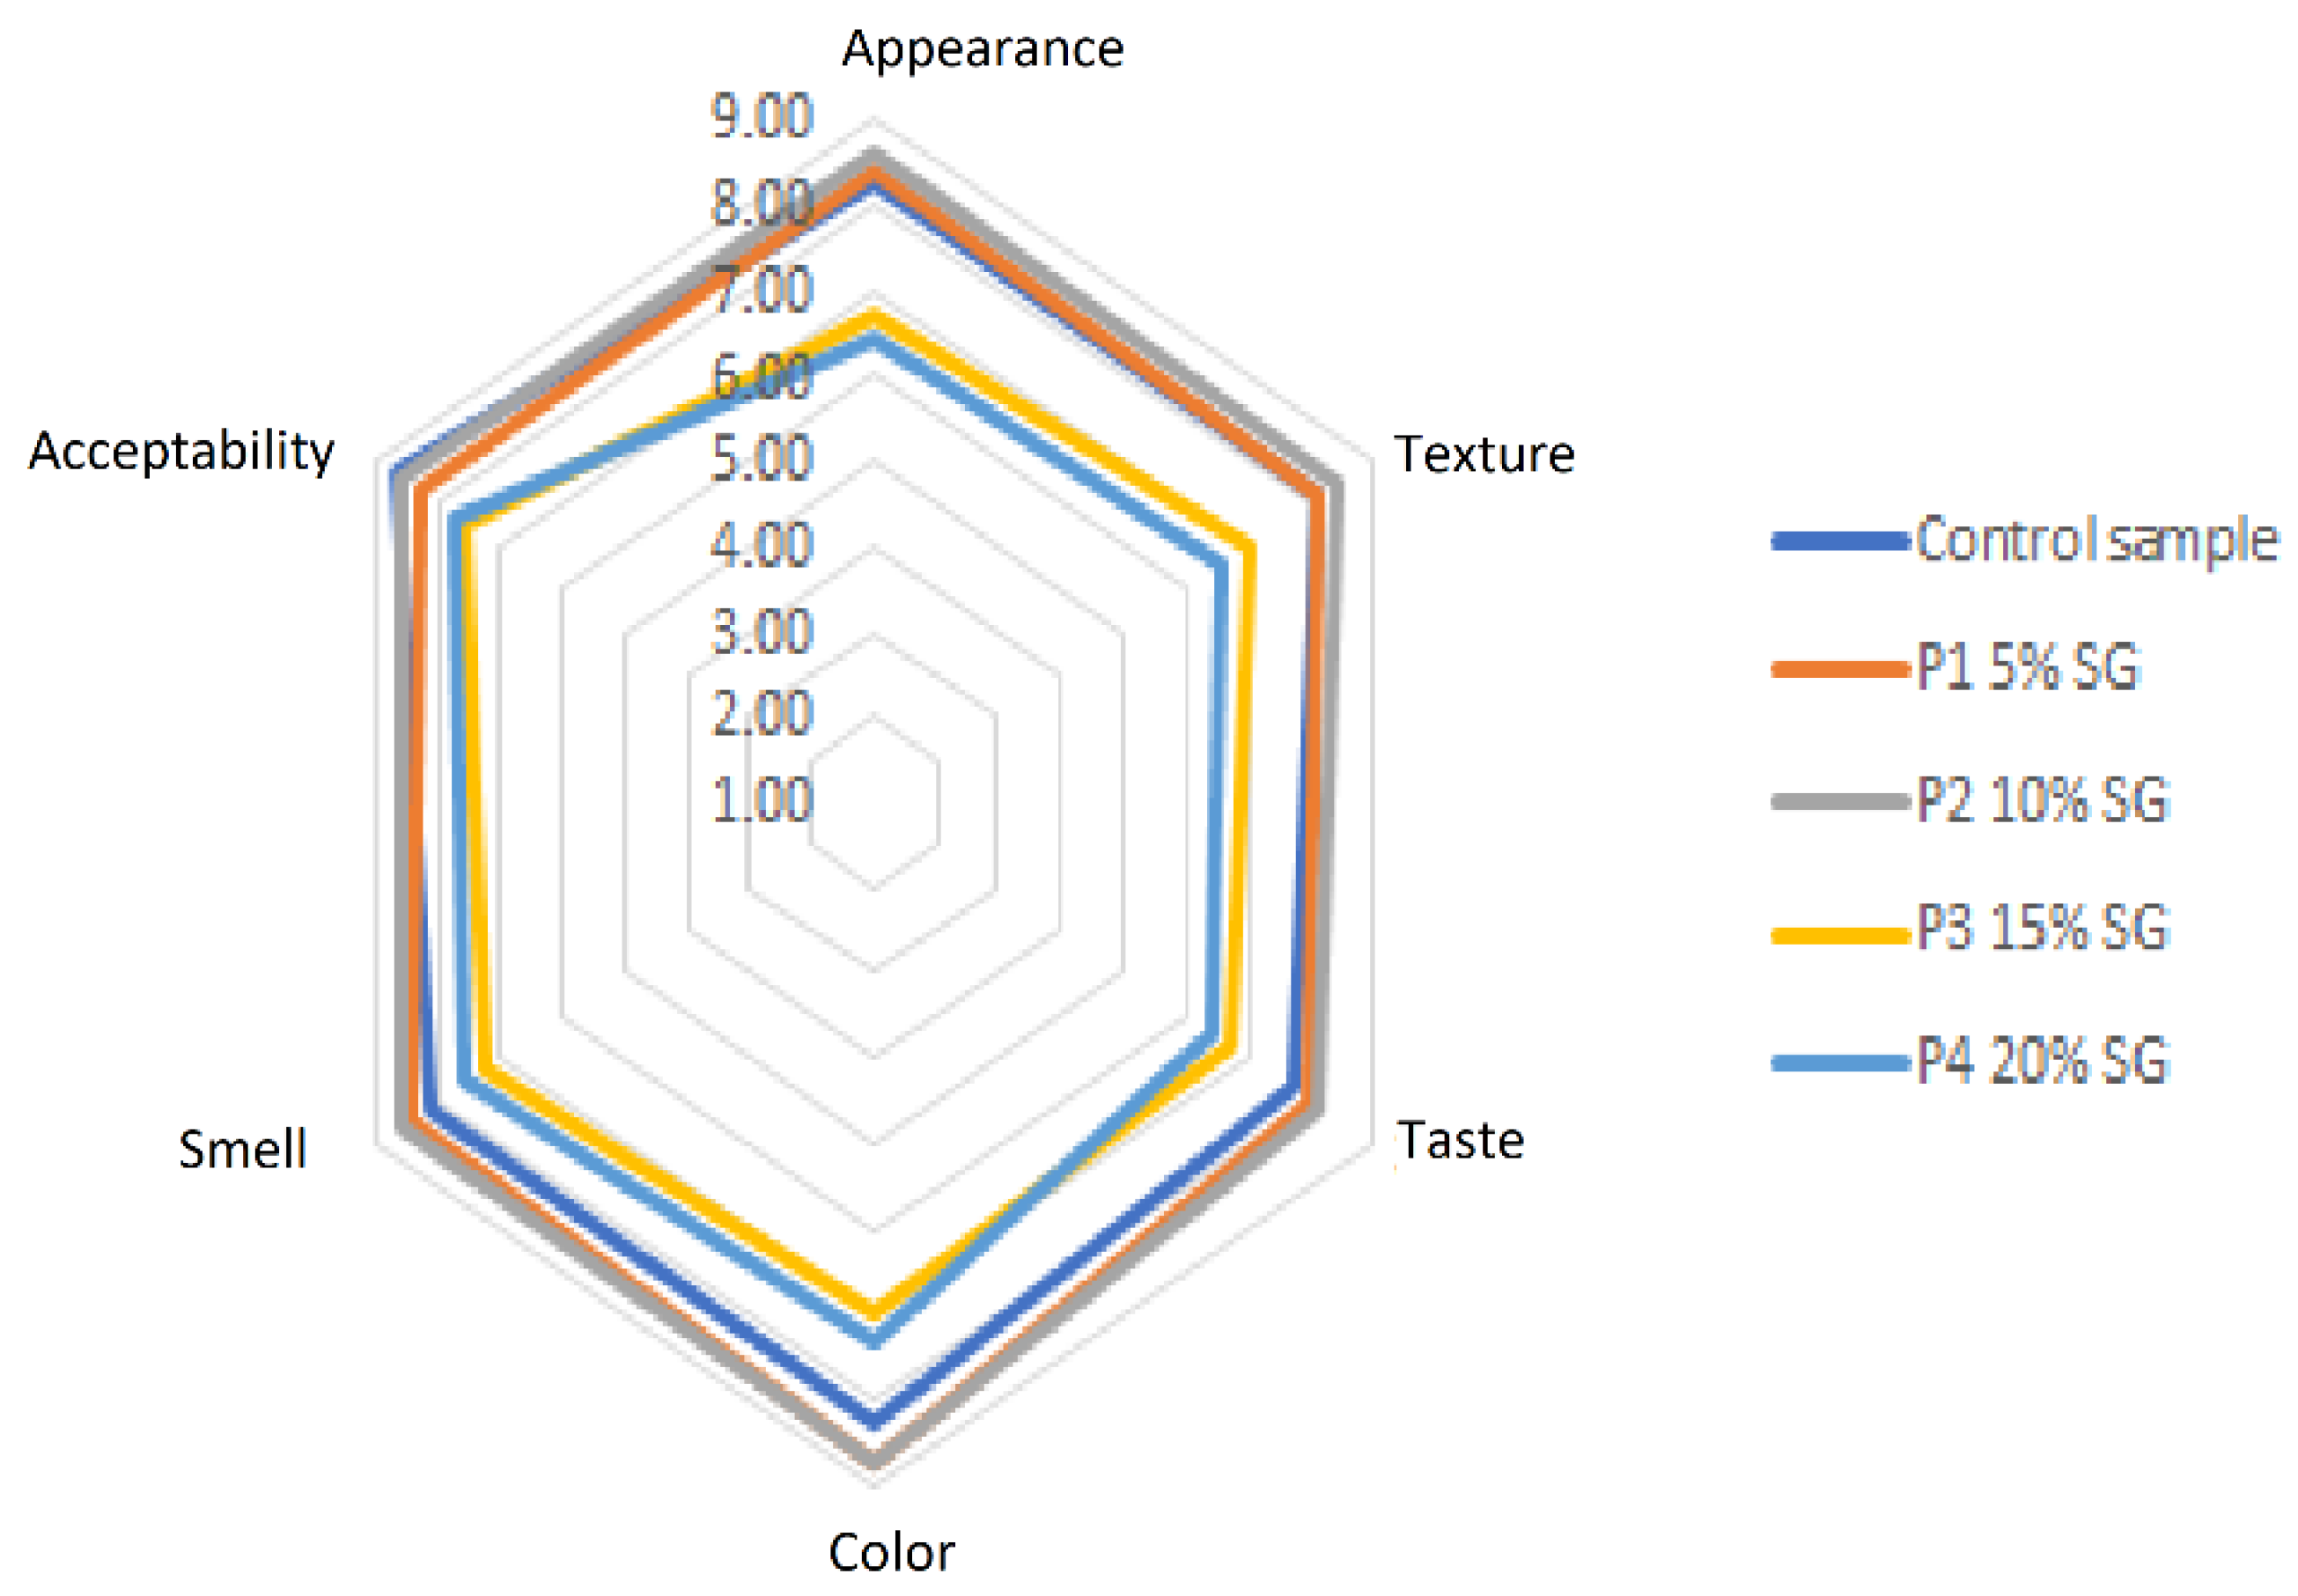
The sensory properties of cooked pasta are reported in
Figure 4. Overall acceptability presented acceptable values with scores greater than 7 in all the range analyzed. The highest scores for all the sensory characteristics studied were registered for the sample with 10% spent grain addition. The appearance of the control sample had values close to the sample with the highest score, the P2 sample with 10% spent grain, while the sample with the highest addition of spent grain recorded the lowest score for appearance. The texture scores decreased with the increase in the content of spent grain, the panelists negatively appreciated the texture of the resulting pasta. Spinelli et al. [
2] shows a decrease of cooked dried pasta sensory overall quality plotted as a function of brewers’ spent grain concentration. With the addition of spent grain, the taste and the smell of pasta has changed, intensifying the taste of malt, but also the color of the pasta has changed, becoming darker, in according to Schettino et al. [
31]. Polyphenols in spent grain can negatively affect the taste and smell of pasta, according to Iuga [
12].
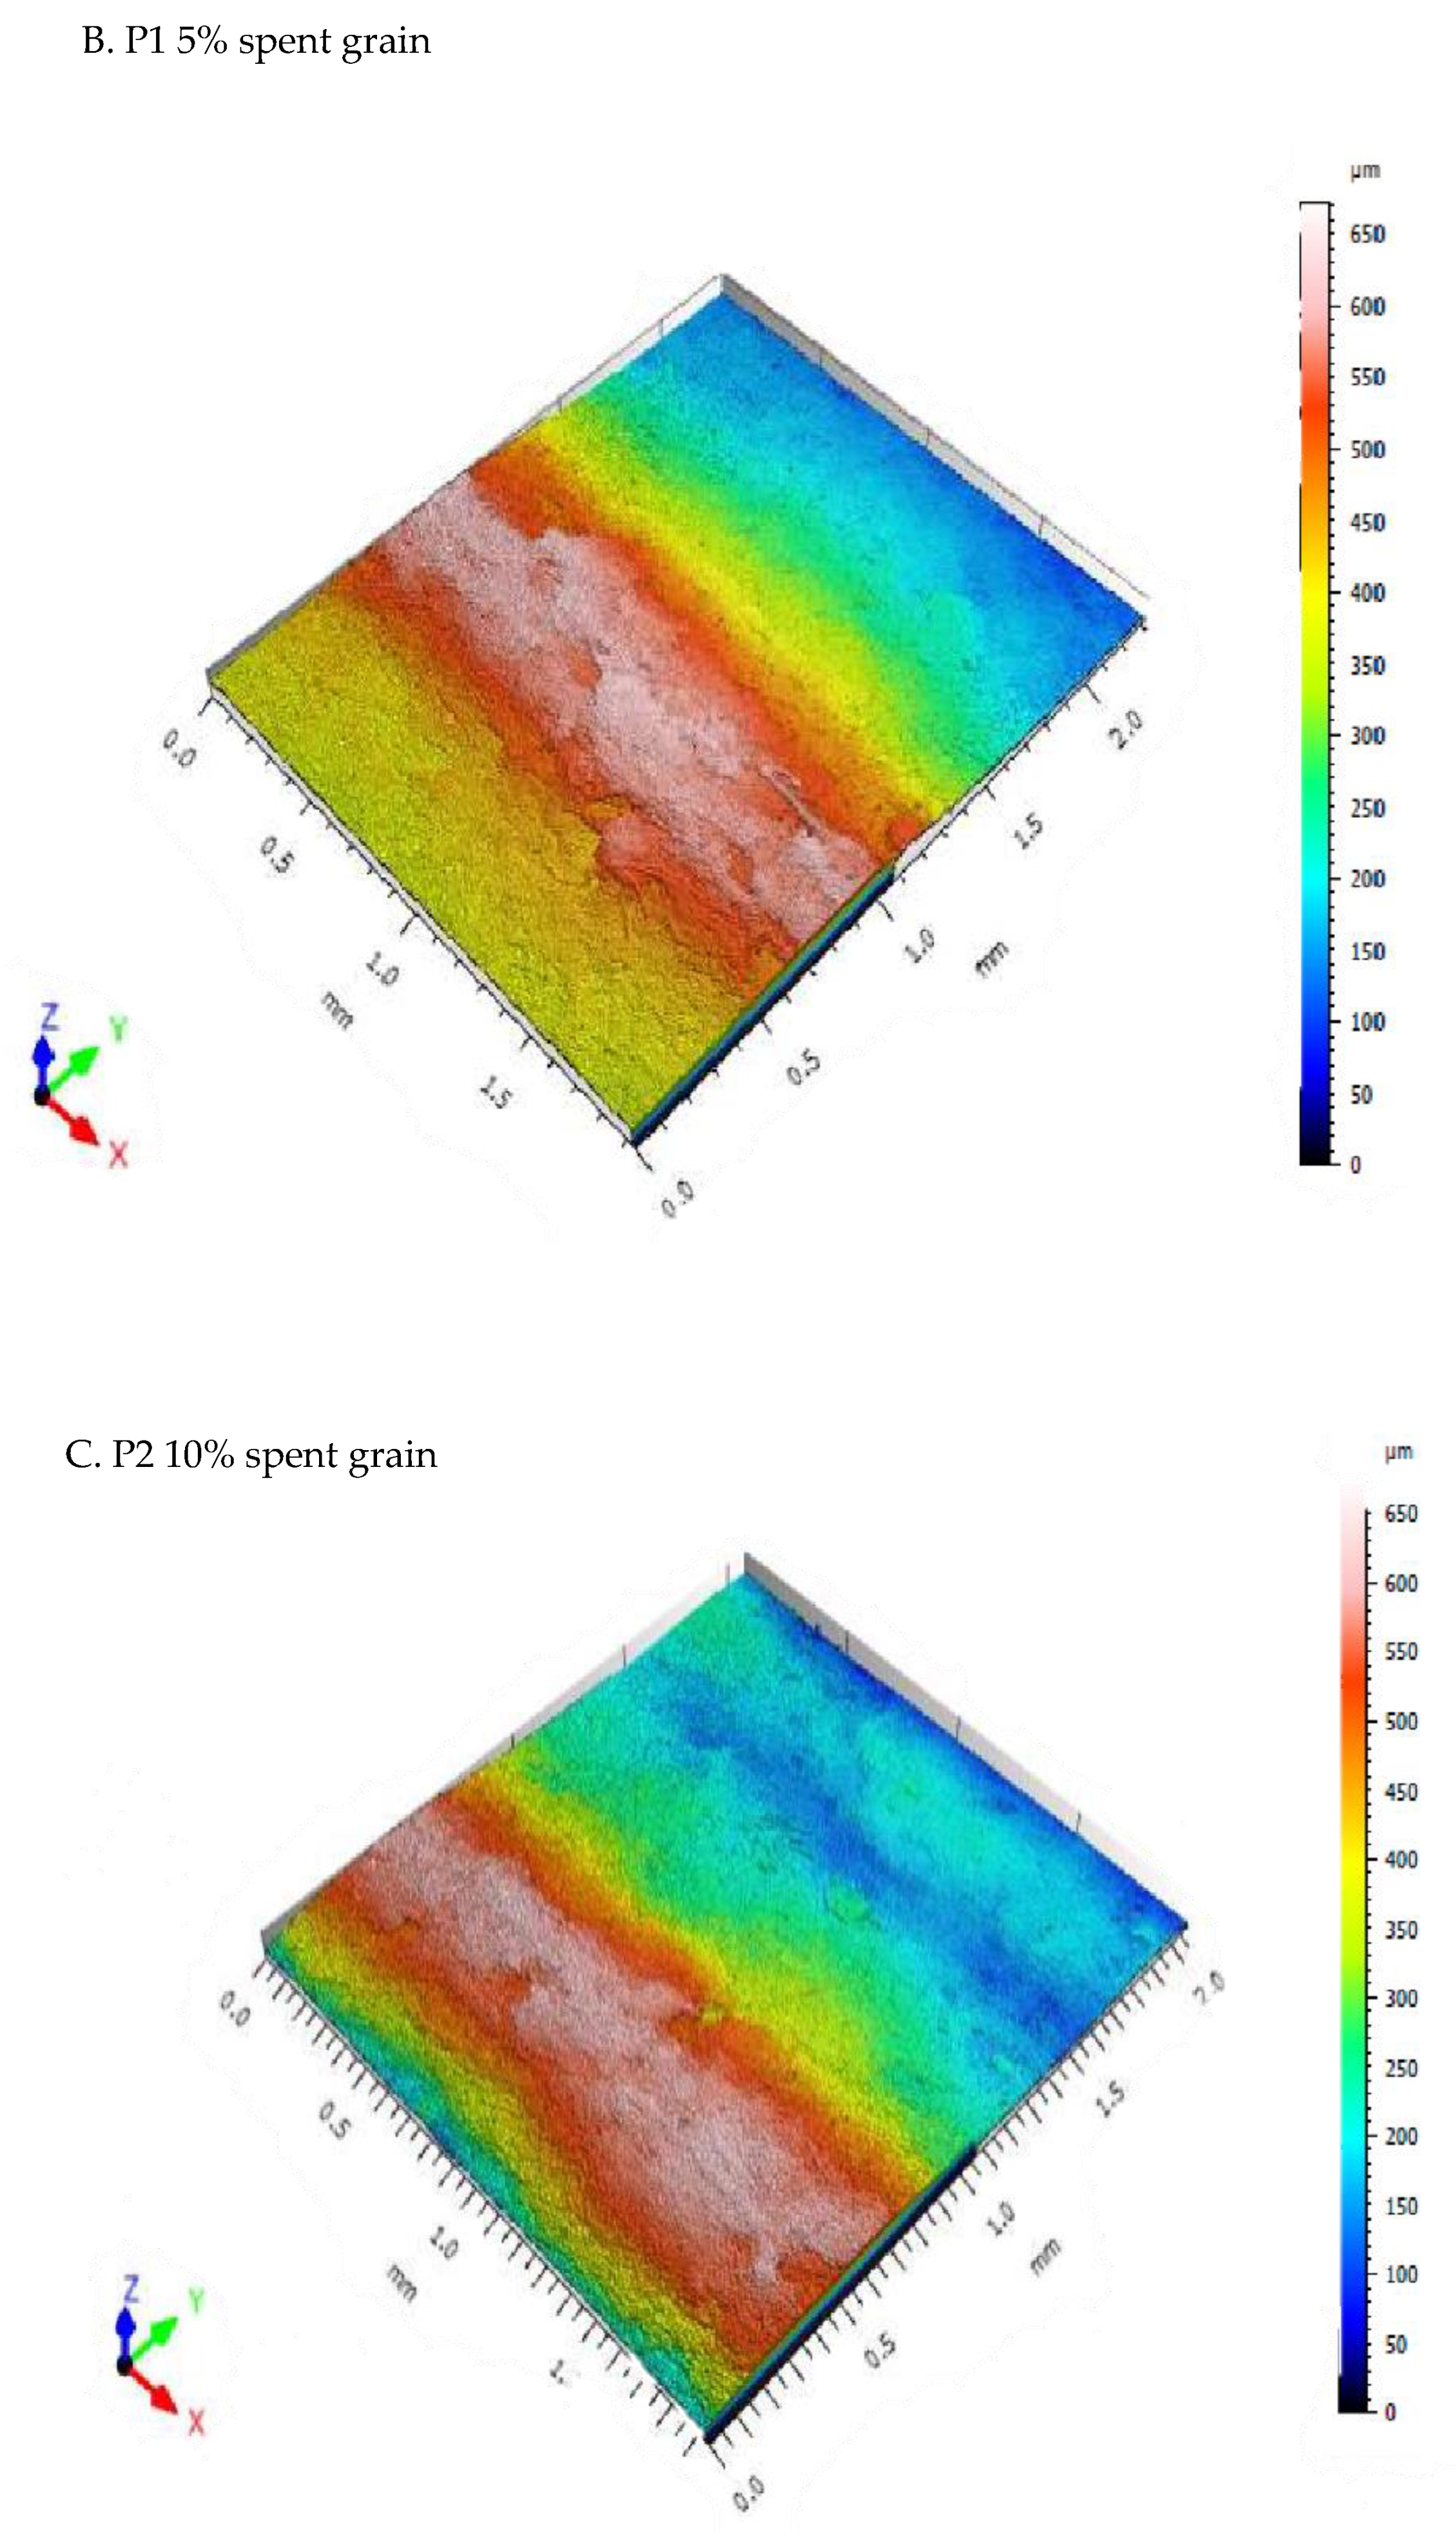
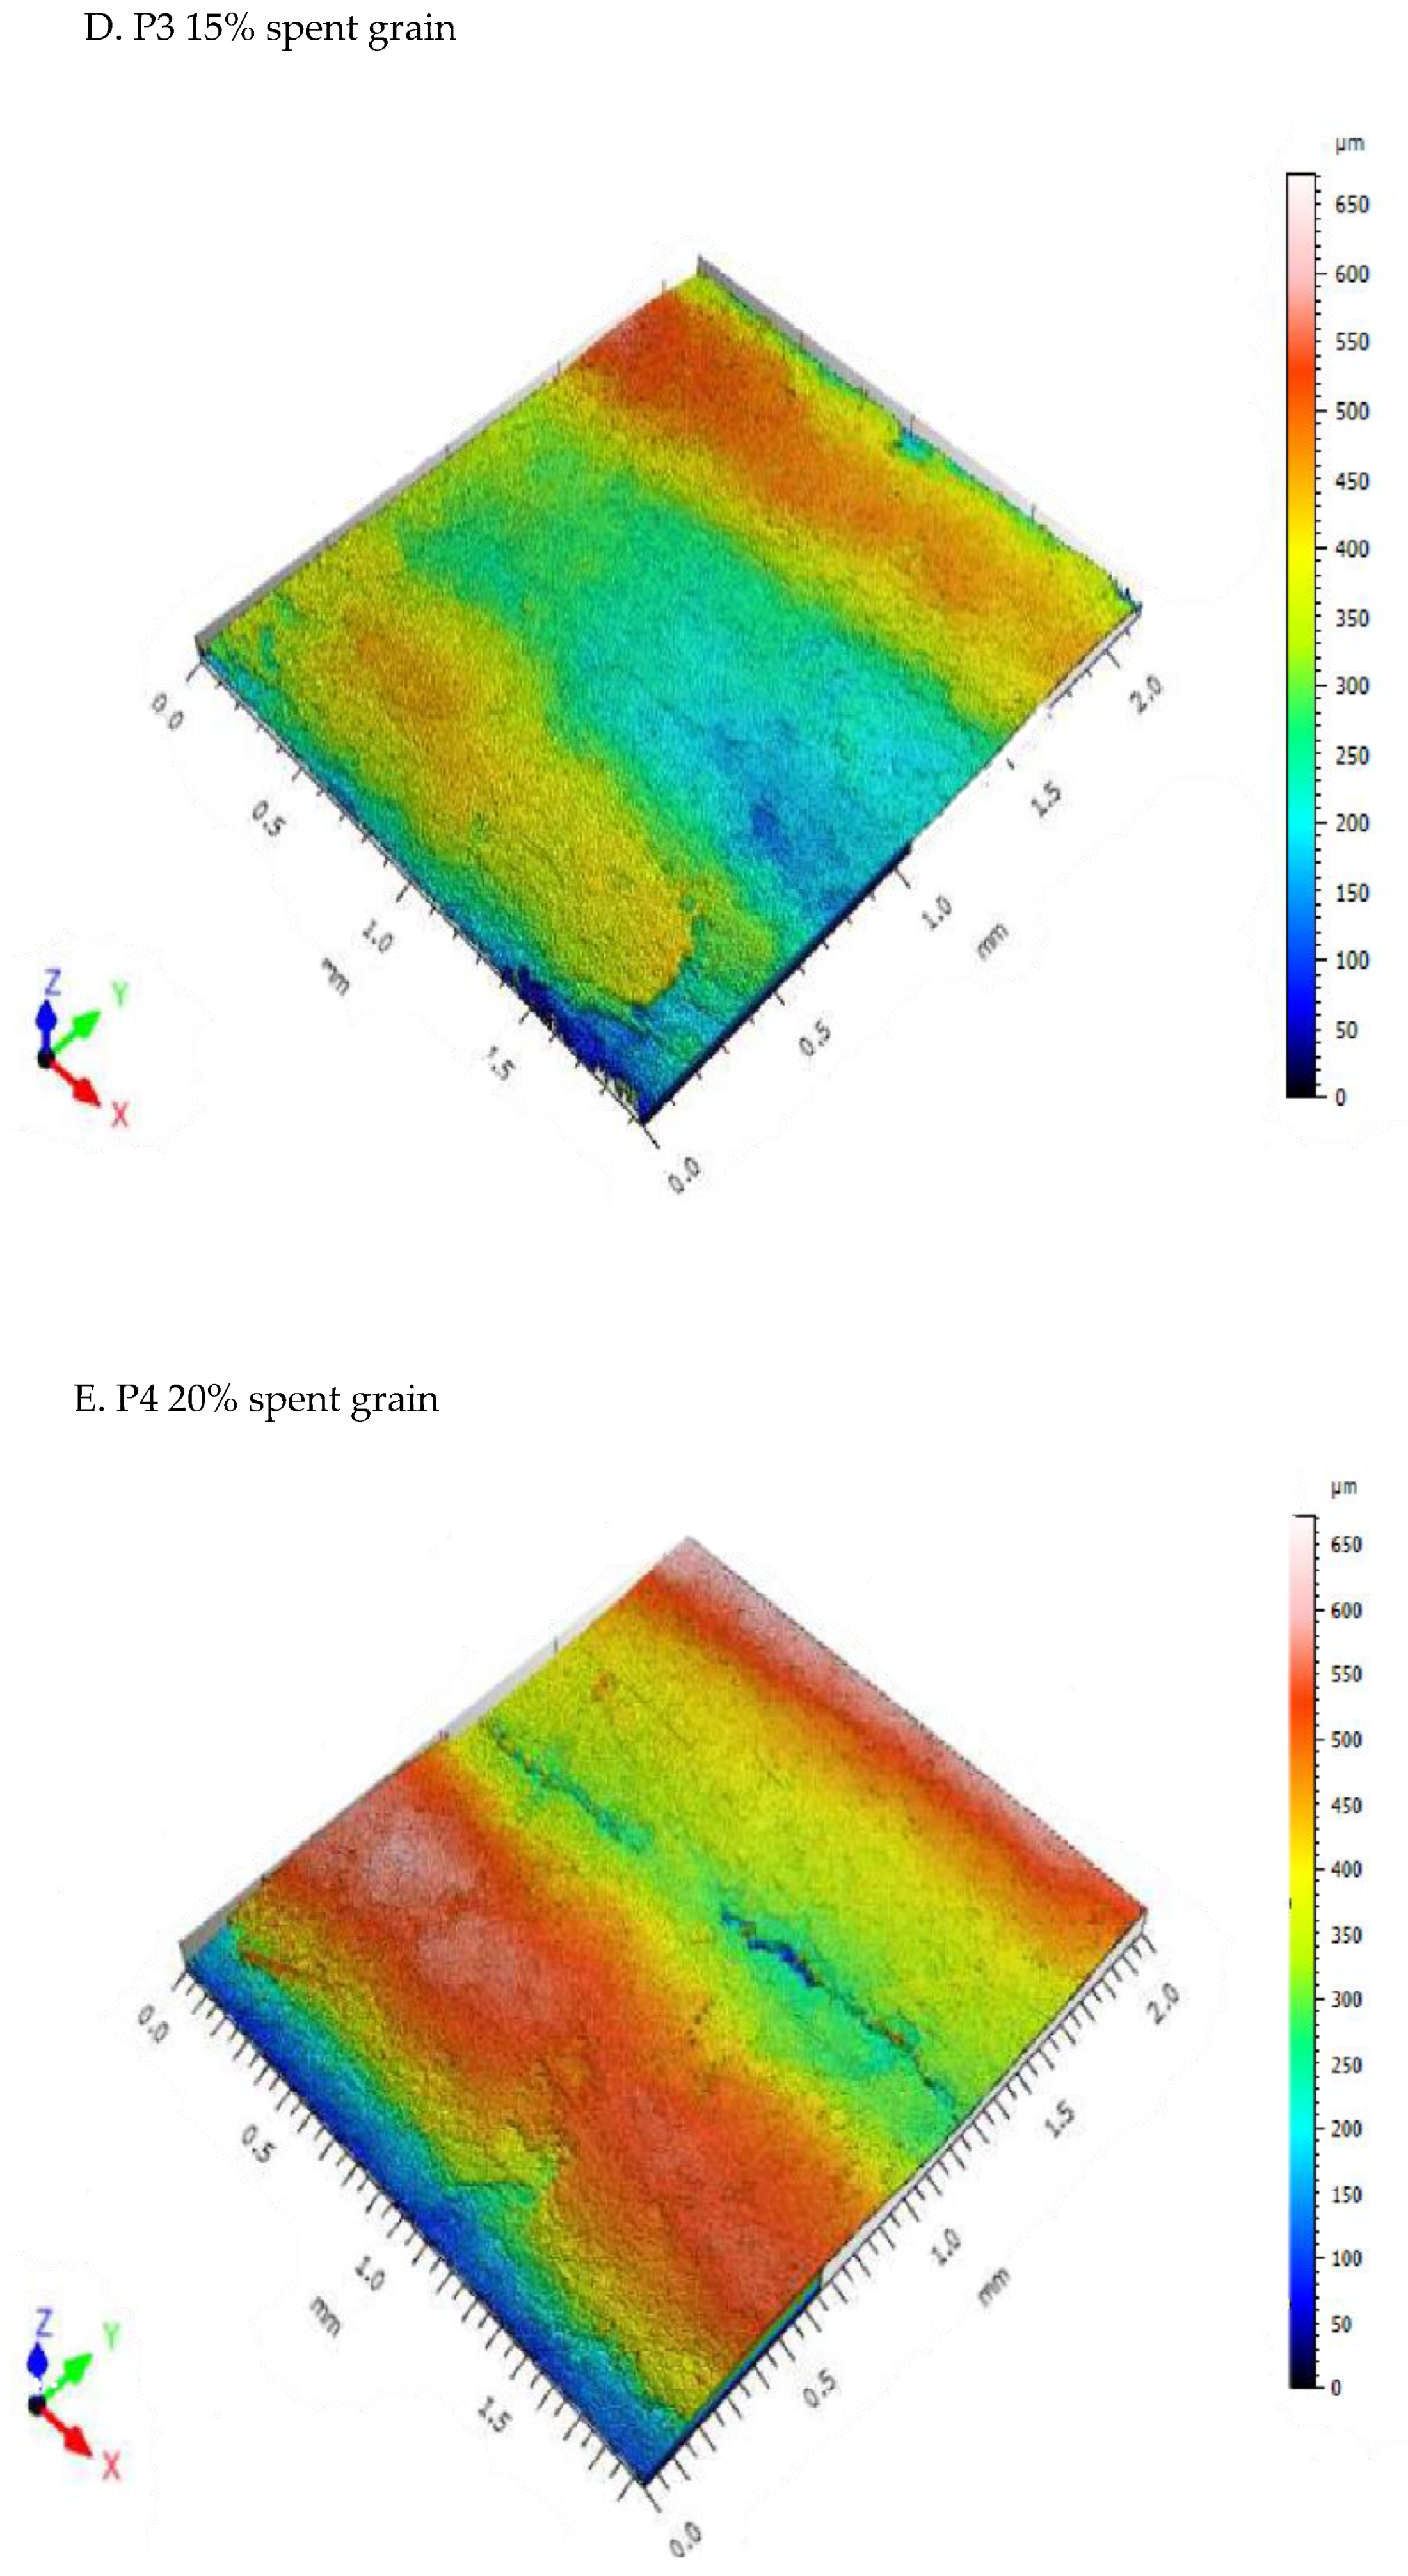
3.6. Microstructure and Roughness
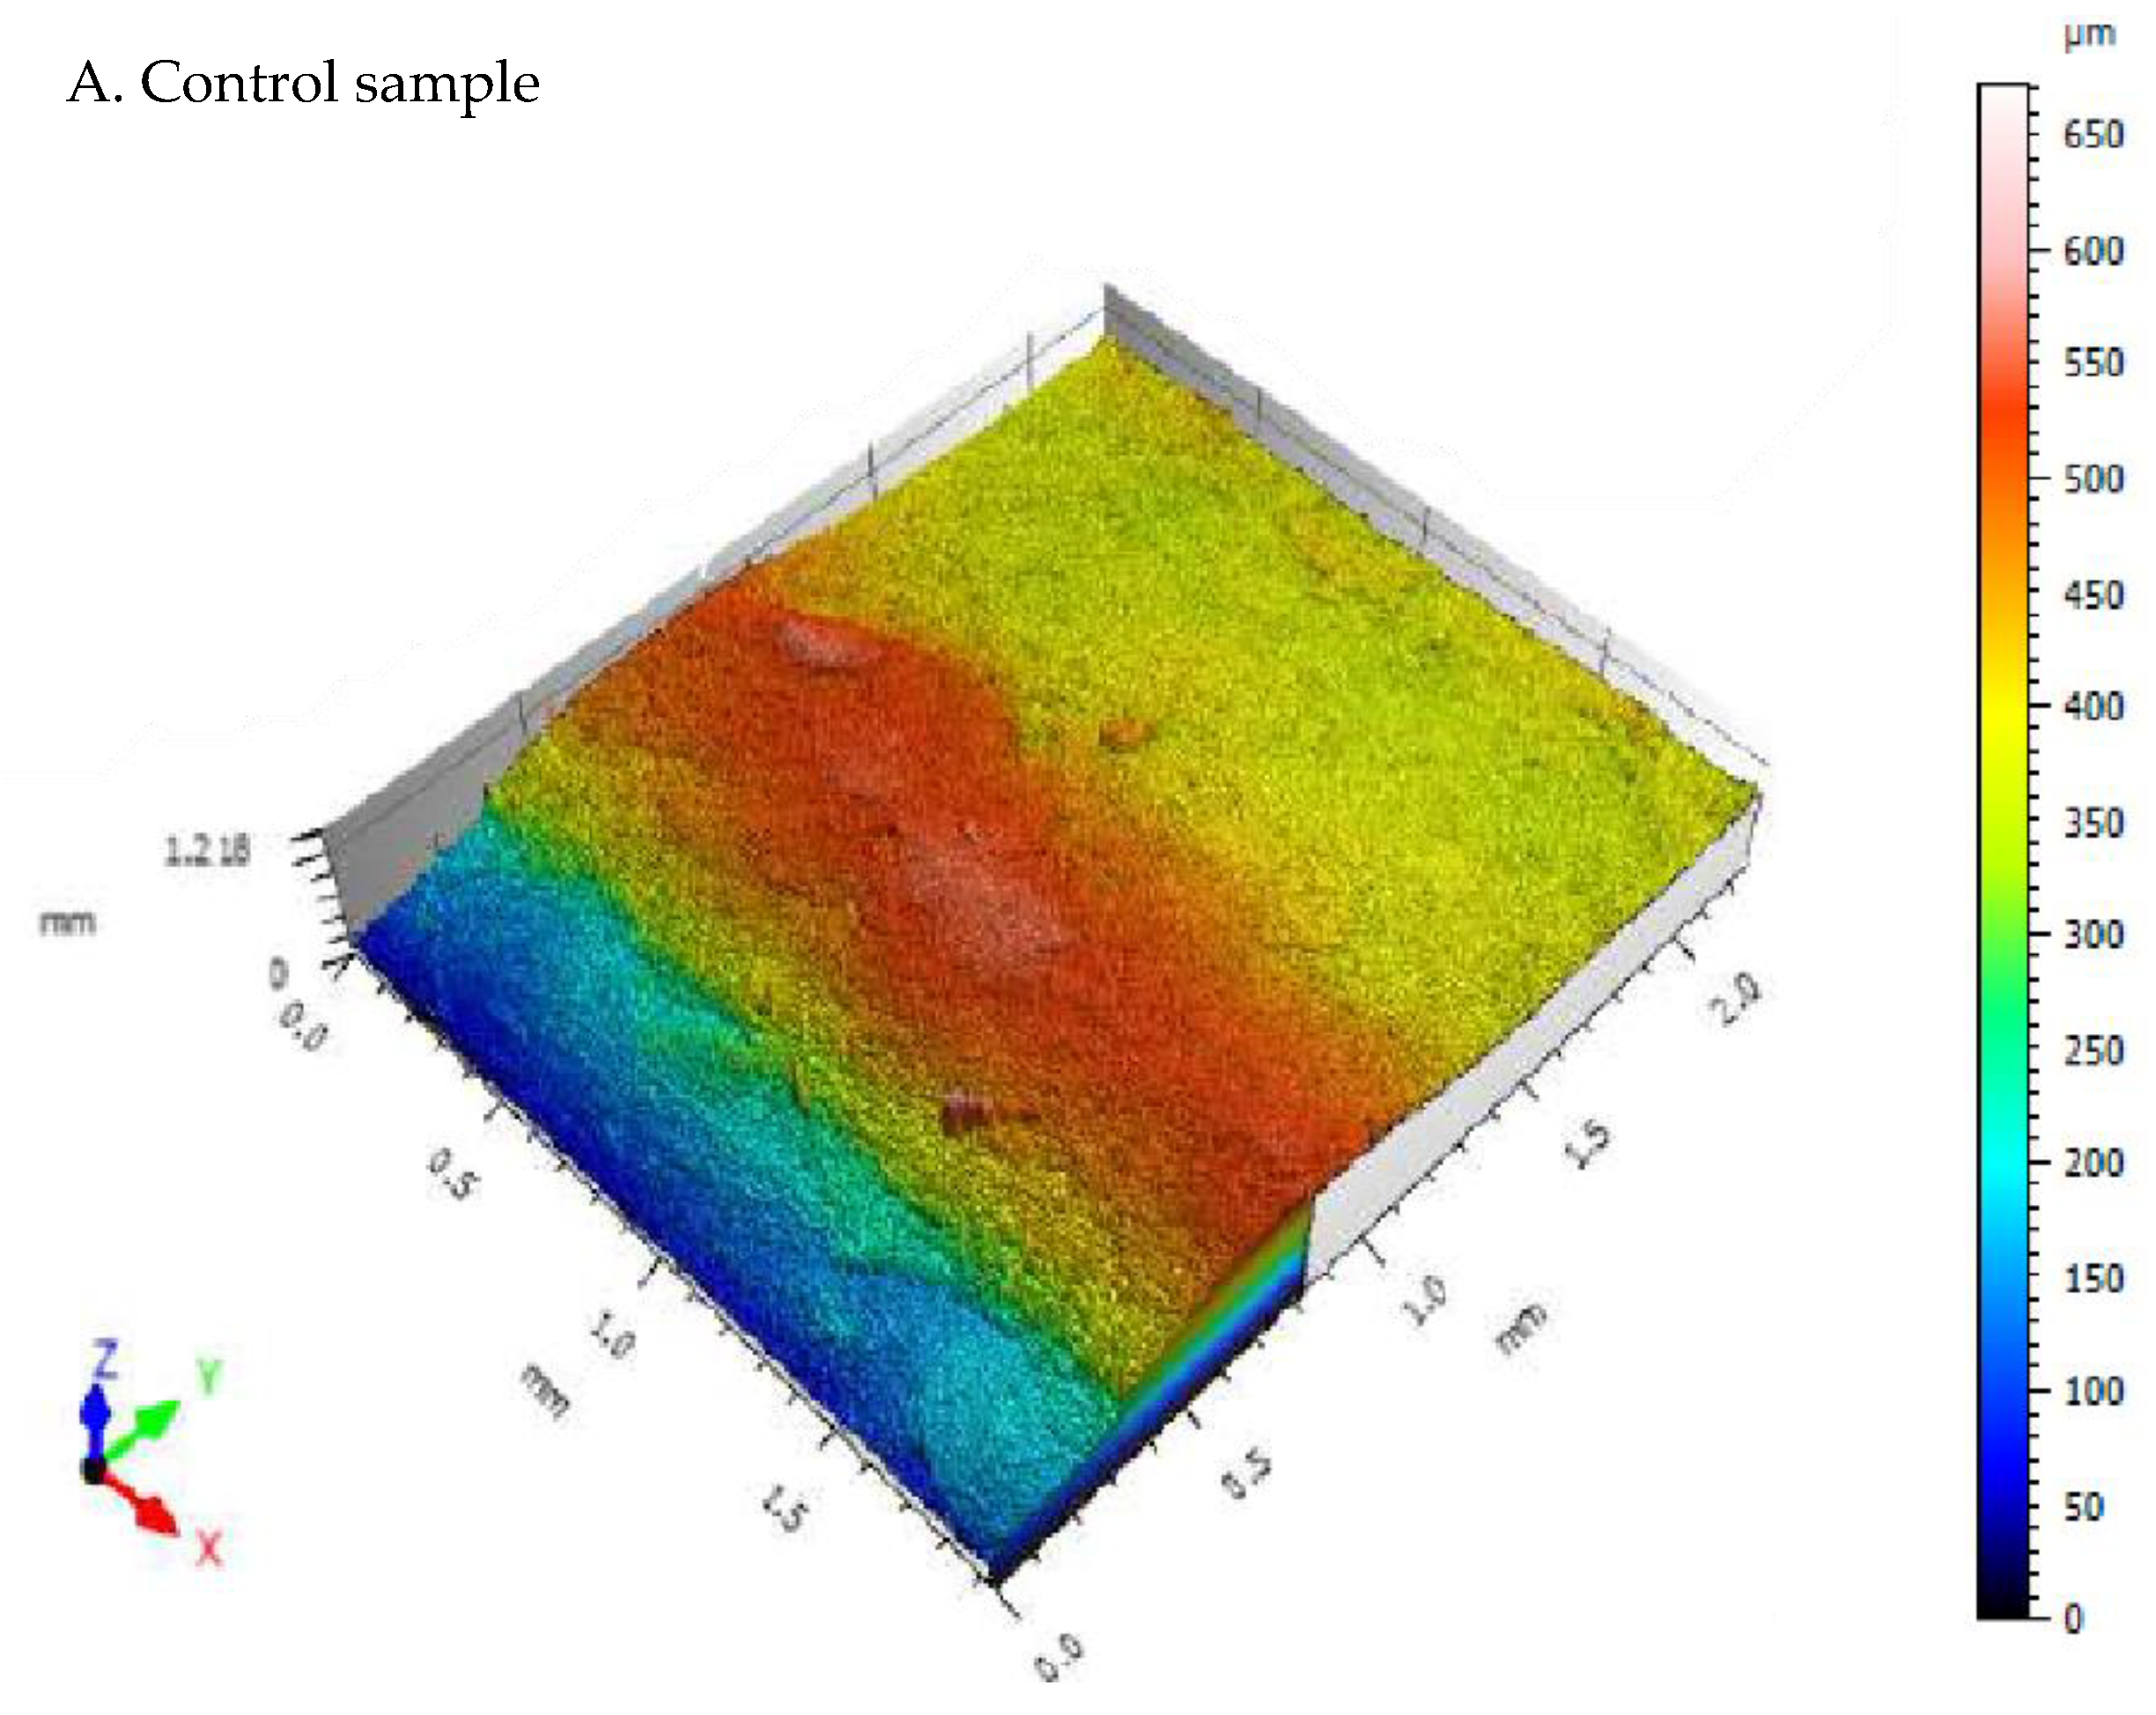
The microstructure of pasta with the addition of 5–20% spent grain and the control sample is presented in
Figure 5, where the axis x, y and z represent the length, height and width.
As can be observed from
Figure 5, the incorporation of spent grain in spelt flour pasta led a smooth surface without holes and cracks. Samples P1 and P2 show the most holes, without a significant difference between them (
Figure 5), while the P3 sample is the finest and with the lowest roughness (
Table 9). The roughness of the pasta is important because they make the pasta more suitable to retain the sauce. Roughness is correlated with the type of die insert material used and can be improved by drying at high temperatures. [
40]. The addition of grape-pears to the production of pasta caused a slight increase in roughness in the study carried out by Iuga and Mironeasa, 2021 [
13]. Schettino et al. obtained a lower roughness in pasta made with whole wheat compared with pasta made in addition with brewers spent grain [
31].
The rougher the surface of the dried pasta, the greater the solid content of cooking water. This explains the cooking behavior of high rough pasta by exposing a larger surface to the action of water during cooking, resulting in a greater amount of material released into the cooking water [
14].
Bousla et al. relieved a compact and homogenous starch–protein matrix in rice pasta enriched with vegetable flour which stabilized the uniform (integral) structure and minimized cooking loss obtained during hydration in hot water [
41].
Nocente et al. [
9] used 5–20 g spent grain/100 g to make pasta, and the finished product showed an increase in fiber up to 135%, in β-glucans up to 85% and total antioxidant capacity up to 19%. Enrichment with spent grain involved minimal effects on the sensory and physicochemical properties of cooked pasta [
9]. Cappa and Alampese used brewers spent grain in the production of fresh pasta to increase fiber intake and improve nutritional value by 6.2 g/100 g [
10]. Maqhuzu et al. have pointed out that the essential amino acid, lysine, is found in relatively large quantities in spent grain compared to other cereal products. They also concluded that, by adding 10% spent grain to a bread formulation (recipe), it can lead to an increase in protein content of up to 50%, an increase in fiber content of 10% and an essential increase in the amino acid content of 10% compared to conventional bread without spent grain [
42].


