Article

Selection of Suitable Genotypes of Lentil (Lens culinaris Medik.) under Rainfed Conditions in South Italy Using Multi-Trait Stability Index (MTSI)

by
Mohamed Houssemeddine Sellami
1,
Cataldo Pulvento
2,* and
Antonella Lavini
1
1
Institute for Agricultural and Forestry Systems in the Mediterranean (ISAFOM), National Research Council of Italy (CNR), 80055 Portici, Italy
2
Department of Agricultural and Environmental Science, University of Bari “A. Moro”, Via Amendola, 165/A, 70126 Bari, Italy
*
Author to whom correspondence should be addressed.
Agronomy 2021, 11(9), 1807; https://doi.org/10.3390/agronomy11091807
Submission received: 21 August 2021 / Revised: 2 September 2021 / Accepted: 7 September 2021 / Published: 8 September 2021
(This article belongs to the Section Crop Breeding and Genetics)

Abstract

:
Lentil (Lens culinaris Medik.) is a popular legume crop in the Mediterranean region, widely grown for its nutritious seeds and improving soil fertility. Lentil yield is a critical and challenging trait for crop genetic improvement because it is influenced by various factors that have detrimental effects on seed yields and seed quality traits. This research was carried out in Italy between 2017 and 2019 to identify high-performing stable genotypes presenting multiple desirable traits and to assess the seed quality of 13 lentil accessions in the field. According to the results of the multi-trait stability index (MTSI), (1) only three accessions (Altamura, Easton, and Caltagirone) fared better in various environmental conditions, and (2) the selected accessions had strength toward seed yield (SY), above-ground biomass (AGB), and 1000-seed weight (THS). The genotype × environment interaction (GEI) effects were highly significant for all traits. During the third growing season, most lentil accessions were sensitive to frost. There was no correlation between lentil seed yield and protein concentration. The MTSI is a useful tool for breeders interested in selecting accessions based on their mean performance and stability, as well as desirable traits and minimum multicollinearity issues.

1. Introduction

Lentil (Lens culinaris Medik.) is an annual leguminous plant and one of the oldest edible crops [1]. Lentil is indigenous to the Middle East [2]. The crop is best adapted for production in temperate climates but is now produced in many regions of the world [3]. Canada, India, and Australia are the primary producers of lentil, with the three countries producing approximately 68% of global lentil production in 2019 [4]. The cultivation of this legume has gradually increased in Italy during the last 20 years, from more than 1000 hectares to more than 5600 hectares [5,6]. In 2020, more than 5612 hectares were cultivated in Italy for a total production of 4.98 thousand tons, with an average of around 0.89 tons per hectare [5]. The interest in grain legumes, which are a major alternative source of protein to meat for the future, is increasing at present [7,8,9].
The lentil suffers considerable yield losses, similar to other crops, because of various biotic and/or abiotic stresses [10]. The lentil is a species that is generally grown in dry conditions and often faces water deficit during key growth stages [6]. Furthermore, lentil is sensitive to salinity that is magnified in arid and semiarid regions [11]. The salinity tolerance limits are between 8.4 and 13.1 mS cm−1 [6]. Lentil also faces temperature extremes during its life cycle, particularly heat stress [12], and is severely affected by long and intense frosts during reproductive growth [6].
Lentil plays a significant role in human nutrition and the environment, to reduce reliance on non-renewable resources and chemicals [13] and improves the soil fertility [14]. Because of its symbiotic relationship with rhizobium, it can fix atmospheric nitrogen (N2), minimizing the demand for synthetic nitrogen fertilizers.
Lentil is a high-nutritional food. It has a protein content that can reach up to 30%; the presence of vitamins is also appreciable, particularly of the B group. Iron is present to a greater extent than in wheat and rice kernels [15]. Lentil seeds represent a low-cost source of protein and starch, with the advantage of being resistant to starch when compared to cereal, root, and tuber starch [16].
Currently, in Italy, this legume is mainly cultivated in the central and southern marginal areas and on a few small islands [17]. One of the primary causes of the decline of lentil cultivation in the twentieth century in Italy is the lack of improved cultivars [18]. The genetic activity improvement in this species was not particularly prominent and was related to the assessment of the genetic variability in the Italian and foreign germplasms only after the mid-1980s [18]. Another reason for the limitations to the expansion of lentil cultivation in Italy is represented by the difficulty in finding the seeds of local ecotypes and their poor stability in different environmental conditions. Lentil landraces are generally being maintained in traditional farming systems by obtaining traditional seeds from generation to generation [15].
The main goals of lentil genetic improvement are production stability, seed quality, and higher nitrogen fixation efficiency. A rigorous genetic selection activity has recently been developed to select lentil varieties rich in protein and appropriate for mechanization [18]. Breeding plans for multiple trait improvement projects in lentils must take into account more than one trait [19]. However, these lentil breeding programs based on gathering multiple traits together in one new genotype are limited by the choice of germplasm and the genetics and genetic relationships among the traits under selection [19,20].
This led to the development of a vast number of statistical procedures to select superior genotypes such as the Smith-Hazel index [21], multi-trait genotype-ideotype distance index [20], multi-trait index based on ideotype design [22], and multi-trait stability index (MTSI) [23].
The MTSI is a selection index that utilizes the mean performance and stability of the genotype for multiple trait selection [24]. It is based on factor analysis, with each ideotype’s factorial scores designed according to desirable and undesirable factors. Then, depending on the accession-ideotype distance, a spatial probability is computed, enabling accession ranking. The accession with the lowest MTSI is hence closer to the ideotype and exhibits greater mean performance and stability across all variables analyzed [23].
Based on this context, the current study intends to (1) identify the stable accession of lentil for cultivation in South Italy under varied environmental conditions using MTSI indices and (2) evaluate the quality parameters of 13 lentil accessions over 3 consecutive years.

2. Materials and Methods

2.1. Experimental Site

A field screening experiment was conducted between 2017 and 2019 at the experimental research station of CNR-ISAFoM in Vitulazio (Caserta, Italy) (41°12′ N and 14°20′ E, 23 m above the sea level).
The climate is Mediterranean and subhumid, with an average annual rainfall of 897 mm over 43 years, with the majority of rain falling in the autumn and winter (October–March). Between 1976 and 2019, the average annual reference evapotranspiration estimated by the Penman–Monteith equation [25] in the region was 1074 mm. The soil type was Mollic Haplaquept [26] clay-loam.

2.2. Agronomic Management and Experimental Design

During the three growing seasons, the lentil accessions widely cultivated in Italy’s marginal areas (Table 1) were sown on November 29, December 11, and November 26, respectively. For all growing seasons, harvesting occurred in June and July. The plot was 3 m2 (with 0.4 m row spacing and 0.10 m between two plants) and sown at a rate of 25 plants m−2. The sowing was carried out involving a randomized complete block design (RCBD) with three replicates. All accessions were grown under field conditions. Seeds were prepared prior to sowing by light soil cultivation followed by arrowing at the end of summer.

2.3. Measurements

At maturity, a 1 m2 subplot in the center of each plot was hand-harvested to determine seed yield (SY), 1000-seed weight (THS), and above-ground biomass (AGB). The harvest index (HI) was computed as the ratio of SY to AGB. The hierarchical cluster analysis (HCA) for seed samples (200 g) from subplots harvested in 2017 was chemically analyzed. The Kjeldahl method was used to determine the crude protein concentration (AOAC 920.152). The Jones factor was used to convert it to protein (6.25) [27]. Then, by multiplying the protein concentration by the harvested yield, the protein yield was determined (g m−2). Raw fat was determined using the AOAC 922.06 method [28]. Additionally, the ash content was evaluated using the AOAC 900.02 method (international). The Ewers polarimetric method (ISO 10520:1997(E)) was used to determine the starch content.

2.4. Statistical Analysis

The data obtained during the course of the three-year study period were analyzed using an RCBD. The normal distribution of each dependent variable was determined using the Shapiro–Wilk test. If the assumption of normality was violated, we transformed the data using the Box–Cox transformation [29].
Yield and morphologic parameters data were evaluated using a mixed model via restricted residual maximum likelihood/best linear unbiased prediction (REML/BLUP), according to Henderson [30]. Conversely, the weighted average of absolute scores (WAASB) obtained from the singular value decomposition of the matrix of BLUP for GEI effects [31] generated by a linear mixed-effect model was used to measure the stability of 13 lentil accessions conducted in 3 growing seasons.
The WAASBY index [23] that provides for the weighting between mean performance (i.e., SY) and stability (WAASB) of individual traits was then computed.
The MTSI is used to rank and select accessions. In the current work, the accession selection aimed at selecting accessions with higher values (positive gains) for SY, THS, AGB, and HI. The software package metan-MET analysis [32] in the RStudio software [33] was used to carry out these approaches. Both environment (growing seasons) and accession were regarded as random effect.
The yield and morphologic parameters were subjected to principal component analysis (PCA) in order to determine the patterns of variation among the factors and to choose the best-adapted accessions. The PCA outputs incorporated variable loading for each selected component as well as component scores. This analysis was conducted using the software package FactoMineR [34] within the RStudio software [33].
The Spearman correlation has been used to determine the correlation between yield, morphologic parameters, and seed quality factors. This analysis was conducted using the software package Corrplot [35] within the RStudio software [33].
Using the package clValid [36] in the RStudio software [33], the HCA was conducted using a single linkage approach that utilized Euclidean distances to determine seed quality parameters (fat, ashes, starch, protein concentration, and protein yield).

3. Results

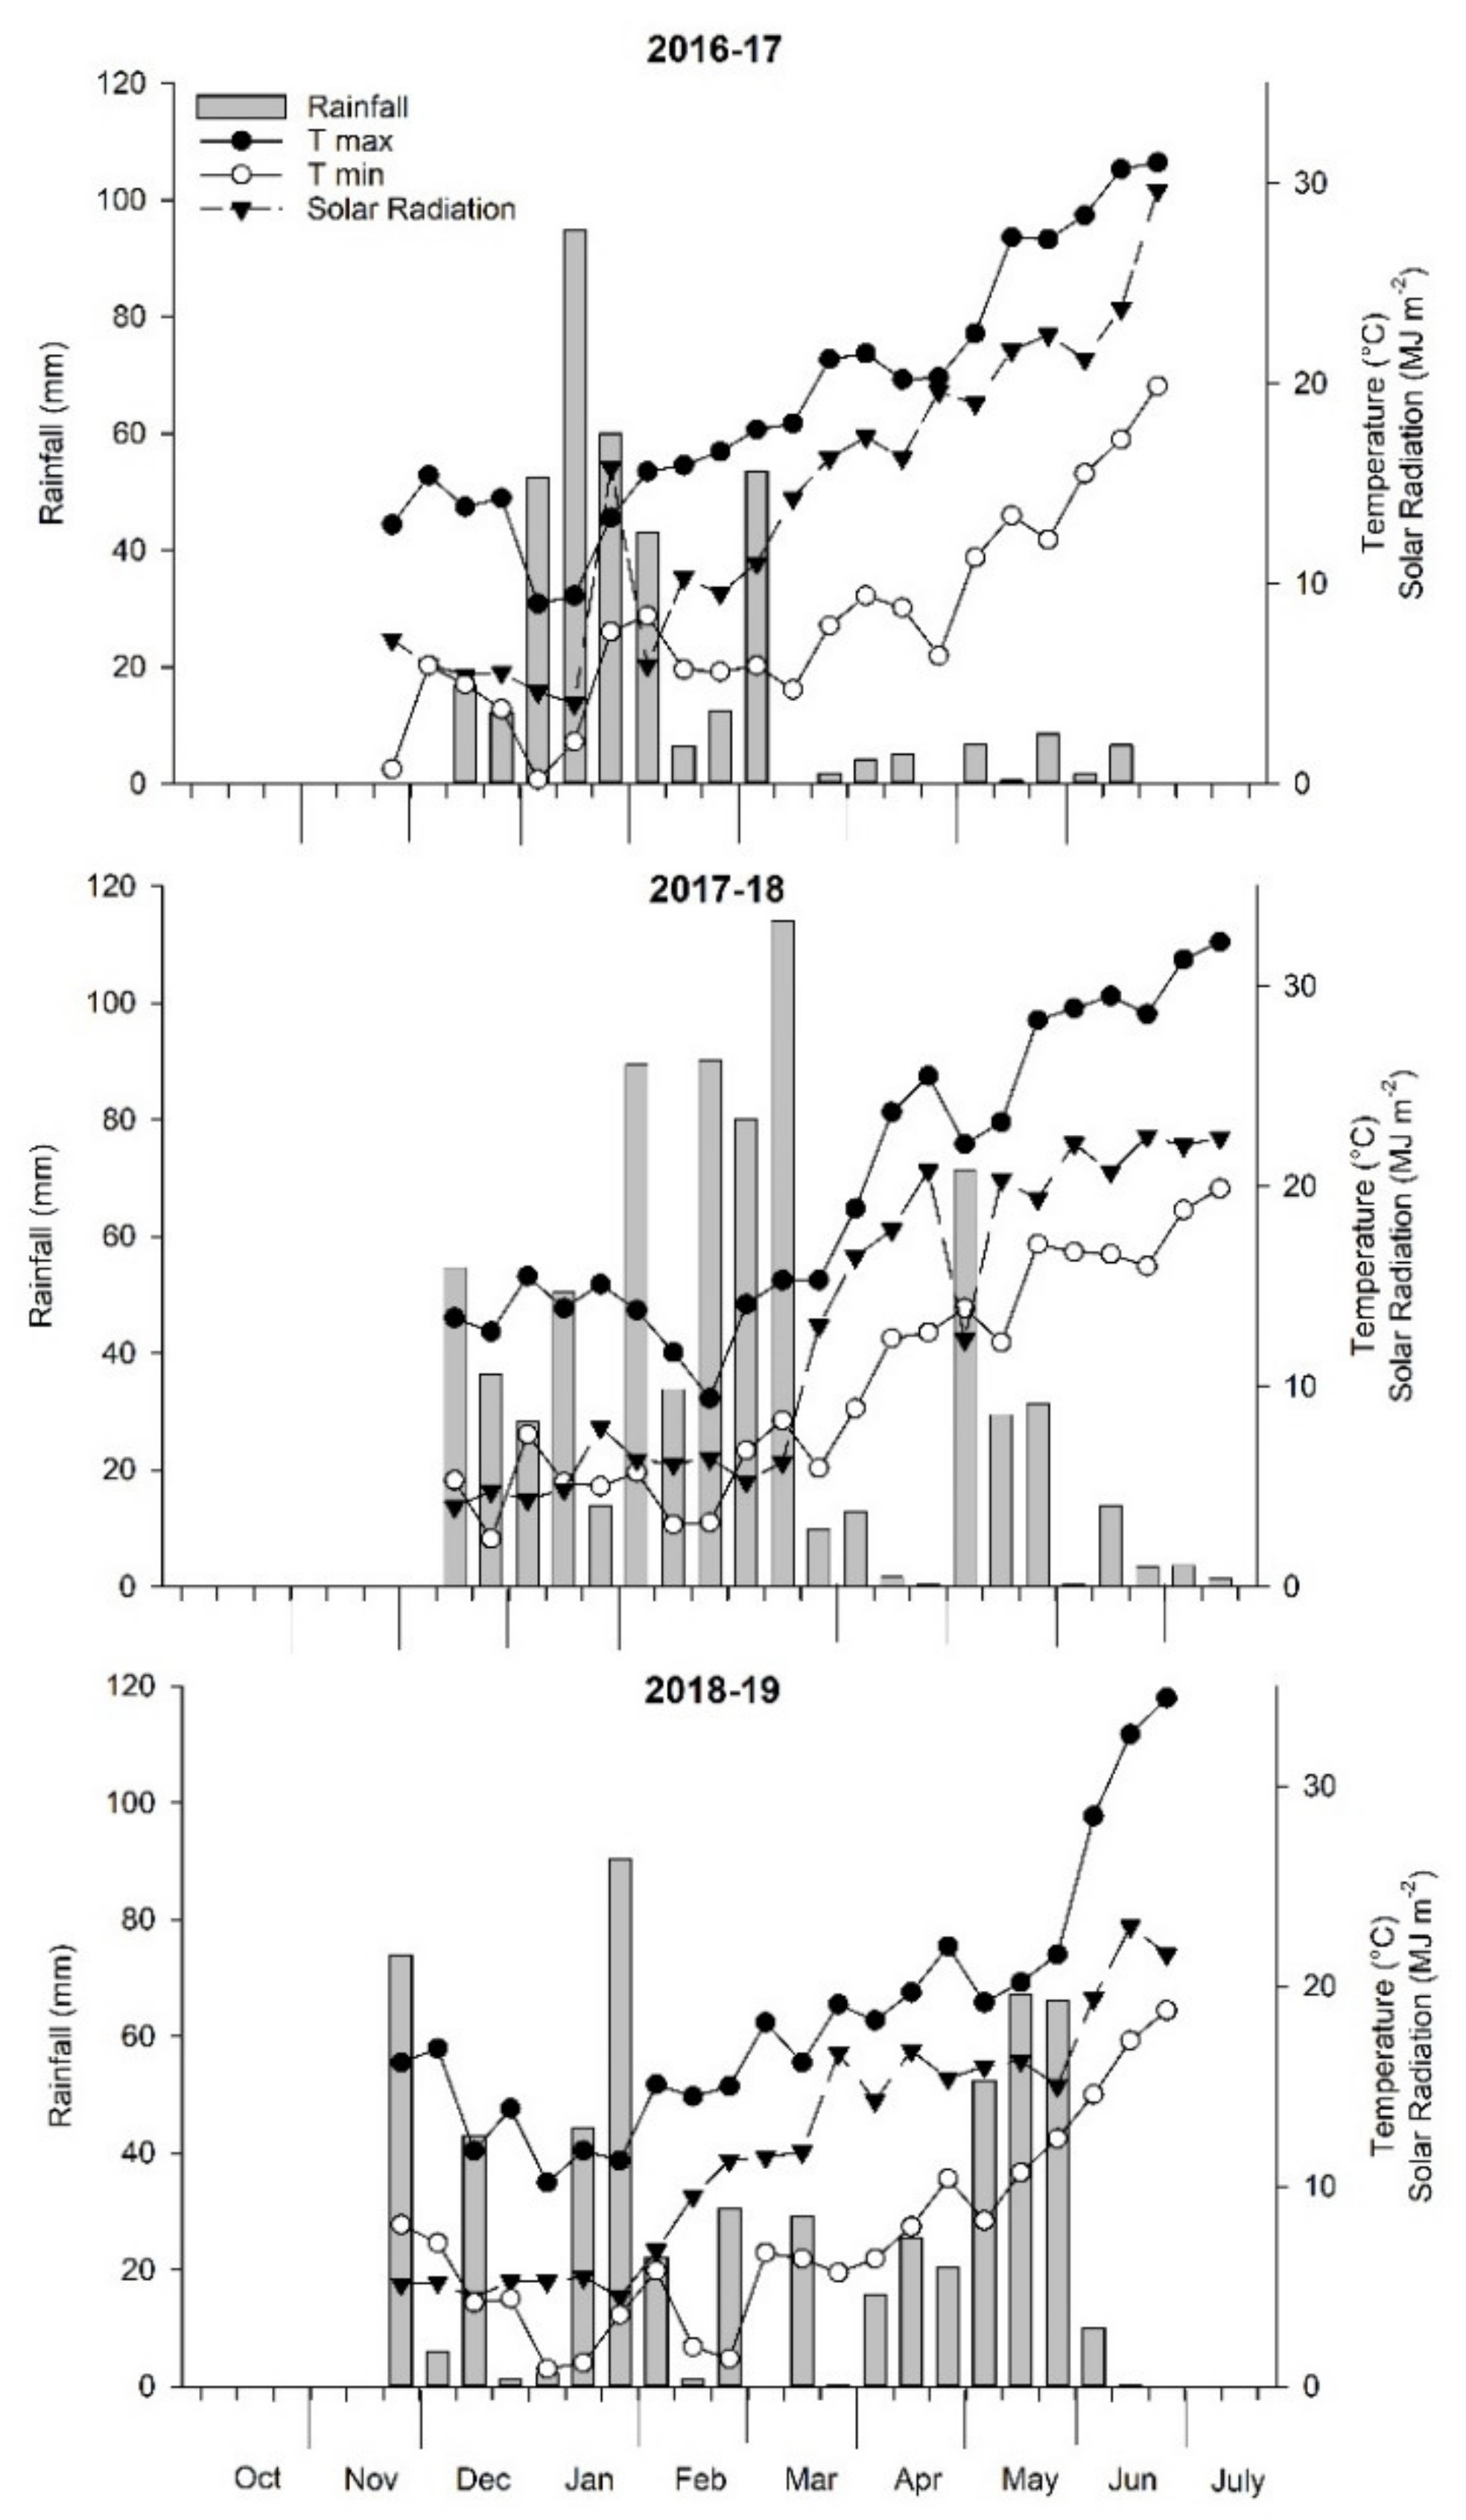
3.1. Climatic Conditions

Figure 1 illustrates the variation in climatic parameters over years. Seasonal precipitation ranged from 388 to 810 mm in the first and third growth seasons, respectively, while in the second year, 770 mm was recorded. Gibbs and Maher [37] classified, using their decile index (DI), the second and third growing seasons as normal (DI = 9 and 9, respectively) and the first season as weak dry (DI = 4).
During the third growing season, the average maximum temperature (Tmax) was similar to the 43-year (1976–2019) average value (18.92 °C). However, in the first and second growing seasons it was 0.28 and 1.19 greater, respectively.
When compared to the two previous growing seasons, the winter season (December–February) of 2018–2019 was colder than usual. It was 1.50 °C and 1.27 °C cooler than the same period in 2017 and 2018, respectively. For 10, 8, and 12 days in 2017, 2018, and 2019, respectively, the total average minimum temperature (Tmin) was below 0 °C. Furthermore, during flowering (March), the minimum temperature fell below 0 °C for one day in the first and third growing seasons.
This was evident in January 2019 (Vegetative stage), when the mean air temperature was 3.3 °C, approximately 0.43 and 3.88 °C lower than in January 2017 and 2018, respectively. The overall average maximum temperature in March 2017 (Flowering stage) was 18.97 °C, approximately 4.07 and 1.13 degrees higher than in March 2018 and 2019, respectively.
During the first growth season, the overall average solar radiation was 0.942 and 2.74 MJ/m2/day greater than 2018 and 2019 growing seasons, respectively.

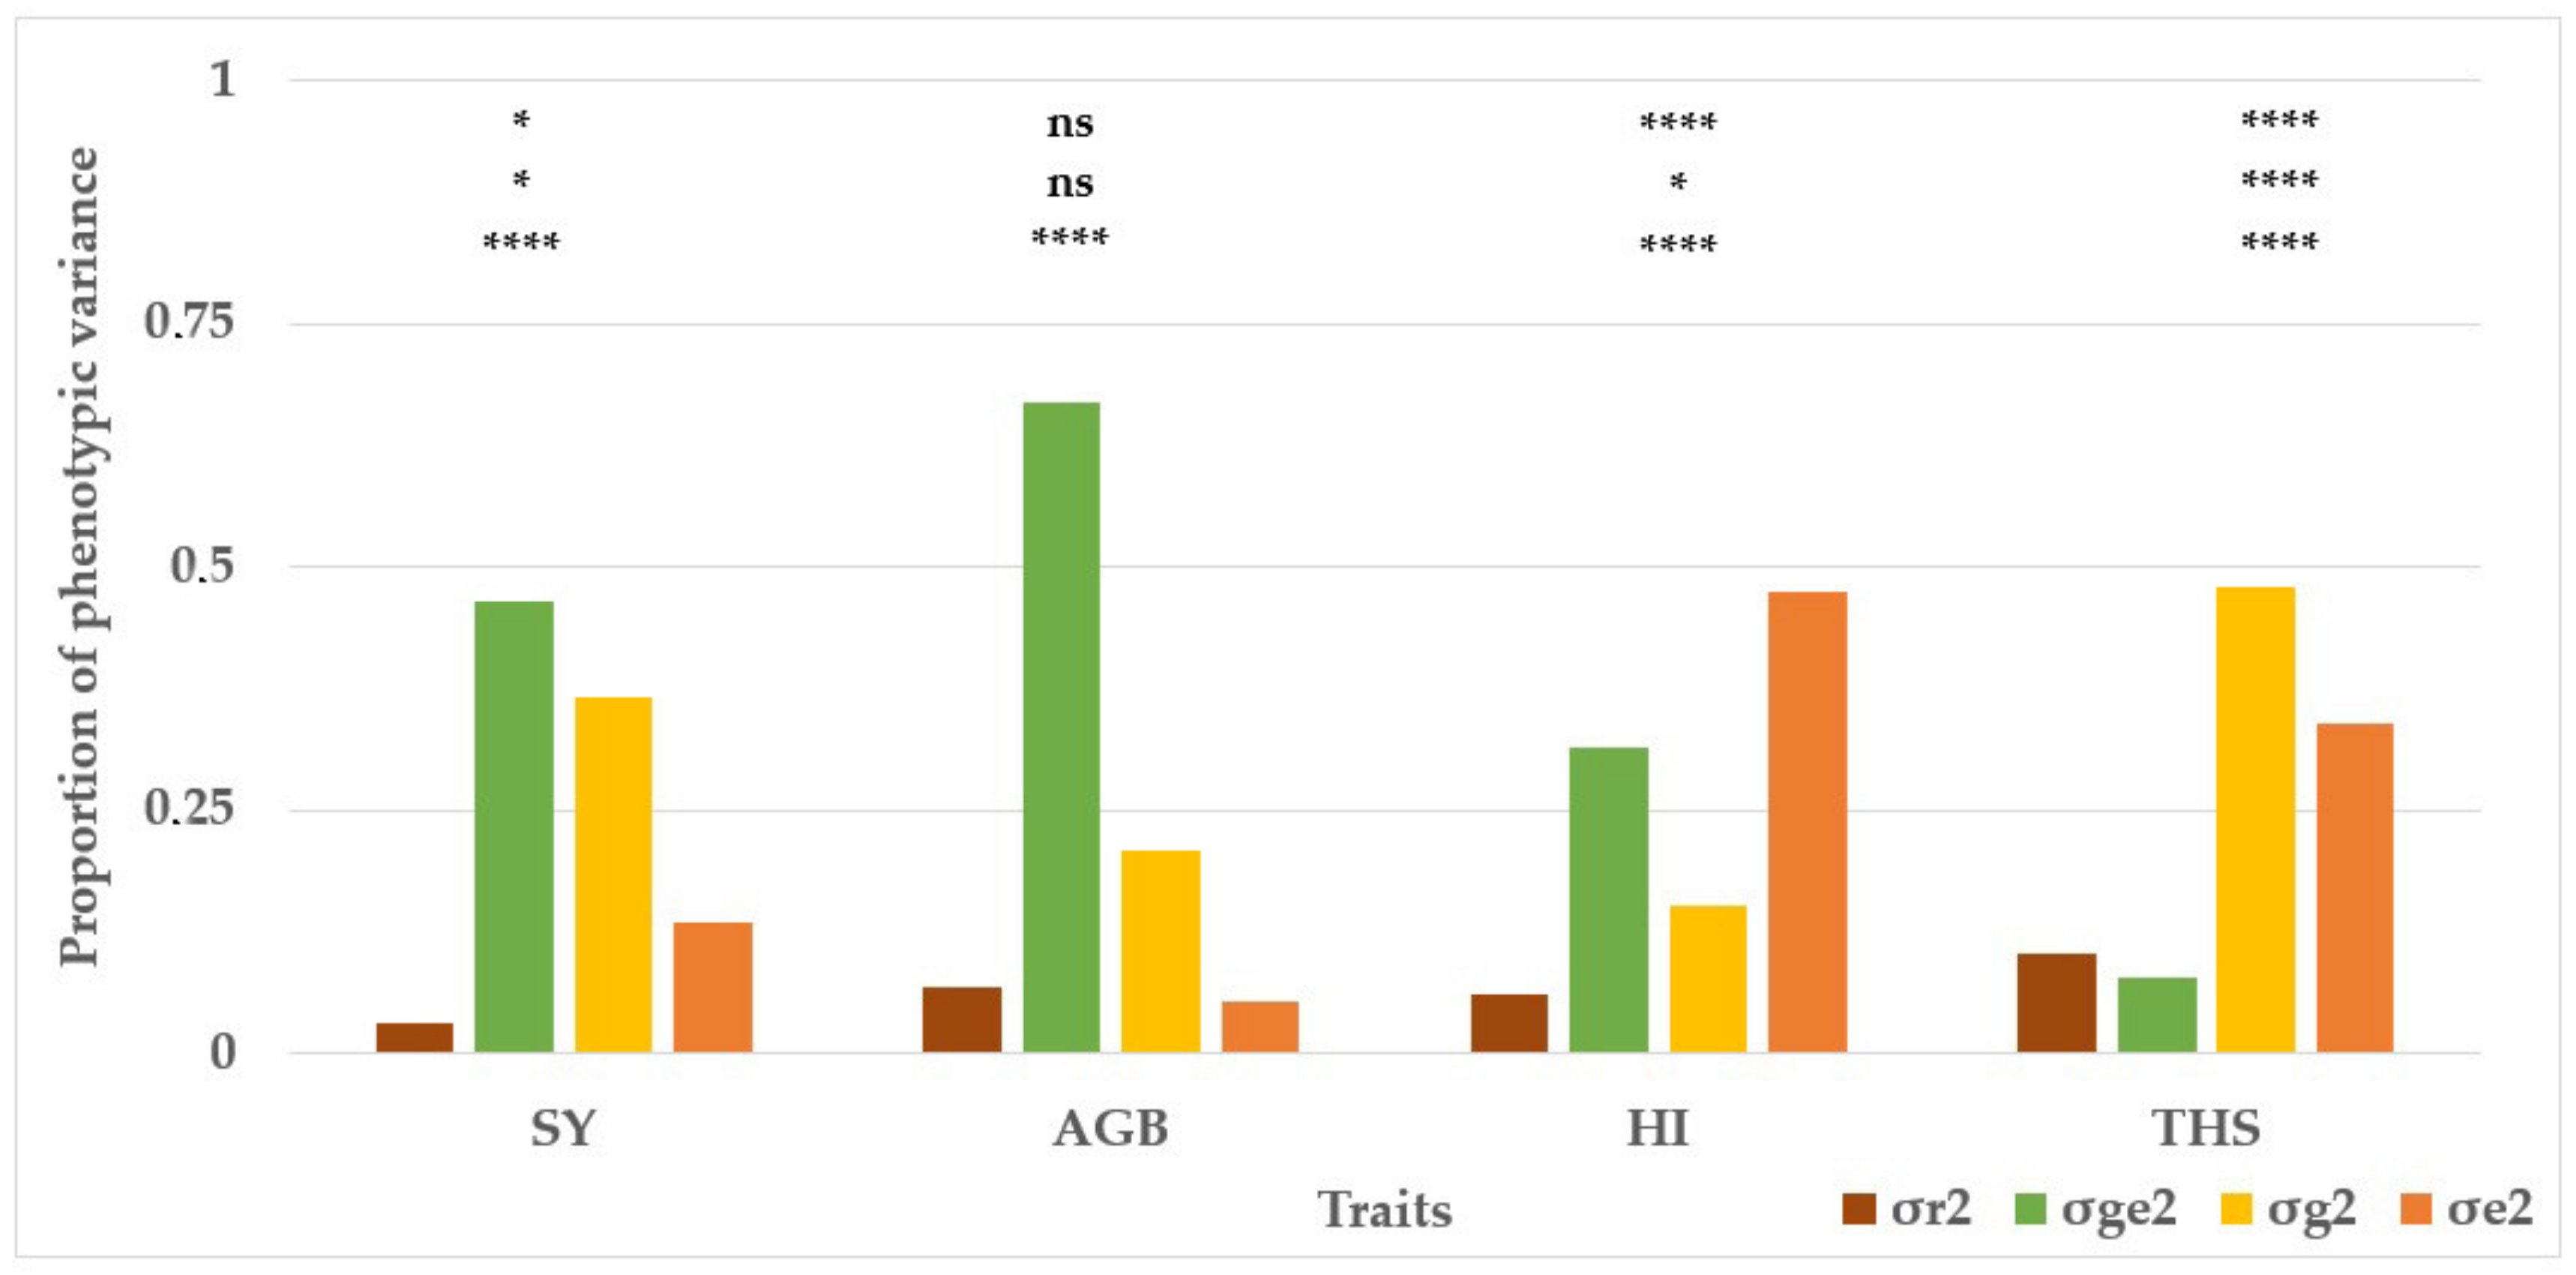
3.2. Likelihood-Ratio Tests and Variance Components

The likelihood-ratio test revealed that only SY, HI, and THS had a significant genotype and environmental effect (Figure 2). The GEI effects were highly significant for all variables (Figure 2). The SY, HI, and THS values varied significantly between years (Table 2), with the maximum values of SY and HI being reported in the second season, while those of THS were recorded in the first season, and the third season reported the lowest values for all of them. The year’s impact was also visible in the AGB, which reached its highest values in 2019. (Table 2). The average SY of the three growing seasons was 104 ± 69 g/m2 (Table 2), and the SY declined by 13.95% and 44.96%, when compared to the first and third seasons, respectively. The AGB decreased by 21.53% and 24.53% in the first and second seasons, respectively, when compared to the third season (Table 2). Both genotype (47.99%) and environmental (33.97%) effects accounted for the largest proportion of variance in THS (Figure 2). Genotype and GEI had larger effects on SY, accounting for 36.54% and 46.54% of the total variation, respectively (Figure 2). The GEI variance (σge2) was greater than the genotypic (σg2) and residual variance (σr2, Figure 2) for all traits, except for THS and HI.

3.3. Principal Component Analysis

Principal component analysis (PCA) was used to determine lentil yield, yield components, and weather parameters across three consecutive growing seasons. With eigenvalues greater than one, the first two principal components (PCs) explained 82.47% of the total variance, with PC1 accounting for 53.98% and PC2 accounting for 28.49% (Figure 3). PC1 was correlated positively (>0.6) with SY, THS, and HI. Increased AGB was revealed to have a positive correlation with PC2 (Figure 3). The study asserts that 2019’s disastrous agricultural production was primarily caused by frost, both in the winter and spring (only high AGB was recorded during this season). The three worst performing lentil accessions, according to productivity, were the G5 (TIPO CASTELLUCCIO PlCCOLE), G9 (Mountain Lentil #2), and G13 (di Colliano) (Figure 3).

3.4. Productivity Performance and Stability

Figure 4 represents the SY performance and stability of 13 lentil accessions evaluated during three consecutive growing seasons. The WAASBY index (WAASB/GY ratio) enables the analysis of how genotype rankings vary in response to the weights assigned to performance (SY) and stability (WAASB index). The ranks obtained with a ratio of 100/0 exclusively consider the stability for genotype ranking. Conversely, a ratio of 0/100 exclusively considers the productivity for genotype ranking [31]. The accessions were classified into four groups with similar stability and productivity performance.
Group 1 included G1 and G11, which are poorly productive and unstable genotypes. Group 2 included unstable genotypes with high SY, being well ranked when the WAASB/GY ratio was low (greater weight for productivity). The accessions G3, G4, and G6 were included in this group. Group 3 contained three accessions, G2, G10, and G12, which are extremely productive and adaptable accessions. Accessions within group 4 (G5, G7, G8, G9, and G13) were stable but low-productive genotypes because they were well ranked when the WAASB/GY ratio was high (greater weight for stability; Figure 4).

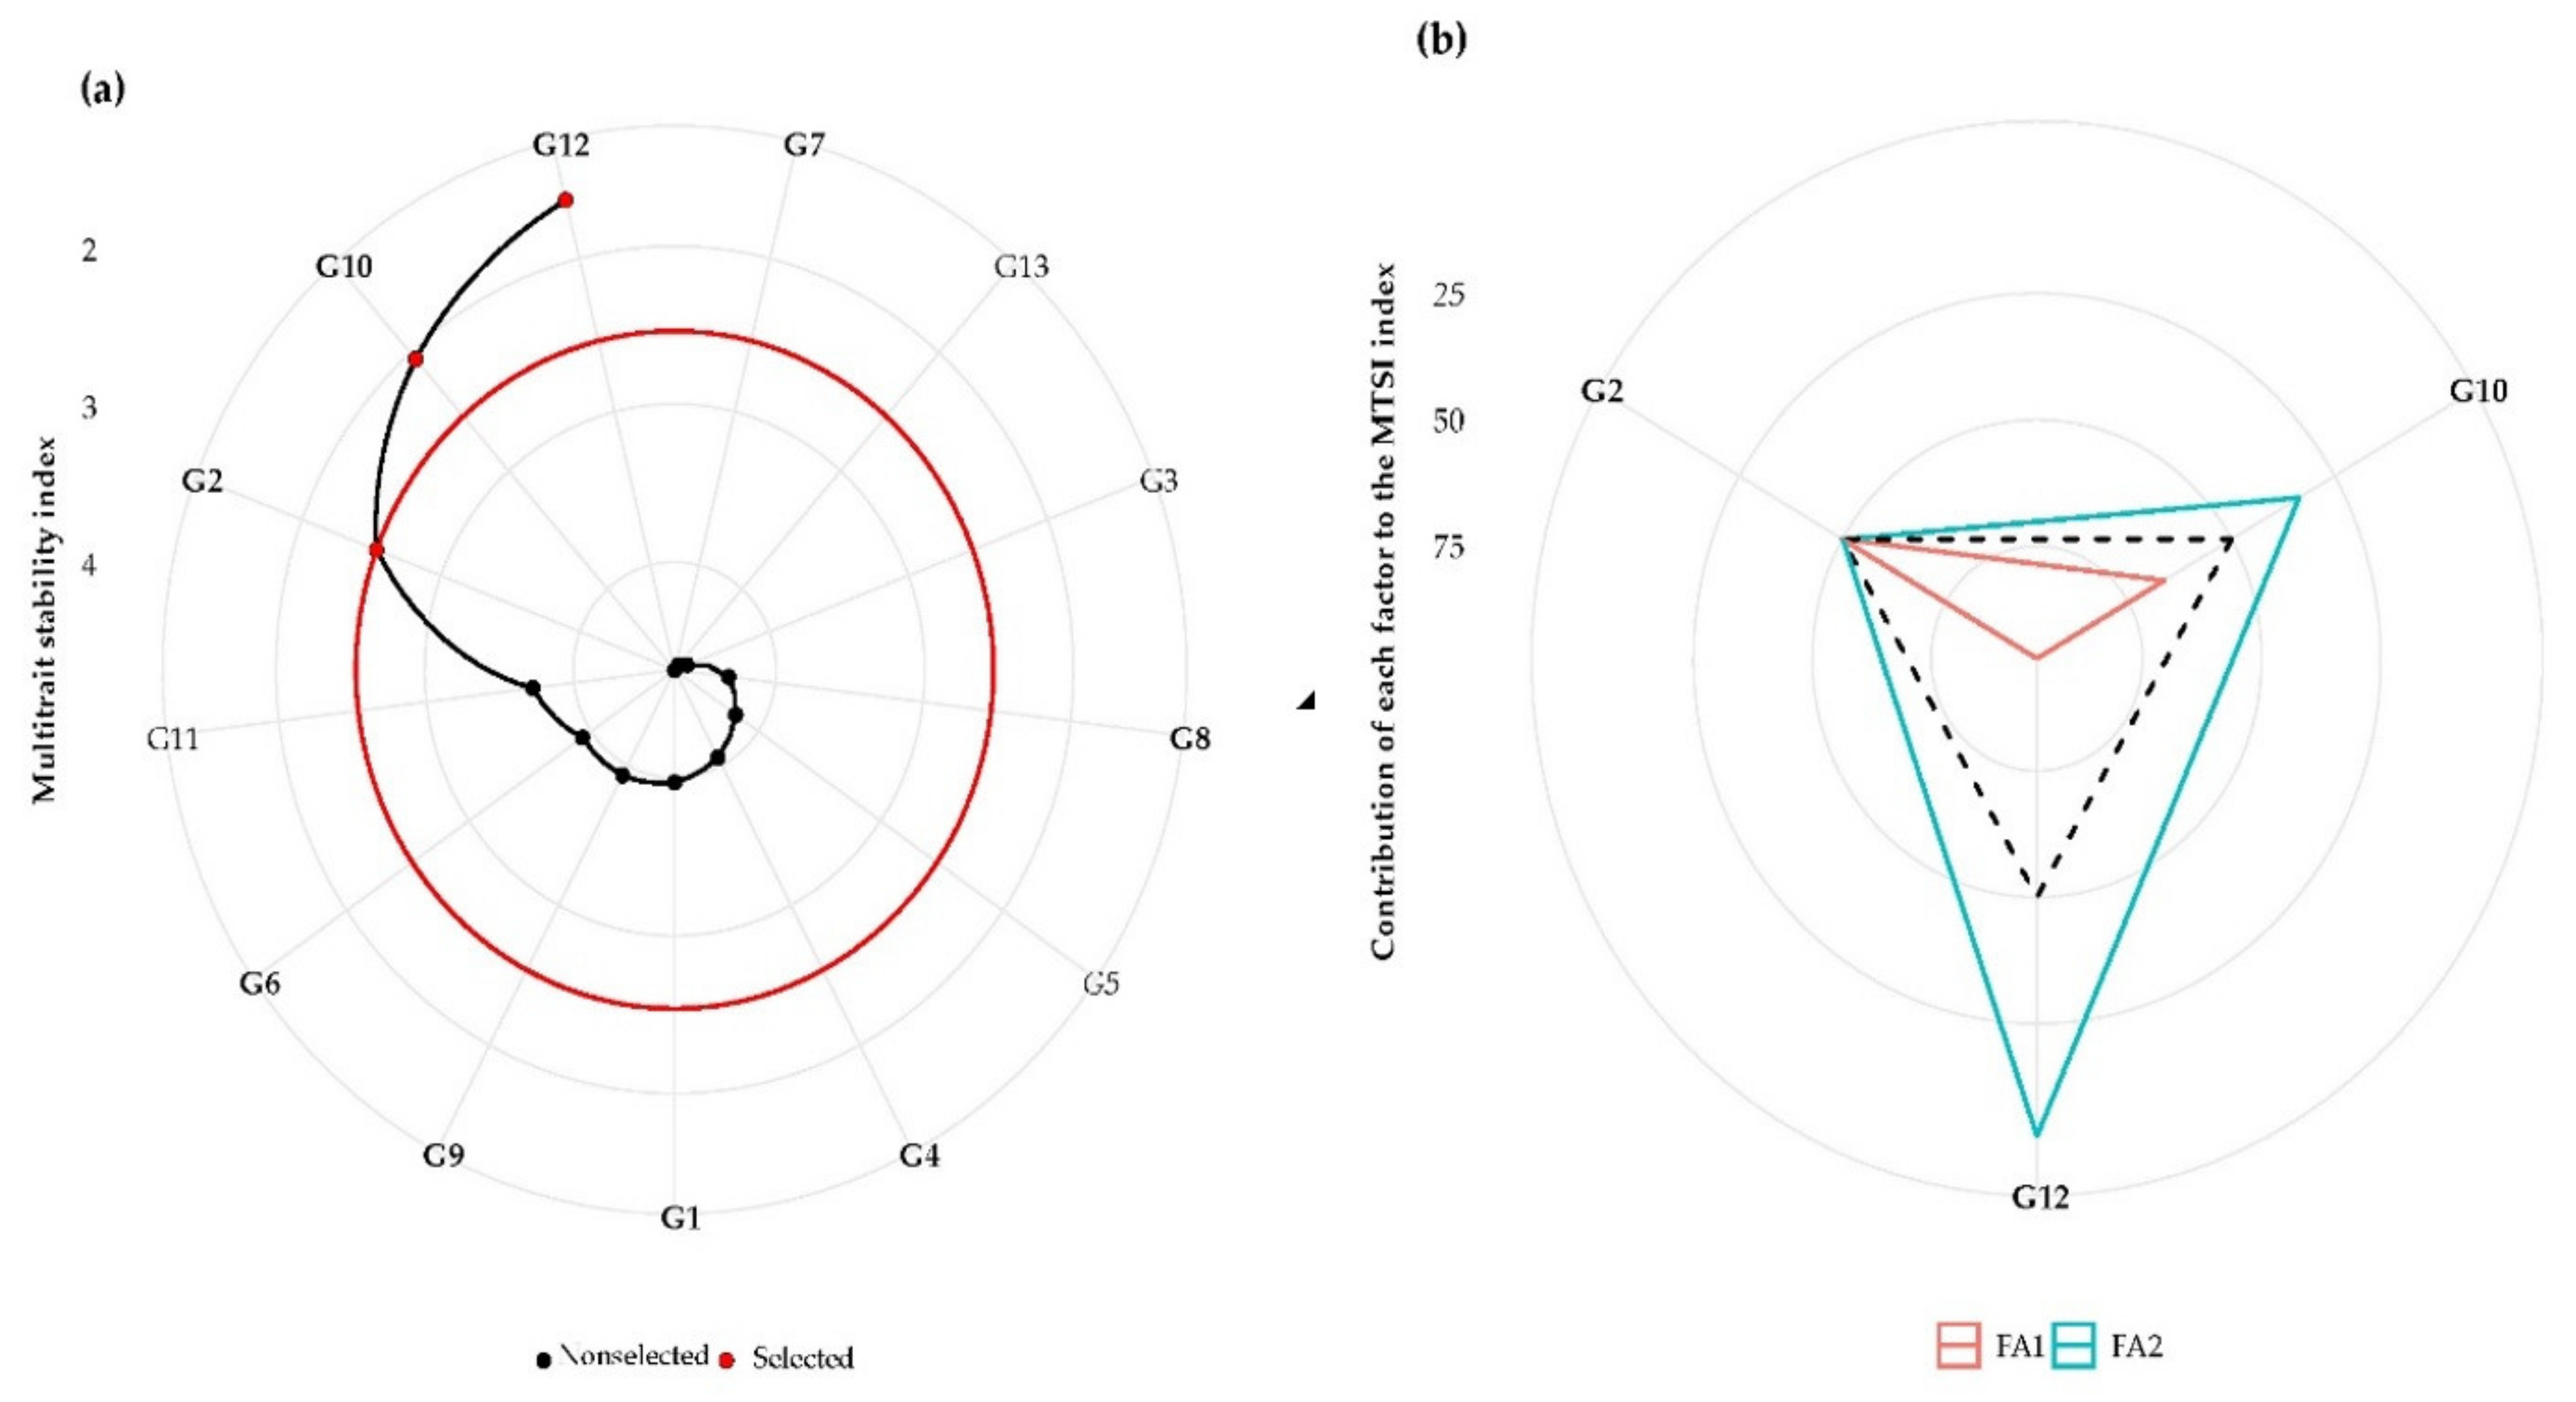
3.5. Multiple Trait Mean Performance and Stability
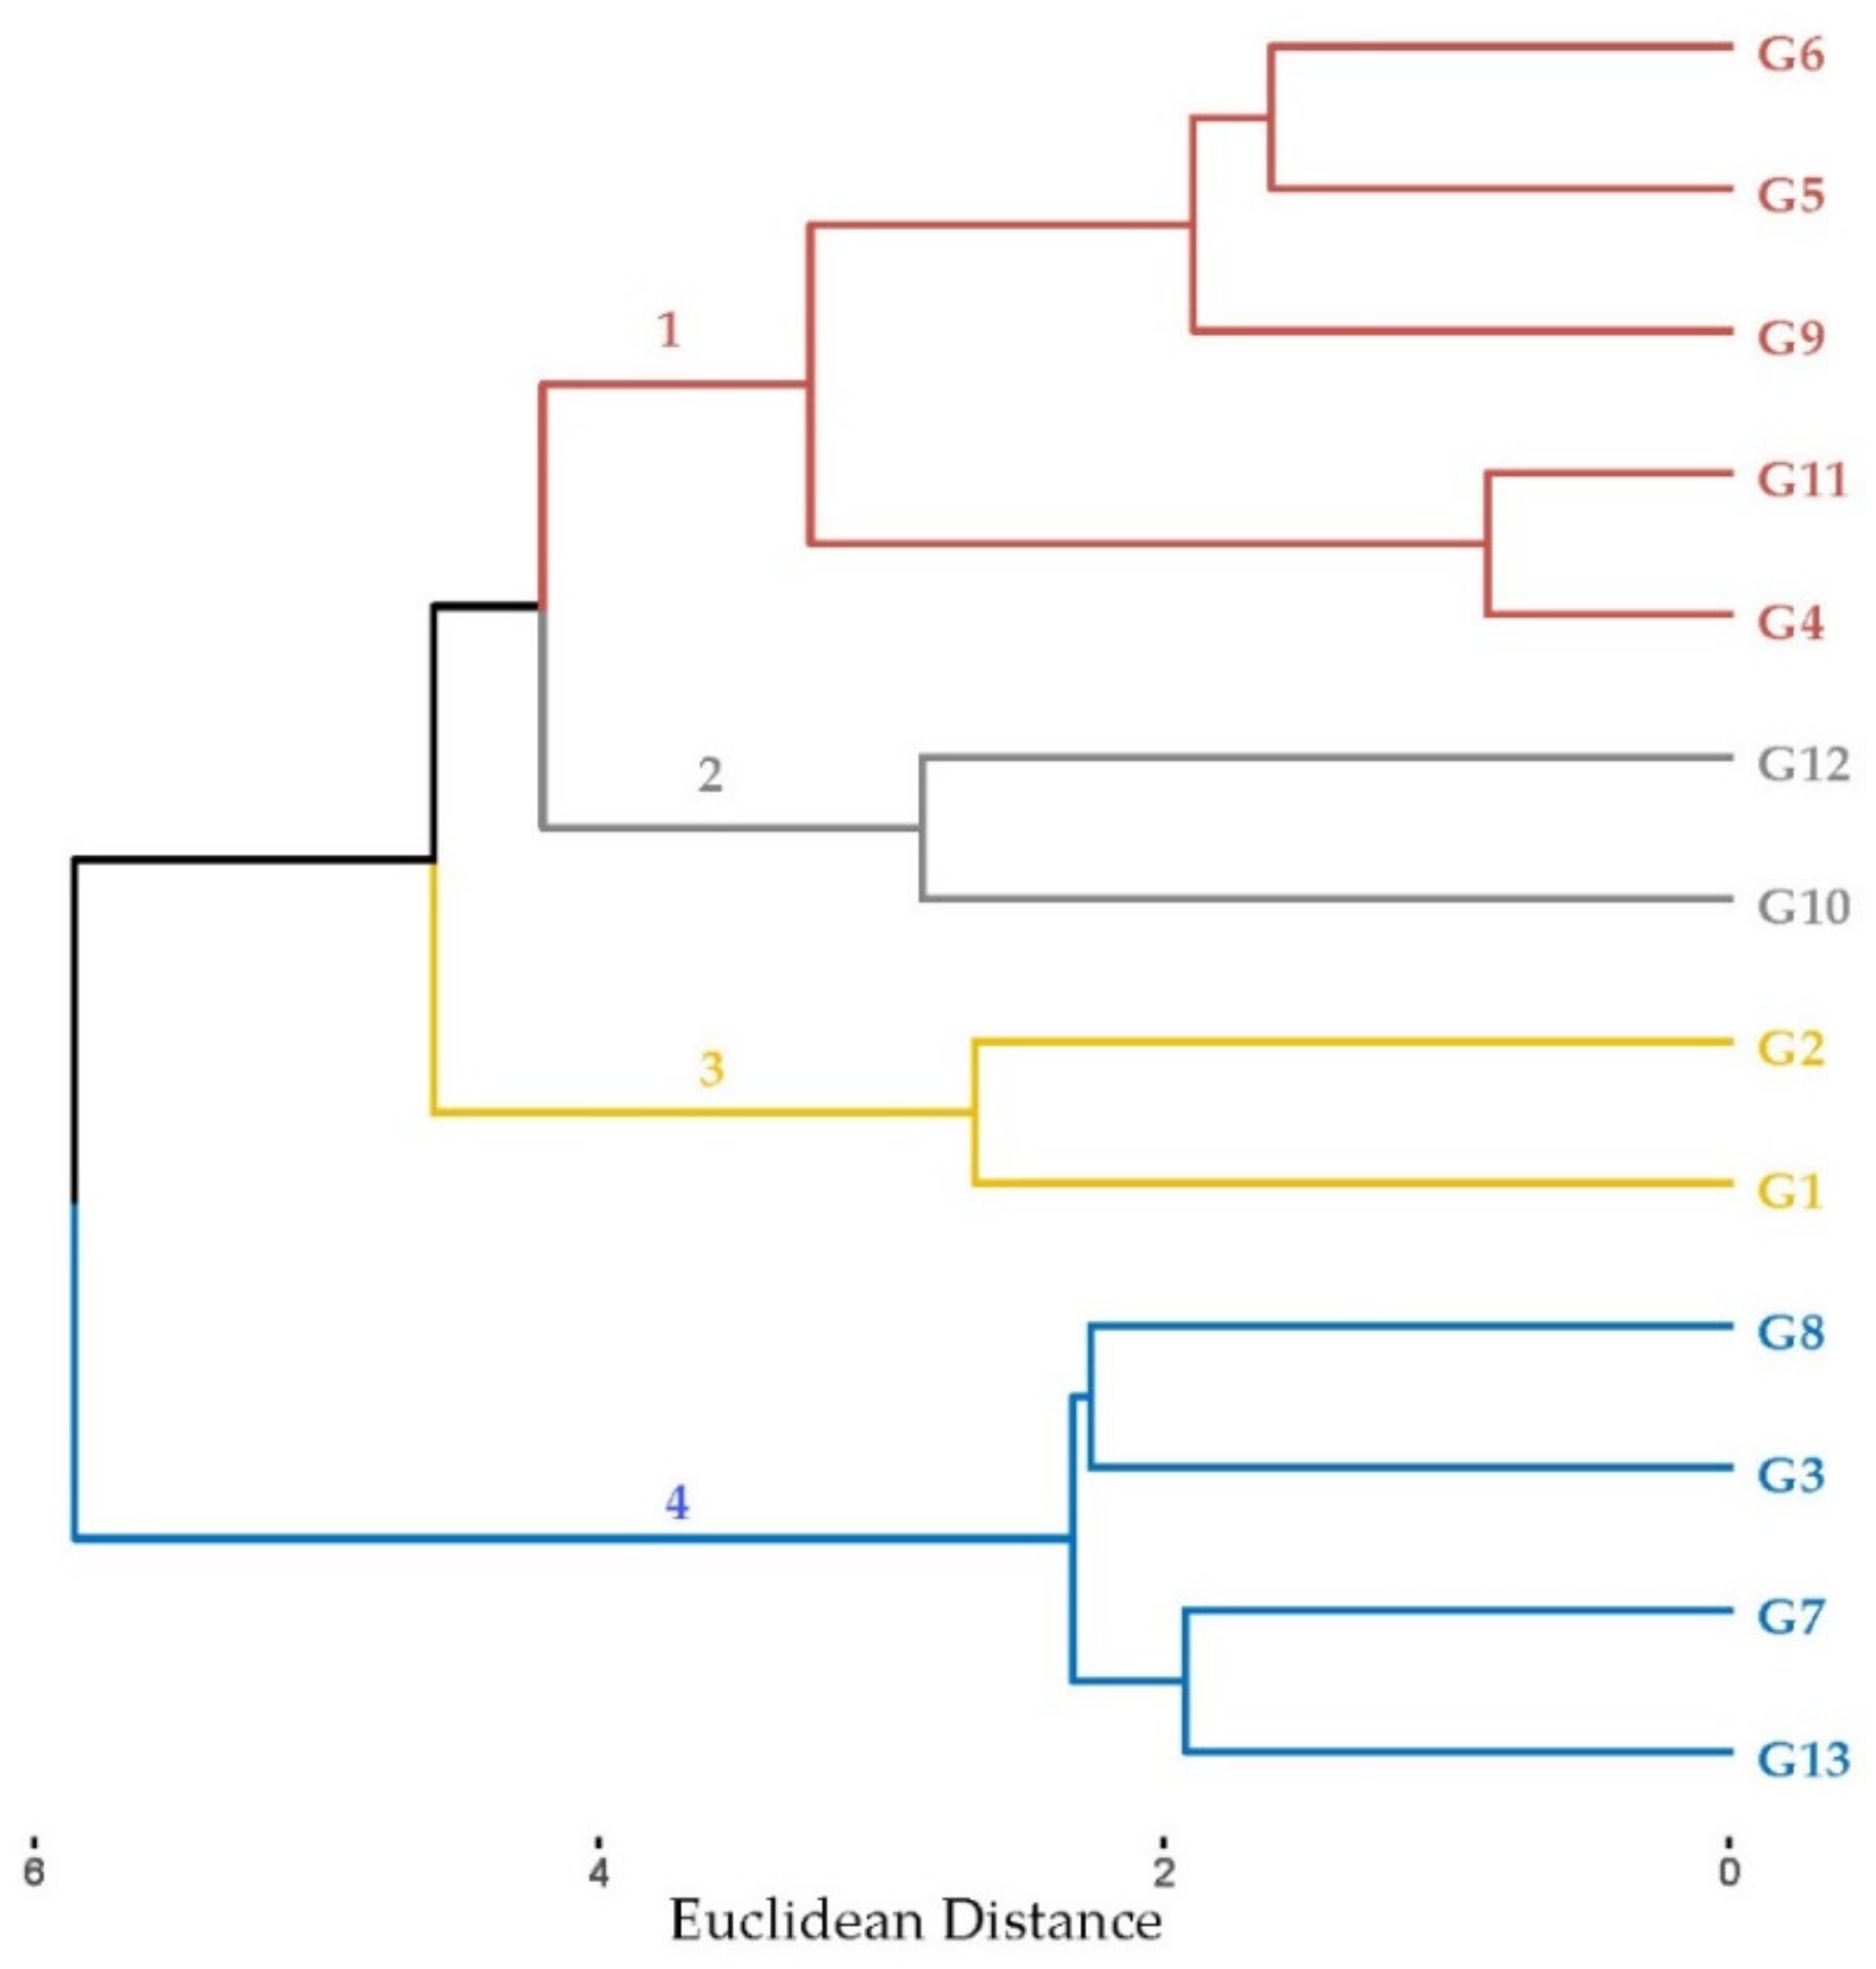
Table 3 represents the factor analysis performed with the WAASBY index. The first two factor components (FA) had eigenvalues greater than one and accounted for 75.51% of the total variance among the traits. FA1 clustered three traits, including SY, AGB, and THS, while FA2 grouped the HI trait (Table 3 and Table 4). Figure 5a shows the ranking of the 13 lentil accessions according to the MSTI. The three selected accessions were G12, G10, and G2, and they were utilized to determine selection differentials (SDs). SDs quantify the change in a population’s mean trait value between pre- and post-selection. The MTSI provides a positive SD for four studied traits. The top three accessions across the environment showed desired values for all lentil traits. The SD percentage for traits ranged between 18.8% for THS and 53.6% for AGB (Table 4).
Figure 5b depicts the strengths and weaknesses view of the stable accessions identified across three consecutive growing seasons. The factors that contributed the most were placed towards the center, while those that contributed less were drawn near the plot edge. The strengths and weaknesses of accessions showed that the first factor (FA1) had the highest contribution for accessions G2 and G10, while FA2 had the highest contribution for accession G12. The weakness of G12, however, is related to FA1.

3.6. Yield Quality

The seed quality of the 13 lentil accessions was analyzed throughout the 2017 growing season. The purpose of quality analysis is to determine how the yield quality of lentil accessions varies throughout a specific cropping season. Figure 6 depicts the HCA of dissimilarities across lentil accessions based on their Euclidean distances for the seed quality parameters (fat, ashes, starch, protein concentration, and protein yield). The HCA revealed four major lentil groups (Figure 6).
Due to the similar responses of the five lentil accessions (G4, G5, G6, G9, and G11) to seed quality parameters, they were bunched together in a single cluster: Group 1. G10 and G12 were two lentil accessions included in Group 2. Group 3 included two lentil accessions, G1 and G2. Group 4 clustered four lentil accessions together, including G3, G7, G8, and G13 (Figure 6).
Table 5 shows that Group 1 had a greater starch value but a lower protein yield value. In the midst of the accessions in Group 1, G11 is the central object for this group. On the other hand, Group 2 lentil accessions had the highest protein yield, and accession G12 is the central object for this group.
The largest concentration of ashes and the lowest protein concentration and fat were found in Group 3, and the accession G2 is the central object for this group. Group 4 had a higher value for protein concentration and fat and a lower value for starch and ashes, and the accession G7 is the central object for this group.
The results of the Spearman correlation (n = 13) of yield, morphologic parameters, and seed quality during the first growing season are shown in Supplementary Table S2. There is no significant association between quality measures and yield or morphologic parameters, according to Supplementary Table S2, with the exception of protein yield, which has a positive significant correlation with AGB (r = 0.57 and p = 0.005). In this study, the yield and the HI were shown to have a strong positive correlation (r = 0.79).

4. Discussion

The sowing and cultivation of lentils is an ancient agricultural practice. This plant is a classic grain legume that has always been used in human nutrition. This legume adapts well to even the poorest soils, enriches them with nutrients and organic matter, and needs very little care. In general, lentils and legumes are more environmentally sustainable because they require fewer natural resources to grow, so much so that 2016 was the international year dedicated to them [38]. This urges a need for improving lentil genetic activity for high-quality nutrition and optimum yield potential under different environmental conditions. In this context, it is critical to examine the quantity and nature of genotypes resulting from environmental interaction in order to generate stable genotypes in MET [39].
In this study, the yield and morphologic parameters of 13 lentil accessions were gathered over three growing seasons in South Italy. The likelihood-ratio test indicated a significant effect of GEI for all traits, proving that the performance of all traits of accessions was strongly affected by different environmental conditions. Lentil is generally cultivated without supplemental irrigation in areas with rainfall between 300 and 450 mm, and the water requirements in the semi-arid zone are estimated at 364–391 mm [40]. For this, the quantity of rain received during the first season (388 mm) is the minimum rainfall required for lentil in Mediterranean regions. The significant annual climate change is mainly due to an unprecedented amount of frost days (0 °C) in winter and spring 2019, rather than the drought effect caused during the first growing seasons. Frost nights during the third season would result in an additional reduction in yield for the majority of accessions [41,42,43,44]. The average maximum temperature in March (Flowering stage) was about 18.97, 14.9, and 17.83 °C for 2017, 2018, and 2019, respectively. According Foti and Abbate [6], the optimal temperature for flowering is between 14 and 22 °C. Lentils are moderately resistant to high temperatures and to dryness [6]. Lentils would also tolerate lower temperatures than chickpea (10–15 °C) but are severely affected by long and intense frosts [6]. In comparison to the first (2017) and third (2019) growing seasons, the lentil accessions benefited from perfect environmental conditions during the second growing season (2018). The presence of this GEI significance in lentil was reported by various authors such as Sabaghnia et al. [45] and Dehghani et al. [46].
The majority of plant breeders applied classic stability indices such the mean, regression, and deviation from regression parameters to choose the stable genotype [47]. However, these statistical tools are insufficient for identifying genotype strengths and weaknesses and selecting those with desired mean performance and stability [48]. The MTSI is a sophisticated quantitative genetic technique for the exploitation of suitable genotypes across all crop species [47] and free from the multicollinearity problem [24].
According to the MTSI results, the lentil accessions G2 (Altamura), G10 (Eston), and G12 (Caltagirone) gather the desired mean performance and stability of several traits such as SY, ABG, THS, and HI.
In terms of seed quality traits, the protein concentration ranged from 21.2% to 26.0% (data not shown). Very comparable findings were reported by Zaccardelli et al. [18]. Lentil protein concentrations were significantly greater than those of other leguminous species such as grass peas [43] and chickpea [44], reaching up to 28% [18]. Our study established that there is no relationship between SY and lentil protein concentration (LPC). The relationship between seed yield and protein concentration for lentil is consistent with previous studies [44,49,50]. The absence of a correlation between these two parameters (SY and LPC) could be related to some lentil accession capacity for biological nitrogen fixation.

5. Conclusions

Using a multi-trait stability index to select suitable lentil accessions under rainfed conditions in South Italy demonstrated that the multi-trait stability index is a good technique to develop high-performance and stable accessions in lentil breeding programs. In the present study, the lentil accessions selected by the multi-trait stability index (Altamura, ESTON, and Caltagirone) indicated the significance of improving morphological quantitative traits such as ABG and THS to obtain an optimum accession.
The results show that all traits were significantly influenced by GEI effects. In the third growing season, when there were some night frost incidents, the majority of lentil accessions were shown to be frost sensitive.
According to the qualitative results, four lentils (Gaia, ILL 508, Castelluccio Lentil, and di Colliano) had high protein concentration and fat, while five lentils (ESTON LSF, TIPO CASTELLUCCIO PlCCOLE, Mountain Lentil #1, Mountain Lentil #2, and W6 19546) had a larger starch percentage.
Yield stability, yield potential, and seed quality are three selection indices that can aid in choosing the most suitable lentil accessions for South Italy’s marginal zones. The challenge for future research will be determining an appropriate weight for the mean performance and stability, as well as the desired gains of each trait according to lentil breeding programs.

Supplementary Materials

The following are available online at https://www.mdpi.com/article/10.3390/agronomy11091807/s1, Table S1: Nomenclature of Weather parameters, Table S2: Correlations coefficients among yield, yield components (THS, AGB, and HI), and seed quality (protein concentration, fat, starch, protein yield, and ashes) variables for 13 lentil accessions during the 2017 growing season.

Author Contributions

Conceptualization, A.L. and C.P.; Methodology, A.L. and C.P.; Formal analysis, M.H.S.; Investigation, A.L. and C.P.; Resources, A.L. and C.P.; Data curation, M.H.S., A.L. and C.P.; Writing—original draft preparation, M.H.S.; Writing—review and editing, M.H.S.; Visualization, M.H.S.; Supervision, M.H.S. All authors have read and agreed to the published version of the manuscript.

Funding

This research was funded by the European Union’s Horizon 2020 research and innovation program (Protein2Food project), grant number 635727, and by Fondo Ordinario per gli Enti di ricerca (FOE).

Data Availability Statement

The datasets and the R codes used in this study are available from the authors upon reasonable request.

Acknowledgments

The authors thank Calandrelli Davide for technical support with the field trial. In addition, the authors thank Angela Rosa Piergiovanni from IBBR-CNR and the Western Regional Plant Introduction Station for the genetic material used.

Conflicts of Interest

The authors declare no conflict of interest.

References

  1. Sandhu, J.; Singh, S. History and origin. In Lentil; Yadav, S.S., McNeil, D.L., Stevenson, P.C., Eds.; Springer: Dordrecht, The Netherlands, 2007; pp. 1–9. [Google Scholar] [CrossRef]
  2. Alexander, W. Lentil Trading and Marketing: Australian Grain Exports. 2015. Available online: https://grdc.com.au/Research-and-Development/GRDC-Update-Papers/2015/08/Lentil-trading-and-marketing (accessed on 27 July 2021).
  3. Tullu, A.; Diederichsen, A.; Suvorova, G.; Vandenberg, A. Genetic and genomic resources of lentil: Status, use and prospects. Plant Genet. Resour. 2011, 9, 19–29. [Google Scholar] [CrossRef]
  4. FAOstat. Statistics Database of the Food and Agriculture Organization of the United Nations. 2021. Available online: http://www.fao.org/statistics/databases/en/ (accessed on 27 July 2021).
  5. ISTAT. Istituto Nazionale di Statistica. Available online: http://dati.istat.it/ (accessed on 27 July 2021).
  6. Foti, S.; Abbate, V. Lenticchia (Lens cilinaris Medik. o Lens esculenta Moench). In Coltivazioni Erbacee Cereali e Proteagnose; Baldoni, R., Giardini, L., Eds.; Pàtron Editore: Bologna, Italy, 2000; pp. 331–336. [Google Scholar]
  7. Sellami, M.H.; Pulvento, C.; Lavini, A. Agronomic practices and performances of quinoa under field conditions: A systematic review. Plants 2021, 10, 72. [Google Scholar] [CrossRef]
  8. Alandia, G.; Pulvento, C.; Sellami, M.H.; Hoidal, N.; Anemone, T.; Nigussie, E.; Agüero, J.J.; Lavini, A.; Jacobsen, S.-E. Grain legumes may enhance high-quality food production in Europe. In Emerging Research in Alternative Crops; Hirich, A., Choukr-Allah, R., Ragab, B., Eds.; Environment & Policy; Springer: Cham, Switzerland, 2020; Volume 58, pp. 25–53. [Google Scholar] [CrossRef]
  9. Pulvento, C.; Sellami, M.H.; Lavini, A. Yield and quality of Amaranthus hypochondriacus grain amaranth under drought and salinity at various phenological stages in southern Italy. J. Sci. Food Agric. 2021. [Google Scholar] [CrossRef]
  10. Sellami, M.H.; Pulvento, C.; Aria, M.; Stellacci, A.M.; Lavini, A. A Systematic Review of Field Trials to Synthesize Existing Knowledge and Agronomic Practices on Protein Crops in Europe. Agronomy 2019, 9, 292. [Google Scholar] [CrossRef] [Green Version]
  11. Singh, D.; Singh, C.K.; Kumari, S.; Tomar, R.S.S.; Karwa, S.; Singh, R.; Pal, M. Discerning morpho-anatomical, physiological and molecular multiformity in cultivated and wild genotypes of lentil with reconciliation to salinity stress. PLoS ONE 2017, 12, e0177465. [Google Scholar] [CrossRef] [PubMed]
  12. Shrestha, R.; Turner, N.C.; Siddique, K.H.M.; Turner, D.W. Physiological and seed yield responses to water deficits among lentil genotypes from diverse origins. Aust. J. Agric. Res. 2006, 57, 903–915. [Google Scholar] [CrossRef]
  13. Ruisi, P.; Amato, G.; Badagliacca, G.; Frenda, A.S.; Giambalvo, D.; Di Miceli, G. Agro-ecological benefits of faba bean for rainfed Mediterranean cropping systems. Ital. J. Agron. 2017, 12, 233–245. [Google Scholar] [CrossRef] [Green Version]
  14. Sarker, A.; Kumar, S. Lentils in production and food systems in West Asia and Africa. International Center for Agricultural Research in the Dry Areas (ICARDA), Aleppo, Syria. Grain Legumes. 2011, 57, 46–48. [Google Scholar]
  15. Muehlbauer, F.J.; Cubero, J.I.; Summerfield, R.J. Lentil (Lens culinaris Medic.). In Grain Legume Crops; Summerfield, R.J., Roberts, E.H., Eds.; Collins: London, UK, 1985; pp. 266–311. [Google Scholar]
  16. Tayade, R.; Kulkarni, K.P.; Jo, H.; Song, J.T.; Lee, J.D. Insight Into the Prospects for the Improvement of Seed Starch in Legume—A Review. Front. Plant Sci. 2019, 10, 1213. [Google Scholar] [CrossRef] [PubMed]
  17. Piergiovanni, A.R. The evolution of lentil (Lens culinaris Medik.) cultivation in Italy and its effects on the survival of autochthonous populations. Genet. Resour. Crop Evol. 2000, 47, 305–314. [Google Scholar] [CrossRef]
  18. Zaccardelli, M.; Sonnante, G.; Lupo, F.; Branca, F.; de Falco, E. (Eds.) Leguminose minori (cece, lenticchia, cicerchia, fava); Consiglio per Ricerca Sperimentazione Agricoltura: Rome, Italy, 2010; p. 73. ISBN 978-88-97081-00-5. [Google Scholar]
  19. Rana, M.; Sood, A.; Hussain, W.; Kaldate, R.; Sharma, T.R.; Gill, R.K.; Kumar, S.; Singh, S. Chapter 6—Gene Pyramiding and Multiple Character Breeding. In Lentils: Potential Resources for Enhancing Genetic Gains; Singh, M., Ed.; Academic Press: Cambridge, MA, USA, 2019; pp. 83–124. Available online: https://www.sciencedirect.com/science/article/pii/B9780128135228000066 (accessed on 27 July 2021).
  20. Olivoto, T.; Nardino, M. MGIDI: Toward an effective multivariate selection in biological experiments. Bioinformatics 2021, 37, 1383–1389. [Google Scholar] [CrossRef]
  21. Smith, H.F. A discriminant function for plant selection. Ann.Eugen. 1936, 7, 240–250. [Google Scholar] [CrossRef]
  22. Rocha, J.R.A.S.C.; Machado, J.C.; Carneiro, P.C.S. Multitrait index based on factor analysis and ideotype-design: Proposal and application on elephant grass breeding for bioenergy. GCB Bioenergy 2018, 10, 52–60. [Google Scholar] [CrossRef]
  23. Olivoto, T.; Lúcio, A.D.; da Silva, J.A.; Sari, B.G.; Diel, M.I. Mean performance and stability in multi-environment trials II: Selection based on multiple traits. J. Agron. 2019, 111, 2961–2969. [Google Scholar] [CrossRef]
  24. Authrapun, J.; Lertsuchatavanich, U.; Kang, D. Selection for Improving Field Resistance to Capsicum Chlorosis Virus and Yield-related Traits Using Selection Indices in Peanut Breeding. Acta Sci. Agric. 2021, 5, 22–31. [Google Scholar] [CrossRef]
  25. Allen, R.G.; Pereira, L.S.; Raes, D.; Smith, M. (Eds.) Crop evapotranspiration guidelines for computing crop water requirements. In Irrigation and Drainage Paper 56; FAO: Rome, Italy, 1998. [Google Scholar]
  26. USDA. Keys to Soil Taxonomy, 10th ed.; Soil Survey Staff; US Department of Agriculture NRCS: Washington, DC, USA, 2006.
  27. Mariotti, F.; Tomé, D.; Mirand, P.P. Converting Nitrogen into Protein—Beyond 6.25 and Jones’ Factors. Crit. Rev. Food Sci. Nutr. 2008, 48, 177–184. [Google Scholar] [CrossRef]
  28. AOAC. Official method 922.06. Fat in flour. Acid hydrolysis method. In Official Methods of Analysis of AOAC International, 19th ed.; AOAC International: Gaithersburg, MD, USA, 2012. [Google Scholar]
  29. Box, G.E.P.; Cox, D.R. An analysis of transformations. J. R. Stat. Soc. Series B 1964, 26, 211–252. [Google Scholar] [CrossRef]
  30. Henderson, C.R. Best linear unbiased estimation and prediction under a selection model. Biometrics 1975, 423–447. [Google Scholar] [CrossRef] [PubMed] [Green Version]
  31. Olivoto, T.; Lúcio, A.D.; da Silva, J.A.; Marchioro, V.S.; de Souza, V.Q.; Jost, E. Mean performance and stability in multi-environment trials I: Combining features of AMMI and BLUP techniques. Agron. J. 2019, 111, 2949–2960. [Google Scholar] [CrossRef]
  32. Olivoto, T.; Lúcio, A.D.C. metan: An R package for multi-environment trial analysis. Methods Ecol. Evol. 2020, 11, 783–789. [Google Scholar] [CrossRef]
  33. R Core Team. R: A Language and Environment for Statistical Computing; R Foundation for Statistical Computing: Vienna, Austria, 2013; Available online: https://www.scirp.org/(S(vtj3fa45qm1ean45vvffcz55))/reference/ReferencesPapers.aspx?ReferenceID=1742158 (accessed on 1 March 2021).
  34. Husson, F.; Josse, J.; Le, S.; Mazet, J. Facto Mine R: Multivariate Exploratory Data Analysis and Data Mining with R. R Package Version.1. 2014, pp. 102–123. Available online: http://factominer.free.fr/ (accessed on 1 March 2021).
  35. Friendly, M. Corrgrams: Exploratory displays for correlation matrices. Am. Stat. 2002, 56, 316–324. [Google Scholar] [CrossRef]
  36. Datta, S.; Datta, S. Methods for evaluating clustering algorithms for gene expression data using a reference set of functional classes. BMC Bioinform. 2006, 7, 397. [Google Scholar] [CrossRef] [PubMed]
  37. Gibbs, W.J.; Maher, J.V. Rainfall deciles as drought indicators. Bureau of Meteorology. Melbourne 1967, 48, 37. [Google Scholar]
  38. FAO. 2016 International Year of Pulses. Available online: http://www.fao.org/pulses-2016/about/en/ (accessed on 27 July 2021).
  39. Ezatollah, F.; Hassan, Z.; Reza, M. Evaluation of phenotypic stability in chickpea genotypes using GGE-Biplot. Ann. Biol. Res. 2011, 2, 282–292. [Google Scholar]
  40. INRA. Guide Pratique Pour le Conseil Agricole: Lentille, Pois Chiche et Fève/دليل الاستشارة الفلاحية العدس الحمص والفول (Ar, Fr) Rabat (Ma). 2015; 56p. Available online: https://www.inra.org.ma/fr/content/guide-pratique-pour-le-conseil-agricole-lentille-pois-chiche-et-f%C3%A8ve (accessed on 2 September 2021).
  41. Nezami, A.; Bandara, M.S.; Gusta, L.V. An evaluation of freezing tolerance of winter chickpea (Cicer arietinum L.) using controlled freeze tests. Can. J. Plant. Sci. 2012, 92, 155–161. [Google Scholar] [CrossRef]
  42. Croser, J.S.; Clarke, H.J.; Siddique, K.H.M.; Khan, T.N. Low-temperature stress: Implications for chickpea (Cicer arietinum L.) improvement. CRC. Crit. Rev. Plant. Sci. 2003, 22, 185–219. [Google Scholar] [CrossRef]
  43. Sellami, M.H.; Pulvento, C.; Amarowicz, R.; Lavini, A. Field phenotyping and quality traits of grass pea genotypes in South Italy. J. Sci. Food Agric. 2020. [Google Scholar] [CrossRef]
  44. Sellami, M.H.; Lavini, A.; Pulvento, C. Phenotypic and quality traits of chickpea genotypes under rainfed conditions in south Italy. Agronomy 2021, 11, 962. [Google Scholar] [CrossRef]
  45. Sabaghnia, N.; Dehghani, H.; Sabaghpour, S.H. Graphic analysis of genotype by environment interaction for lentil yield in Iran. Agron. J. 2008, 100, 760–764. [Google Scholar] [CrossRef]
  46. Dehghani, H.; Sabaghpour, S.H.; Sabaghnia, N. Genotype x environment interaction for grain yield of some lentil genotypes and relationship among univariate stability statistics. Span. J. Agric. Res. 2008, 6, 385–394. [Google Scholar] [CrossRef] [Green Version]
  47. Benakanahalli, N.K.; Sridhara, S.; Ramesh, N.; Olivoto, T.; Sreekantappa, G.; Tamam, N.; Abdelbacki, A.M.M.; Elansary, H.O.; Abdelmohsen, S.A.M. A Framework for Identification of Stable Genotypes Basedon MTSI and MGDII Indexes: An Example in Guar (Cymopsis tetragonoloba L.). Agronomy 2021, 11, 1221. [Google Scholar] [CrossRef]
  48. Olivoto, T.; Nardino, M.; Meira, D.; Meier, C.; Follmann, D.N.; Souza, V.Q.; Konflanz, V.A.; Baretta, D. Multi-trait selection for mean performance and stability in maize. Agron. J. 2021, 1–16. [Google Scholar] [CrossRef]
  49. Picard, J. Some results dealing with breeding for protein content in Vicia faba L. In Protein Quality from Leguminous Crops; EUR 5686 Agricultural Research Series; INRS Station d’Amélioration des Plantes: Dijon, France, 1977; pp. 339–347. [Google Scholar]
  50. El-Sherbeeny, M.H.; Robertson, L.D. Protein content variation in a pure line faba bean (Vicia faba) collection. J. Sci. Food Agric. 1992, 58, 193–196. [Google Scholar] [CrossRef]
Figure 1. Rainfall, air temperature (Tmin and Tmax), and solar radiation distribution during the three experimental years.
Agronomy 11 01807 g001
Figure 2. The proportion of the phenotypical variation examined over three growth seasons for four lentil traits (SY, AGB, HI, and THS). σe2 = environment variance; σg2 = genotype variance; σge2 = interaction g × e variance; σr2 = residual variance. Asterisks indicate significant effect of environment (upper position), genotype (middle position), or interaction g × e (lower position) at p ≤ 0.05 (*), or p ≤ 0.0001 (****), while ns indicates no significant effect according to likelihood-ratio test.
Agronomy 11 01807 g002
Figure 3. Principal component analysis (PCA) biplot on lentil yield and morphologic parameters as a function of growing seasons and accessions. The principal variables are denoted by red arrows. The auxiliary variables are represented by dotted blue arrows (weather parameters). Please see Table 1 for the different accessions’ abbreviations. Each ellipse represents a 95% confidence interval around each group. The weather abbreviations can be found in Supplementary Table S1.
Agronomy 11 01807 g003
Figure 4. The rank of 13 accessions based on various weightings of stability (WAASB) and grain yield performance (SY) evaluated during three consecutive growing seasons. Please see Table 1 for the different accessions’ abbreviations.
Agronomy 11 01807 g004
Figure 5. (a) Genotype ranking based on the MTSI considering a selection intensity of 20% (red circle). Selected genotypes are highlighted in red. (b) Strengths and weaknesses view of the stable genotypes identified across three consecutive growing seasons, shown as the proportion of each factor on the computed MTSI index. Smaller proportions explained by a factor (closer to the external edge) indicate that the trait within that factor is closer to the ideotype. The dashed line shows the theoretical value if all the factors contributed equally. FA1: SY, AGB, and THS, and FA2: HI.
Agronomy 11 01807 g005
Figure 6. Hierarchical cluster analysis of dissimilarities across lentil accessions on their Euclidean distances. Please see Table 1 for the different accessions’ abbreviations.
Agronomy 11 01807 g006
Table 1. The study’s accessions and their origins.
CodeAccession Name PurveyorCountry
G1ItacaISEAItaly
G2AltamuraWestern Regional Pl StationUnited States
G3GaiaISEAItaly
G4ESTON LSFWestern Regional Pl StationUnited States
G5TIPO CASTELLUCCIO PlCCOLE
G6Mountain Lentil #1
G7ILL 508
G8Castelluccio Lentil
G9Mountain Lentil #2
G10ESTON
G11W6 19546
G12CaltagironeISAFoM-SiciliaItaly
G13di CollianoIBBR-CNR
Quotation marks (”) indicate repeated purveyor or country.
Table 2. Four lentil traits (SY, AGB, HI, and THS); mean of 13 lentil accessions assessed for three growing seasons.
Source of VariationGrowing SeasonMean
201720182019
SY (g m−2)111 ± 59 b129 ± 64 a71 ± 72 c104 ± 69
AGB (g m−2)627 ± 265 b603 ± 224 b799 ± 410 a676 ± 320
HI (%)18.09 ± 8.14 b21.73 ± 8.36 a7.53 ± 5.36 c15.78 ± 9.52
THS (g)37.76 ± 12.61 a34.56 ± 10.32 b22.57 ± 9.14 c31.63 ± 12.55
SY = seed yield; AGB = above-ground biomass; HI = harvest index; THS = 1000-seed weight. Means followed by the same letter in each row are not significantly different according to the Tukey’s test (p = 0.05).
Table 3. Eigenvalues, relative and cumulative percentages of total variance, factorial loadings after varimax rotation, and communalities for lentil traits obtained by factor analysis.
Factor ComponentsFA1FA2CommunalityUniquenesses
Eigenvalue1.961.06
Relative variance (%)49.1026.41
Cumulative variance (%)49.1075.51
Eigenvectors
SY−0.800.470.870.13
AGB−0.870.110.770.23
THS−0.66−0.280.520.48
HI−0.020.930.870.13
Eigenvectors: SY: seed yield; AGB: dry biomass; HI: harvest index; and THS: 1000-seed weight.
Table 4. Lentil traits and selection differential for the WAASBY index in 13 lentil genotypes.
VariablesFactorXoXsSDSDperc
SYFA 154.280.826.649.0
AGBFA 145.469.724.353.6
HSFA 154.464.610.218.8
HIFA 257.673.115.526.9
Xo: original value; Xs: selected value; SD: selection differential; Sdperc: selection differential in percentage.
Table 5. Mean quality parameters of four major lentil groups during the 2017 growing season.
Starch (g/100g Dry Weight)Ashes (%)Protein Concentration (%)Fat (%)Protein Yield (g m−2)
Group 147.08 ± 1.735.19 ± 1.8523.84 ± 1.32.19 ± 0.0715.96 ± 7.64
Group 246.45 ± 0.355.01 ± 2.6422.9 ± 2.122.47 ± 0.2341.59 ± 4.21
Group 341.05 ± 0.357.57 ± 3.1922.2 ± 1.411.47 ± 0.223.833 ± 1.99
Group 436.8 ± 3.334.29 ± 1.2524.93 ± 0.772.57 ± 0.4216.60 ± 7.11
Values reported as mean ± standard deviation.
Publisher’s Note: MDPI stays neutral with regard to jurisdictional claims in published maps and institutional affiliations.

