Article

Photosynthetic Physiology Comparisons between No Tillage and Sod Culture of Citrus Farming in Different Seasons under Various Light Intensities

1
Department of Forestry, National Chung Hsing University, Taichung 40227, Taiwan
2
Department of Horticulture and Biotechnology, Chinese Culture University, Taipei 11114, Taiwan
3
Development Center of Sustainable Agriculture, Department of Life Sciences and Innovation, National Chung Hsing University, Taichung 40227, Taiwan
4
Department of Forestry, National Pingtung University of Science and Technology, Pingtung 91201, Taiwan
5
Endemic Species Research Institute, Nantou 552203, Taiwan
*
Author to whom correspondence should be addressed.
These authors contributed equally to this work.
Agronomy 2021, 11(9), 1805; https://doi.org/10.3390/agronomy11091805
Submission received: 2 August 2021 / Revised: 3 September 2021 / Accepted: 4 September 2021 / Published: 8 September 2021
(This article belongs to the Special Issue Plant Photosynthesis: From Molecules to Remote Sensing)

Abstract

:
Sod culture (SC) and no tillage (NT) are modern orchard management systems, and are two different bases for the sustainable development and production of citrus orchards in Taiwan. However, there is no information about the efficiency of either NT or SC on the photosynthetic physiology of farmed citrus under different seasons and varying light intensities. The objective of this study was to clarify the impacts of SC and NT under eco-friendly farming management on the photosynthetic apparatus of an important plantation citrus species in response to varying light intensities over the seasons. The results showed that Rd (dark respiration rate of CO2), Qy (light quantum yield of CO2), LCP (light compensation point), Amax (maximum net assimilation of CO2), and Fv/Fm values of citrus plants under SC were somewhat higher under NT in the same season, particularly in the fall and in winter. As light intensity increased from 200 to 2000 μmol photon m−2 s−1 PPFD, higher Pn (net photosynthesis rate), Gs (stomatal conductance), ETR (electron transport rate), NPQ (non-photochemical quenching), and Fv/Fm (potential quantum efficiency of PSII) values were observed in spring and summer compared to the fall and winter, and increasing NPQ and decreasing Fv/Fm values were observed in all seasons. Positive and significant correlations were shown between the Pn and Gs under NT and SC in all seasons with all light illuminations, whereas significant and negative relationships were observed between the ETR and NPQ under NT in fall and winter at 1200~2000 PPFD. In short, ETR was useful for non-destructive estimations of Pn and NPQ since these indices were significantly and positively correlated with ETR in citrus leaves exposed to 0~1200 PPFD in all seasons and 1200~2000 PPFD in spring, the fall, and winter, providing a quick means to identify the physiological condition of plants under various seasons and tillages. The precise management of photosynthetic parameters such as ETR in response to light irradiances under varied seasons also provides implications for sustainable citrus production for tillage cropping systems in future higher CO2 and potentially wetter or drier environments. The tillages may hold promise for maximizing the economic efficiency of the growth and development of citrus plants grown in the field.

1. Introduction

Citrus is one of the most important fruit crops grown globally in terms of area and production, and is an important plantation species in Taiwan, with a high economic value. Citrus mainly grows in the lower-elevation mountain area of central Taiwan due to appropriate climate conditions. Citrus production is powered by premium market prices, butexhibits considerable variation in growth under different agricultural management systems. The hybrid species Citrus reticulate Blanco × C. sinensis Osbeck occupies the largest plantation area in central Taiwan, and its average yield in 2009 was about 18,000 kg ha−1 [1].
The no-tillage (NT) system has been applied mainly in temperate climates and fruit trees under highly mechanized conditions. NT is an application of minimal or no mechanical soil disturbance or biomass mulch soil cover and crop species diversification, and is a very effective management system for reducing production costs and time, reduced technical flexibility in sowing, fertilizer applications, and weed control [2,3,4]. Most orchard farmers in Taiwan apply NT along with a massive amount of herbicides to eliminate plant cover, resulting in high erosion rates. Alternatively, sod culture (SC) is a modern orchard management pattern that serves as a basis for the sustainable development of orchards by enhancing soil organic matter content and organic carbon accumulation, improving soil physicochemical properties, strengthening soil water-holding capacity, advancing microorganism growth, increasing fruit quality, reducing disease/pest damages, and improving orchard microclimates [5,6,7,8]. SC employing Trifolium repens, Oxalis corniculata L., Paspalum notatum, and Cynodon dactylon (L.) Pers. is commonly practiced as part of soil management in citrus orchards in Taiwan, and as an orchard cultivation measure, it may promote fruit growth and development. However, there is little information about the efficiency of NT and SC in the photosynthetic physiology of citrus farming in different seasons under various light intensities.
The vascular plants achieve more efficient or higher capacity photosynthesis and gas exchange through development of xylem vessels and higher vein densities [9]. Higher rate of sap flow due to the xylem vessel structure of the plant helps to gain a higher sap flow and a good plant water status by maintaining the efficient leaf water potential of the plants, and increase in the total number and production of fully developed chloroplasts, which prompts seasonal Pn and Gs to increase rapidly [10]. Photosynthesis is also biochemically regulated to maintain a balance between the rates of its component processes, influenced by many environmental and physiological factors, and varies with habitat as well as season and diurnal courses [11]. Seasonality drives the cycles of plant productivity in ecosystems, and seasonal variation in photosynthesis and respiration are essential for ecosystem–atmosphere CO2 exchange [12]. The impact of extreme weather on forests has become increasingly severe under climate change, especially in seasonally dry ecosystems, due to cycles of prolonged drought and heavy rain. Drought is the primary cause of stress in forest ecosystems, such as citrus orchards production systems, under climate change and may increase tree mortality under climatic warming, causing a reduction in forest carbon sequestration [13,14]. The study of photosynthesis–irradiance relationships is a basic aspect of plant physiological research, and photosynthetic light responses can be used to assess the ability to capture light and understand optimal light intensity conditions in plants [15]. On the other hand, when plants are exposed to high illumination conditions, more photons may be absorbed than the carbon reaction can use; such an excess of absorbed energy often leads to so-called photoinhibition, which is a reduced efficiency of photosynthesis, because of damage to the photosystem. Thus, non-photochemical quenching (NPQ) plays an important role in photoprotection because it quenches excess energy and dissipates it safely as heat [16,17]. Chlorophyll fluorescence (ChlF) is a noninvasive technique offering highly accurate measurements that illustrate the function of the photosynthetic apparatus in plants, and photosynthetic performance is often used in physiological studies to investigate a plant’s response to various environmental stresses in the field and reflects their adaptability to their habitats as well [18].
The hypothesis of this study was that photosynthesis-related parameters might exhibit distinguishable differences in the NT and SC of citrus orchards at different seasons and photosynthetic photon flux densities (PPFD). The aims of the present study were to clarify tillage and seasonal dynamics on the actual state of the photosynthetic apparatus of citrus by measuring the capture, transfer, and dissipation of excitation energy as detected by photosynthetic capacity and ChlF in response to varying light intensities. The relationships of photosynthetic indices can be used for eco-physiological research in citrus, and these parameters can be considered selection indices for examining the growth and tillage practices of citrus plants under broad ranges of light intensity over the seasons. Assessing photosynthetic parameters under light intensity variation is an important tool for understanding how to improve the photosynthetic productivity of citrus.

2. Materials and Methods

2.1. Site Description, Experimental Field Management, and Experimental Design

This study was conducted at a low-elevation (approximately 350 m altitude) mountain area of central Taiwan. The experimental sites were established over 20 years ago to study long-term citrus (Citrus reticulate Blanco × C. sinensis Osbeck) NT (120°46′22″ E, 23°52′19″ N) and SC systems (23°48′19.0″ N, 120°44′21.3″ E) located in central Taiwan. NT and SC farming practices for controlling soil and water losses in these areas were similar from June 2019, to May 2020. This investigation was carried out at a certified organic plantation where farmers strive for optimal sustainable management. The site’s climate is humid subtropical, with a mean annual rainfall of 2100 mm and a mean annual air temperature of 36.1 °C, as recorded from May 2019 to April 2020. Monthly precipitation and air temperature are shown in Figure 1. According to the soil taxonomy world reference base for soil resources, the soil is a typical Andosol in which the texture of the upper surface is sandy loam [19].
The experiment consisted of two agricultural management systems (NT and SC) over four seasons (spring, summer, fall, and winter) with each cover crop treatment having four replications. Cover crops on the citrus field orchards were Paspalum conjugatum Berg., Cynodondactylon (L.) Pers., Wedelia chinensis Merr., and Oxalis corniculata L. NT orchards were mown with a flail mower in the first week of each season, with residues being left on the soil surface as a nutrient supply. During field management, organic cultivation methods were performed and no chemical fertilizers or herbicides were used in this experiment. In addition, no severe pests or diseases were encountered during these field experiments. Average citrus yield was about 18,000 kg ha−1 in 2019. A completely randomized design employing the two tillage methods and four seasonal treatments was used, and there were five replicates per treatment. For each treatment, five intact, fully expanded mature leaves and leaf samples were randomly sampled from each robust and healthy plant at the end of each season.

2.2. Determination of Photosynthetic Capacityand Chlorophyll Fluorescence (ChlF) Parameters with a Fixed Light Source

In all seasons, PPFD was adjusted to 0, 5, 10, 15, 25, 50, 75, 100, 200, 400, 800, 1200, 1500, 1800, and 2000 μmol photon m−2 s−1 in a leaf chamber for 90 min to understand how radiant energy was used by the tested plants under different illumination intensities. Plants were measured with a gas-exchange and fluorescence photosynthesis analyzer (GFS-3000FL, Walz, Effeltrich, Germany) from June 2019 to May 2020. The second to third leaf from the top of each plant were dark-adapted for 30 min by the use of leaf clips. Following darkness adaptation, the central region of the adaxial leaf surface was subjected to a saturating light pulse of 3500 μmol m−2 s−1 (690 nm) for the measurements. Values of the minimal ChlF (Fo) and maximal ChlF (Fm) of the dark-adapted samples were determined, and gas exchange and ChlF measurements were simultaneously measured at 10:00 a.m. daily under the stable environmental conditions of the leaf chamber. Environmental conditions were set to a gas-flow rate at 750 μmol s–1, a gas-mixer speed at level 7, an assimilator temperature of 25 °C, and a relative humidity of 75% during the experiment.
The potential (Fv/Fm) and actual (Fv’/Fm’) photosystem II efficiencies (ΦPSII) were calculated as (Fm-Fo)/Fm and (Fm’-Fo’)/Fm’, respectively. Fo (Fo’) and Fm (Fm’) are the minimal and maximal fluorescence values of dark-adapted and during-illumination leaves, respectively [16]. Measured leaves were dark-adapted for 30 min before light-curve runs. The effective quantum yield of PSII (ΔF/Fm’) was obtained using the light-curve program, where actinic light intensity was increased over 2 min in fifteen steps, illuminated for at least 15 min in each stage to fully manifest the photoreaction. The following effective quantum yields were measured and recorded using the light-response curve program [20]. ΔF/Fm’ was calculated as (Fm’-F)/Fm’, where F is the fluorescence yield of the light-adapted sample and Fm’ is the maximum light-adapted fluorescence yield when a saturating light pulse was superimposed. The apparent rate of the photosynthetic electron transport (ETR) of PSII was obtained as ETR = ΔF/Fm’ × PPFD × 0.5 × 0.84, where the factor 0.5 assumed equal excitation of both PSII and PSI. The ETR correction factor of 0.84 was used because only a fraction of incident light is actually absorbed by the two PSs (Wong et al. 2014). Non-photochemical quenching (NPQ) was calculated as (Fm/Fm’)−1 [21]. Moreover, the dark respiration rate of CO2 (Rd), light quantum yield of CO2 (Qy), and light compensation point (LCP) were obtained from the linear regression of photosynthetic light response curves to illumination measured from 0~100 µmol PPFD m−2 s−1 [22,23]. Values for net photosynthetic rate (Pn, μmol CO2 m−2 s−1), and stomatal conductance to water vapor (Gs, mmol H2O m−2 s−1) were simultaneously calculated and recorded inside the chamber of the photosynthesis analyzer (GFS-3000FL, Walz, Effeltrich, Germany). The operation was automatic, and data were stored in the computer within the console and analyzed. All measurements were performed on fifteen leaves from five replicates for each treatment of 380–400 ppm in the atmospheric environment at room temperature (25 °C) from mid-morning until mid-afternoon (10:00~17:00).

2.3. Statistical Analysis

Statistical analyses were performed using PASW Statistics 18 software (PASW 18, IBM, Chicago, MI, USA). Gas exchange and ChlF measurements were analyzed using a single-factor analysis of variance (ANOVA) to check for significant differences between NT and SC, and differences among season means were assessed using Tukey’s HSD test with p < 0.05 significance. In addition, two-way ANOVA was used for the interaction of tillages and seasons. Multiple comparisons were performed using the least-significant difference. Regression analyses were used to examine relationships between Gs and Pn and among ETR, Pn, and NPQ. In addition, model datasets were based on at least 25 leaves from each PPFD level, and ChlF parameters were calculated using ETR data from the model validation datasets. Several models were tested, including linear regression models selected for the interpretation of the relationship between ChlF parameters and PPFD. All models were evaluated for goodness of fit by the graphical analysis of residuals and by computing correlation coefficients at a significance level of p < 0.05 between the gas-exchange and ChlF parameters. The linear regression model performance proved more suitable.

3. Results

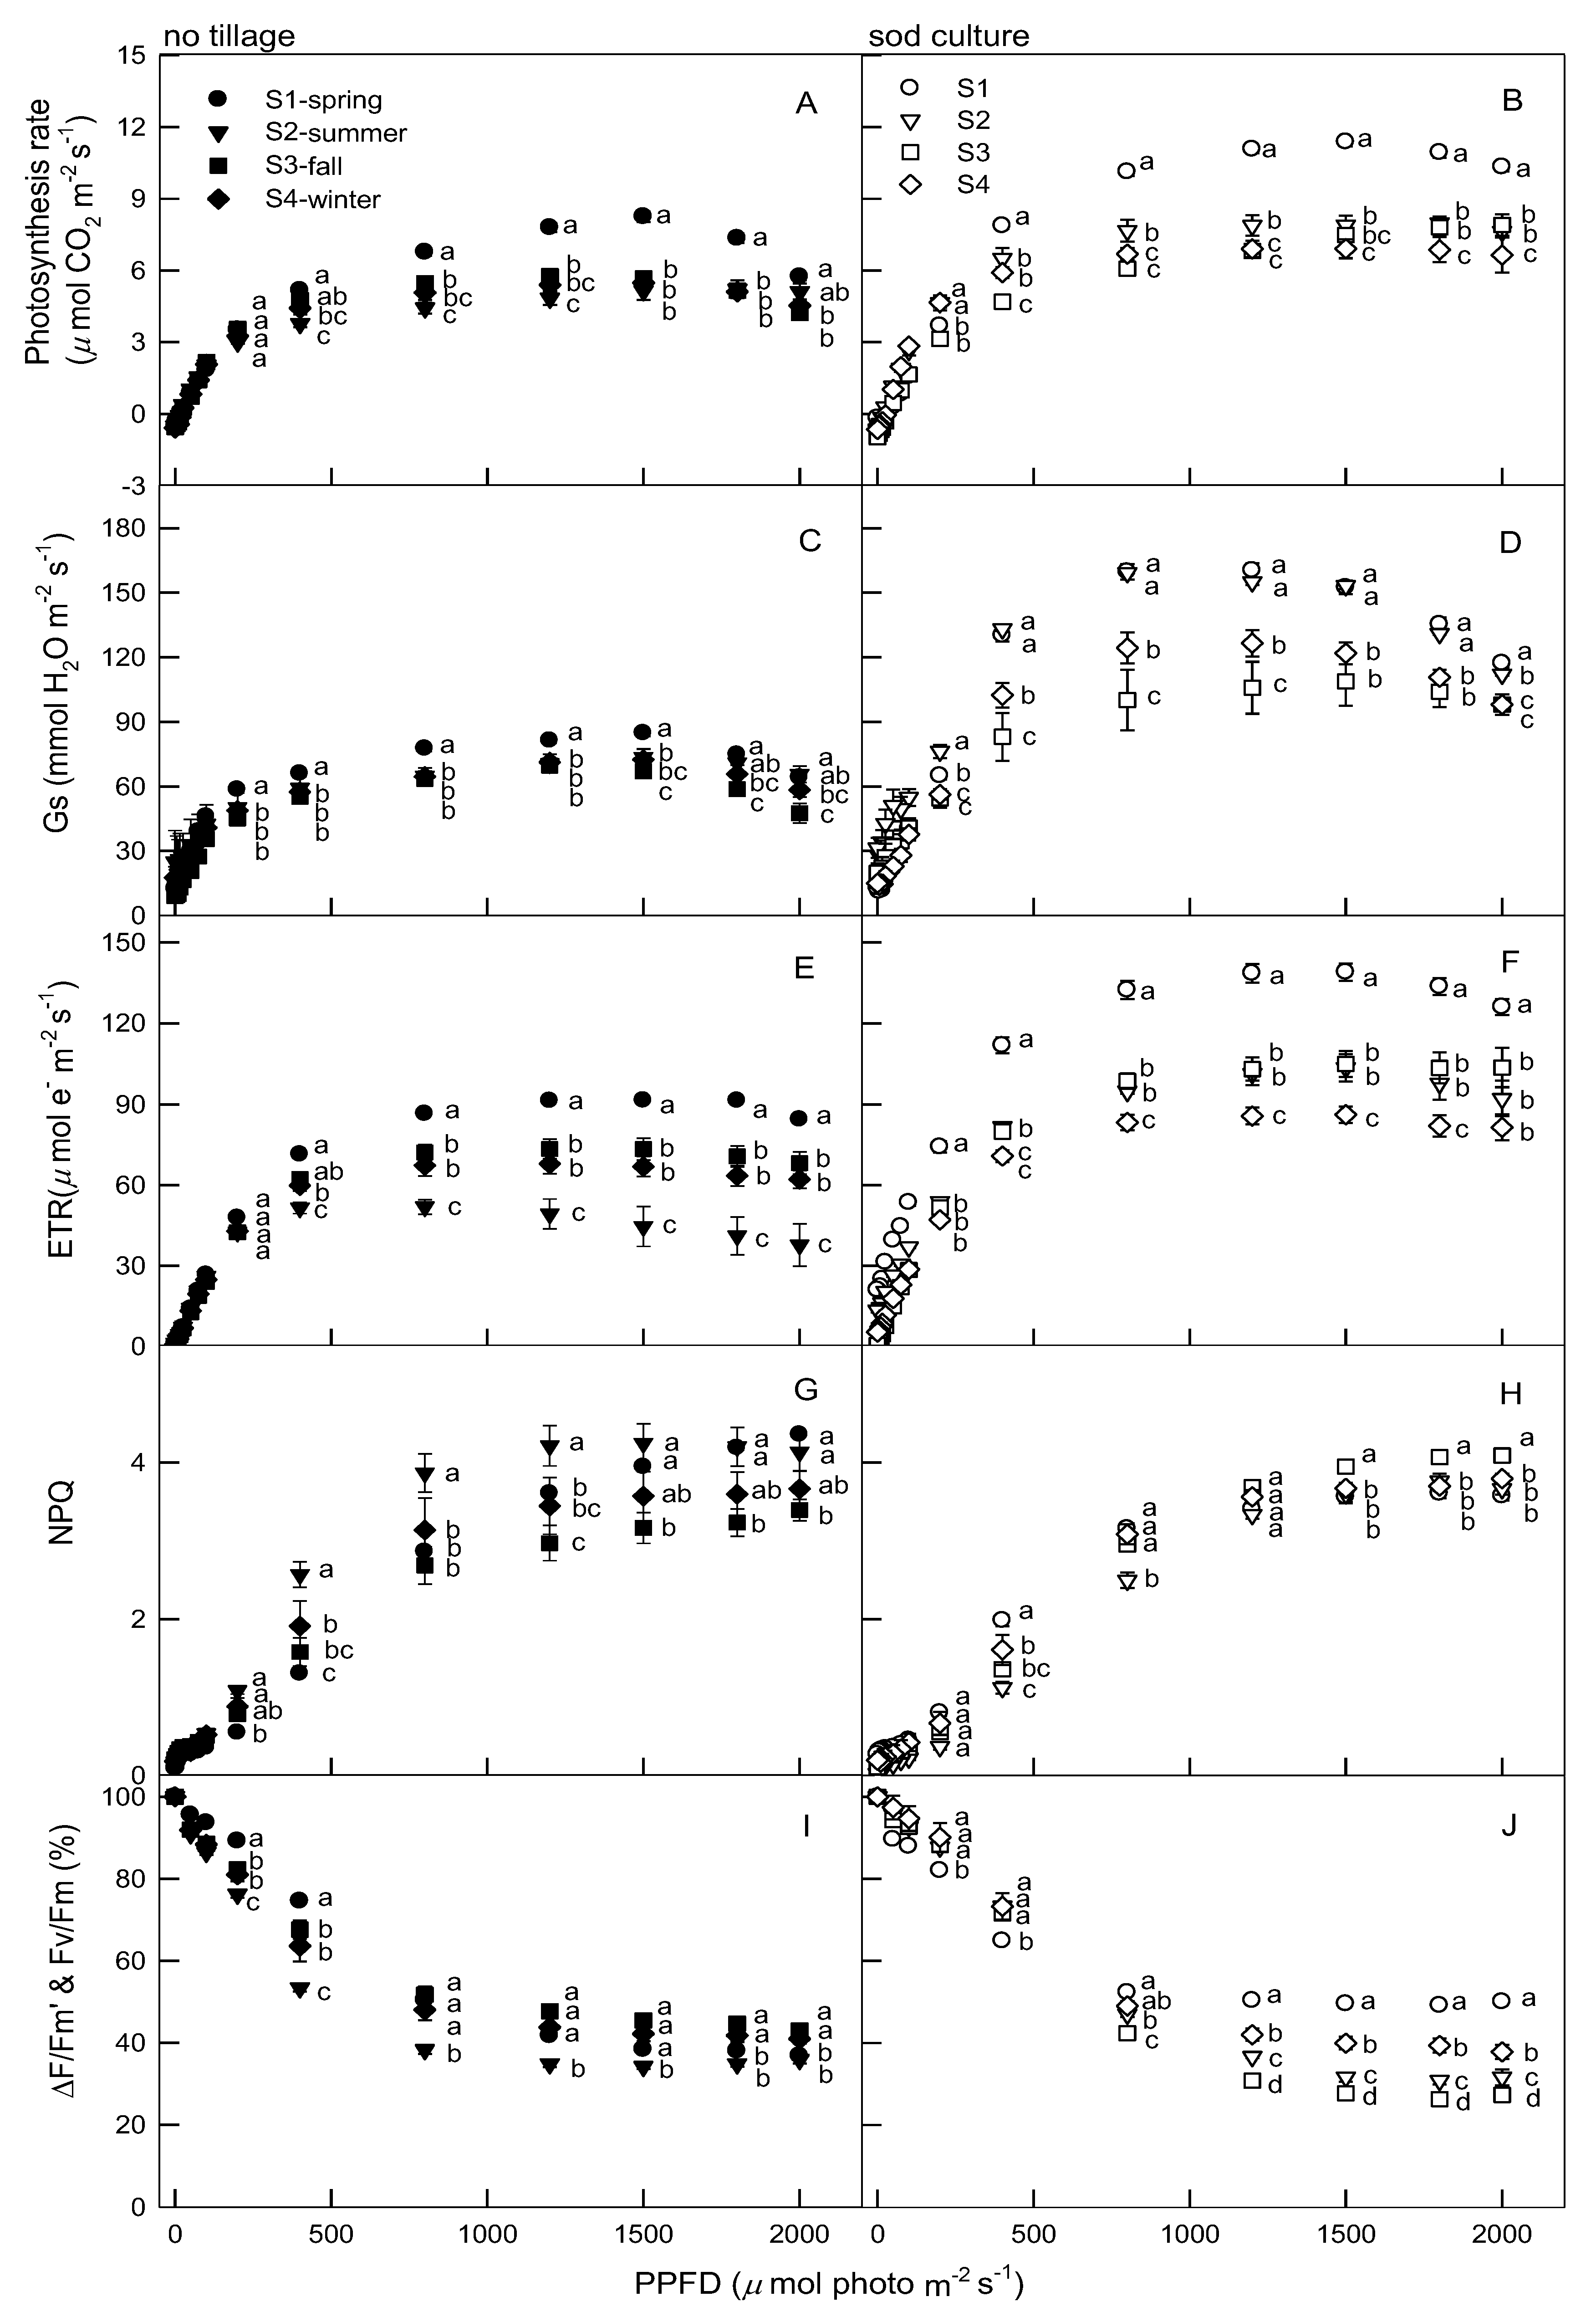
3.1. Trends in Citrus Photosynthetic Parameters under Varied Light Intensities, Tillages, and Seasons

The effects of NT and SC on citrus plants during the four seasons were monitored by measuring changes in photosynthetic parameters (Pn, Gs, slope of Gs-Pn, ETR, NPQ, ΔF/Fm’, Fv/Fm, Rd, Qy, LCP, and Amax). Table 1 indicates that all photosynthetic parameters displayed significant differences (p < 0.0001, 0.001, and 0.01) in the main effects (both NT and SC), excepting NPQ in both and Rd in tillage. Moreover, all photosynthetic indices were significantly different (p < 0.0001, 0.01, and 0.05) in interaction effects (T × S), with the exceptions of Gs, Rd, and Amax.
Figure 2 illustrates the photosynthetic indexes of citrus plants in response to different light intensities, and shows wide seasonal variations under the two tillages. All photosynthetic parameters showed no significant differences under 0, 5, 10, 15, 25, 50, 75, and 100 PPFD among seasons in either tillage. Spring Pn values (Figure 2A,B) of 400, 800, 1200, 1500, 1800, and 2000 PPFD were significantly higher compared to other seasons regardless of tillage, except that no significant differences in Pn values for 400 and 2000 PPFD were observed in spring and summer under NT (Figure 2A). In addition, as light intensity increased, the Pn values of all leaves in spring under either tillage increased from 0 to 1500 PPFD, and then decreased thereafter. The trend in Pn increased from winter, fall, summer, to spring, and therefore it might be a seasonal response. Gs content at 200, 400, 800, 1200, and 1500 PPFD in spring was significantly increased relative to other seasons under NT (Figure 2C), whereas Gs values at 400, 800, 1200, 1500, and 1800 PPFD under both spring and summer were significantly increased over fall and winter in SC (Figure 2D). Moreover, Gs levels of all plants increased as light intensity increased from 0 to 1200 PPFD. Figure 1E,F present ETR levels at 400~2000 PPFD in winter, which were significantly lower than in spring, and ETR values at 800~2000 PPFD were similar in both summer and fall seasons regardless of tillage. As light intensity increased from 0 to 1800 PPFD, the ETR of both tillages continued to increase as indicated by light response curves, followed by a decrease. All NPQ values (Figure 2G,H) at 200~2000 PPFD in spring were significantly higher than in winter regardless of tillage, except for 200 and 1200 PPFD, which were similar for SC (Figure 2H). In addition, as light intensity increased from 0 to 2000 PPFD, NPQ values of all leaves slowly increased in all seasons and both tillages. However, as light intensity increased from 0 to 1200 PPFD, the ΔF/Fm’ (Fv/Fm) of both tillages in all seasons continued to decrease as indicated by light response curves, followed by being steady from 1200 to 2000 PPFD (Figure 2I,J). In addition, in either tillage, the levels of ΔF/Fm’ (Fv/Fm) in spring of 200~2000 PPFD were significantly higher than in winter.

3.2. Changes in Citrus Photosynthetic Parameters under Varied Tillages and Seasons

Though photosynthetic parameters of citrus leaves under light intensities were very different over the seasons under the two tillages, there were some tendencies that enabled an assessment of the underlying mechanisms of the effects observed. The effects of the two tillages on Rd, Qy, LCP, Amax, and Fv/Fm of citrus leaves in different seasons are presented in Table 2. Rd measurements over eight seasons under the two tillages showed distinct dark respiration rate CO2 responses to the different seasons, where both fall and winter (0.71~0.95 µmol CO2 m−2 s−1) had significantly higher values compared to spring and summer (0.38~0.64 µmol CO2 m−2 s−1), suggesting that the relative increase in foliar respiration may be a response to physiological acclimation as the climate becomes colder. In addition, Rd increased in the order of spring, summer, and fall, and then decreased in winter under either tillage method. Qy values significantly increased in winter with SC (0.06 CO2/PPFD) compared to other seasons (0.02 and 0.03 CO2/PPFD), and Qy also increased in the order of spring, summer, fall, and winter. This implies that a cold climate would impact both the NT and SC of citrus plants, leading to reduced CO2 and carbon sink behavior. LCP levels of citrus significantly increased in the fall with SC (36.38 µmol PPFD m−2 s−1) compared to other seasons (16.84~23.65 µmol PPFD m−2 s−1) that showed no significant differences among seasons in either tillage method. Furthermore, Amax values were greatest when grown in spring under SC (11.38 µmol m−2 s−1) and lowest in summer and winter under NT (5.21 and 5.61 µmol m−2 s−1). The season impacted the pattern of Fv/Fm, which significantly increased Fv/Fm in summer. NT exhibited significant higher Fv/Fm in summer (0.79) than in other seasons (0.74~0.76), whereas Fv/Fm was significantly lower in winter (0.76) than in other seasons (0.79) under SC conditions.

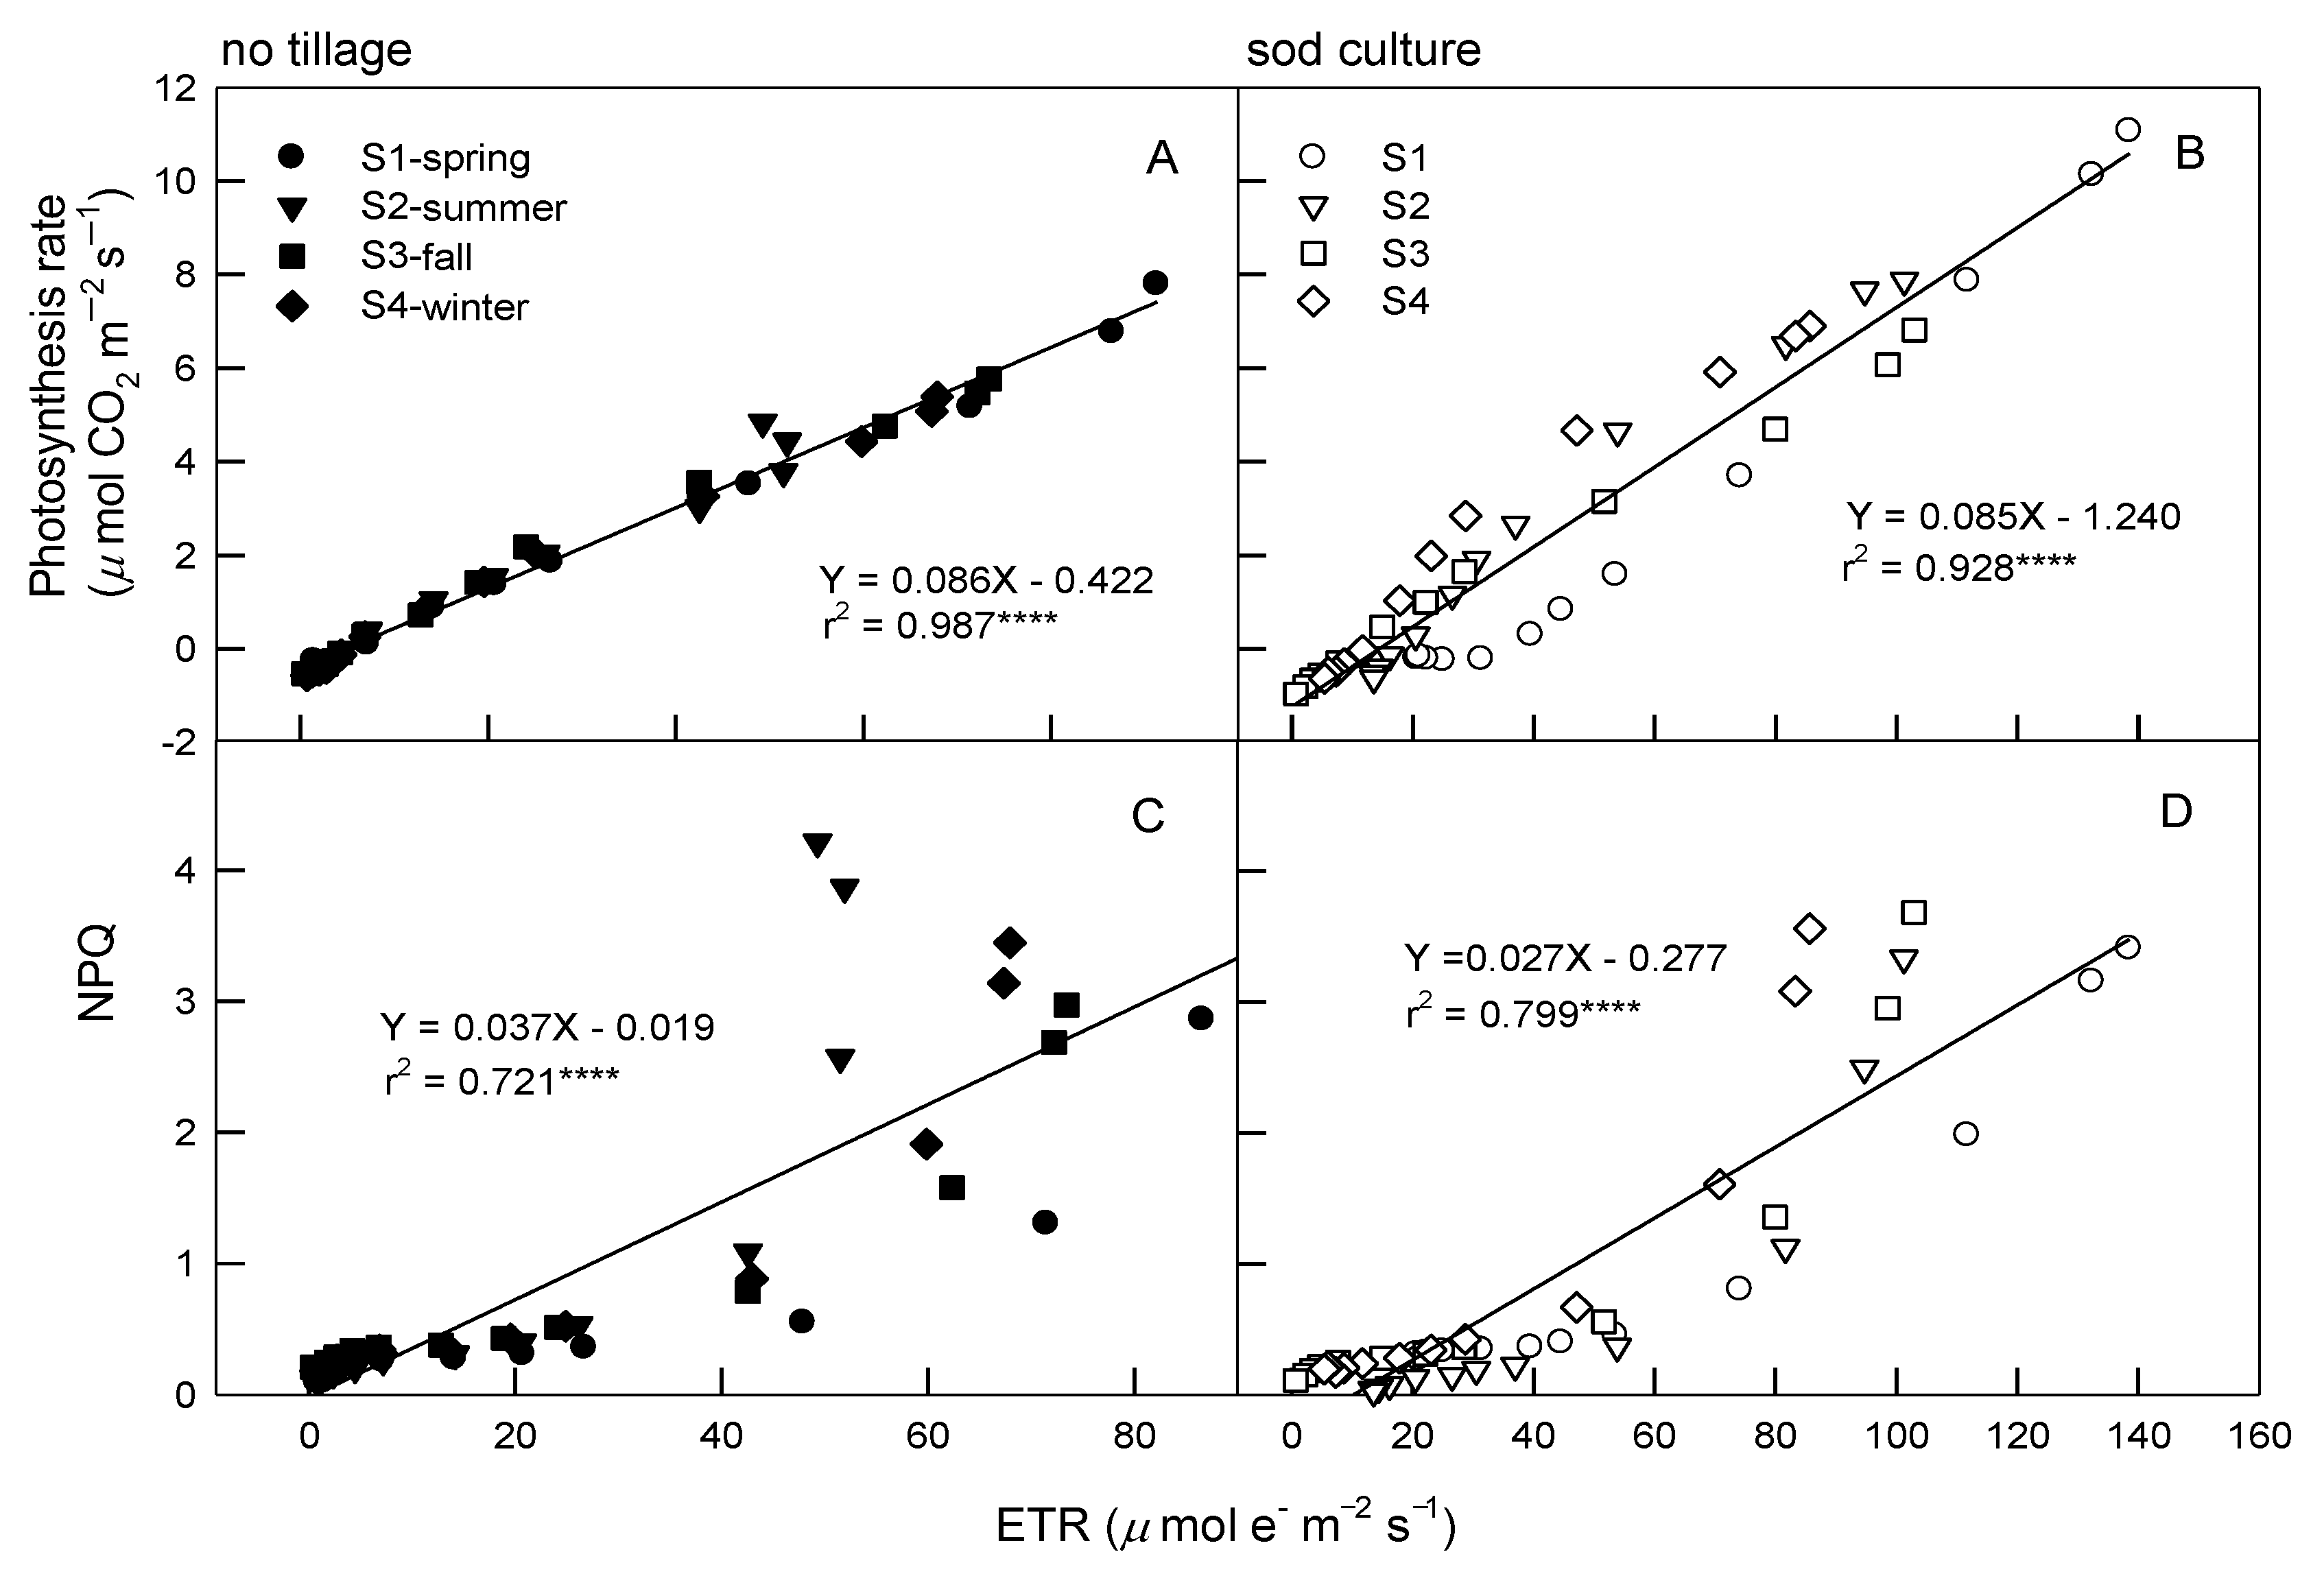
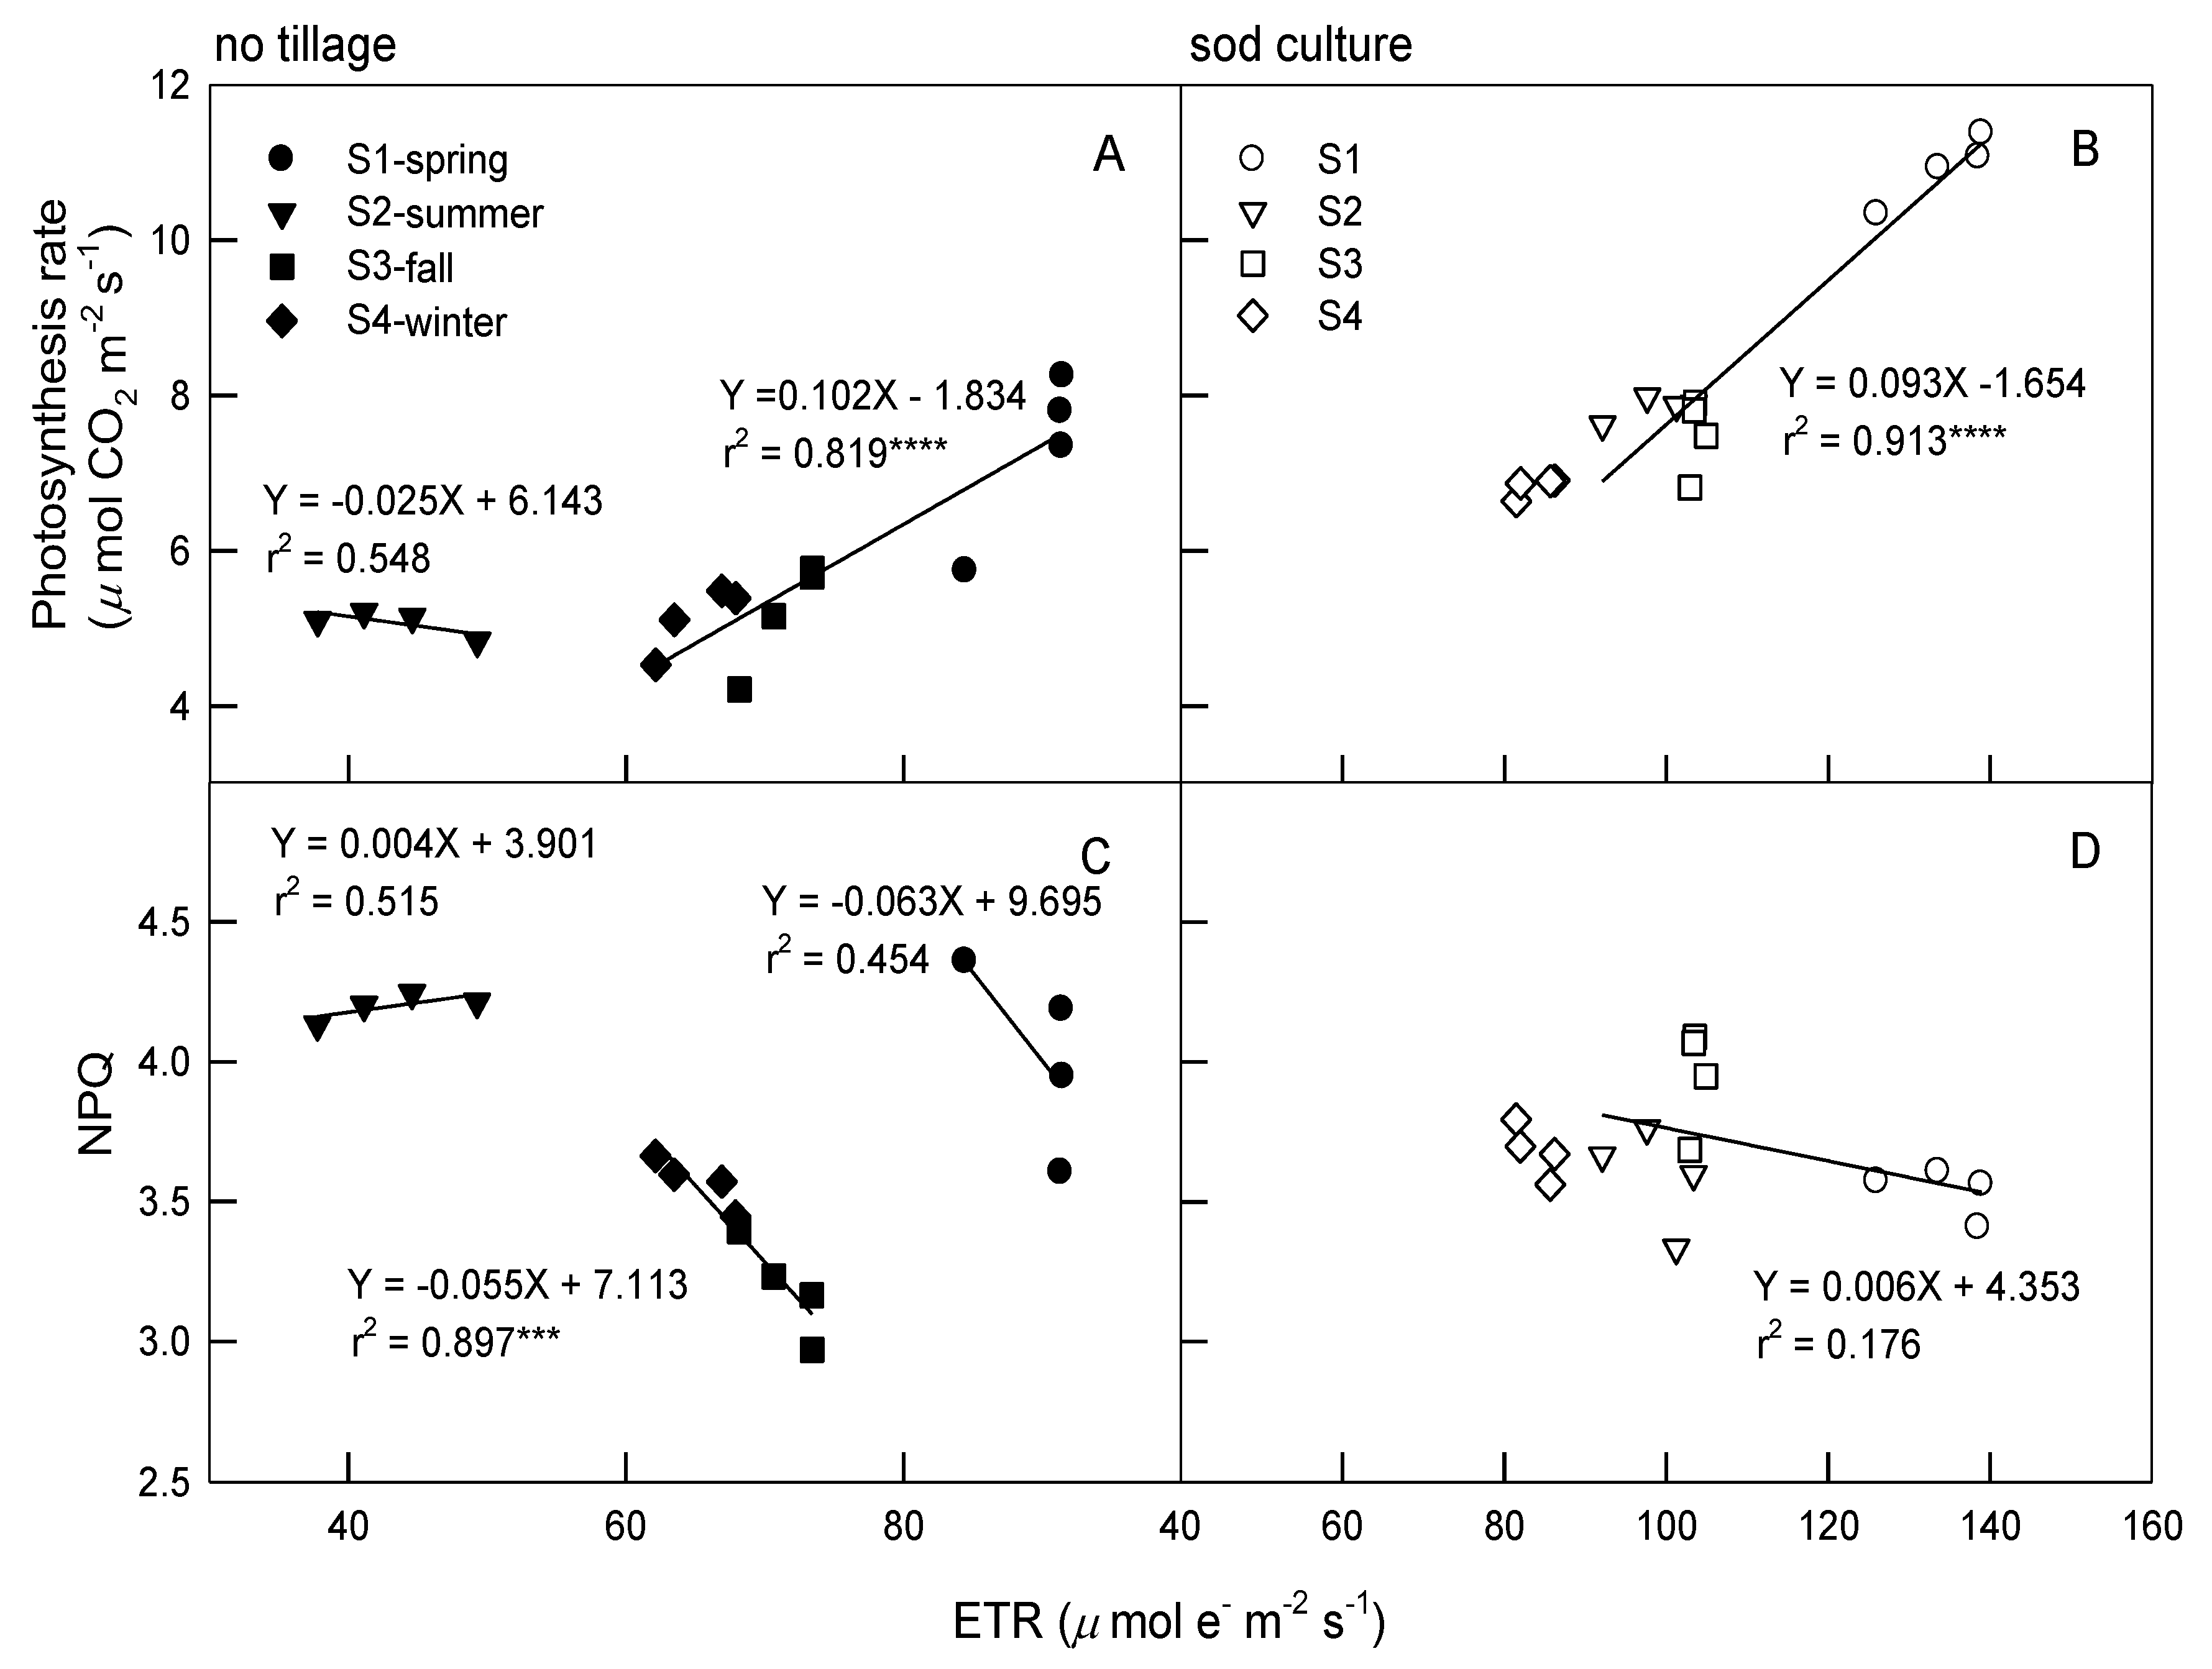
3.3. Relationships among Photosynthetic Parameters

Figure 3 illustrates the correlations between Gs and Pn in citrus grown under NT and SC at four seasons and irradiated at 0, 5, 10, 15, 25, 50, 75, 100, 200, 400, 800, 1200, 1500, 1800, and 2000 PPFD. Significant positive correlations at r2 = 0.949 and 0.918 (p < 0.0001) were found under NT and SC, respectively, between the Gs and Pn of leaves irradiated with varied light levels over the seasons, demonstrating that the increase in Pn may be caused by a stomatal opening. In addition, a higher slope in the linear relationship of Pn/Gs (equivalent to water-use efficiency; WUE) was observed in NT treatments (0.114) compared to SC (0.074), suggesting that NT is a water-saving practice. Correlations among ETR and Pn and NPQ of plants under NT and SC during four seasons at various PPFDs between 0~1200 μmol m−2 s−1 are shown in Figure 4. The data show significant correlations between ETR and Pn, with r2 = 0.987 and 0.928 (p < 0.0001) under NT and SC, respectively (Figure 4A,B). Furthermore, ETR was also significantly correlated to NPQ at r2 = 0.721 and 0.799 (p < 0.0001) under NT and SC, respectively, at the same PPFD conditions and seasons (Figure 4C,D).
Figure 5 shows that photosynthesis parameters were greatly affected by light intensity and that there was seasonal variation under the two tillages. There was a positive and significant correlation at r2 = 0.819 (p < 0.0001) between ETR and Pn under NT in response to spring, fall, and winter at 1200, 1500, 1800, and 2000 PPFD, whereas ETR showed a non-significance to Pnin spring (Figure 5A). However, ETR was significantly and positively correlated with Pn under SC, with r2 = 0.913 (p < 0.0001) under the same PPFD conditions and seasons (Figure 5B). In addition, and under the same PPFD conditions and seasons, the Pn values of citrus leaves under SC were higher than under NT, indicating that the photosynthesis rate of SC leaves was stronger than in NT leaves in all seasons. In Figure 5C, no correlations were observed between ETR and NPQ for plants under NT in spring and summer at 1200, 1500, 1800, and 2000 PPFD, but ETR was negatively correlated to NPQ (r2 =0.897, p < 0.0001) in fall and winter under the same PPFD conditions. Moreover, the NPQ values in spring and summer were higher than in fall and winter, indicating that the non-photochemical dissipation ability in spring and summer was stronger than that in fall and winter. Nevertheless, no relationship was observed between ETR and NPQ with SC under 1200, 1500, 1800, and 2000 PPFD (Figure 5D).

4. Discussion

Our study indicates that conservation agricultural systems improve WUE, increase the organic content of soils, and enhance C sequestration, notably in the soil surface layer [24,25]. As anthropogenic greenhouse gas emissions intensify global climate change, plantations have become an important tool to mitigate atmospheric CO2. Many studies have shown that the photosynthetic light response curve displays the relationship between light intensity and Pn of leaves and can be used to calculate LCP, Amax, and Rd [26,27,28]. These parameters were also correlated with metabolic variation, and can be used to predict growth and performance in variable environments and the impact of future climate change on carbon exchange between vegetation and the atmosphere [29]. Generally, Rd, Qy, LCP, Amax, and Fv/Fm values under SC were somewhat higher than under NT in the same season, particularly fall and winter (Table 2). The differences may be caused by long-term SC, prolonged moisture in the study sites, and a higher growth rate and carbon accumulation potential. By increasing the efficiency of photosynthesis, citrus leaves with SC can efficiently use light energy, thus presenting higher Rd, Qy, LCP, Amax, and Fv/Fm values. Acclimation may manifest as an increased capacity to photosynthesize or as a down-regulation of foliar respiration and CO2 assimilation under colder seasons [30]. On the other hand, citrus leaves under NT tend to have contrasting behaviors. Furthermore, the levels of both LCP and Amax in citrus leaves with NT management in summer were considerably lower with the light and CO2 they received, so leaves often received excess light energy and might have exhibited photoinhibition. Previous studies have pointed out that soil moisture conditions affecting plant morphology (leaf size and LMA) [31] and physiology (photosynthesis, transpiration, plant-water relations, and WUE) [9,28], and anatomy (xylem vessel features and stomatal morphological traits) [31] would produce a response and ultimately affect the yield. It is speculated that ground surface cover on the NT field was insufficient, leading to excessive water evaporation, resulting in temporary drought stress, and affecting the performance of leaf morphology and photosynthetic properties. Therefore, Rd, Qy, LCP, and Amax may be suitable criteria for evaluating the efficiency of photosynthesis. SC represents a potential boost to future land productivity, and tends to reduce production costs over the medium- and long-term, since it contributes to improvements in Rd, Qy, LCP, Amax, Pn, Gs, ETR, NPQ, Fv/Fm, and ΔF/Fm’ of plant leaves exposed to various light irradiation levels.
Pn, Gs, ETR, and NPQ increased simultaneously when the tested plants were maintained at < 1200 PPFD, suggesting that there was still an increase in excess light energy that potentially was dissipated by heat quenching. The trends in Pn, Gs, and ETR values were similar (Figure 2), indicating that citrus can be grown under a specific and optimal light intensity. The effects of stomatal limitation on the reduction of photosynthetic rates can be determined by the correlation between Pn and Gs. Stomata regulation not only can prevent excess water loss from leaves, but can also limit carbon uptake [9]. The photosynthesis curves of NT and SC in Pn were closely related to Gs, and positive and significant correlations were shown between Pn and Gs for the two tillages in all seasons with all light illuminations (Figure 3). These results demonstrated that, during the photosynthesis saturation period, changes in Pn were mainly affected by Gs, followed by maintaining high WUE. In addition, Pn and Gs levels in spring were higher than in summer, indicating that stomatal opening speed for citrus plants during high temperature was constrained, leading to a conservative water-use strategy developed in response to summer. Gs under NT in each season was lower than in SC, which might limit Pn, implying that Gs is the main limiting factor for citrus photosynthesis. As the substrates of photosynthesis, CO2, and water are crucial to crop growth and yield, plants need to balance the CO2 uptake for photosynthesis with water loss via transpiration for survival. Stomata control the exchange of gases between the leaf interior and the external atmosphere and improve WUE [9,32].
The susceptibility of photosynthesis to photoinhibition strongly depends on light intensity. Under high irradiance, the light reaction can absorb more photons than can be used for carbon fixation reactions; e.g., by leaves in the upper canopy layer exposed to the sun and also by shade leaves exposed to sunflecks. This excess absorbed light energy becomes a stressor and enhances the formation of reactive oxygen species that can damage many cellular components and therefore cause a depression in the efficiency of photosystems, especially PSII [33]. Stress decreases the ability of photosynthetic systems to utilize incident photons, thus leading to photoinhibition and reduced quantum yields of photochemistry and ChlF. Conversely, insufficient light can limit photosynthesis, which causes reductions in net carbon gains and plant growth. Under low light intensities that limit photosynthesis, zeaxanthin is converted to violaxanthin, and the reverse reaction occurs at high light intensities that exceed the level of light that can be consumed by photochemistry [34]. In our study, as light intensity increased, the higher ETR values of plants during spring tended to result in a higher photosynthetic efficiency relative to other seasons (Figure 2E,F), suggesting that the tested plants have adapted to high springtime light intensities.
NPQ is an important photoprotective mechanism of plants in response to high light irradiance damage, as it quenches excess energy and dissipates heat to avoid the harmful effects of excessive photon absorption [17,35]. NPQ increased rapidly at 0~800 PPFD (Figure 2G,H), inferring that NPQ was mainly responsible for the dissipation of energy in the early stage of illuminating the tested plants. Moreover, plants exhibited higher NPQ values in spring and summer under NT with increasing PPFD (Figure 2G), suggesting that high values of absorbed light utilized in photosynthesis correlated with season and tillage under 800 to 1500 PPFD conditions. Citrus plants showed high regulation to light irradiation depending on the interactions of season and tillages, and NPQ was used to balance the excess irradiant energy associated with high illumination. When absorbed light energy is not dissipated completely, excess energy will suppress photosynthesis system activity, causing a decrease in PSII reaction center efficiency and lowering Pn values [36]. When plants encounter high light irradiances, the effect of carbon fixation is restricted, and increased NPQ values include xanthophyll cycle-dependent energy quenching, photoinhibitory quenching, and changes in the structure of the PSII antenna system, all of which affect the rate of dissipating the heat of excess light energy [37,38]. Knowledge of these NPQ changes can enable the development of models for planning optimal processing times for the different seasons to match specific tillage needs, and could be useful for predicting the changes in performance and distribution of citrus plants.
As the light intensity increased, an increasing NPQ and decreasing ΔF/Fm’ (Fv/Fm) were observed in citrus plants in all seasons with both tillages (Figure 2G–J), indicating that both tillage methods had low photosynthetic rates and needed to dissipate excessive energy to protect PS; therefore, both methods exhibited high down-regulation of PSII efficiency [39]. The excess energy in PSII increased, leading to increases in NPQ values and decreases in Fv/Fm values due to greater energy dissipation when plants were exposed to a higher PPFD. When illumination was at 1200 ~ 2000 PPFD, the NPQ and ΔF/Fm’ (Fv/Fm) of the tested plants were stably maintained at high and low levels, respectively, with little or no change, indicating that the photochemical ability had reached saturation. The lower ΔF/Fm’ (Fv/Fm) levels (<60%) obtained at 800~2000 PPFD (Figure 2I,J) indicate that there is long-term photoinhibition and that a higher light intensity at 800~2000 PPFD is still suitable for the growth of these plants regardless of season and tillage practice. ΔF/Fm’ (Fv/Fm) may be strongly depressed after exposure to higher irradiations, which precipitates suppression of the electron transfer chain [40]. ΔF/Fm’ (Fv/Fm) also reflects photosynthetic potential as well as the potential for photochemical dissipation. In addition, ΔF/Fm’ shows the actual photochemical ability of PSII under various light intensities and has a linear relationship with the CO2 fixation rate [41]. ChlF components can be used to measure different functional levels of photosynthesis. Some ChlF components might exhibit distinguishable differences between NT and SC citrus plants under different seasons and light intensities, and various light intensity culture systems may be used to satisfy commercial requirements for rapid, large-scale, and precise management of citrus plant production.
There were no significant correlations between ETR and NPQ in tested plants in spring and summer under NT (Figure 5C) and in all seasons under SC (Figure 5D) at the high illuminations of 1200~2000 PPFD, indicating that this species might be facing high-illumination stress, resulting in a decline in ETR (Figure 2E,F), but the excess light energy generated would accordingly maintain NPQ (Figure 2G,H) due to the photoprotective mechanism continuously maintained by the presence of a high proportion of NPQ as illumination increased. These results might be useful in efforts to predict photosynthetic and respiratory responses to light irradiances in citrus. Nevertheless, significant and negative relationships were observed between the ETR and NPQ under NT in the fall and winter at 1200~2000 PPFD (Figure 5C), which seemed to be related to the reduction of ETR and saturation of the lutein cycle dependent on energy quenching. Therefore, it is speculated that citrus grown in the fall and winter has a high photoprotection ability at high PPFD, and this hybrid may adjust the path of energy flow absorption using heat quenching. Laza-Martínez et al. [42] revealed that xanthophyll cycle-associated photoprotection supports plant photosynthetic productivity and survival in environments with unique combinations of environmental factors. In our study, ETR was useful for the non-destructive estimation of Pn and NPQ, since these indices were significantly and positively correlated with ETR when exposed to 0~1200 PPFD (Figure 4) and 1200~2000 PPFD with SC (Figure 5B) and with NT in spring, fall, and winter (Figure 5A). This indicates that the path of energy flow to NPQ was used mainly for photoprotection, and that these plants may remain photochemically active and able to maintain Pn under high illumination. Simple evaluations of photosynthesis can be made and relationships between heat dissipation and photosynthetic efficiency can also be estimated. Variable photosynthesis parameters are highly sensitive indicators representing the physiological status of plants, providing a quick means to identify the physiological condition of plants [43]. Understanding the photosynthetic characteristics of citrus under varied seasons and tillages would benefit field cultivation management. Alternatively, choosing a suitable tillage method and using artificial shading should be considered in order to avoid photoinhibition resulting from exposure to high light intensity in field cultivation or further in climate change, especially in seasonally dry ecosystems, due to cycles of prolonged drought and heavy rain. SC planting methods can provide orchards with increased resilience to climate change and maintain orchard production and economic income.

5. Conclusions

Comparisons between NT and SC in different seasons present a useful tool for assessing the impacts of global climate change and for testing the applicability of new parameters for remotely sensing the physiological state of vegetation-absorbing constituents. Elevated Pn enhanced the positive effects of Amax, Fv/Fm, Gs, WUE, ETR, and NPQ of SC citrus in spring, demonstrating that elevated Pn would benefit citrus production and resilience to stress under SC in the central region of Taiwan under future climate scenarios. Quantifying the adjustments of Pn, Amax, Fv/Fm, Gs, WUE, ETR, and NPQ in response to seasonal light illumination variation and tillage management is crucial because CO2 and water release from citrus leaves is large. Our results also provide implications for sustainable citrus production for tillage cropping systems under future climate change of higher CO2 and potentially wetter or drier environments. Using ETR could quickly assess photosynthetic capacity in citrus plants for light intensity stress tolerance during the four seasons. Moreover, the precise management of photosynthetic parameters such as ETR in response to light irradiances under varied seasons and tillages may hold promise for maximizing the economic efficiency of the growth and development of citrus plants grown in the field, and provide an orchard management model to deal with the effects of climate change.

Author Contributions

C.-I.C. and C.-W.W. designed the experiments, K.-H.L. and C.-I.C. wrote the paper; M.-Y.H., C.-K.Y., Y.-H.L. and L.-H.L. conducted experiments and analyzed the data. M.-L.H. and C.-W.W. visualized and supervised the study. All authors have read and agreed to the published version of the manuscript.

Funding

This work was financially supported by the Council of Agriculture, Executive Yuan and Ministry of Science and Technology of Taiwan.

Conflicts of Interest

The authors declare that there is no competing interest and that the article is submitted without any commercial or economic interest that could be generated as a potential conflict of interest.

Abbreviations

ΔF/Fm’Actual quantum efficiency of PSII
CO2Carbon dioxide
ChlFChlorophyll fluorescence
RdDark respiration rate of CO2
ETRElectron transport rate
LHCLight-harvesting complexes
LCPLight compensation point
QyLight quantum yield of CO2
AmaxMaximum net assimilation of CO2
Fv/FmMaximal quantum yield of PSII photochemistry
NTNo-tillage
PnNet photosynthesis rate
NPQNonphotochemical quenching
PSPhotosystems
PPFDPhotosynthetic photon flux densities
GsStomatal conductance
SCSod culture
WUEWater use efficiency

References

  1. Council of Agriculture, Executive Yuan. Citrus Reticulate Blanco × C. Sinensis Osbeck Production Survey in Taiwan. 2019. Available online: https://kmweb.coa.gov.tw/theme_data.php?theme=production_map&id=50 (accessed on 1 July 2021).
  2. Arai, M.; Miura, T.; Tsuzura, H.; Minamiya, Y.; Kaneko, N. Two-year responses of earthworm abundance, soil aggregates, and soil carbon to no-tillage and fertilization. Geoderma 2018, 332, 135–141. [Google Scholar] [CrossRef]
  3. Cerdà, A.; Rodrigo-Comino, J.; Yakupoğlu, T.; Dindaroğlu, T.; Terol, E.; Mora-Navarro, G.; Arabameri, A.; Radziemska, M.; Novara, A.; Kavian, A.; et al. Tillage Versus No-Tillage. Soil Properties and Hydrology in an Organic Persimmon Farm in Eastern Iberian Peninsula. Water 2020, 12, 1539. [Google Scholar] [CrossRef]
  4. Peixoto, D.S.; Silva, L.D.C.M.D.; de Melo, L.B.B.; Azevedo, R.P.; Araújo, B.C.L.; de Carvalho, T.S.; Moreira, S.G.; Curi, N.; Silva, B.M. Occasional tillage in no-tillage systems: A global meta-analysis. Sci. Total Environ. 2020, 745, 140887. [Google Scholar] [CrossRef]
  5. Wang, P.; Wang, Y.; Wu, Q.-S. Effects of soil tillage and planting grass on arbuscular mycorrhizal fungal propagules and soil properties in citrus orchards in southeast China. Soil Tillage Res. 2016, 155, 54–61. [Google Scholar] [CrossRef]
  6. Zou, Y.-N.; Chen, X.; Srivastava, A.; Wang, P.; Xiang, L.; Wu, Q.-S. Changes in rhizosphere properties of trifoliate orange in response to mycorrhization and sod culture. Appl. Soil Ecol. 2016, 107, 307–312. [Google Scholar] [CrossRef]
  7. Bai, R.; Wang, Y.; Ma, Z.; Jia, Y. Research Advance on Sod Culture in Peach Orchard. J. Agric. Sci. Technol. 2017, 18, 270–284. Available online: https://www.proquest.com/scholarly-journals/research-advance-on-sod-culture-peach-orchard/docview/2202108940/se-2?accountid=8090 (accessed on 1 July 2021).
  8. Lin, Y.H.; Chiu, J.Y. Studies on the sod culture and the management of soil moisture for the improvement of wax apple quality. Afr. J. Biotechnol. 2019, 18, 719–725. [Google Scholar] [CrossRef]
  9. Deans, R.M.; Brodribb, T.J.; Busch, F.A.; Farquhar, G.D. Plant water-use strategy mediates stomatal effects on the light induction of photosynthesis. New Phytol. 2018, 222, 382–395. [Google Scholar] [CrossRef]
  10. Bhusal, N.; Bhusal, S.J.; Yoon, T.-M. Comparisons of physiological and anatomical characteristics between two cultivars in bi-leader apple trees (Malus × domestica Borkh.). Sci. Hortic. 2017, 231, 73–81. [Google Scholar] [CrossRef]
  11. Nakaji, T.; Oguma, H.; Fujinuma, Y. Seasonal changes in the relationship between photochemical reflectance index and photosynthetic light use efficiency of Japanese larch needles. Int. J. Remote Sens. 2006, 27, 493–509. [Google Scholar] [CrossRef]
  12. Wehr, R.; Munger, J.W.; McManus, J.B.; Nelson, D.D.; Zahniser, M.S.; Davidson, E.A.; Wofsy, S.C.; Saleska, S.R. Seasonality of temperate forest photosynthesis and daytime respiration. Nature 2016, 534, 680–683. [Google Scholar] [CrossRef]
  13. Sulman, B.N.; Roman, D.T.; Yi, K.; Wang, L.; Phillips, R.P.; Novick, K.A. High atmospheric demand for water can limit forest carbon uptake and transpiration as severely as dry soil. Geophys. Res. Lett. 2016, 43, 9686–9695. [Google Scholar] [CrossRef]
  14. Chen, C.-I.; Wang, Y.-N.; Lin, H.-H.; Wang, C.-W.; Yu, J.-C.; Chen, Y.-C. Seasonal Photosynthesis and Carbon Assimilation of Dynamics in a Zelkova serrata (Thunb.) Makino Plantation. Forests 2021, 12, 467. [Google Scholar] [CrossRef]
  15. Montgomery, R.A.; Givnish, T.J. Adaptive radiation of photosynthetic physiology in the Hawaiian lobeliads: Dynamic photosynthetic responses. Oecologia 2008, 155, 455–467. [Google Scholar] [CrossRef]
  16. Müller, P.; Li, X.-P.; Niyogi, K.K. Non-Photochemical Quenching. A Response to Excess Light Energy. Plant. Physiol. 2001, 125, 1558–1566. [Google Scholar] [CrossRef] [PubMed] [Green Version]
  17. Murchie, E.H.; Niyogi, K.K. Manipulation of Photoprotection to Improve Plant Photosynthesis. Plant. Physiol. 2010, 155, 86–92. [Google Scholar] [CrossRef] [PubMed] [Green Version]
  18. Lin, K.-H.; Shih, F.-C.; Huang, M.-Y.; Weng, J.-H. Physiological Characteristics of Photosynthesis in Yellow-Green, Green and Dark-Green Chinese Kale (Brassica oleracea L. var. alboglabra Musil.) under Varying Light Intensities. Plants 2020, 9, 960. [Google Scholar] [CrossRef] [PubMed]
  19. Forestry Bureau. Interviews of the Farmers with Green Conservation Label in Central Taiwan and Promotion to Develop Environment-Friendly Agriculture. 2019. Available online: https://conservation.forest.gov.tw/0002114 (accessed on 1 July 2021).
  20. Wong, S.L.; Huang, M.Y.; Chen, C.W.; Weng, J.H. Light induction of nonphotochemical quenching, CO2 fixation, and photoinhibition in woody and fern species adapted to different light regimes. Photosynthetica 2014, 52, 272–280. [Google Scholar] [CrossRef]
  21. Weng, J.H.; Chien, L.F.; Jiang, C.Y.; Shih, F.C.; Chen, H.Y. A comparison between yellow-green and green cultivars of four vegetable species in pigments, ascorbate, photosynthesis, energy dissipation, and photoinhibition. Photosynthetica 2011, 49, 361–370. [Google Scholar] [CrossRef] [Green Version]
  22. Thornley, J.H.M. Instantaneous Canopy Photosynthesis: Analytical Expressions for Sun and Shade Leaves Based on Exponential Light Decay Down the Canopy and an Acclimated Non-rectangular Hyperbola for Leaf Photosynthesis. Ann. Bot. 2002, 89, 451–458. [Google Scholar] [CrossRef] [Green Version]
  23. Johnson, M.P.; Ruban, A.V. Restoration of rapidly reversible photoprotective energy dissipation in the absence of PsbS protein by enhanced △pH. J. Biolog. Chem. 2011, 286, 19973–19981. [Google Scholar] [CrossRef] [PubMed] [Green Version]
  24. Sá, J.C.D.M.; Séguy, L.; Tivet, F.; Lal, R.; Bouzinac, S.; Borszowskei, P.R.; Briedis, C.; Dos Santos, J.B.; Hartman, D.D.C.; Bertoloni, C.G.; et al. Carbon Depletion by Plowing and its Restoration by No-Till Cropping Systems in Oxisols of Subtropical and Tropical Agro-Ecoregions in Brazil. Land Degrad. Dev. 2013, 26, 531–543. [Google Scholar] [CrossRef] [Green Version]
  25. Telles, T.S.; Reydon, B.P.; Maia, A.G. Effects of no-tillage on agricultural land values in Brazil. Land Use Policy 2018, 76, 124–129. [Google Scholar] [CrossRef]
  26. Lachapelle, P.-P.; Shipley, B. Interspecific prediction of photosynthetic light response curves using specific leaf mass and leaf nitrogen content: Effects of differences in soil fertility and growth irradiance. Ann. Bot. 2012, 109, 1149–1157. [Google Scholar] [CrossRef] [Green Version]
  27. Lang, Y.; Wang, M.; Zhang, G.C.; Zhao, Q.K. Experimental and simulated light responses of photosynthesis in leaves of three tree species under different soil water conditions. Photosynthetica 2013, 51, 370–378. [Google Scholar] [CrossRef]
  28. Chen, C.-I.; Wang, Y.-N.; Yu, J.-C. Diurnal and Seasonal CO2 Assimilation by Four Plantation Species in Taiwan. For. Sci. 2018, 65, 68–76. [Google Scholar] [CrossRef]
  29. O’Leary, B.M.; Lee, C.P.; Atkin, O.K.; Cheng, R.; Brown, T.B.; Millar, A.H. Variation in Leaf Respiration Rates at Night Correlates with Carbohydrate and Amino Acid Supply. Plant. Physiol. 2017, 174, 2261–2273. [Google Scholar] [CrossRef] [Green Version]
  30. Smith, N.G.; Dukes, J.S. Plant respiration and photosynthesis in global-scale models: Incorporating acclimation to temperature and CO2. Glob. Chang. Biol. 2012, 19, 45–63. [Google Scholar] [CrossRef]
  31. Bhusal, N.; Kim, H.S.; Han, S.-G.; Yoon, T.-M. Photosynthetic traits and plant–water relations of two apple cultivars grown as bi-leader trees under long-term waterlogging conditions. Environ. Exp. Bot. 2020, 176, 104111. [Google Scholar] [CrossRef]
  32. Eyland, D.; van Wesemael, J.; Lawson, T.; Carpentier, S. The impact of slow stomatal kinetics on photosynthesis and water use efficiency under fluctuating light. Plant. Physiol. 2021, 186, 998–1012. [Google Scholar] [CrossRef] [PubMed]
  33. D’Ambrosio, N.; Arena, C.; De Santo, A.V. Temperature response of photosynthesis, excitation energy dissipation and alternative electron sinks to carbon assimilation in Beta vulgaris L. Environ. Exp. Bot. 2006, 55, 248–257. [Google Scholar] [CrossRef]
  34. Demmig-Adams, B.; Stewart, J.J.; López-Pozo, M.; Polutchko, S.K.; Adams, W.W. Zeaxanthin, a Molecule for Photoprotection in Many Different Environments. Molecules 2020, 25, 5825. [Google Scholar] [CrossRef]
  35. Esteban, R.; Fernandez-Marin, B.; Hernandez, A.; Jiménez, E.T.; León, A.; García-Mauriño, S.; Silva, C.D.; Dolmus, J.R.; Dolmus, C.M.; Molina, M.J.; et al. Salt crystal deposition as a reversible mechanism to enhance photoprotection in black mangrove. Trees 2012, 27, 229–237. [Google Scholar] [CrossRef]
  36. Molina-Bravo, R.; Arellano, C.; Sosinski, B.R.; Fernandez, G.E. A protocol to assess heat tolerance in a segregating population of raspberry using chlorophyll fluorescence. Sci. Hortic. 2011, 130, 524–530. [Google Scholar] [CrossRef]
  37. La Porta, N.; Bertamini, M.; Nedunchezhian, N.; Raddi, P.; Muthuchelian, K. Photoinhibition of photosynthesis in needles of two cypress (Cupressus sempervirens) clones. Tree Physiol. 2005, 25, 1033–1039. [Google Scholar] [CrossRef] [PubMed] [Green Version]
  38. Schansker, G.; Toth, S.Z.; Strasser, R.J. Dark recovery of the Chl a fluorescence transient (OJIP) after light adaptation: The qT-component of non-photochemical quenching is related to an activated photosystem I acceptor side. Biochim. Biophys. Acta-Bioenerg. 2006, 1757, 787–797. [Google Scholar] [CrossRef] [Green Version]
  39. Zulfugarov, I.S.; Ham, O.-K.; Mishra, S.R.; Kim, J.-Y.; Nath, K.; Koo, H.-Y.; Kim, H.-S.; Moon, Y.-H.; An, G.; Lee, C.-H. Dependence of reaction center-type energy-dependent quenching on photosystem II antenna size. Biochim. Biophys. Acta-Bioenerg. 2007, 1767, 773–780. [Google Scholar] [CrossRef] [PubMed] [Green Version]
  40. Wu, C.-W.; Lin, K.-H.; Lee, M.-C.; Peng, Y.-L.; Chou, T.-Y.; Chang, Y.-S. Using Chlorophyll Fluorescence and Vegetation Indices to Predict the Timing of Nitrogen Demand in Pentas lanceolata. Korean J. Hortic. Sci. Technol. 2015, 33, 845–853. [Google Scholar] [CrossRef] [Green Version]
  41. Cui, L.; Li, J.; Fan, Y.; Xu, S.; Zhan, Z. High Temperature Effects on Photo-Synthesis, PSII Functionality and Antioxidant Activity of Two Festuca arundinacea Cultivars with Different Heat Susceptibility. Bot. Stud. 2006, 47, 61–69. Available online: https://www.semanticscholar.org/paper/High-Temperature-Effects-on-Photosynthesis%2C-PSII-of-Cui-Li/3786d1211bf37d20f0ee0365098f733592f59c58 (accessed on 1 July 2021).
  42. Laza-Martínez, A.; Fernández-Marín, B.; García-Plazaola, J.I. Rapid colour changes in Euglena sanguinea (Euglenophyceae) caused by internal lipid globule migration. Eur. J. Phycol. 2018, 54, 91–101. [Google Scholar] [CrossRef] [Green Version]
  43. Hirotsu, N.; Makino, A.; Yokota, S.; Mae, T. The Photosynthetic Properties of Rice Leaves Treated with Low Temperature and High Irradiance. Plant. Cell Physiol. 2005, 46, 1377–1383. [Google Scholar] [CrossRef] [PubMed] [Green Version]
Figure 1. Monthly air temperatures (bar) and precipitation (circle) during the study period from June 2019 to May 2020 at the lower-elevation mountain area of central Taiwan (120°46′22″ E, 23°52′19″ N).
Agronomy 11 01805 g001
Figure 2. Comparison of NT and SC on Pn (panels A,B), Gs (panels C,D), ETR (panels E,F), NPQ (panels G,H), ΔF/F’m, and Fv/Fm (panels I,J) of citrus grown in four seasons (S1–S4) monitored from June 2019 to May 2020. Data are mean ± standard error, and each point represents the mean of five leaves. Different letters indicate significant differences in Tukey’s HSD analyses over four seasons (p < 0.05).
Agronomy 11 01805 g002
Figure 3. Correlations between Gs and Pnof citrus grown in NT (panel A) and SC (panel B) in four seasons (S1–S4 respective to spring, summer, fall, and winter) monitored from June 2019 to May 2020. Plants were subjected to light irradiations of 0, 5, 10, 15, 25, 50, 75, 100, 200, 400, 800, 1200, 1500, 1800, and 2000 μmol m−2 s−1 PPFD for 75 min. Each symbol represents the average of five leaves on one plant, and five plants were randomly selected from tillage and season treatments. Each line represents the time point of 60 leaf values (four seasons multiplied by 15 PPFD) from the model’s validation datasets. The correlation coefficients (r) are calculated and significance (p) is at a 0.0001 probability (****) level.
Agronomy 11 01805 g003
Figure 4. Correlations among ETR and Pn, NPQ of citrus grown in NT (panels A,C) and SC (panels B,D) in four seasons (S1–S4 respective to spring, summer, fall, and winter) monitored from June 2019 to May 2020. Plants were subjected to light irradiances at 0, 5, 10, 15, 25, 50, 75, 100, 200, 400, 800, and 1200 μmol m−2 s−1 PPFD for 60 min. Each symbol represents the average of five leaves on one plant, and five plants were randomly selected from tillage and season treatments. Each line represents the time point of 48 values (four seasons multiplied by 12 PPFD) from model validation datasets. Correlation coefficients (r) are calculated and significance (p) is at the 0.0001 probability (****) level.
Agronomy 11 01805 g004
Figure 5. Correlations among ETR and Pn, NPQ of citrus grown in NT (panels A,C) and SC (panels B,D) in four seasons (S1–S4 respective to spring, summer, fall, and winter) monitored from June 2019 to May 2020. Plants were subjected to light irradiances at 1200, 1500, 1800, and 2000 μmol m−2 s−1 PPFD for 20 min. Each symbol represents the average of five leaves on one plant, and five plants were randomly selected from tillage and season treatments. Each line represents the time point of 16 values (four seasons multiplied by 4 PPFD) from model validation datasets. The correlation coefficients (r) are calculated and significance (p) is at a 0.0001 probability (****) level, 0.001 probability (***) level.
Agronomy 11 01805 g005
Table 1. ANOVA of tillage (T), season (S), and their interactions (T × S) for Pn, Gs, slope of Gs-Pn, ETR, NPQ, ΔF/Fm’ (%), Fv/Fm, Rd, Qy, LCP, and Amax of citrus at 2000 μmol m−2 s−1 PPFD with NT and SC in four seasons.
F-Value and Significance
Source of VariancePnGsSlopeETRNPQΔF/Fm’ (%)Fv/FmRdQyLCPAmax
Tillage (T)157.19380.1755.47103.771.239.322.211.7820.187.9683.76
****************NS******NS**********
Season (S)17.1119.365.3323.141.4829.117.219.7163.556.0238.69
**************NS*********************
T × S4.820.973.743.8711.5753.813.791.9143.854.872.9
**NS***********NS******NS
*: p < 0.05, **: p < 0.01, ***: p < 0.001, ****: p < 0.0001. NS, no significant difference.
Table 2. Influence of NT and SC on Fv/Fm, Rd, Qy, LCP, Amax, and Fv/Fm of citrus grown in four seasons monitored from June 2019 to May 2020.
Photosynthetic ParametersNo Tillage (NT)Sod Culture (SC)
SpringSummerFallWinterSpringSummerFallWinter
Rd
(µmol CO2 m−2 s−1)
0.44 bc0.49 bc0.85 a0.71 a0.38 c0.64 b0.95 a0.78 a
Qy
(CO2/PPFD)
0.02 c0.03 b0.03 b0.03 b0.02 c0.03 b0.03 b0.06 a
LCP
(µmol PPFD m−2 s−1)
20.18 b16.84 b20.00 b21.14 b23.65 b19.13 b36.38 a21.21 b
Amax
(µmol CO2 m−2 s−1)
8.15 b5.21 d5.82 c5.61 d11.38 a8.10 b7.96 bc6.84 c
Fv/Fm0.76 b0.79 a0.74 c0.75 c0.79 a0.79 a0.79 a0.76 b
Different letters indicate significant differences in the Tukey’s HSD analyses under eight treatments (two methods and four seasons) (p < 0.05). Each point represents a mean of 5 leaves.
Publisher’s Note: MDPI stays neutral with regard to jurisdictional claims in published maps and institutional affiliations.

