Article

Winter Pea Mixtures with Triticale and Oat for Biogas and Methane Production in Semiarid Conditions of the South Pannonian Basin

1
Institute of Field and Vegetable Crops, National Institute of the Republic of Serbia, Maxim Gorki 30, 21000 Novi Sad, Serbia
2
College of Grassland Agriculture, Northwest A&F University, Yanglin 712100, China
3
Department of Agronomy, Kansas State University, Manhattan, KS 66506, USA
*
Author to whom correspondence should be addressed.
Agronomy 2021, 11(9), 1800; https://doi.org/10.3390/agronomy11091800
Submission received: 5 August 2021 / Revised: 3 September 2021 / Accepted: 5 September 2021 / Published: 8 September 2021

Abstract

:
Due to the increase in greenhouse gases from burning fossil fuels, there is increased attention on renewable energy sources from specialized crops. These crops should not compete with food security, and it is important to select plant resources which can produce methane-rich biogas efficiently. The most commonly used energy crops are planted and managed intensively with high inputs in productive land, and this negatively affects land use and sustainable use of resources. The main purposes of this study are to: (a) determine the best cropping system for optimal biogas and methane production from sole crops of winter pea, triticale and out and their mixtures at two different maturity stages (first stage: full-flowering stage of winter pea and beginning of milky stage of cereals; second stage: emergence of firsts pods for pea and milky/waxy stage of cereals); and (b) to develop and use a surface model to determine the best combinations of various mixtures that result in highest biogas and methane. The used pure or mixtures of pea, oat and triticale in two seed weight ratios (50%:50% and 75%:25%) produced different green mass, dry matter, solids, biogas and methane yields. The experiments showed that maximum green mass was produced by the mixture of pea and oat at the seed ratio 75%:25% and when crop was harvested at the full-flowering stage of winter pea and beginning of the milky stage of cereals. After quadratic model analyses, the combination ratios of the oat and triticale were, respectively, 30% and 8%, with a maximum green biomass yield of 61.48 t ha1, while the corresponding values were 28% and 38%, with maximum solids yields of 25.64 t ha1. As the model was set at 100 for all three independent variables (oat, triticale and pea), the pea should be at 62% (100-30-8) and 34% (100-28-38), respectively, for green mass and organic solids yields. The results of surface analysis and multivariate analysis of variance showed that the mixture of oat and triticale had great potentiality for biogas and methane yields. The optimal mixture of oat with triticale was 27~35% with 73~65% for producing biogas and (or) methane.

1. Introduction

Climate change caused by anthropogenic greenhouse gas (GHG) emissions is a major global challenge that needs immediate attention. At the present, fossil fuels (coal, oil and natural gas) are the primary sources of energy. Combustion of fossil fuels and related processes have contributed to largest proportion of the total GHGs over the last several decades, with an annual production of more than 30 billion tonnes of carbon dioxide (CO2) [1]. There have been several measures at the global level to minimize dependence on fossil fuels [2] and find alternatives sources of energy. One of these measures is to explore and use renewable energy sources from crop and residues. Although there has been research on use of grain crops for biofuels, the use of such crops competes with food security. To minimize the competition between food grains and energy production, using lignocellulosic biomass through anaerobic digestion process is a good option. Production of methane-rich biogas through anaerobic digestion of organic materials has been evaluated as one of the most energy efficient and environmentally benign pathways of renewable energy generation [3]. The special importance of the production and use of biogas is to prevent emission of methane that increases the greenhouse effect (the intensity is 23 times greater than CO2) [4].
The concept to use dedicated plant biomass, the so called “bioenergy crops” for methane production (bio methanation) is not new. Early investigations on the bio methanation potential of different crops and plant materials were carried out in the 1930s by Buswell in the USA and later on in the 1950s by Reinhold and Noack in Germany [5]. The potential use of oats (Avena sativa L.), grass and straw was demonstrated in New Zealand, resulting in methane yields of 170–280 m3 t−1 total solids (TS) [6]. Even water hyacinths and freshwater algae were shown to result methane yields between 150 and 240 m3 t−1 total solids (TS) [7]. In the USA, a large project on microalgae and kelp for aquatic raw material production was initiated [8]. Although the digestion of crop material was demonstrated, the process was hardly applied in practice [9]. Crop digestion was commonly not considered to be economically feasible. Crops, plants, plant by-products and waste materials were just added occasionally to stabilize anaerobic waste digesters [10]. With steadily increasing oil prices and the need for a climate framework, “bioenergy crop” research and development gained attention in the 1990s. In Germany, for example, the number of digesters using energy crops has increased from about 100 in 1990 to nearly 8000 in 2014 [11]. To renew this Paris Climate Agreement was signed to curb greenhouse gases and keep global temperature rise below 2 °C and its implementation has gained global attention [12].
Many conventional forage crops are easy to cultivate and produce large amount of biomass. Furthermore, being bred for animal feed, these crops are often characterized by good digestibility [13]. The most important parameter in choosing crops for methane production is the net energy yield per hectare, which is defined mainly by biomass yield and convertibility of the biomass to methane [14]. Continuous production of homogeneous biomass is crucial for a constant supply of digester. Currently, most bioenergy crops (as well as most important food crops) are grown as intensive monocultures. In Germany, nearly 80% of all energy crops for biogas production are maize (Zea mays L.) for silage [15]. This dominance of monocropping system frequently causes ecological problems such as loss of biodiversity, soil erosion, nitrogen leaching and increased use of pesticides due to enhanced pressure of pests and diseases in tight crop rotations or monocultures [16]. In order to meet these targets, the double cropping system has been suggested and intensively investigated over recent years [17]. It involves the cultivation of two crops during the first year with the combination of winter-hardy crops (first crop) and summer crops (second crop).
The Pannonian basin is one of the largest regions in Europe which extends over nine countries including Serbia. This region has been sensitive to climate change and is increasingly confronted with heat waves and drought [18,19]. Finding alternatives fuel sources, especially the crops that are already grown in the region, would be important. Traditionally, in the Republic of Serbia, mixtures of winter pea (Pisum sativum subsp. arvense L.) with winter cereals (triticale × Triticosecale), and oat, Avena sativa L.) are used extensively for forage production as the first crops in double cropping system, which involves, as the second crops, maize and sorghum (Sorghum bicolor L. Moench) for silage. Leguminous crops form root nodules with the ability to bind nitrogen from the atmosphere. Thus, they require little fertilization and contribute to efficient turnover of nitrogen in agriculture [20]. Methane production of a specific crop is affected by the chemical composition of the plant which changes as the plant matures [21,22], and timing and frequency of harvest are thus critical in order to optimize the biomass yield and feedstock quality [23].
At the same time, based on our previous study [24], it was clear that mixtures of winter pea with triticale at the seeding ratio (50:50) at full-flowering stage of winter pea achieved a higher biogas and methane yield per t of volatile solids than the other different mixtures.
Our previous studies showed that use of crop mixtures such as winter pea with either oat or triticale were more productive and profitable compared to monocropping systems. In addition, it was observed that a seed ratio of 85:15 (pea and cereals) had the biggest advantage from intercropping, which was attributed to greater land use efficiency [25]. Our preliminary research showed that these mixtures can be a good source of biofuel production [24]. However, the crop ratios that have the best biomass production may not be the same for biomass production and for biogas and methane. This is because the crop stage of development can have a significant influence on total biomass production and traits such has quantities of volatile solids that are key for biofuel production.
The main purpose of this study was to (a) determine the best cropping system for optimal biogas and methane production from sole crops of winter pea, triticale and out and their mixtures at two different maturity stages (full-flowering stage of winter pea and milky/waxy stage of cereals); and (b) to develop and use a surface model to determine the best combinations of various mixtures that result in the highest biogas and methane yields. We hypothesize that the optimum mixtures (proportions) of pea and cereals will be different for green biomass, biogas or methane production.

2. Materials and Methods

2.1. Field Experiment

The experiments were carried out during 2012–2013 and 2013–2014 growing seasons at the Institute of Field and Vegetable Crops in Novi Sad, Serbia, on a field characterized as chernozem soil. The experimental site is located at N 45°26′82″ E 19°83′18″, in Vojvodina of Serbia. The soil at the experimental site was slightly alkaline with a pH range from 7.18 to 8.25, and well supplied with phosphorus and potassium; the humus content ranged from 2.58 to 3.52 (Table 1). The previous crop was spring vetch in both years.
Weather data during the growing seasons (October to May) are given in Table 2. The conditions (temperature and precipitation) during the autumn period in both years (2012–2013) were favorable for sowing and establishment of winter crops until the end of October (Table 2, Figure S1).
Winter pea, oat and triticale monocultures as well as mixtures of winter pea with both cereals, in two seed weight ratios (50:50 and 75:25) were sown on 26 October 2012 and 29 October 2013, respectively (Table 3). Seed weight ratios were based on the original full mixture of the respective pure crops. In all plots, crops were mechanically planted. The row spacing was 12.5 cm and the experimental design was a randomized complete block with seven treatments—three monocultures and four mixtures of winter pea with cereals replicated four times. Individual plot size for each treatment was 5 m × 20 m.
Harvesting dates of pure crops of pea and cereals as well as all of mixtures at the first maturity stage were 27 May 2013 and 20 May 2014, respectively. When it comes to the second maturity stage, harvesting dates for all treatments were 18 June 2013 and 2 June 2014. Each treatment group was harvested at two different maturity stages generally corresponding to: 1. full-flowering stage of winter pea and 2. milky/waxy stage of cereals. For reasonable statistical analyses, we theoretically transformed the portions of the three factors, oat (X1), pea (X2) and triticale (X3), at a 0.95 confidence interval in a supplementary table (Table S1).

2.2. Chemical Analysis and Calculation of Methane Yield

For determination of the dry matter yield, land area of 1 m2 was harvested in the center of each plot at two maturity stages (1st stage: full-flowering stage of winter pea and beginning of milky stage of cereals; 2nd stage: emergence of first pods for pea and milky/waxy stage of cereals). Samples taken from the plots were chopped to approximately 1 cm size and dried in oven at 60 °C for 72 h to determine dry weight. A subsample of approx. 1 kg was taken and dried at 60 °C in a drying cabinet to constant weight to establish the dry matter (DM) content. The dried subsample was milled in a cutting mill SM 200 (Retsch, Haan) using a 1 mm sieve for chemical and biogas analyses. All samples were investigated for potential biogas yield [26] and methane content in batches using 1 L glass bottles in controlled climate chambers [27]. Temperature mode was mesophilic (38 °C), and the samples were inoculated with the digestate from operating biogas plant in the vicinity, which uses cattle manure and maize silage as substrate. The cow manure was obtained from a dairy farm in Čenej. Biogas samples were taken with a pressure lock syringe and their methane content was measured with gas chromatographs (GCs) equipped with a flame ionization detector.
Total solids (TS) and volatile solids (VS) were determined according to the standard methods [28]. Methane potentials of substrates were calculated as m3 CH4 kg−1 VSadded, m3 CH4 kg−1 TSadded and m3 CH4 t−1 ww, minus the methane potential of the inoculum.
Methane production is reported in normalized liter per gram of volatile solids of energy crop [NL CH4 (g VS)−1], i.e., the volume of methane production was standardized on specific temperature and pressure conditions (273 K; 1 atm) [27]. Methane production from the inoculum alone was measured and subtracted from the methane production as background noise in digested crop bioreactors.

2.3. Data Analysis and Statistical Methods

Individual and combined data for both years were analyzed to determine the effects of the factors, treatment, harvested stage and mixture of oat, pea, and triticale on the measured variables. Simple statistics and the multivariate analysis of variance was performed. The seeding portions of oat, pea, and triticale denoted by X1 through X3, respectively. The dependent variables, i.e., the green mass yield (GM), dry matter yield (DM), yield of organic solids (OS), biogas yield from dry matter (BDM), biogas yield from organic solids (BOS), methane yield from dry matter (MDM), and methane yield from organic solids (MOS) are denoted by Y1 through Y7, respectively. The data of biogas yield (BDM and BOS) and methane yield (MDM and MOS) were, respectively, combined as Y4+5 and Y6+7 as there was no difference between them after the variance analyses (Table S1). The variables were analyzed using pairwise variables (X1 and X2, X1 and X3, X2 and X3) and quadratic and cubic polynomial regression models following [29,30,31]:
Y = i = 1 2 ( β i × j + 1 X i j ) + u   ( i = 1 ,   2 ;   j = 1 ,   2 )
(i.e., Y = aX12 + bX22 + dX1X2 + C; Y = aX13 + bX32 + dX1X3 + C; Y = aX22 + bX32 + dX2X3 + C)
where β is a constant.
Then, we obtained the preset condition linear model (Table S1) as:
100 = x 1 + x 2 + x 3
and the linear models as:
Y i = a x 1 + b x 2 + c x 3 ( i = 1 ,   2 ,   7 )
where a, b and c are constants.
Then, the binary quadric fitting equations of the Ys were constructed as:
Y i = a x 1 2 + b x 2 2 + c x 3 2 + d x 1 x 2 + e x 1 x 3 + f x 2 x 3 + g   ( i = 1 ,   2 ,   7 )
Y i = a x 1 2 + b x 2 2 + d x 1 x 2 + g ( i = 1 ,   2 ,   7 )
Y i = a x 1 2 + c x 3 2 + e x 1 x 3 + g ( i = 1 ,   2 ,   7 )
Y i = b x 2 2 + c x 3 2 + f x 2 x 3 + g ( i = 1 ,   2 ,   7 )
where a through g are constant. All of the models were solved.
The biologically meaningful models were selected for optimization. Response surface and contour charts are graphed for the meaning Ys with their corresponding Xs (Figures 1 and 2). The biologically meaningful models were selected. Response surface and contour charts are graphed for Y4+5 through Y6+7 with their corresponding X1 and X3. The coefficients of the models are presented, and all the p values were significant at <0.05 in the models (Tables 2–4).

3. Results

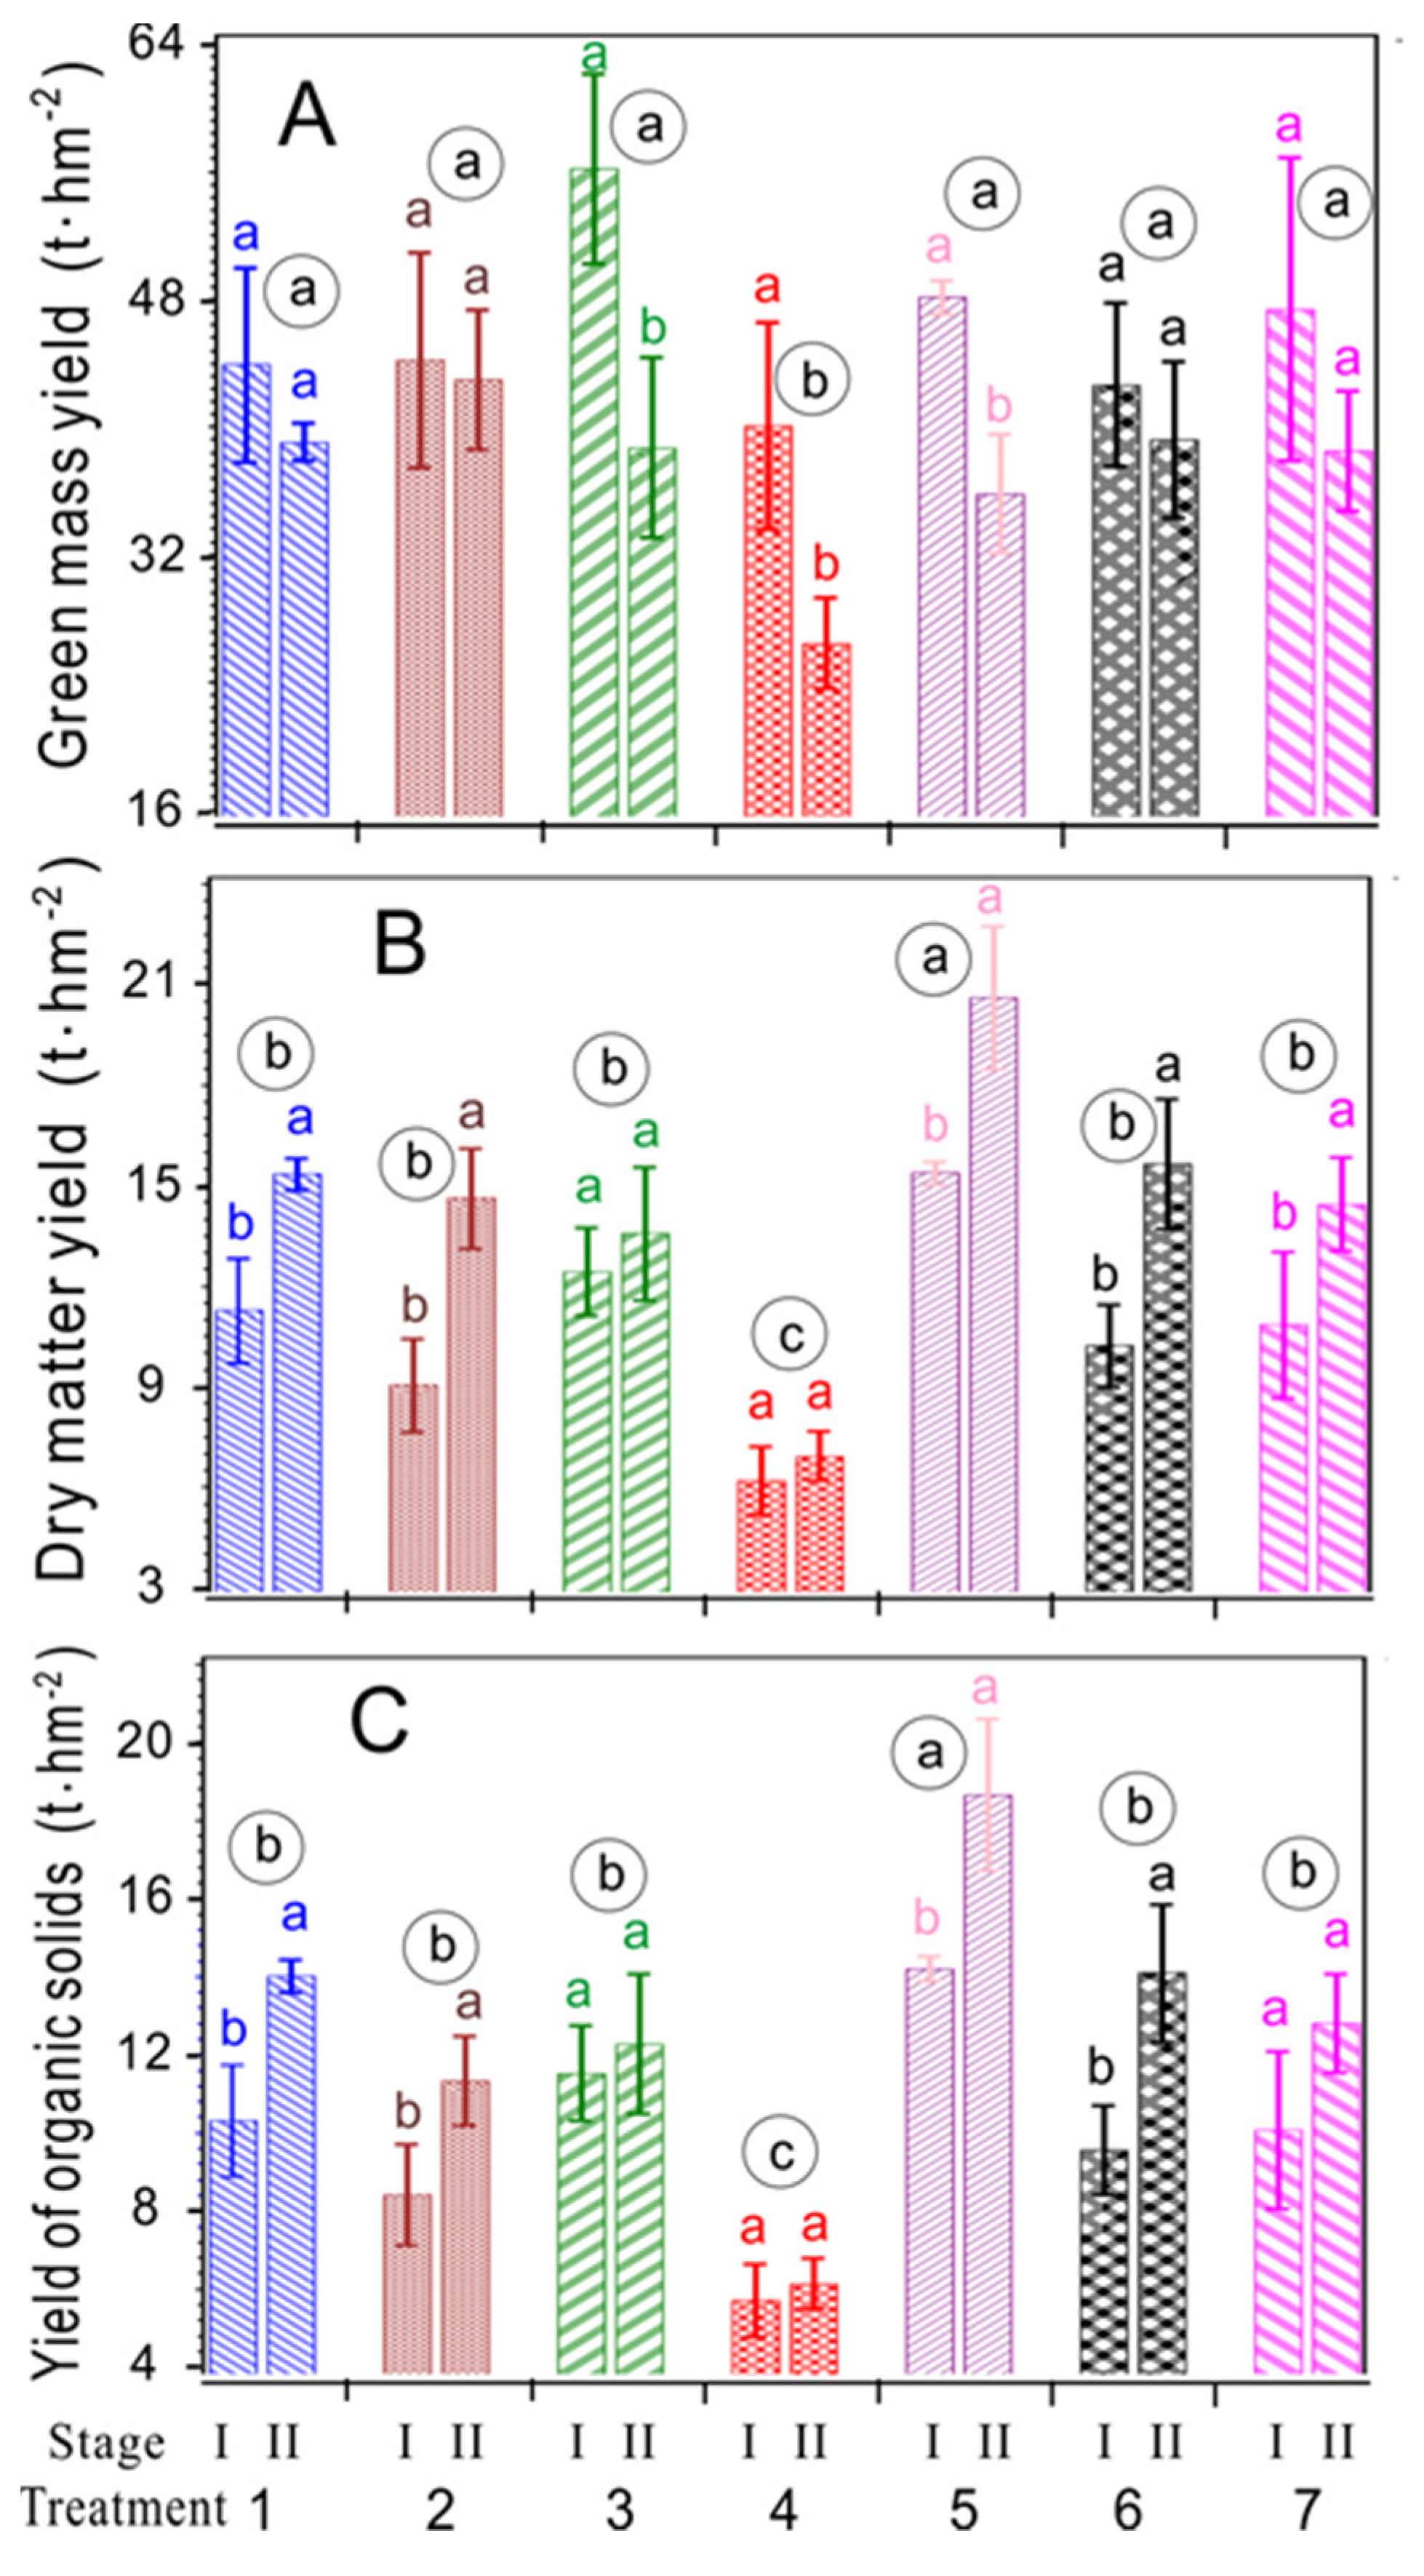
3.1. Influence on Yield Traits, Biogas and Methane Yield

Extremely hot weather with a high amount of precipitation during the autumn period in both years was favorable for sowing and establishment of the winter crops until the end of October (Table 2). Large amounts of moisture during the winter and a rainy spring, especially in March and May in 2013, had a favorable impact on the growth and development of winter forage pea whose share increased linearly during the growing season in all mixtures with cereals. Large amounts of rainfall during 2014 in the first part of the growing season had a favorable effect on achieving high yields of winter pea as well of cereals. Cereals, especially oat, appeared to be much more aggressive due to intensive tillering, which was reflected in the lower share of pea in the mixtures (Table S2).
The analysis of variance illustrated that treatment, harvested stage, and their interactions had significant effects on green mass yield, dry matter yield, and yield of organic solids (Table 4), and on biogas yield and methane yield (Table 5). Additionally, the multivariate analysis of variance indicated that treatment and harvested stage significantly affected those indexes mentioned before (Table 6).
Different treatments and harvested stages influenced green mass yield, dry matter yield and yield of organic solids (Figure 1). Treatment 4 (pure winter pea) had significantly lower green mass, dry matter and yield of organic solids compared to all other treatments, which had similar values for all three traits. The dry matter and organic solids for treatments 1, 2, 3, and 7 were significantly lower than for treatment 5.
Comparisons at different stages, the green mass yields for treatments 1 (pure oat), 2 (mixture of pea and out at the seed ratio 50%:50%), 6 (mixture of pea and triticale at the seed ratio 50%:50%) and 7 (mixture of pea and triticale at the seed ratio 75%:25%) were not significantly different between the two stages (Figure 1A), whereas for treatments 3 (mixture of pea and out at the seed ratio 75%:25%), 4 (pure pea) and 5 (pure triticale) significantly greater yields were observed at stage one (full-flowering stage of winter pea and beginning of milky stage of cereals) compared to stage two (emergence of first pods for pea and milky/waxy stage of cereals). For dry matter yield, treatments 3 and 4 had similar yields in both stages, whereas all other treatments (1, 2, 5, 6 and 7) had significantly greater dry matter yields at stage two of harvest compared to stage one (Figure 1B). The response of the yield of organic solids was like the response of dry matter yield, except for treatment 7, which had similar yields at both stages (Figure 1C).
Biogas and methane yields were significantly influenced by treatments and stage of harvests (Figure 2A,B). Treatment 5 (pure triticale) produced the highest biogas and methane yields, whereas the lowest yields were observed in treatment 4 (pure winter pea) compared to all other treatments. While there were no significant differences in treatments 1 (pure oat), 3 (mixture of pea and out at the seed ratio 75%:25%), 6 (mixture of pea and triticale at the seed ratio 50%:50%) and 7 (mixture of pea and triticale at the seed ratio 75%:25%), they all had significantly greater biogas and methane yields than treatment 2 (mixture of pea and out at the seed ratio 50%:50%).
The biogas and methane at two stages of harvest across all treatment had similar responses in terms of yield. Significantly greater biogas and methane yields were observed at stage two (emergence of firsts pods for pea and milky/waxy stage of cereals) for treatments 1, 2 and 5. The harvest at stage one (full-flowering stage of winter pea and beginning of milky stage of cereals) was greater in treatments 4 and there was no significant difference between the two stages of harvest for treatments 3, 6 and 7.

3.2. Surface Plots to Determine Optimal Mixtures for Biogas and Methane Yields

To determine the optimum mixture of oat and triticale, a surface plot model was developed which showed the significant impact of different combinations on biogas and methane yields (Table 7).
Response surface graphs were plotted with pair-wise variables for biogas and methane yields for combinations of oat and triticale (Figure 3). The results showed that there were maximum stable points for both biogas and methane yields. The maximum biogas yield of 10,252 m3 ha−1 was obtained when the mixture of oat and triticale, respectively, was at 35% and 65% (Figure 3A). Similarly, the maximum methane yield of 6625 m3 ha−1 was obtained when the mixture of oat and triticale, respectively, was at 27% and 73% (Figure 3B).
After quadratic model analyses, the combinations ratios of the oat and triticale were, respectively, at 30% with 8% and 28% with 38%, whereas the green biomass and organic solid yields had maximums of 61.48 and 25.64 t ha−1, respectively (Figure 4). When the model has preset the three independent variables oat, pea and triticale, the sum of them is 100%, pea should be 62% (100-30-8) and 34% (100-28-38), respectively, in the optimal productive combination of green mass and organic solids yields. The factor triticale was not significant (p = 0.8458) in terms of the variable green mass yield, but the model was significant (Table 7). However, there were not any biological suitable models either with the combination of oat and pea or triticale and pea due to not significant models or saddle point with a minus value of the factor.

4. Discussion

There were significant impacts of different crop mixtures (pea and cereals) and stage of harvest on biomass production and yields of biogas and methane. Many conventional forage crops are easy to cultivate and produce large amounts of biomass. Several studies that analyze and compare the methane production potential of different crop species already exist [32,33]. Different parameters have been reported to be correlated with the methane production potential of biomasses and several models have been developed for prediction of specific methane yields from biomasses (Table 8). The most important parameter in choosing crops for methane production is the net energy yield per hectare, which is defined mainly by biomass yield and convertibility of the biomass to methane, as well as cultivation inputs. Maximum green biomass produced from the mixture of pea and oat was at the seed ratio 75%:25% when compared to all other treatments and mixtures (Figure 1). The green mass was also greater at the first stage across all treatments.
Our results showed that yield of dry matter and organic solids, harvested at the first maturity stage, is significantly higher than at the second stage (Figure 1). The impacts of harvesting time may be due to the fact that capacity of nitrogen supply in soil and the nitrogen absorption efficiency of plants changed, which were crucial to carbon and nitrogen metabolism, with different growth stages, thereby affecting the yield and quality of plants [34]. A similar trend was seen in the yields calculated in other studies conducted on rye (Secale cereale L.), where the latest harvest date at late milk ripening resulted in the highest dry matter yield on a whole plant level with an average of 16.0 t ha−1. Accordingly, methane yield reached a mean of 4424 m3 ha−1 and a maximum of 4812 m3 ha−1 [35]. The production of organic matter and nutritional compositions and structures were essential to biogas and methane yield [36]. Six different varieties of silage maize had the highest methane yield during late harvest (6270 m3 CH4 (104 m2)−1) [37].
Switchgrass showed the opposite trend with to above literature; special methane yields decreased significantly with crop maturity, from 0.266 to 0.309 normalized liter per gram of volatile solids of energy crop [NL CH4 (g VS)1] to 0.191–0.250 NL CH4 g−1 vs. [38]. Similarly, the harvest time significantly affected methane yield of switchgrass grassland biomass. With the delay of harvest time, the methane yield decreased significantly, from up to 309 ln kg−1 organic dry matter (ODM) in May to below 60 ln kg−1 ODM in February [39]. The reason for this phenomenon is related to the increase in lignin content [40]. Lignocellulosic hydrolysis is generally considered as a rate-limiting step in anaerobic digestion [41,42,43]. Therefore, energy crops need to be pretreated with the purpose of separating and removing lignin from biomass, increasing the porosity of biomass and the conversion rate of enzymes to cellulose, so as to improve the conversion rate of hemicellulose and cellulose in biomass, and finally effectively improve the gas production performance of raw materials [44,45].
In our research, the highest and lowest values of DM and OS were observed in pure crops: in treatment 5 (pure triticale) and treatment 4 (pure winter pea), respectively (Figure 1). There were no differences among other treatments. A similar trend was observed, with the highest and lowest biomasses in treatments 5 and 4, while treatment 3 (mixture of pea and oat at the seed ratio 75%:25%) had slightly lower yields than all other treatments, but more than treatment 4. The response of treatment for biomass and methane followed the same trend, suggesting strong correlations between the two products and their relations with the total dry matter production and yield of organic solids. Biogas generated through anaerobic digestion included about 60% methane [46]. However, GM saw different patterns with DM, OS, methane, and biogas yields; the highest and lowest values were in treatments 3 and 4, respectively (Figure 1). This may be because during drying (which is equal to the procedure of late ripening), nutrients were redistributed from source to sink [47].
Generally, later harvest stages had greater biomass and methane yields with an exception of treatment 4 (Figure 2). In addition, pure triticale had the highest DM, organic solids, and yields of methane and biogas at later stages of crop development (Figure 1 and Figure 2). Research showed that as plants mature, there is increasing structural plant fibrillation and lignification and the accumulation of highly digestible carbohydrates [48]. Research has suggested that triticale was not only resistant, but also combined the advantages of rye and wheat, with the ability to use nutrition effectively and a high grain yield and nutritional quality [49]. In contrast, all the index values in pure winter pea (treatment 4) were the lowest, suggesting a relatively poor performance. This could be explained by the result that pea’s yield component, biotic and abiotic stress resistance, seed quality, stability of yield were not good enough [50].
The result of modeling analyses, the highest biogas yield of 10,252 m3 hm−2 produced by the mixture of oat (35%) with triticale (65%) (Figure 3A) was more than 0.8 m3 hm−2 produced by pure triticale at stage II (Figure 2A), whereas the highest methane yield of 6625 m3 hm−2 produced by the mixture of oat (27%) with triticale (73%) was more than that of 6007 m3 hm−2 by the same treatment (Figure 2B). The results showed that co-digestion of oat and triticale generated more biogas and methane yields than digestion of sole triticale. Similar findings were also reported from other studies [51,52]. This probably is because in the process of co-digestion, some beneficial parameters describing good digester health performed better, such as pH, alkalinity, and carbon–nitrogen ratio [53].
There are also some studies about improving biogas and methane production of previous materials. The biogas production ranges from 438 to 852 Nm(3)/t of dry matter for wheat and ear maize silage, respectively [54]. CH4 yield (MY; mg of CH4/g DM degraded) of barley and oat grown at one location of incubation was less than that of wheat and triticale (28 vs. 31 mg CH4/g DM degraded) [55]. The optimum addition was a 1:2 ratio of cow manure to the oat straw added, which resulted in a suitable C/N ratio of 27 and a higher degradation rate of lignocellulose, and this condition had the best cumulative methane yield of 841.77 mL/g volatile solids added (VSadded), 26.64% greater than that of digesting oat straw alone [56]. The methane yield for oat was 841.77 mL/g volatile solids added [57]. Since most of the results mentioned above were based on laboratory levels rather than field levels in our experiments, there is no uniform standard to compare them to, which is worth studying.
Additionally, there were other important factors in the process of methane and biogas production, for example, substrates [13,58], enzymes [59,60,61,62], microorganisms [13,63,64], and fermentation conditions [65,66]. Further studies are needed in the future about relevant mechanisms (Zhang et al., 2013) which could be achieved by physiological, biochemical, molecular [67,68], and omics analyses [69,70]. More importantly, the ecological use of energy crops to produce biogas needs to be further developed, such as exploiting crops accumulating heavy metal produced biogas [14]. Finally, with the development of energy crops, anaerobic digestion costs will increase and there will be contradictions between foods and feeds as well. Solutions to this problem such as considering resources such as agricultural wastes as alternatives or supplements of energy crops are to be further explored [71,72]. It is possible that the seeding ratio can also have direct influence on biomass ratio, which in turn can impact biogas and methane yields. Further research on this topic is needed to optimize the system.

5. Conclusions

The used pure or mixtures of pea, oat and triticale produced different green mass, dry matter, solids, biogas and methane yield. The experiments showed that maximum green mass was produced by the mixture of pea and oat at the seed ratio 75%:25% and when crops were harvested at the first stage of maturity (full-flowering stage of winter pea and beginning of milky stage of cereals). The pure triticale produced biogas and methane yields similar to other cropping mixtures. A multivariate model was developed to identify the best combinations for biogas and methane yields. These results showed that the mixture of oat and triticale had great potentiality with regard to biogas and methane yields. The optimal mixture was oat (35%) with triticale (65%) for biogas yield and oat (27%) with triticale (73%) for methane yield. After quadratic model analyses, the combinations ratios of the oat and triticale were, respectively, 30% with 8% and 28% with 38%, whereas the green biomass and organic solid yields were at maximums of 61.48 and 25.64 t ha−1, respectively. When the model preset the three independent variables oat, pea and triticale (sum as 100%), the proportion of pea was 62% and 34% for optimum production of green mass and organic solid yields, respectively. If these crop mixtures are to be used for biofuel production or forage, an appropriate cropping mixture should be selected. However, these need to be further evaluated under different environmental and soil conditions, and a cost–benefit ratio should be determined.

Supplementary Materials

The following are available online at https://www.mdpi.com/article/10.3390/agronomy11091800/s1, Figure S1. Precipitation and mean monthly temperature for growing season (2012–2014) and long-term average (1963–2013); Table S1. The portions of the three factors oat (X1), pea (X2) and triticale (X3) transformed at 0.95 confidence interval from the original experimental design; Table S2. Share of pea (P-%) and cereals (oats-O-% and triticale-T-%) in the two different maturity stages in period 2013–2014.

Author Contributions

Conceptualization, S.V., Q.W. and I.D.; methodology, S.V. and Q.W.; software, N.X. and X.S.; validation, S.V.; formal analysis, S.V., N.X. and X.S.; investigation, S.V., I.D. and Q.W.; resources, S.V., I.D. and P.V.V.P.; data curation, S.V. and Q.W.; writing—original draft preparation, S.V., I.D., Q.W., J.M., P.V.V.P.; writing—review and editing, S.V., I.D. and P.V.V.P.; visualization, N.X. and X.S.; supervision, Q.W.; project administration, S.V. and Q.W.; funding acquisition, I.D. and P.V.V.P. All authors have read and agreed to the published version of the manuscript.

Funding

This research was funded by the National Key R&D Program of China (2017YFE0111000) and The Ministry of Science & Technology and Education of Serbia Grants Program (grant number: 451-03-68/2020-14/200032) and Collaboration Research on Environmental Managements and Sustainable Development in Vojvodina of Serbia. The authors are grateful to the Kansas State University for their support for this research program. Contribution number 22-075-J from Kansas Agricultural Extension Station.

Data Availability Statement

The data will be available upon request from the lead and corresponding author.

Acknowledgments

We thank the Institute of Field and Vegetable Crops, National Institute of the Republic of Serbia; College of Grassland Agriculture, Northwest A&F University, China and Kansas State University for their support.

Conflicts of Interest

The authors declare no conflict of interest. The funders had no role in the design of the study; in the collection, analyses, or interpretation of data; in the writing of the manuscript, or in the decision to publish the results.

References

  1. IPCC. Climate Change 2014: Mitigation of Climate Change. Contribution of Working Group III to the Fifth Assessment Report of the Intergovernmental Panel on Climate Change; Edenhofer, O.R., Pichs-Madruga, Y., Sokona, E., Farahani, S., Kadner, K., Seyboth, A., Adler, I., Baum, S., Brunner, P., Eds.; Cambridge University Press: Cambridge, UK; New York, NY, USA, 2014. [Google Scholar]
  2. Bhattarai, K.; Stalick, W.M.; McKay, S.; Geme, G.; Bhattarai, N. Biofuel: An alternative to fossil fuel for alleviating world energy and economic crises. J. Environ. Sci. Health Part A Toxic Hazard. Subst. Environ. Eng. 2011, 46, 1424–1442. [Google Scholar] [CrossRef]
  3. Martínez-Gutiérrez, E. Biogas production from different lignocellulosic biomass sources: Advances and perspectives. Biotech 2018, 8, 233. [Google Scholar] [CrossRef]
  4. Patra, A.; Park, T.; Kim, M.; Yu, Z. Rumen methanogens and mitigation of methane emission by anti-methanogenic compounds and substances. J. Anim. Sci. Biotechnol. 2017, 8, 13. [Google Scholar] [CrossRef] [Green Version]
  5. Breden, C.R.; Buswell, A.M. The Use of Shredded Asbestos in Methane Fermentations. J. Bacteriol. 1933, 26, 379–383. [Google Scholar] [CrossRef] [Green Version]
  6. Feng, C.; Stewart, W.E. Practical Models for Isothermal Diffusion and Flow of Gases in Porous Solids. Ind. Eng. Chem. 1973, 12, 143–147. [Google Scholar] [CrossRef]
  7. Sangiorgio, F.; Pinna, M.; Basset, A. Inter– and intra-habitat variability of plant detritus decomposition in a transitional environment (Lake Alimini, Adriatic Sea). Chem. Biol. 2002, 20 (Suppl. 1), 353–366. [Google Scholar] [CrossRef]
  8. Carlsson, A.S.; van Beilen, J.B.; Möller, R.; Clayton, D.; Bowles, D. (Eds.) Micro- and Macro-Algae: Utility for Industrial Applications, Outputs from the EPOBIO Project; CPL Press: Newbury, UK, 2007; p. 86. [Google Scholar]
  9. Stewart, D.J.; Bogue, M.J.; Badger, D.M. Biogas production from crops and organic wastes. 2. Results of continuous digestion tests. N. Z. J. Sci. 1984, 27, 285–294. [Google Scholar]
  10. Datta, A.; Dutta, S.; Rao, K.S.; Santra, S.C.; Adhya, T.K. Methane and nitrous oxide emission from rice-based cropping systems. BVAAP 2010, 18, 154–157. Available online: http://hdl.handle.net/123456789/11490 (accessed on 5 August 2021).
  11. Lindorfer, H.; Braun, R.; Kirchmayr, R. Self-heating of anaerobic digesters using energy crops. Water Sci. Technol. A J. Int. Assoc. Water Pollut. Res. 2006, 53, 159–166. [Google Scholar] [CrossRef]
  12. Gao, Y. China’s response to climate change issues after Paris Climate Change Conference. Adv. Clim. Chang. Res. 2016, 7, 235–240. [Google Scholar] [CrossRef]
  13. Elghandour, M.Y.M.; Salem, M.Z.; Greiner, R.; Salem, A.Z. Effects of natural blends of garlic and eucalypt essential oils on biogas production of four fibrous feeds at short-term of incubation in the ruminal anaerobic biosystem. J. Sci. Food Agric. 2018, 98, 5313–5321. [Google Scholar] [CrossRef]
  14. Zhang, H.; Tian, Y.; Wang, L.; Zhang, L.; Dai, L. Ecophysiological characteristics and biogas production of cadmium-contaminated crops. Bioresour. Technol. 2013, 146, 628–636. [Google Scholar] [CrossRef]
  15. Graß, G.; Burger, N.; Lücke, A. Projekt GASQUAL—Pilot-Studie Deutschland. Gaswärme Int. 2013, 154, 240–248. [Google Scholar]
  16. Halmemies-Beauchet-Filleau, A.; Rinne, M.; Lamminen, M.; Mapato, C.; Ampapon, T.; Wanapat, M.; Vanhatalo, A. Review: Alternative and novel feeds for ruminants: Nutritive value, product quality and environmental aspects. Animal 2018, 12, s295–s309. [Google Scholar] [CrossRef] [PubMed] [Green Version]
  17. Ranck, E.J.; Holden, L.A.; Dillon, J.A.; Rotz, C.A.; Soder, K.J. Economic and environmental effects of double cropping winter annuals and corn using the Integrated Farm System Model. J. Dairy Sci. 2020, 103, 3804–3815. [Google Scholar] [CrossRef]
  18. Ceglar, A.; Toreti, A.; Prodhomme, C.; Zampieri, M.; Turco, M.; Doblas-Reyes, F.J. Land-surface initialisation improves seasonal climate prediction skill for maize yield forecast. Sci. Rep. 2018, 8, 1322. [Google Scholar] [CrossRef] [PubMed] [Green Version]
  19. Crocetti, L.; Forkel, M.; Fischer, M.; Jurečka, F.; Grlj, A.; Salentinig, A.; Trnka, M.; Anderson, M.; Ng, W.T.; Kokalj, Ž.; et al. Earth Observation for agricultural drought monitoring in the Pannonian Basin (southeastern Europe): Current state and future directions. Reg. Env. Chang. 2020, 20, 123. [Google Scholar] [CrossRef]
  20. Saharinen, J.; Hyytiäinen, M.; Taipale, J.; Keskioja, J. Latent transforming growth factor-beta binding proteins (LTBPs)—Structural extracellular matrix proteins for targeting TGF-beta action. Cytokine Growth Factor Rev. 1999, 10, 99. [Google Scholar] [CrossRef]
  21. Amendolia, S.R.; Binder, M.; Blum, W.; Cherney, M.; Farilla, A.; Fidecaro, F.; Izen, J.M.; Jared, R.C.; Lehraus, I.; Marrocchesi, P.S. Dependence of the transverse diffusion of drifting electrons on magnetic field. Nucl. Instrum. Methods Phys. Res. Sect. A Accel. Spectrometers Detect. Assoc. Equip. 1986, 244, 516–520. [Google Scholar] [CrossRef] [Green Version]
  22. Gunaseelan, V.N. Anaerobic digestion of biomass for methane production: A review. Biomass Bioenergy 1997, 13, 83–114. [Google Scholar] [CrossRef]
  23. Viola, L.C. Protection and Nutritional Nervosa. Trans. Anal. J. 1985, 15, 168–172. [Google Scholar] [CrossRef]
  24. Vasiljević, S.; Karagić, D.; Martinov, M.; Đatkov, Đ.; Pržulj, N.; Denčić, S.; Živanov, D.; Milošević, B. Potential of Biogas Production by Using Winter Pea Mixtures with Triticale and Oat; ePosters: Sudbury, UK, 2014. [Google Scholar]
  25. Vasiljević, S.; Milić, D.; Karagić, D.; Mihailović, V.; Mikić, A.; Živanov, D.; Milošević, B.; Katanski, S. Yield of Forage Pea-Cereal Intercropping Using Three Seed Ratios at Two Maturity Stages. In Breeding in a World of Scarcity; Roldán-Ruiz, I., Baert, J., Reheul, D., Eds.; Springer: Cham, Switzerland, 2016. [Google Scholar] [CrossRef]
  26. Liebetrau, J.; Pfeiffer, D.; Thrän, D. (Eds.) Collection of Measurement Methods for Biogas—Methods to Determine Parameters for Analysis Purposes and Parameters that Describe Processes in the Biogas Sector; Series of the Funding Programme “Biomass Energy Use”; DBFZ: Leipzig, Germany, 2015. [Google Scholar]
  27. Hansen, T.L.; Schmidt, J.E.; Angelidaki, I.; Marca, E.; La Cour Jansen, J.; Mosbæk, H.; Christensen, T.H. Method for determination of methane potentials of solid organic waste. Waste Manag. 2004, 24, 393–400. [Google Scholar] [CrossRef]
  28. APHA. Standard Methods for the Examination of Water and Wastewater, 20th ed.; American Public Health Association: Washington DC, USA, 1998. [Google Scholar]
  29. Gregory, S. Statistical Methods and Geographer; Longman Inc.: London, UK; New York, NY, USA, 1978. [Google Scholar]
  30. Lattin, J.; Carroll, J.; Green, P. Analyzing Multivariate Data; Brooks/Cole: New York, NY, USA, 2003. [Google Scholar]
  31. SAS Institute Inc. SAS/STAT User’s Guide; SAS Institute Inc.: Cary, NC, USA, 2008. [Google Scholar]
  32. Dandikas, V.; Heuwinkel, H.; Lichti, F.; Drewes, J.E.; Koch, K. Correlation between biogas yield and chemical composition of energy crops. Bioresour. Technol. 2014, 174, 316–320. [Google Scholar] [CrossRef]
  33. Gissén, T.; Prade, E.; Kreuger, I.A.; Nges, H.; Rosenqvist, S.E.; Svensson, M.; Lantz, J.E.; Mattsson, P.; Börjesson, L. Comparing energy crops for biogas production—Yields, energy input and costs in cultivation using digestate and mineral fertilization. Biomass Bioenergy 2014, 64, 199–210. [Google Scholar] [CrossRef]
  34. Wu, J.Z.; Huang, M.; Wang, Z.M.; Li, Y.J.; Fu, G.Z.; Chen, M.C. Effects of extremely-late sowing on the grain yield, nitrogen uptake and utilization, and grain protein content in winter wheat. Ying Yong Sheng Tai Xue Bao 2018, 29, 185–192. [Google Scholar] [CrossRef] [PubMed]
  35. Huebner, M.; Oechsner, H.; Koch, S.; Seggl, A.; Hrenn, H.; Schmiedchen, B.; Wilde, P.; Miedaner, T. Impact of genotype, harvest time and chemical composition on the methane yield of winter rye for biogas production. Biomass Bioenergy 2011, 35, 4316–4323. [Google Scholar] [CrossRef]
  36. Hosseini–Koupaie, E.; Dahadha, S.; Bazyar Lakeh, A.A.; Azizi, A.; Elbeshbishy, E. Enzymatic pretreatment of lignocellulosic biomass for enhanced biomethane production—A review. J. Environ. Manag. 2019, 233, 774–784. [Google Scholar] [CrossRef]
  37. Bruni, E.; Jensen, A.P.; Pedersen, E.S.; Angelidaki, I. Anaerobic digestion of maize focusing on variety, harvest time and pretreatment. Appl. Energy 2010, 87, 2212–2217. [Google Scholar] [CrossRef]
  38. Massé, D.; Gilbert, Y.; Savoie, P.; Bélanger, G.; Parent, G.; Babineau, D. Methane yield from switchgrass harvested at different stages of development in Eastern Canada. Bioresour. Technol. 2010, 101, 9536–9541. [Google Scholar] [CrossRef]
  39. Herrmann, C.; Prochnow, A.; Heiermann, M.; Idler, C. Biomass from landscape management of grassland used for biogas production: Effects of harvest date and silage additives on feedstock quality and methane yield. Grass Forage Sci. 2013, 69, 549–566. [Google Scholar] [CrossRef]
  40. Abraham, A.; Mathew, A.K.; Park, H.; Choi, O.; Sindhu, R.; Parameswaran, B.; Pandey, A.; Park, J.H.; Sang, B.I. Pretreatment strategies for enhanced biogas production from lignocellulosic biomass. Bioresour. Technol. 2020, 301, 122725. [Google Scholar] [CrossRef] [PubMed]
  41. Strassberger, Z.; Tanase, S.; Rothenberg, G. The pros and cons of lignin valorisation in an integrated biorefinery. RSC Adv. 2014, 4, 25310–25318. [Google Scholar] [CrossRef] [Green Version]
  42. Paul, S.; Dutta, A. Challenges and opportunities of lignocellulosic biomass for anaerobic digestion. Resour. Conserv. Recycl. 2018, 130, 164–174. [Google Scholar] [CrossRef]
  43. Casaretto, R.; Agdal, E.B.L.; Cayenne, A.; Chaturvedi, T.; Holm-Nielsen, J.B. Low-Temperature Pretreatment of Lignocellulosic Biomass for Enhanced Biogas Production. Chem. Eng. Technol. 2019, 42, 2565–2573. [Google Scholar] [CrossRef]
  44. Kandel, T.P.; Sutaryo, S.; Moller, H.B.; Jorgensen, U.; Laerke, P.E. Chemical composition and methane yield of reed canary grass as influenced by harvesting time and harvest frequency. Bioresour. Technol. 2013, 130, 659–666. [Google Scholar] [CrossRef]
  45. Cattani, M.; Sartori, A.; Bondesan, V.; Bailoni, L. In vitro degradability, gas production, and energy value of different hybrids of sorghum after storage in mini-silos. Ann. Anim. Sci. 2016, 16, 769–777. [Google Scholar] [CrossRef] [Green Version]
  46. Holmes, D.E.; Smith, J.A. Biologically Produced Methane as a Renewable Energy Source. Adv. Appl. Microbiol. 2016, 97, 1–61. [Google Scholar] [CrossRef]
  47. Schippers, J.H. Transcriptional networks in leaf senescence. Curr. Opin. Plant Biol. 2015, 27, 77–83. [Google Scholar] [CrossRef]
  48. Coblentz, W.K.; Akins, M.S.; Kalscheur, K.F.; Brink, G.E.; Cavadini, J.S. Effects of growth stage and growing degree day accumulations on triticale forages: 1. Dry matter yield, nutritive value, and in vitro dry matter disappearance. J. Dairy Sci. 2018, 101, 8965–8985. [Google Scholar] [CrossRef]
  49. Ayalew, H.; Kumssa, T.T.; Butler, T.J.; Ma, X.F. Triticale Improvement for Forage and Cover Crop Uses in the Southern Great Plains of the United States. Front. Plant Sci. 2018, 9, 1130. [Google Scholar] [CrossRef] [Green Version]
  50. Tayeh, N.; Aubert, G.; Pilet-Nayel, M.L.; Lejeune-Hénaut, I.; Warkentin, T.D.; Burstin, J. Genomic Tools in Pea Breeding Programs: Status and Perspectives. Front. Plant Sci. 2015, 6, 1037. [Google Scholar] [CrossRef] [Green Version]
  51. Grass, R.; Heuser, F.; Stuelpnagel, R.; Piepho, H.P.; Wachendorf, M. Energy crop production in double-cropping systems: Results from an experiment at seven sites. Eur. J. Agron. 2013, 51, 120–129. [Google Scholar] [CrossRef]
  52. Fahlbusch, W.; Hey, K.; Sauer, B.; Ruppert, H. Trace element delivery for biogas production enhanced by alternative energy crops: Results from two-year field trials. Energy Sustain. Soc. 2018, 8, 38. [Google Scholar] [CrossRef]
  53. Bond, T.; Brouckaert, C.J.; Foxon, K.M.; Buckley, C.A. A critical review of experimental and predicted methane generation from anaerobic codigestion. Water Sci. Technol. 2012, 65, 183–189. [Google Scholar] [CrossRef] [PubMed]
  54. Negri, M.; Bacenetti, J.; Fiala, M.; Bocchi, S. Evaluation of anaerobic degradation, biogas and digestate production of cereal silages using nylon-bags. Bioresour. Technol. 2016, 209, 40–49. [Google Scholar] [CrossRef] [PubMed]
  55. Aboagye, I.A.; Rosser, C.L.; Baron, V.S.; Beauchemin, K.A. In Vitro Assessment of Enteric Methane Emission Potential of Whole-Plant Barley, Oat, Triticale and Wheat. Animals 2021, 11, 450. [Google Scholar] [CrossRef] [PubMed]
  56. Zhao, Y.; Sun, F.; Yu, J.; Cai, Y.; Luo, X.; Cui, Z.; Hu, Y.; Wang, X. Co-digestion of oat straw and cow manure during anaerobic digestion: Stimulative and inhibitory effects on fermentation. Bioresour. Technol. 2018, 269, 143–152. Available online: https://10.1016/j.biortech.2018.08.040 (accessed on 5 August 2021).
  57. Zhong, B.; An, X.; Shen, F.; An, W.; Zhang, Q. Anaerobic co-digestion of rice straw and pig manure pretreated with a cellulolytic microflora: Methane yield evaluation and kinetics analysis. Front. Bioeng. Biotechnol. 2021, 4, 579405. [Google Scholar] [CrossRef]
  58. Mehmood, K.; Berns, A.E.; Pütz, T.; Burauel, P.; Vereecken, H.; Opitz, T.; Zoriy, M.; Hofmann, D. No effect of digestate amendment on Cs-137 and Sr-90 translocation in lysimeter experiments. Chemosphere 2017, 172, 310–315. [Google Scholar] [CrossRef]
  59. Andersen, M.R.; Giese, M.R.; de Vries, P.; Nielsen, J. Mapping the polysaccharide degradation potential of Aspergillus niger. BMC Genom. 2012, 13, 313. [Google Scholar] [CrossRef] [PubMed] [Green Version]
  60. Frommhagen, M.; Koetsier, M.J.; Westphal, A.H.; Visser, J.; Hinz, S.W.; Vincken, J.P.; van Berkel, W.J.; Kabel, M.A.; Gruppen, H. Lytic polysaccharide monooxygenases from Myceliophthora thermophila C1 differ in substrate preference and reducing agent specificity. Biotechnol. Biofuels 2016, 9, 186. [Google Scholar] [CrossRef] [Green Version]
  61. Huang, D.; Liu, J.; Qi, Y.; Yang, K.; Xu, Y.; Feng, L. Synergistic hydrolysis of xylan using novel xylanases, β-xylosidases, and an α-L-arabinofuranosidase from Geobacillus thermodenitrificans NG80-2. Appl. Microbiol. Biotechnol. 2017, 101, 6023–6037. [Google Scholar] [CrossRef]
  62. Jia, X.; Han, Y. The extracellular endo-β-1,4-xylanase with multidomain from the extreme thermophile Caldicellulosiruptor lactoaceticus is specific for insoluble xylan degradation. Biotechnol. Biofuels 2019, 12, 143. [Google Scholar] [CrossRef]
  63. de Almeida, M.; Guimarães, N.V.M.; Bischoff, K.M.; Falkoski, D.L.; Pereira, O.L.; Gonçalves, D.S.; de Rezende, S.T. Cellulases and hemicellulases from endophytic Acremonium species and its application on sugarcane bagasse hydrolysis. Appl. Biochem. Biotechnol. 2011, 165, 594–610. [Google Scholar] [CrossRef]
  64. Bhalla, A.; Bischoff, K.M.; Uppugundla, N.; Balan, V.; Sani, R.K. Novel thermostable endo-xylanase cloned and expressed from bacterium Geobacillus sp. WSUCF1. Bioresour. Technol. 2014, 165, 314–318. [Google Scholar] [CrossRef] [PubMed]
  65. Maroušek, J. Prospects in straw disintegration for biogas production. Environ. Sci. Pollut. Res. 2013, 20, 7268–7274. [Google Scholar] [CrossRef]
  66. Sapci, Z. The effect of microwave pretreatment on biogas production from agricultural straws. Bioresour. Technol. 2013, 128, 487–494. [Google Scholar] [CrossRef] [PubMed]
  67. Chandra, A.; Jain, R.; Solomon, S.; Shrivastava, S.; Roy, A.K. Exploiting EST databases for the development and characterisation of 3425 gene-tagged CISP markers in biofuel crop sugarcane and their transferability in cereals and orphan tropical grasses. BMC Res. Notes 2013, 6, 47. [Google Scholar] [CrossRef] [Green Version]
  68. Cuervo-Soto, L.I.; Valdés-García, G.; Batista-García, R.; del Rayo Sánchez-Carbente, M.; Balcázar-López, E.; Lira-Ruan, V.; Pastor, N.; Folch-Mallol, J.L. Identification of a novel carbohydrate esterase from Bjerkandera adusta: Structural and function predictions through bioinformatics analysis and molecular modeling. Proteins 2015, 83, 533–546. [Google Scholar] [CrossRef]
  69. Hayden, D.M.; Rolletschek, H.; Borisjuk, L.; Corwin, J.; Kliebenstein, D.J.; Grimberg, A.; Stymne, S.; Dehesh, K. Cofactome analyses reveal enhanced flux of carbon into oil for potential biofuel production. Plant J. 2011, 67, 1018–1028. [Google Scholar] [CrossRef]
  70. Kolbusz, M.A.; Di Falco, M.; Ishmael, N.; Marqueteau, S.; Moisan, M.C.; Baptista, C.D.S.; Powlowski, J.; Tsang, A. Transcriptome and exoproteome analysis of utilization of plant-derived biomass by Myceliophthora thermophila. Fungal Genet. Biol. 2014, 72, 10–20. [Google Scholar] [CrossRef] [PubMed]
  71. Nges, I.A.; Escobar, F.; Fu, X.; Björnsson, L. Benefits of supplementing an industrial waste anaerobic digester with energy crops for increased biogas production. Waste Manag. 2012, 32, 53–59. [Google Scholar] [CrossRef] [PubMed]
  72. Croce, S.; D’Imporzano, Q.; Wei, G.; Dong, R.; Adani, F. Anaerobic digestion of straw and corn stover: The effect of biological process optimization and pre-treatment on total bio-methane yield and energy performance. Biotechnol. Adv. 2016, 34, 1289–1304. [Google Scholar] [CrossRef] [PubMed]
Figure 1. Yields of green mass (A), dry matter (B) and organic solids (C). The different lower letters in the circle indicated the difference among the treatments; the different colored lower letters indicate the difference between harvested stages I and II in their treatment. n = 4. Treatments include: 1: pure oat; 2: 50% winter pea:50% oat; 3: 75% winter pea:25% oat; 4: pure winter pea; 5: pure triticale; 6: 50% winter pea:50% triticale; 7: 75% winter pea:25% triticale. Stages include: 1. full-flowering stage of winter pea and beginning of milky stage of cereals and 2. emergence of firsts pods for pea and milky/waxy stage of cereals.
Agronomy 11 01800 g001
Figure 2. Yields of biogas (A) and methane (B). The different lower letters in the circle indicate the difference among the treatments; the different color lower letters indicated the difference between harvested stages I and II in their treatment. n = 8. Treatments include, 1: pure oat; 2: 50% winter pea:50% oat; 3: 75% winter pea:25% oat; 4: pure winter pea; 5: pure triticale; 6: 50% winter pea:50% triticale; 7: 75% winter pea:25% triticale. Stages include: 1. full-flowering stage of winter pea and beginning of milky stage of cereals and 2. emergence of firsts pods for pea and milky/waxy stage of cereals.
Agronomy 11 01800 g002
Figure 3. Response surface plots showing the interactions between oat and triticale on the biogas yield (A) and methane yield (B).
Agronomy 11 01800 g003
Figure 4. Response surface plots showing the interactions between oat and triticale on the green biomass yield (A) and organic solid yield (B).
Agronomy 11 01800 g004
Table 1. Chemical properties of the soil.
YearpHHumus
(%)
Total Nitrogen
(%)
mg 100 g Soil
in H2Oin KClP2O5K2O
20128.107.183.520.24161.9040.0
20138.257.282.580.1932.430.6
Table 2. Precipitation and mean monthly temperature for growing season (2012–2014) and long-term average (1963–2013) at the experiment site.
MonthPrecipitation (mm)Temperature (°C)
2012–20132013–20141963–20132012–20132013–20141963–2013
October49674513.714.711.7
November36415210.09.036.0
December552461.02.01.7
January6024373.04.3·0.3
February4910334.37.01.7
March6850396.010.46.3
April30494713.713.411.7
May1182036018.416.417.0
Total465446359
Average 8.79.67.0
Table 3. Treatment details of the field experiments. Each treatment was harvested at two different maturity stages (1st stage: full-flowering stage of winter pea and beginning of milky stage of cereals; 2nd stage: emergence of firsts pods for pea and milky/waxy stage of cereals).
TreatmentComposition of CropsSeed Weight Ratios
1.Pure crops of oat100% (150 kg ha−1)
2.Winter pea: oat mixture50%:50% (70 + 75 kg ha−1)
3.Winter pea: oat mixture75%:25% (105 + 37.5 kg ha−1)
4.Pure crops of pea100% (140 kg ha−1)
5.Pure crops of triticale100% (250 kg ha−1)
6.Winter pea: triticale mixture50%:50% (70 + 125 kg ha−1)
7.Winter pea: triticale mixture75%:25% (105 + 62.5 kg ha−1)
Seed weight ratios based on the original full mixture of the respective pure crops.
Table 4. Analysis of variance for green mass yield, dry matter yield and yield of organic solids for each experimental factor (treatment and harvested stage) and their interactions. Data included both years (n = 8).
Source
(Factors)
Green Mass YieldDry Matter YieldYield of Organic Solids
DFF-Valuep-ValueF-Valuep-ValueF-Valuep-Value
Treatment (T)65.240.000440.64<0.000143.62<0.0001
Harvested stage (S)139.03<0.000186.66<0.000160.01<0.0001
T × S interaction62.540.03443.700.00483.040.0146
Model136.60<0.000127.19<0.000126.21<0.0001
R-Square 0.6712 0.8936 0.8903
Table 5. Analyses of variance for biogas and methane yield for each experimental factor (treatment and harvested stage) and their interactions. Data included both years (n = 8).
Source
(Factors)
Biogas YieldMethane Yield
DFF-Valuep-ValueF-Valuep-Value
Treatment (T)6126.20<0.0001141.29<0.0001
Harvested stage (S)15.470.021329.44<0.0001
T × S interaction67.90<0.00018.43<0.0001
Model1362.31<0.000171.34<0.0001
R-Square 0.8921 0.9455
Table 6. Multivariate Analysis of Variance (MANOVA) test criteria and F approximations for the hypothesis of no overall rffects of the factors. H = Type III SSCP matrix for the treatment and the harvested stage. NOTE: F Statistic for Roy’s greatest root is an upper bound.
FactorsStatisticWilks’
Lambda
Pillai’s
Trace
Hotelling–Lawley
Trace
Roy’s Greatest
Root
Treatment (T)F-value12.375.7022.50108.02
p-value<0.0001<0.0001<0.0001<0.0001
Harvested stage (S)F-value144.57144.57144.57144.57
p-value<0.0001<0.0001<0.0001<0.0001
Table 7. Analyses of variance for the models of the biogas, methane, green mass and organic solids yields, for experimental factor oat (X1) and triticale (X3). Data included for both years (n = 8).
Source
(Factors)
Biogas YieldMethane YieldGreen Mass YieldOrganic Solids
DFF-Valuep-ValueF-Valuep-ValueF-Valuep-ValueF-Valuep-Value
Oat237.02<0.000131.56<0.000111.69<0.000133.11<0.0001
Triticale2115.14<0.0001118.02<0.00010.170.845829.43<0.0001
Model458.95<0.000160.06<0.000112.74<0.000120.51<0.0001
R-Square 0.6879 0.6919 0.3226 0.4340
Maximum 13218 8595 61.48 25.64
Table 8. Coefficients of the correlation with the dependent variables. Note: GM: the green mass yield; DM: dry matter yield; OS: yield of organic solids; BDM: biogas yield from dry matter; BOS: biogas yield form organic solids; MDM: methane yield from dry matter; MOS: methane yield from organic solids. Significance of the correlation were at of **: p < 0.001; ***: p < 0.0001.
DMOSBDMBOSMDMMOS
GM0.2230.2480.448 **0.446 **0.372 **0.368 **
DM1.0000.988 ***0.899 ***0.899 ***0.932 ***0.929 ***
OS 1.0000.929 ***0.929 ***0.957 ***0.956 ***
BDM 1.0000.999 ***0.992 ***0.991 ***
BOS 1.0000.992 ***0.990 ***
MDM 1.0000.998 ***
Publisher’s Note: MDPI stays neutral with regard to jurisdictional claims in published maps and institutional affiliations.

