Abstract
Sustainable development has become a central and key goal for humanity (1 UN: Millenium Development Goals, 2 SDGs). There is no scientific or political consensus, however, about the root cause of unsustainability, so an effective cure is impossible. Nevertheless, unlimited inequality among nations and individuals, extreme poverty, and hunger are always among the most significant problems. It is also often claimed that the world’s current food production would be sufficient to feed all 7.7 billion people on Earth (see Appendix A 1) with a better (more even, ‘just’) distribution. Others use food hunger and poverty data to support claims for increased food production and agricultural output. In this paper we examine the first claim with real data, but from a theoretical perspective: is it true, theoretically, that if all of the produced and wasted food were made available to feed the extremely poor and hungry, we could reach zero hunger-related deaths? We will use food waste, hunger-related (+thirst) death, obesity, and calorie consumption data from the “happy” and “unhappy” parts of the Earth. The cause of food waste is dissonant in different economic systems, so its macro- and microeconomic approach is also completely different in different countries. The relationship between obesity, hunger, and food waste has not yet been explored in a structured framework; data are available but scattered. In this paper we propose a unified framework of comparable data as a first step in mapping the biggest missing, or at least wobbling circle of modern bio-economy: global food supply. Thinking globally is a first step toward progress development in food justice and a solution to UN sustainable development goals (SDG 2, 1, 3, and 10).
1. Introduction
Sustainability has many definitions and approaches. According to our worldview, sustainable development would be better termed ‘sustainable and humane development’ (SHD), which means we would have to assure the basic economic conditions for a decent, or at least proper, life for all people on Earth. It is not proper that some people, especially children, die of hunger and thirst, while others fight with obesity. We should use science to find a balance to minimize food waste on the one extreme, and lack of food on the other. The Universal Human Rights [1] include the statement that ‘Everyone has the right to a standard of living adequate for the health and well-being of himself and of his family, including food … in Article 25’ [1]. The UN Millennium Development Goals (MDGs) were created in 2000 [2]. MDG1 was to ‘Eradicate extreme poverty and hunger’. MDG1 had three targets, which were to: (a) between 1990 and 2015, halve the proportion of people whose income is less than US$1.25 a day, (b) achieve full and productive employment and decent work for all, including women and young people, and (c) between 1990 and 2015, halve the proportion of people who suffer from hunger [3].
In 2015 it was reported that: (a) Extreme poverty has declined significantly over the last two decades. In 1990, nearly half of the population in the developing world lived on less than US$1.25 a day; that proportion dropped to 14 per cent in 2015; (b) Globally, the number of people living in extreme poverty declined by more than half, falling from 1.9 billion in 1990 to 836 million in 2015. The greatest progress occurred after 2000; (c) The number of people in the working middle class—living on more than $4 a day—almost tripled between 1991 and 2015. This group now makes up half of the workforce in developing regions, up from just 18 per cent in 1991; and (d) The proportion of undernourished people in the developing regions fell by almost half after 1990, from 23.3 per cent in 1990–1992 to 12.9 per cent in 2014–2016 [4].
These results are questionable because there is no scientific consensus about the measuring methodology for progress [5,6].
In 2010, Godfray et al. wrote in Science regarding achieving the MDGs, that the goal is no longer to simply to maximize productivity, but also to optimize that productivity across a far more complex landscape of production, environmental, and social justice outcomes [7].
On 25 September 2015, the 193 Member States of the United Nations adopted the 17 Sustainable Development Goals (SDGs) of the 2030 Agenda for Sustainable Development [8]. These global objectives were expected to guide the actions of the international community over the next 15 years (2016–2030). The 2030 Agenda offers a vision for food and agriculture as key to sustainable development. FAO possesses experience and expertise in supporting policymaking, partnership-building, and projects and programs built on 3-dimensional sustainability. Both the SDGs and the FAO’s strategic framework are geared towards tackling the root causes of poverty and hunger, building a more society, leaving no one behind. Food is most strongly tackled aspect in SDG2 (Zero Hunger) and in SDG3 (Good Health and Well-being) because good health starts with nutrition. Without regular and nutritious food, humans cannot live, learn, fend off diseases, or lead productive lives [9].
Anais Lemaire and Sabine Limbourg concluded in a review article that five research questions identified through several gaps in the literature needed to be addressed when considering 12.3 SDG (Global food losses: (a) a lack of standardized and up-to-date method of data collection and concept definitions; (b) the ‘awareness of the need’ concept in redistribution; (c) the consumer behavior related to food waste and loss (FLW); (d) the performance of local versus global logistics networks in terms of FLW; and (e) the role of packaging in FLW and greenhouse gas (GHG) emission reduction [10].
There is room for significant future research to develop and implement up-to-date and cost-effective metrics of micronutrient deficiencies and healthy diets. This would help to understand, analyze, and characterize food security, diets, nutrition outcomes, and food systems more generally. While we have data that describes broad trends, we often lack data on who is hungry and why, what people eat and why, the impact on nutritional growth indicators and how food system transitions are shaping these outcomes. We are also limited by the ability to disaggregate metrics by population group, wealth, and other categories to understand who is vulnerable, where, and why. There are also limitations on the capacity to use metrics to effectively drive decision making. While the SDG challenge is daunting, it is also imperative to eradicate hunger and significantly reduce malnutrition (in all its forms) by 2030 [11].
Another possibility to research hunger is the calculation of Disability-Adjusted Life Years (DALYs), as was the case with Gödecke and colleagues. They showed that the combined burden of chronic and hidden hunger, as measured with DALYs, was reduced by more than half after 1990. Hidden hunger is defined as a form of undernutrition that occurs when the intake and/or absorption of minerals, vitamins and other life-necessary microintergredients (e.g., iodine, zinc, iron) are not sufficient to assure proper health and development. Such a symptom might be caused by poor diet, more intensive micronutrient needs during certain life stages (e.g., pregnancy), and special health problems such as diseases, infections, or parasites. What we see is that the burden of chronic hunger fell more rapidly than the burden of hidden hunger. Economic growth was a key determinant in reducing the burden of chronic and hidden hunger over time [12]. DALYs can also be used to approximate the economic cost of hunger by valuing each DALY with a country’s mean per-capita income [13].
A review article of Tamburino et al. concluded that population, per capita demand, and total food production are three factors affecting the potential to meet global food needs. Their results suggest that increasing research focus on diets and population size is likely necessary to provide an adequate evidence base [14].
Hunger as well as food insecurity exists in rich countries, too, on the basis of internal macroeconomic inequality [15], primarily characterized using the Gini index [16]. Wasted food coexists with widespread need in the US. A total of 14% of households were food insecure in 2014, whereas 5.6% had very low food security [17].
We must deal with obesity and undernourishment/hunger because both have health risks, as expressed in Figure 1. Connecting the two directly is common in everyday sustainability thinking, but little research evidence is available. A rare exception is the paper of Steiner et al., which applies a global systems perspective. They propose that food and health policies need to be considered as two sides of the same coin, as are economic wellbeing and food supply. Other examples include hunger and obesity; food shortage vs. food waste; overweight/obesity and education and many others [18].
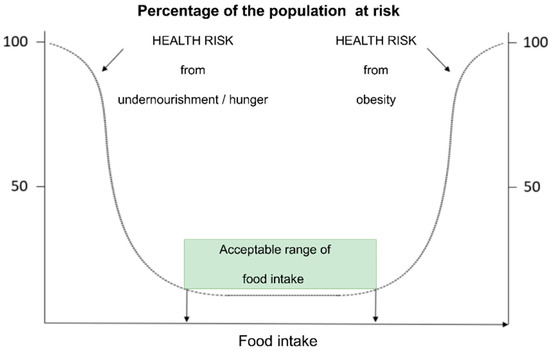
Figure 1.
Risk of under- and overconsumption of food (Source: Adopted from European Food Safety Authority (EFSA) Statement [19]).
This topic, the interconnection between hunger and obesity, is astonishingly underrepresented in scientific literature. Despite this, we can still find some examples of data visualization [11]. Obesity is well studied in medical literature. There are more than four thousand results for the search of (obesity OR overweight) AND (underweight OR hunger) in research and review articles from 2020 and 2019 alone in Google Scholar. This might give a basis of a future full-scale structured literature review.
The relationship between GDP and obesity is well studied, however. For example, Ameye and Swinnen proved that obesity changes with income, but in a non-linear way. Globally, obesity is lowest in the poorest countries and is higher in countries with a higher GDP per capita. Here, scientific evidence confirms commonsense logic. At the middle-income levels, there is no significant correlation between income and obesity level. For high-income economies, the correlation is negative, but is only significant for female obesity. In poor countries, it is the richest segment of the population that is more obese. In middle-income countries, there is little correlation between income and obesity. In rich countries, obesity is concentrated among the poorest groups of the population. There are significant gender disparities in obesity prevalence worldwide. Females are more obese in low-income and middle-income countries, with the gender gap being the highest in middle-income countries. Urbanization, which is correlated with income, is also correlated with obesity in a non-linear way. In low-income countries, obesity is higher in urban areas than in rural areas. In high-income countries, the rural–urban obesity gap is reversed. Addressing obesity problems therefore requires an approach that targets more than just one factor or cause. Still, there is much to learn [20].
Food insecurity is also well studied in regard to the aspect of inequality. Pollard and Booth proposed that the contemporary framing of the solution to food insecurity in developed countries is that of diverting food waste to the hungry to meet the United Nations Sustainable Development Goals agenda (Goals 2 and 12.3). An estimated 60 million people, or 7.2%, of the population in high-income countries used food banks in 2013. Although providing food assistance to those who are hungry is an important strategy, the current focus distracts attention away from the ineffectiveness of government policies in addressing the social determinants of food insecurity [15]. A scientifically sound theoretical calculation of the probability of food assistance as a global economic solution to this specific problem was our zero-hypothesis. In other words, we were extremely interested to see that if all food waste could be given to the hungry, would it be possible to eradicate hunger death and even possibly undernourishment on Earth? However, we found further, much more interesting, and practical results.
The lack of possibilities to move food consistently and justly from producers to consumers were identified by Veldhuizen et al. as the “Missing Middle” [21]. Tamburino et al. suggest that increasing research focus on diets and population size is likely to be necessary to provide an adequate evidence base for policy. To reverse a long-term trend whereby population, diet, and food production have been tackled in isolation, we suggest strengthening interdisciplinary research that jointly addresses these three leverage points [14]. Poverty is well studied, too [22], as the connection between the food supply and consumption per capita is expressed in purchasing power parity [23]. This is particularly important since inadequate food supply is likely to lead to food-related riots and social unrest, which, in addition to their economic and social impact, have ethical and political implications as well [24].
We are neither aware of any paper about how much food is needed for overweight people to become obese, nor if there is any data about how much food must be eaten to avoid being underweight. From a global systems perspective, food and health policies need to be considered coherently. Similar tradeoffs are:
- Economic wellbeing and food supply;
- Hunger and obesity;
- Food-/nutrition shortage and food waste;
- Overproduction and overconsumption vs. land and biodiversity degradation;
- Decreasing population in some parts of the word and increasing population in other parts of the world (with a general population increase globally if no other system disturbances such as epidemics, natural disasters, or wars occur);
- Urban and rural population development;
- Extreme food crises and migration movements;
- Overweight/obesity and education, among others.
This—not full—list of interesting issues using our globeconomics (see Appendix A 2) material balance method might provide inspiration for future researchers. The list was generated on the basis of a recent article by Gerald Steiner and his co-researchers, published in Applied Sciences [19]. Hundreds of scientific articles can be found about health consequences of dietary deficit, but not one can be about the lack of food for the elimination of hunger.
As of now (March of 2021), a significant increase in the number of people experiencing acute food insecurity is evident through new IPC analyses or similar analytical processes, mainly due to COVID-19. Already in 2019, 135 million people were facing a food crisis, or worse, vs. 174 million people in 2021 Q1 [25]. This short-term trend underlines the importance of our research question.
In this paper we examine the first claim with real data, but from a theoretical perspective: is it true, theoretically, that if all produced and wasted food was made available to feed both the extremely poor and extremely hungry, we could reach zero hunger-related deaths? This is a most important question of not only social justice, but of functioning markets for the near future. If we cannot bring about sustainable and humane development (SHD), mass international migration and revolutions might occur. The novelty of our paper as compared to those of Hossain [26] and Janssens et al. [27], for example, is that we try to work out a global economic reform through the example of hunger elimination in order to regain trust in the free market economy, the UN, and last but not least, the (reformed) economic theory we call humane economics.
2. Basic Data Context: Hunger and Foodwaste
Food insecurity, hunger death, being underweight, and functional undernourishment are relatively well-defined individual categories with everyday and scientific consensus. However, combining them without discrepancies and creating non-overlapping consolidated secondary data-tables from primary statistical data from primary sources is not so straightforward. The WHO Global Health Observatory data repository contains age-standardized estimates of the prevalence of being underweight (BMI < 18.5), being overweight (BMI ≥ 25) and obesity (BMI ≥ 30) in adults (18+) for the last four decades [28].
However, as being overweight and the very complex ‘wicked problem’ of BMI, obesity, bulimia, etc., would divert us from the focus of this research, we will analyze this in a follow-up article.
Considering these internal factors of the food-equilibrium problem would be a deviation from or a next step in our current research, as would thirst deaths and lack of potable water on the “other side of the World”. These are once again, however, two potential new research lines that can be examined in this paper.
Based on the core data tables, we can formulate our scientific target, which is our research question. The aim of this paper is to evaluate the Food Problem Triangle3: undernourishment–obesity–food loss. This way, we will get a clear picture of what volume of food is needed globally to eliminate hunger. Another possible conclusion could be the potential need to increase technical efficiency and production output or whether better (more inequal, ‘just’”) distribution can be a stand-alone solution to this most pressing problem.
We are now able to formulate our solid hypotheses. The statement “produced food is enough to avoid hunger” is scientific evidence [29,30,31], and our calculations reconfirm it. However, we also go two steps further: The impact of the current mainstream policies to phase out hunger are still not enough to end hunger by 2030. To justify that, we are formulating these two hypotheses and will investigate them:
Hypothesis H1.
The trends of diminishing hunger are not fully effective to eradicate hunger by 2030.
Hypothesis H2.
A small (not full, or <50%) part of wasted food could be enough to avoid hunger.
3. Method: A Theoretical Calculation with Empirical Data
3.1. Calculation and Evaluation of a Necessary Trend to Eliminate Hunger
The State of Food Insecurity in the World (SOFI) was created to track progress towards ending this profound obstacle to human rights, quality of life, and dignity. It was spurred by the 1996 World Food Summit in Rome, where leaders of 186 countries pledged to reduce halve the number of hungry people in the world by 2015 [32]. As we can see in Table 1, this target of SOFI was not reached [33].
3.2. Calculation and Evaluation of the Lack of Food
Dietary Reference Intake Values for energy are 3067 kcal/day, for men aged 18+ and 2403 kcal/day for women aged 18+, and 0.8 g of good quality protein/kg body weight/day [34]. We took into consideration the average of these values, 2735 kcal/day for adults and 70 kg body weight, resulting in 56 g/day protein. The same recommended protein intake is available in the opinion of the EFSA, too, where it is written that the Population Reference Intake for adults of all ages was estimated to be 0.83 g protein/kg body weight per day [35].
A lack of and surplus of food on the different continents is shown per capita, but let us compute the total amount. Before we start our own calculation, we must convert the unit used in FAOSTAT (kcal/capita/day) to SI conform (kJ/capita/day) with the conversion of 1 kcal = 4.19 kJ. As such, the per capita need per day was multiplied by 365 days to obtain the annual per capita need, and the annual total need was calculated by multiplying the annual per capita need by the population.
4. Results: Hunger Eradication without Increasing Production or Decreasing Population
We started our calculation with WHO data from the Global Health Observatory data repository. We used the age-standardized estimated prevalence of underweight (BMI < 18.5) among adults (18+) in the % of the global (=whole world) population from 1975 to 2016 [29] to calculate the presence of hunger.
If we have a well-fitting trendline, we can extrapolate the disappearance of underweight people, as shown in Figure 2.
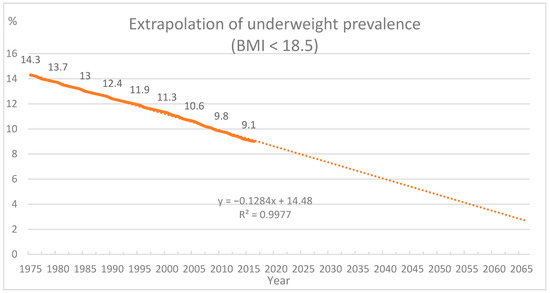
Figure 2.
Extrapolation of the proportion of underweight people. Source: own edition based on [28].
Figure 2 shows that hunger will not totally disappear by 2030, as written in SDG2.
Earlier in 2000, GDP growth was reported as a necessary requirement for the elimination of undernourishment. The per capita GDP in sub-Saharan Africa could have reached levels from USD 1000 to USD 3500 by 1990 if undernourishment had been eliminated (the difference between the two estimates depends on the method used for statistical analysis.) Instead, the region’s average GDP per capita in 1990 was just USD 800 per year [33]. This finding is in accordance with the conclusion of the IFPRI [36].
While the caloric content of the food produced worldwide would be sufficient to feed the whole global population, there are still countries in a state of chronic food scarcity. In these countries, food demand by the local population by far exceeds the supply allowed by the local land, water, climate, and soil conditions for food production [29].
Bijl et al. concluded that the estimated number of undernourished people is projected to decrease globally from roughly 700 million in 2015 to roughly 270 million in 2050 and to almost zero in 2100, depending on income growth, a reduction of variance in food consumption within population segments, and income inequality between population segments [37].
Serious activity must be carried out to approach ‘Zero Hunger’. We can calculate which trend can lead to zero hunger by 2030. In 2016, the prevalence of underweight people was 9% and the prevalence of undernourishment was 10.7%. As such, the necessary trend to reach zero hunger by 2030 must be y = −0.7643x + 11.464 in the case of underweight people and y = −0.6429x + 9.6429 in the case of undernourishment. We can compare coefficients from real trends and necessary trends, −0.6429/−0.1454 in case of underweight people and −0.7643/−0.3306 in case of undernourishment. As a result, the elimination of hunger must be 2.5–3 times faster if we want to achieve SDG2.
On the other hand, more than 820 million people in the world are still hungry today, underscoring the immense challenge of achieving the Zero Hunger target by 2030. Hunger is rising in almost all sub-regions of Africa and, to a lesser extent, in Latin America and western Asia [38].
As such, Hypothesis 1 is approved.
Surplus of and lack of food supply are given in Table 1.

Table 1.
Food supply on continents: need (2735 kcal/capita/day) vs. fact, 2017. Data source: FAOSTAT [39], edited by authors.
Table 1.
Food supply on continents: need (2735 kcal/capita/day) vs. fact, 2017. Data source: FAOSTAT [39], edited by authors.
| Continent | Population | Need * | Food Supply ** | Total Food Supply *** | LACK | SURPLUS |
|---|---|---|---|---|---|---|
| (1000 person) | PJ | kcal/day/capita | PJ | PJ | PJ | |
| Africa | 1,112,642.90 | 4654.07 | 2598 | 4420.81 | 233.26 | |
| America | 993,197.48 | 4154.45 | 3299 | 5011.00 | 856.56 | |
| Asia | 4,486,100.24 | 18,764.91 | 2831 | 19,422.97 | 658.07 | |
| Europe | 744,892.76 | 3115.81 | 3389 | 3860.75 | 744.94 | |
| Australia and New Zealand | 29,286.65 | 122.50 | 3286 | 147.18 | 24.68 | |
| TOTAL | 7,368,781.80 | 30,822.88 | 2917 | 32,872.98 | 2050.10 | |
| European Union | 510,683.32 | 2136.14 | 3448 | 2692.93 | 556.80 |
* 2735 kcal = 11,460 kJ, 11,460 kJ × 365 day × population × 10−12 ** by FAOSTAT *** 1 kcal = 4.19 kJ, food supply (kcal/capita/day) × 4.19 × 365 day × population × 10−12.
We can conclude from Table 2 that hunger and undernourishment in Africa could be balanced with less than one eighth of the overconsumption of the rest of the world, but Europe itself could easily compensate the destitution of the oldest continent, the cradle of mankind, with less than half of its overproduction.
Table 2.
Cereals produced, lost and consumed in 2017. Data source: FAOSTAT [39], edited by authors.
Hic published that the global (food) requirement for intake changed from 2300 kcal/cap/day to 2400 kcal/cap/day over the last 50 years, while food surplus grew from 310 kcal/cap/day to 510 kcal/cap/day [40]. These data are in accordance with our calculation in Table 2. Porkka et al. concluded, too, that the quantity of produced food is enough for the population of the whole world. They proved that any substantial improvement in food security would require real efforts for a more equal distribution of the global food supply [30]. Gerten et al. also demonstrated that a transformation towards more sustainable production and consumption patterns could support 10.2 billion people within planetary boundaries. The key prerequisites are spatially redistributed cropland, improved water–nutrient management, food waste reduction, and dietary changes [31].
According to our calculations, the rate of the lack of food supply is 233.26 PJ in Africa. Let us see how we can compare this amount with food losses. Food loss data [39] are summarized in Table 2.
The rate of the human consumption of cereals was 1.297 billion tons from the produced quantity (3006 billion tons) in 2017. Cereals give 176 kg/capita food supply per annum, which is 1318 kcal/capita/day. In that year, cereal losses were 143.14 million tons, which is 11% of the consumed quantity. The 11% loss rate translates to about 145 kcal/capita/day. The 145 kcal value is confirmed by other research, where global food waste in the world was calculated to be 273 kcal/capita/day. It was evaluated to represent approximately 15% of the global median daily dietary recommended intake (DRI) value [41]. Previously, a food production rate of 2609 kcal/capita/day was calculated by Kummu and colleagues, 614 kcal/capita/day of which was lost in the whole food supply chain, in the period of 2005–2007 [42].
Let us continue to express energy in J: 145 kcal/capita/day = 607.5 kJ. The per capita supply per day was multiplied by 365 days to obtain the annual per capita supply, and annual total supply was calculated by multiplying the annual per capita supply by the population, as it is expressed in the formula:
607.5 kJ/capita/day × 365 days × 7,368,781,800 person = 1,633,935,254,377,500 kJ = 1634 PJ
This amount (worldwide cereal loss) is almost eight times more than the amount of the lack of food in Africa (233.26 PJ). Vittuari et al. found that Italy’s food energy waste was 66.89 PJ in 2011 [43]. Their finding is in accordance with our results. The total food energy lost in Spain was calculated by Garcia-Herrero and coauthors in 2019. They found that the total food energy loss was 1020 kcal/cap/year, 39% of which was generated in agricultural production, 6% in post-harvest loss, another 6% through distribution, and 33% was lost in households [44].
As the proportion of loss and lack is (233 PJ/1634 PJ=) 14.3% (14.3% of 143,138=), 20,468 thousand tons of cereal contains the amount of nutriment that is necessary to end hunger. This amount is (20,468/1,296,838=) 1.58% of human consumption, which is demonstrated in Figure 3.
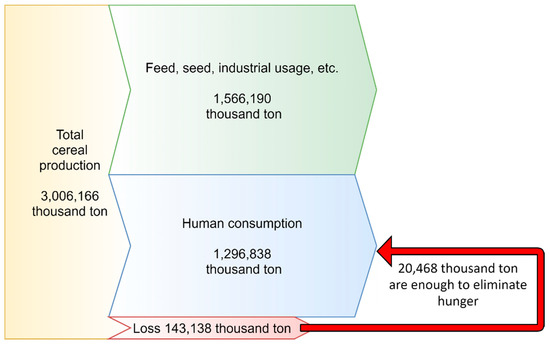
Figure 3.
Presentation of the proportion of cereal production amount, enough to eliminate hunger (own drawing).
Please note that our above analysis is only theoretical at present, as without effective global redistribution policies reducing food waste in Europe or on other continents, the availability of food will not increase in Africa.
Losses, given in Table 3, are most closely aligned with ‘post-harvest/post-slaughter loss’, representing those quantities of food that leave the production/supply chain at any stage, from post-harvest up to the retail level (the level of the supply chain at which ‘food availability’ is defined). The particular description is in the New Food Balances Description of utilization variables [45].
Table 3.
Loss and consumption of six different items in Africa, 2017. Data source: FAOSTAT [39], edited by authors.
We can conclude from Table 3 that the loss of these six items—cereals (excluding beer), starchy roots, vegetables, fruits (excluding wine), meat and milk (excluding butter)results in a loss of two times more (236 vs. 137 kcal/capita/day) food than the rate of physiological needs. This result is in harmony with the calculation of Lipinski, who with his colleagues, wrote that halving food loss and waste that corresponds to an increase of 22% of the estimated crop production is required to meet the demand in 2050 [46]. Because of this, Hypothesis 2 is also supported.
Additionally, the shortening of the food supply chain will lead to less food waste [47]. However, it is not a useful resolution, not all regions are able to supply themselves with food [48].
As shown in Table 4, losses in Africa are about eight times higher than in Europe. Aragie et al. wrote that policy measures should target the development of on-farm and post-harvest technologies to reduce FLW. Such measures would result in an increase in the incomes of rural households and a more sustainable use of natural resources [49].
Table 4.
Proportion of produced and lost cereals (excluding beer—item code: 2905), 2017. Data source: FAOSTAT [39], edited by authors).
These losses show a decreasing tendency because in 2014, the loss percentage was 10–23% [50], and in 2007, the biggest loss in Africa was 19.7% [51]. Improved storage innovations in Ethiopia could be part of climate smart technologies that help in sustainable food production through tackling post-harvest food loss and mitigating the agricultural contribution to climate change. The effect of these innovations was evaluated by Tesfaye et al. [52].
In 2018, a review stated that a number of pilot studies would be set up with the objective of learning more about food loss and waste in specific supply chains and testing approaches to effectively measure loss in smallholder supply chains. These pilot studies should provide improved and detailed understanding of the importance of measuring and the potential for increasing efficiency through food loss and waste reduction in Africa [53]. In developing countries, 50–60% of cereal grains can be lost during the storage stage due to a lack of technical efficiency. The use of scientific storage methods can reduce these losses to as little as 1–2% [54]. The trend of hunger elimination—in accordance with SDG2—was calculated in the first part of this study. The proportion of underweight people was 14.48% (WHO) in 1975, which is decreasing in a linear trend, y = −0.1284x + 14.48 (R2 = 0.9977). The extrapolation shows that hunger will not disappear by 2030. A similar calculation can be made using information from Our World in Data. The proportion of undernourished people decreased in an exponential trend (y = 16.122e−0.026x). We calculated that the linear trend must have a coefficient of −0.7643 in the case of undernourishment and −0.6429 for underweight people, to achieve Zero Hunger by 2030. This means that the decreasing trend must be 2.5–3 times faster than it was in the past decades.
Food energy and protein intake was investigated in the second part of this section. The lack of food energy was calculated in Africa in 2017. It was 233.26 PJ. This amount is two times higher than the food intake surplus in EU27.
In the third part of this section, we compared the food energy deficit in Africa and the energy content of global cereal losses. Global cereal losses were 145 kcal/day/capita in 2017. This amount translates to 1634 PJ for the whole world, which is eight times higher than the lack of food energy in Africa.
The next calculation covered food losses only in Africa. The loss of (a) cereals (excluding beer), (b) starchy roots, (c) vegetables, (d) fruits (excluding wine), (e) meat and [6] milk (excluding butter) results in a loss of almost two times more (236 vs. 137 kcal/capita/day) food energy than the rate of physiological needs.
Calculations continued with a comparison of cereal losses on different continents in 2017. There it was concluded that the loss of cereals in Africa exceeds the loss in Europe by more than four times (1.9% vs. 9.1%).
Hunger can be eliminated by reducing losses in Africa. However, help for Africa must not mean producing more food on other continents and transporting it there, which would increase the use of natural resources. Activities must be directed to saving losses, saving the resources of our planet at the same time.
We will continue this work by searching for possible reasons as to why this problem (reducing losses at the food storage stage in Africa) has not been solved yet.
Our analysis might seem Africa-Europe centered, but we implemented a global material balance analysis (see Appendix A 3). The emphasis on the relationship between these two continents was more symbolic than specific. Our primary goal with this research was not only to acclaim the benefits of global economic systems and theory, but to also point out some very pragmatic development options, which we call sustainable and humane economics.
5. Conclusion: Theoretically More Than Possible
Our main conclusions can be summarized in seven points:
- Cereal loss on whole world is 8 times more, than food lack in Africa: There is probably no ‘royal road’ (the concept of which can be attributed to Euclid of Alexandria) to solving the hunger problem of the 21st century, unless we deeply rethink international distribution mechanisms to turn free trade to fair trade;
- Protein supply covers physiological needs on each continent: No one should have starve, be thirsty, or be undernourished in the modern global economic system. The technology, market, and finally, human solidarity can make hunger and thirst a memory of darker ages, for first time in history. Even local production could make this possible;
- Loss of cereals in Europe is 1.9%, which is 9.1% in Africa: Economic efficiency (and ecological efficiency) has the vast potential to improve, especially in less developed economies. However, alone, they are not only insufficient to solve the problem, but can easily create new problems in terms of obesity, new diet diseases, and extremes (e.g., anorexia nervosa, radical vegan, or Paleolithic diet);
- Food loss in Africa in the supply chain is two times more, than deficit of calories. Growing agricultural efficiency is not the solution to this problem without new, innovative, and sustainable business models for the poor. In other words, it is not the food products that are missing, but the solvency of demand— families able to buy basic goods and services;
- Half of the food consumed over physiological needs in the EU28 would be more than sufficient to feed all of the needy in Africa: As Europe is the closest highly economically developed continent with a strong historical legacy against the African people (along with the USA), it would be obvious to redistribute European and American wealth and economic growth to less developed regions internationally. However, due to the nature of the market and the short lifetime of food products, traditional food banks and international humanitarian NGOs have limited possibilities. In our opinion, big agribusiness and hypermarket chains could ‘have an eye on Africa’ and develop new business models to grow in problem regions with non-conventional market logic, based also on the solidarity of European and American conscious consumers;
- Despite of the ambitious SDG goal and effective mechanisms, current trends will not lead to “Zero Hunger” by 2030. Undernourishment must be eliminated 3 times faster, and the proportion of underweight people must be lowered 2.5 times faster to achieve SDG2. After setting a ‘globeconomic’ goal for humanity, we must change the economic system radically.
Limitations: It is well known that all statistics, especially global ones like the FAO food balance sheets provide estimates with considerable outlier data and errors. As we move up the levels of abstraction and aggregation, we naturally run into some errors, which may be systematic in nature. Del Gobbo et al. compared FAO measures of food supply per capita with household survey-based estimates and found that the FAO measures tend to under-estimate the consumption of most food groups [55]. As a result, our statistical basis can be improved, but only with significant secondary data analysis.
Qualitative hunger is excluded from this study. The whole population was counted as adults in for the energy and protein needs from food. We also employed other simplifications like BMI zones, etc., noting that these methodological limitations are important, but also noting that giving a fair basis for our final conclusions is far more important.
Giving proper food and other basic services to every member of humanity is possible both technically and economically in the 21st century. The SDGs could be achieved with a bit more market innovation and a bit of change in the economic paradigm, as we proved with the example of hunger. At the surface level, which is the specific topic of this paper, production capacity, logistics, and effective (=solvent) demand are the key factors that should be developed first.
The deeper reason why severe and devastating as well as vicious lack of food has still not been solved on an overabundant globe in the 2020s is the economic thought that we call solvent demand. If capital and technology accumulation continue at the current trendline, and we continue to lack business models to involve the ‘bottom of the pyramid’ [56], the SDGs will never be reached, which is a shame for the ‘happy few’. The root cause is global and regional economic inequality, deepened by ecological and economic overuse (more money not causing more happiness, see the Easterlin paradox). Our calculations create an accepted general human and sustainable economic theory and innovative business models, but it is beyond the ambition of this paper to describe.
Author Contributions
Conceptualization: G.T.; methodology: G.T. and J.Z.; formal analysis: J.Z.; investigation: G.T. and J.Z.; data curation: J.Z.; writing—original draft preparation: J.Z.; writing—review and editing: G.T.; visualization: J.Z.; supervision: G.T. All authors have read and agreed to the published version of the manuscript.
Funding
This research had no external funding whatsoever, except the OTKA K-16 project specified in the Acknowledgement.
Institutional Review Board Statement
Not applicable.
Informed Consent Statement
Not applicable.
Data Availability Statement
Not applicable.
Acknowledgments
This research was supported by national and EU funds by the K 133924 OTKA K-16 research project, entitled the natural limits to economic equilibrium, by the National Research, Development and Innovation Fund of Hungary.
Conflicts of Interest
The authors declare no conflict of interest.
Appendix A
- Or even the 9–10 billion, which is the medium forecast for the near-future peak population, according to medium forecasts in BAU (‘business as usual’) The 7.767 billion figure comes Worldometer [57], which is the most up to date but supposedly not the most accurate estimation of World population, at this very moment: https://www.worldometers.info/%202020-02-29,%207,%2043, accessed on 29 February 2020. In the article we will refer to scientific sources when citing recent population figures and estimations for peak population—the number of people and years to reach the peak.
- Globeconomics (from the words ‘global’ and ‘economics’) is a branch of economics that studies the ecological limits of the total world economy and concentrates on the balanced development of national economies to avoid extreme inequality and the decrease of marginal happiness with increased income.
- Newly proposed key research expression will start with capital letters, as a sort of informal copyright.
References
- Universal Declaration of Human Rights. Available online: https://www.un.org/en/universal-declaration-human-rights/ (accessed on 25 March 2020).
- A/RES/55/2 United Nations Millennium Declaration. Available online: https://undocs.org/A/RES/55/2 (accessed on 25 March 2020).
- MDG 1: Eradicate Extreme Poverty and Hunger. Available online: http://www.fao.org/sustainable-development-goals/mdg/goal-1/en/ (accessed on 25 March 2020).
- The Millennium Development Goals Report. 2015. Available online: https://www.un.org/millenniumgoals/2015_MDG_Report/pdf/MDG%202015%20rev%20(July%201).pdf (accessed on 25 March 2020).
- Butler, C.D. Revised hunger estimates accelerate apparent progress towards the MDG hunger target. Glob. Food Secur. 2015, 5, 19–24. [Google Scholar] [CrossRef]
- Jacob, A. Mind the Gap: Analyzing the Impact of Data Gap in Millennium Development Goals’ (MDGs) Indicators on the Progress toward MDGs. World Dev. 2017, 93, 260–278. [Google Scholar] [CrossRef]
- Godfray, H.C.J.; Beddington, J.R.; Crute, I.R.; Haddad, L.; Lawrence, D.; Muir, J.F.; Toulmin, C. Food security: The challenge of feeding 9 billion people. Science 2010, 327, 812–818. [Google Scholar] [CrossRef] [Green Version]
- Transforming our World: The 2030 Agenda for Sustainable Development. Available online: https://daccess-ods.un.org/access.nsf/GetFile?OpenAgent&DS=A/RES/70/1&Lang=E&Type=DOC (accessed on 28 March 2020).
- 2030 Agenda for Sustainable Development. Available online: http://www.fao.org/sustainable-development-goals/overview/en/ (accessed on 28 March 2020).
- Lemaire, A.; Limbourg, S. How can food loss and waste management achieve sustainable development goals? J. Clean. Prod. 2019, 234, 1221–1234. [Google Scholar] [CrossRef]
- Byerlee, D.; Fanzo, J. The SDG of zero hunger 75 years on: Turning full circle on agriculture and nutrition. Glob. Food Secur. 2019, 21, 52–59. [Google Scholar] [CrossRef]
- Gödecke, T.; Stein, A.J.; Qaim, M. The global burden of chronic and hidden hunger: Trends and determinants. Glob. Food Secur. 2018, 17, 21–29. [Google Scholar] [CrossRef]
- Stein, A.J. Rethinking the measurement of undernutrition in a broader health context: Should we look at possible causes or actual effects? Glob. Food Secur. 2014, 3, 193–199. [Google Scholar] [CrossRef] [Green Version]
- Tamburino, L.; Bravo, G.; Clough, Y.; Nicholas, K.A. From population to production: 50 years of scientific literature on how to feed the world. Glob. Food Secur. 2020, 3, 193–199. [Google Scholar] [CrossRef]
- Pollard, C.M.; Booth, S. Food Insecurity and Hunger in Rich Countries—It Is Time for Action against Inequality. Int. J. Environ. Res. Public Health 2019, 16, 1804. [Google Scholar] [CrossRef] [Green Version]
- Gini, C. On the Measure of Concentration with Special Reference to Income and Statistics, General Series. Colo. Coll. Publ. 1936, 208, 73–79. [Google Scholar]
- Coleman-Jensen, A.; Rabbitt, M.P.; Gregory, C.; Singh, A. Household food security in the United States in 2014. In U.S. Household Food Security: Statistics and Analysis for 2014; Nova Science Publishers: New York, NY, USA, 2016; pp. 1–56. [Google Scholar] [CrossRef] [Green Version]
- Steiner, G.; Geissler, B.; Schernhammer, E. Hunger and Obesity as Symptoms of Non-Sustainable Food Systems and Malnutrition. Appl. Sci. 2019, 9, 1062. [Google Scholar] [CrossRef] [Green Version]
- More, S.; Bampidis, V.; Benford, D.; Bragard, C.; Halldorsson, T.; Hougaard Bennekou, S.; Hernández-Jerez, A. Statement on the derivation of Health-Based Guidance Values (HBGVs) for regulated products that are also nutrients. EFSA J. 2021, 19. [Google Scholar] [CrossRef]
- Ameye, H.; Swinnen, J. Obesity, income and gender: The changing global relationship. Glob. Food Secur. 2019, 23, 267–281. [Google Scholar] [CrossRef] [Green Version]
- Veldhuizen, L.J.; Giller, K.E.; Oosterveer, P.; Brouwer, I.D.; Janssen, S.; van Zanten, H.H.; Slingerland, M.M.A. The Missing Middle: Connected action on agriculture and nutrition across global, national and local levels to achieve Sustainable Development Goal 2. Glob. Food Secur. 2020, 24, 100336. [Google Scholar] [CrossRef]
- Lowder, S.K.; Bertini, R.; Croppenstedt, A. Poverty, social protection and agriculture: Levels and trends in data. Glob. Food Secur. 2017, 15, 94–107. [Google Scholar] [CrossRef]
- Choudhury, S.; Headey, D. What drives diversification of national food supplies? A cross-country analysis. Glob. Food Secur. 2017, 15, 85–93. [Google Scholar] [CrossRef] [PubMed]
- Fróna, D.; Szenderák, J.; Harangi-Rákos, M. The Challenge of Feeding the World. Sustainability 2019, 11, 5816. [Google Scholar] [CrossRef] [Green Version]
- Hunger Hotspots. FAO-WFP Early Warnings on Acute Food Insecurity. 2021. Available online: http://www.fightfoodcrises.net/fileadmin/user_upload/fightfoodcrises/doc/resources/Hunger-Hotspots-March-2021.pdf (accessed on 24 March 2021).
- Hossain, N. Inequality, Hunger, and Malnutrition: Power Matters. In Global Hunger Index: The Inequalities of Hunger; International Food Policy Research Institute, Welthungerhilfe, and Concern Worldwide: Washington, DC, USA, 2017; pp. 24–29. [Google Scholar]
- Janssens, C.; Havlík, P.; Krisztin, T.; Baker, J.; Frank, S.; Hasegawa, T.; Leclere, D.; Ohrel, S.; Ragnauth, S.; Schmid, E.; et al. Global hunger and climate change adaptation through international trade. Nat. Clim. Chang. 2020, 10, 829–835. [Google Scholar] [CrossRef]
- WHO. Global Health Observatory, Data Repository, Prevalence of Underweight, Overweight and Obesity among Adults. Available online: https://apps.who.int/gho/data/node.home (accessed on 8 April 2020).
- D’Odorico, P.; Carr, J.; Laio, F.; Ridolfi, L.; Vandoni, S. Feeding humanity through global food trade. Earth’s Futur. 2014, 2, 458–469. [Google Scholar] [CrossRef]
- Porkka, M.; Kummu, M.; Siebert, S.; Varis, O. From Food Insufficiency towards Trade Dependency: A Historical Analysis of Global Food Availability. PLoS ONE 2013, 8, e82714. [Google Scholar] [CrossRef] [Green Version]
- Gerten, D.; Heck, V.; Jägermeyr, J.; Bodirsky, B.L.; Fetzer, I.; Jalava, M.; Kummu, M.; Lucht, W.; Rockström, J.; Schaphoff, S.; et al. Feeding ten billion people is possible within four terrestrial planetary boundaries. Nat. Sustain. 2020, 3, 200–208. [Google Scholar] [CrossRef]
- Albert, J.; Burlingame, B. The State of Food Insecurity in the World Food Insecurity 2000. Available online: http://www.fao.org/3/x8200e/x8200e00.htm (accessed on 24 October 2020).
- WHO. Prevalence of Underweight. Available online: https://www.who.int/data/gho/data/indicators/indicator-details/GHO/prevalence-of-underweight-among-adults-bmi-18-(age-standardized-estimate)-(-) (accessed on 8 April 2020).
- Institute of Medicine. Dietary Reference Intakes for Energy, Carbohydrate, Fiber, Fat, Fatty Acids, Cholesterol, Protein, and Amino Acids (Macronutrients). Natl. Acad. Press 2005, 3, 1–1331. [Google Scholar]
- EFSA Scientific Opinion on Dietary Reference Values for protein. EFSA J. 2012, 10. [CrossRef]
- Research Institute (IFPRI). Global Food Policy Report: Building Inclusive Food Systems; International Food Policy Research Institute (IFPRI): 1201 Eye Street, NW Washington, DC 20005-3915 USA. 2020. Available online: http://ebrary.ifpri.org/utils/getfile/collection/p15738coll2/id/133646/filename/133857.pdf (accessed on 15 October 2020).
- Bijl, D.L.; Bogaart, P.W.; Dekker, S.; Stehfest, E.; de Vries, B.J.; van Vuuren, D.P. A physically-based model of long-term food demand. Glob. Environ. Chang. 2017, 45, 47–62. [Google Scholar] [CrossRef] [Green Version]
- Egal, F. Review of The State of Food Security and Nutrition in the World, 2019. World Nutr. 2019, 10, 95–97. [Google Scholar] [CrossRef]
- FAO. Stat Data (Last Updated: 19 February 2020). Available online: http://www.fao.org/faostat/en/#data/FBS (accessed on 22 June 2020).
- Hiç, C.; Pradhan, P.; Rybski, D.; Kropp, J. Food Surplus and Its Climate Burdens. Environ. Sci. Technol. 2016, 50, 4269–4277. [Google Scholar] [CrossRef] [PubMed] [Green Version]
- Chen, C.; Chaudhary, A.; Mathys, A. Nutritional and environmental losses embedded in global food waste. Resour. Conserv. Recycl. 2020, 160, 104912. [Google Scholar] [CrossRef]
- Kummu, M.; de Moel, H.; Porkka, M.; Siebert, S.; Varis, O.; Ward, P. Lost food, wasted resources: Global food supply chain losses and their impacts on freshwater, cropland, and fertiliser use. Sci. Total. Environ. 2012, 438, 477–489. [Google Scholar] [CrossRef]
- Vittuari, M.; De Menna, F.; Pagani, M. The Hidden Burden of Food Waste: The Double Energy Waste in Italy. Energies 2016, 9, 660. [Google Scholar] [CrossRef] [Green Version]
- Garcia-Herrero, I.; Margallo, M.; Laso, J.; Batlle-Bayer, L.; Bala, A.; Fullana-I-Palmer, P.; Vazquez-Rowe, I.; Gonzalez, M.; Amo-Setien, F.; Durá, M.; et al. Nutritional data management of food losses and waste under a life cycle approach: Case study of the Spanish agri-food system. J. Food Compos. Anal. 2019, 82, 103223. [Google Scholar] [CrossRef]
- FAO. New Food Balances Description of Utilization Variables. Available online: http://fenixservices.fao.org/faostat/static/documents/FBS/New%20FBS%20methodology.pdf (accessed on 24 May 2021).
- Lipinski, B.; Hanson, C.; Lomax, J.; Kitinoja, L.; Waite, R.; Searchinger, T. Installment 2 of Creating a Sustainable Food Future. Available online: http://www.worldresourcesreport.org (accessed on 15 October 2020).
- Popp, J.; Oláh, J.; Kiss, A.; Temesi, Á.; Fogarassy, C.; Lakner, Z. The socio-economic force field of the creation of short food supply chains in Europe. J. Food Nutr. Res. 2019, 58, 31–41. [Google Scholar]
- Benedek, Z.; Ferto, I.; Szente, V. The multiplier effects of food relocalization: A systematic review. Sustainability 2020, 12, 3524. [Google Scholar] [CrossRef]
- Aragie, E.; Balié, J.; MoralesOpazo, C. Does reducing food losses and wastes in sub-Saharan Africa make economic sense? Waste Manag. Res. 2018, 36, 483–494. [Google Scholar] [CrossRef]
- Hodges, R.J.; Bernard, M.; Rembold, F. APHLIS—Postharvest Cereal Losses in Sub-Saharan Africa, Their Estimation, Assessment and Reduction. Available online: https://ec.europa.eu/jrc/en/publication/eur-scientific-and-technical-research-reports/aphlis-postharvest-cereal-losses-sub-saharan-africa-their-estimation-assessment-and (accessed on 13 October 2020).
- Hodges, R.J.; Bernard, M.; Knipschild, H.; Rembold, F. African Postharvest Losses Information System—A network for the estimation of cereal weight losses. Julius-Kühn-Archiv. 2010, 425, 956. [Google Scholar] [CrossRef]
- Tesfaye, W.; Tirivayi, N. The Effect of Improved Storage Innovations on Food Security and Welfare in Ethiopia. MERIT Working Papers. 2016. Available online: https://ideas.repec.org/p/unm/unumer/2016063.html (accessed on 11 November 2020).
- Snel, H.; Saavedra, Y.; Koomen, I. Hotspot Analysis on Food Loss and Waste in African Agriculture Literature Review; Wageningen University: Wageningen, The Netherlands, 2018. [Google Scholar] [CrossRef]
- Kumar, D.; Kalita, P. Reducing Postharvest Losses during Storage of Grain Crops to Strengthen Food Security in Developing Countries. Foods 2017, 6, 8. [Google Scholar] [CrossRef] [PubMed] [Green Version]
- Del Gobbo, L.C.; Khatibzadeh, S.; Imamura, F.; Micha, R.; Shi, P.; Smith, M.; Mozaffarian, D. Assessing global dietary habits: A comparison of national estimates from the FAO and the Global Dietary Database. Am. J. Clin. Nutr. 2015, 101, 1038–1046. [Google Scholar] [CrossRef] [PubMed] [Green Version]
- Prahalad, C.K. Bottom of the Pyramid as a Source of Breakthrough Innovations. J. Prod. Innov. Manag. 2012, 29, 6–12. [Google Scholar] [CrossRef]
- WORLDOMETERS. Available online: https://www.worldometers.info/ (accessed on 29 February 2020).
Publisher’s Note: MDPI stays neutral with regard to jurisdictional claims in published maps and institutional affiliations. |
© 2021 by the authors. Licensee MDPI, Basel, Switzerland. This article is an open access article distributed under the terms and conditions of the Creative Commons Attribution (CC BY) license (https://creativecommons.org/licenses/by/4.0/).