Article

Optimisation of Charcoal and Sago (Metroxylon sagu) Bark Ash to Improve Phosphorus Availability in Acidic Soils

1
Department of Crop Science, Faculty of Agricultural Science and Forestry, Bintulu Sarawak Campus, Universiti Putra Malaysia, Bintulu 97008, Malaysia
2
Institut Ekosains Borneo (IEB), Faculty of Agriculture and Forestry Sciences, Bintulu Sarawak Campus, Universiti Putra Malaysia, Bintulu 97008, Malaysia
3
Institute of Tropical Agriculture, Universiti Putra Malaysia (ITAFoS), Seri Kembangan 43000, Malaysia
4
School of Agriculture, SIREC, CBAS, University of Ghana, Legon, Accra 23321, Ghana
5
Faculty of Sustainable Agriculture, Sandakan Campus, Universiti Malaysia Sabah, Sandakan 90509, Malaysia
*
Author to whom correspondence should be addressed.
Agronomy 2021, 11(9), 1803; https://doi.org/10.3390/agronomy11091803
Submission received: 29 April 2021 / Revised: 27 May 2021 / Accepted: 3 June 2021 / Published: 8 September 2021

Abstract

:
Soil acidity is an important soil factor affecting crop growth and development. This ultimately limits crop productivity and the profitability of farmers. Soil acidity increases the toxicity of Al, Fe, H, and Mn. The abundance of Al and Fe ions in weathered soils has been implicated in P fixation. To date, limited research has attempted to unravel the use of charcoal with the incorporation of sago (Metroxylon sagu) bark ash to reduce P fixation. Therefore, an incubation study was conducted in the Soil Science Laboratory of Universiti Putra Malaysia Bintulu Sarawak Campus, Malaysia for 90 days to determine the optimum amounts of charcoal and sago bark ash that could be used to improve the P availability of a mineral acidic soil. Charcoal and sago bark ash rates varied by 25%, whereas Egypt rock phosphate (ERP) rate was fixed at 100% of the recommendation rate. Soil available P was determined using the Mehlich 1 method, soil total P was extracted using the aqua regia method, and inorganic P was fractionated using the sequential extraction method based on its relative solubility. Other selected soil chemical properties were determined using standard procedures. The results reveal that co-application of charcoal, regardless of rate, substantially increased soil total carbon. In addition, application of 75% sago bark ash increased soil pH and at the same time, it reduced exchangeable acidity, Al3+, and Fe2+. Additionally, amending acidic soils with both charcoal and sago bark ash positively enhanced the availability of K, Ca, Mg, and Na. Although there was no significant improvement in soil Mehlich-P with or without charcoal and sago bark ash, the application of these amendments altered inorganic P fractions in the soil. Calcium-bound phosphorus was more pronounced compared with Al-P and Fe-P for the soil with ERP, charcoal, and sago bark ash. The findings of this study suggest that as soil pH decreases, P fixation by Al and Fe can be minimised using charcoal and sago bark ash. This is because of the alkalinity of sago bark ash and the high affinity of charcoal for Al and Fe ions to impede Al and Fe hydrolysis to produce more H+. Thus, the optimum rates of charcoal and sago bark ash to increase P availability are 75% sago bark ash with 75%, 50%, and 25% charcoal because these rates significantly reduced soil exchangeable acidity, Al3+, and Fe2+.

1. Introduction

Phosphorus is an essential nutrient which serves as a component of many key plant structural compounds and as a catalyst in the conversion of numerous biochemical reactions in plants. It induces the development of reproductive organs in plants, promotes root growth, and enhances crop quality and maturation through accretion, transfer, and release of energy in several cellular metabolic processes during degradation and biosynthesis [1,2,3]. Phosphorus availability is limited in soils, especially in acidic soils such as highly weathered ultisols and oxisols. This limitation is mainly because of the abundance of Al and Fe resulting from high weathering of the soils’ minerals [4,5]. These acidic cations tend to convert P in the soil solution to water-insoluble Fe-P and Al-P. These water insoluble Fe-P and Al-P compounds are not readily available for plant uptake [6,7]. Orthophosphates in soil solution react with Fe and Al species to form amorphous Fe-P and Al-P compounds, and these reactions can decrease P availability [8,9]. Phosphorus is mostly accessible to plants at a soil pH of between slightly acidic and neutral (6.5 to 7) [10,11]. The total soil P content usually ranges from 50 to 3000 mg kg−1 (existing in organic and inorganic forms). However, only a small proportion of the total P (usually <1%) is available for plant uptake [10,12]. This is because in acidic soils, P is fixed by the active forms of Al and Fe oxides and hydroxides, whereas in alkaline soils, P reacts with Ca to form insoluble phosphate compounds [13,14].
As a solution for P fixation, farmers tend to apply a large amount of P fertilisers to saturate the capacity of P sorption and to also ensure that there is sufficient available P for plant uptake [15]. Excessive use of P fertilisers is not only uneconomical, but it also has adverse effects on the environment. First, P fertilisers are largely derived from rock phosphate, which is a non-renewable resource and major deposits are only found in a few countries [16,17]. Second, applications of P fertilisers to soils with high P sorption capacity can be inefficient because P largely accumulates in the soil in sparingly soluble forms [18]. Third, when soils are saturated with P, the excess P has a greater potential to enter water bodies through soil erosion [19], surface runoff, and leaching [20]. The losses of P through these processes lead to eutrophication and water quality deterioration [21,22]. To this end, studies have been conducted to improve P availability using lime [23,24,25]. Liming is the conventional method to improve soil pH so as to solubilise Al and Fe to release fixed P [26,27]. However, liming is an expensive soil conditioning approach because it is not practical for farmers to apply higher rates of lime frequently. Furthermore, over-liming causes calcium phosphate formation [28], a reaction which also causes P to be fixed or makes P unavailable for optimum plant use.
In developing countries, the forestry and agricultural sectors play important roles in their socio-economic development. This has resulted in the exponential production of wood residues. As an example, the Malaysian timber industry generates approximately 3.4 million m3 of annual wood residues, such as sawdust, wood chips, bark, slab, and other raw materials, with a standard 55% recovery rate [29]. Approximately 43% of the total tree volume remains in the forest during logging operations, 13% of the sawdust is produced in the sawmill industry and 53% of the logs are discarded as waste during processing into plywood [30]. Therefore, the timber industry typically converts these wastes into charcoal, briquettes, or pellets.
Furthermore, Sarawak, Malaysia is currently one of the largest exporters of sago products in the world, with annual exports of approximately 25,000 to 40,000 tonnes to Peninsular Malaysia, Japan, Taiwan, and Singapore [31,32]. Nevertheless, it is expected that this value will increase every year, corresponding to the global demand, and will consequently increase the amount of waste produced. During the processing of sago starch, three major by-products are generated, namely sago trunk bark, fibrous pith residue, also known as hampas, and wastewater. It is estimated that for every tonne of sago flour produced, 0.75 tonnes of sago bark waste are created [33]. Sago bark waste is commonly incinerated for power generation in sago mills, deposited directly into nearby rivers, or left for natural degradation outside sago mills [34]. Annually, approximately 20,000 tonnes of sago bark are discarded from Malaysia’s sago industry [35].
To ameliorate P fixation and to maximise the exploitation of agro-industrial waste as higher value-added products, charcoal and sago bark ash can be used as soil amendments. The application of soil amendments such as biochar, compost, and manures have been reported to improve soil chemical properties and particularly enhancing P availability via a reduction in P sorption sites [36,37,38]. Addition of these amendments to soils can promote soil fertility and crop productivity, improve soil aggregation and structure, increase pH buffering capacity, cation exchange capacity, soil water retention, bioavailability of immobile nutrients, and carbon sequestration [39,40,41].
The highly porous structure of charcoal is resilient to biotic degradation, and this enables it to serve as a carbon storage medium in ecosystems for a long time [42,43]. The abundance of pores in charcoals enable air retention, hence creating an aerobic condition in the soil [44]. Moreover, these pores are able to adsorb toxic substances such as phenolics, Al, and Fe ions, thus avoiding the inhibition of fine roots and hyphae of arbuscular mycorrhizae and ectomycorrhizae development [45,46,47,48]. In addition, the pores indirectly improve nutrient retention through adsorbing and holding water [49,50,51]. Charcoal can also neutralise soil pH, which is essential for crop production in acidic soils [46,50,52].
Similarly, ash can neutralise the acidity of soils because of the presence of neutralising compounds such as calcite (CaCO3), fairchildite (K2Ca(CO3)2), lime (CaO), and magnesium oxide (MgO) [53,54]. Demeyer et al. [55] specified that high concentrations of P, Ca, Mg, and K in wood ash is valuable for soils which are naturally low in nutrients. In addition, wood ash increases basic cation saturation in forest soils [56,57,58]. Ferriero et al. [59] found that the concentrations of trace elements such as Mn, Zn, and B increased with the application of wood ash. Moreover, ash is reported to enhance microbial activity in the soil, which may favour nutrient availability [55].
It was hypothesised that combined application of charcoal and sago bark ash at the correct amount will be able to increase P availability, at the same time fixing Al and Fe ions. The research question to be addressed in this study is how much charcoal and sago bark ash are needed to unlock fixed P by Al and Fe ions. The implications of including charcoal and sago bark ash as soil amendments is not only an attempt to develop new practices that could put agro-industrial wastes to good use, but also to provide a deeper understanding on the mechanism involves in mitigating high P fixation of acidic soils. A holistic understanding of the relationships and interactions of the various P pools in soils and the numerous factors that influence P availability is essential for optimising P management and improving P use efficiency. Therefore, this study was focused on optimising charcoal and sago bark ash to increase P availability in acidic soils.

2. Materials and Methods

2.1. Soil Sampling, Preparation, and Selected Physico-Chemical Analyses

The soil (Bekenu Series, Typic Paleudults) used in this study was taken from an uncultivated secondary forest of Universiti Putra Malaysia Bintulu Sarawak Campus (UPMKB) on geographical coordinate of 3°12′20″ N, 113°04′20″ E (Figure 1). This soil was selected because it is commonly cultivated with different crops in Malaysia although it is characterised by high P-fixing because of high Al and Fe contents. The area has an elevation of 27.3 m, an annual rainfall of 2993 mm, a mean temperature of 27 °C, and a relative humidity of approximately 80%. The soil was randomly sampled with specifications of 1 m length × 1 m width at depth of 0–20 cm using a shovel. Ten sacks of soil were sampled, each containing approximately 10 kg of soil. Thereafter, the soil was air-dried, crushed manually, and sieved through a 2 mm sieve.
The soil was analysed for soil bulk density using the coring method [60]. Soil texture was determined using the hydrometer method [61]. Soil pH in water and KCl and electrical conductivity (EC) were determined at a ratio of 1:2.5 (soil:distilled water/KCl) using a digital pH meter and EC meter [62]. Soil total carbon was calculated as 58% of the organic matter determined using the loss on ignition method [63]. Total N was determined using the Kjeldhal method [64]. The soil cation exchange capacity (CEC) was determined using the leaching method [65] followed by steam distillation [64]. Soil exchangeable acidity, H+, and Al3+ were determined using the acid-base titration method [66].
Soil total P was extracted using the aqua regia method [67]. The aqua regia solution was prepared by mixing concentrated HCl and concentrated HNO3 at a ratio of 3:1. A 2 g sample of soil was weighed and placed into a 250 mL conical flask, after which 20 mL of aqua regia solution was added. Thereafter, the suspension was heated on a hot plate until the solution turned clear. The suspension was filtered using into a 100 mL volumetric flask and diluted to the required volume with distilled water. Soil available P and exchangeable cations (K+, Ca2+, Mg2+, Na+, Mn2+, and Fe2+) were extracted using the Mehlich No.1 double acid method [68]. The double acid solution (mixture of 0.05 M HCl and 0.025 M H2SO4) was prepared by mixing 4.12 mL of concentrated HCl with 1.40 mL of concentrated H2SO4 in a 1000 mL volumetric flask and diluted to the required volume with distilled water. A 5 g sample of soil was weighed and placed into a plastic vial, after which 20 mL of double acid solution was added. Afterwards, the suspension was shaken at 180 rpm for 10 min. The suspension was filtered into a plastic vial using filter paper. Series of extractants were used to fractionate pools of inorganic P following the sequential extraction method described by Kuo [69]. Loosely soluble P (Sol-P) was removed using 1 M NH4Cl. Aluminium-bound P (Al-P) was separated from iron-bound P (Fe-P) using 0.5 M NH4F at a pH of 8.2, then Fe-P was removed using 0.1 M NaOH. Reductant soluble P (Red-P) was extracted using 0.3 M sodium citrate (Na3C6H5O7), 1 M sodium bicarbonate (NaHCO3), and sodium dithionate (Na2S2O4). Calcium-bound P (Ca-P) was extracted using 0.25 M H2SO4, whereas for occluded P (Occl-P), 0.1 M NaOH was used.
Soil total P, Mehlich-P, and inorganic P concentration were determined using UV-VIS Spectrophotometer (Perkin Elmer Lambda 25, Waltham, MA, USA) at 882 nm wavelength after a blue colour was developed using the molybdenum blue method [70]. Acid molybdate stock solution (Reagent A) and ascorbic acid stock solution (Reagent B) were prepared for the blue colour development procedure. A standard P solution (standard solution 1) and standard solution 2 were prepared and used to prepare working solutions ranging from 0 to 0.6 ppm. In this process, 1 to 6 mL of standard solution 2 was pipetted into a 50 mL volumetric flask containing 8 mL of Reagent B and diluted to the required volume with distilled water. Afterwards, 8 mL of Reagent B was pipetted into a different 50 mL volumetric flask, after which the sample was added depending on the intensity of the blue colour to be developed. The solution was diluted to the required volume with distilled water. Soil exchangeable cations were determined using atomic absorption spectrometry (AAS) (Analyst 800, Perkin Elmer, Norwalk, CT, USA). The physico-chemical properties of the soil used in this present study were within the range reported by Paramananthan [71], except for soil texture. The selected physico-chemical properties of the soil are summarised in Table 1. The percentages of the inorganic P fractions in the soil before the incubation study are summarised in Table 2, where the order of the P fraction was Fe-P > Occl-P > Al-P > Ca-P > Red-P > Sol-P.

2.2. Charcoal and Sago Bark Ash Characterisation

The charcoal used in this study was obtained from Pertama Ferroalloys Sdn Bhd, Bintulu, Sarawak, Malaysia, whereas the sago bark ash was purchased from Song Ngeng Sago Industries, Dalat, Sarawak, Malaysia. Afterwards, the amendments were analysed for pH in water and in KCl, EC [62], available P [68,70], and exchangeable K+, Ca2+, Mg2+, Na+, and Fe2+ [68]. The results of these analyses are presented in Table 3.

2.3. Incubation Set Up

A laboratory incubation study was conducted in the Soil Science Laboratory of UPMKB. A 1 kg sample of soil (from the 2 mm bulked soil sample) was weighed in a polypropylene container. Egypt rock phosphate, charcoal, and sago bark ash were added and thoroughly mixed according to the treatment evaluated in this present study. The samples were moistened to 60% of moisture content based on the soil field capacity. The lids of the polypropylene containers were perforated to allow good aeration. The samples were incubated at room temperature (26 °C) for 30, 60, and 90 days. The recommended rate of the P fertiliser used was 60 kg P2O5 ha−1 (214 kg ha−1 ERP). This rate was based on the standard recommendation for maize (Zea mays L.) cultivation [72]. Maize was chosen as the test crop because of its sensitivity, which can reflect nutrient recovery, uptake, and efficiency and rapid response towards nutrient deficiency. The rate at which the fertilisers were applied in the incubation study was scaled down to a per plant basis (based on planting density of 27,777 plants ha−1), which was equivalent to 7.7 g of ERP plant−1. The amounts of the amendments used were deduced from the literature (charcoal [73,74] and sago bark ash [75,76,77]) where 10 and 5 t ha−1 equivalent to 51.4 and 25.7 g, respectively, in 1 kg of soil per container. The charcoal and sago bark ash rates were varied by 25%, whereas the ERP rate was fixed at 100% of the recommendation rate in all treatments except for T1 (no ERP applied). The treatments evaluated in this present study are summarised as follows:
T1:
Soil only
T2
Soil + ERP
T3
Soil + ERP + 51.4 g charcoal
T4
Soil + ERP + 25.7 g sago bark ash
T5
Soil + ERP + 51.4 g charcoal + 25.7 g sago bark ash
T6:
Soil + ERP + 38.6 g charcoal + 19.3 g sago bark ash
T7:
Soil + ERP + 25.7 g charcoal + 19.3 g sago bark ash
T8:
Soil + ERP + 12.9 g charcoal + 19.3 g sago bark ash
T9:
Soil + ERP + 38.6 g charcoal + 12.9 g sago bark ash
T10:
Soil + ERP + 25.7 g charcoal + 12.9 g sago bark ash
T11:
Soil + ERP + 12.9 g charcoal + 12.9 g sago bark ash
T12:
Soil + ERP + 38.6 g charcoal + 6.4 g sago bark ash
T13:
Soil + ERP + 25.7 g charcoal + 6.4 g sago bark ash
T14:
Soil + ERP + 12.9 g charcoal + 6.4 g sago bark ash

2.4. Experimental Design and Statistical Analysis

The treatments were arranged in a completely randomised design (CRD) with three replications. Normality test was used to determine if the data set is well-modelled by a normal distribution. Analysis of variance (ANOVA) was used to detect treatment effects, whereas treatments means were compared using Tukey’s Studentized range (HSD) test at p ≤ 0.05. The statistical software used was Statistical Analysis System (SAS) version 9.4.

3. Results

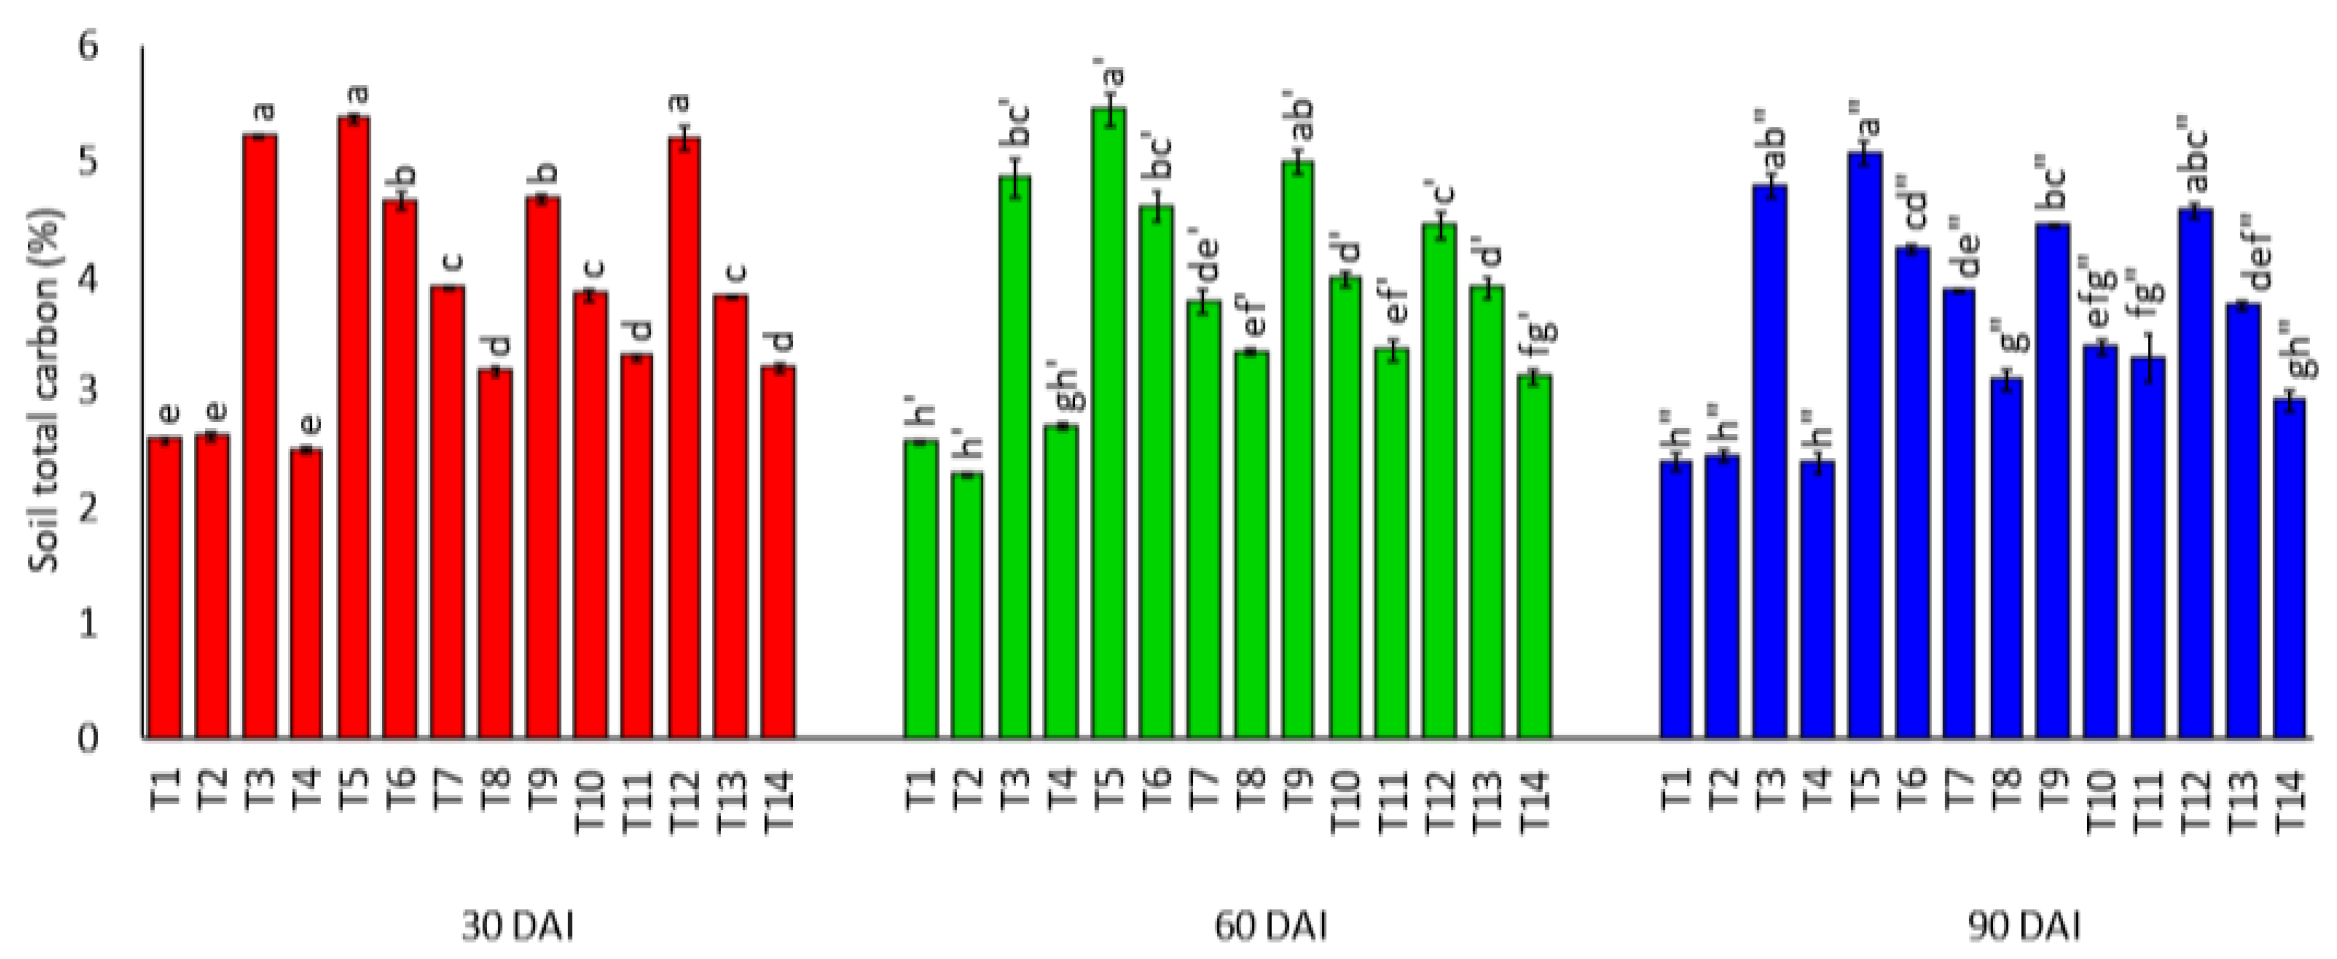
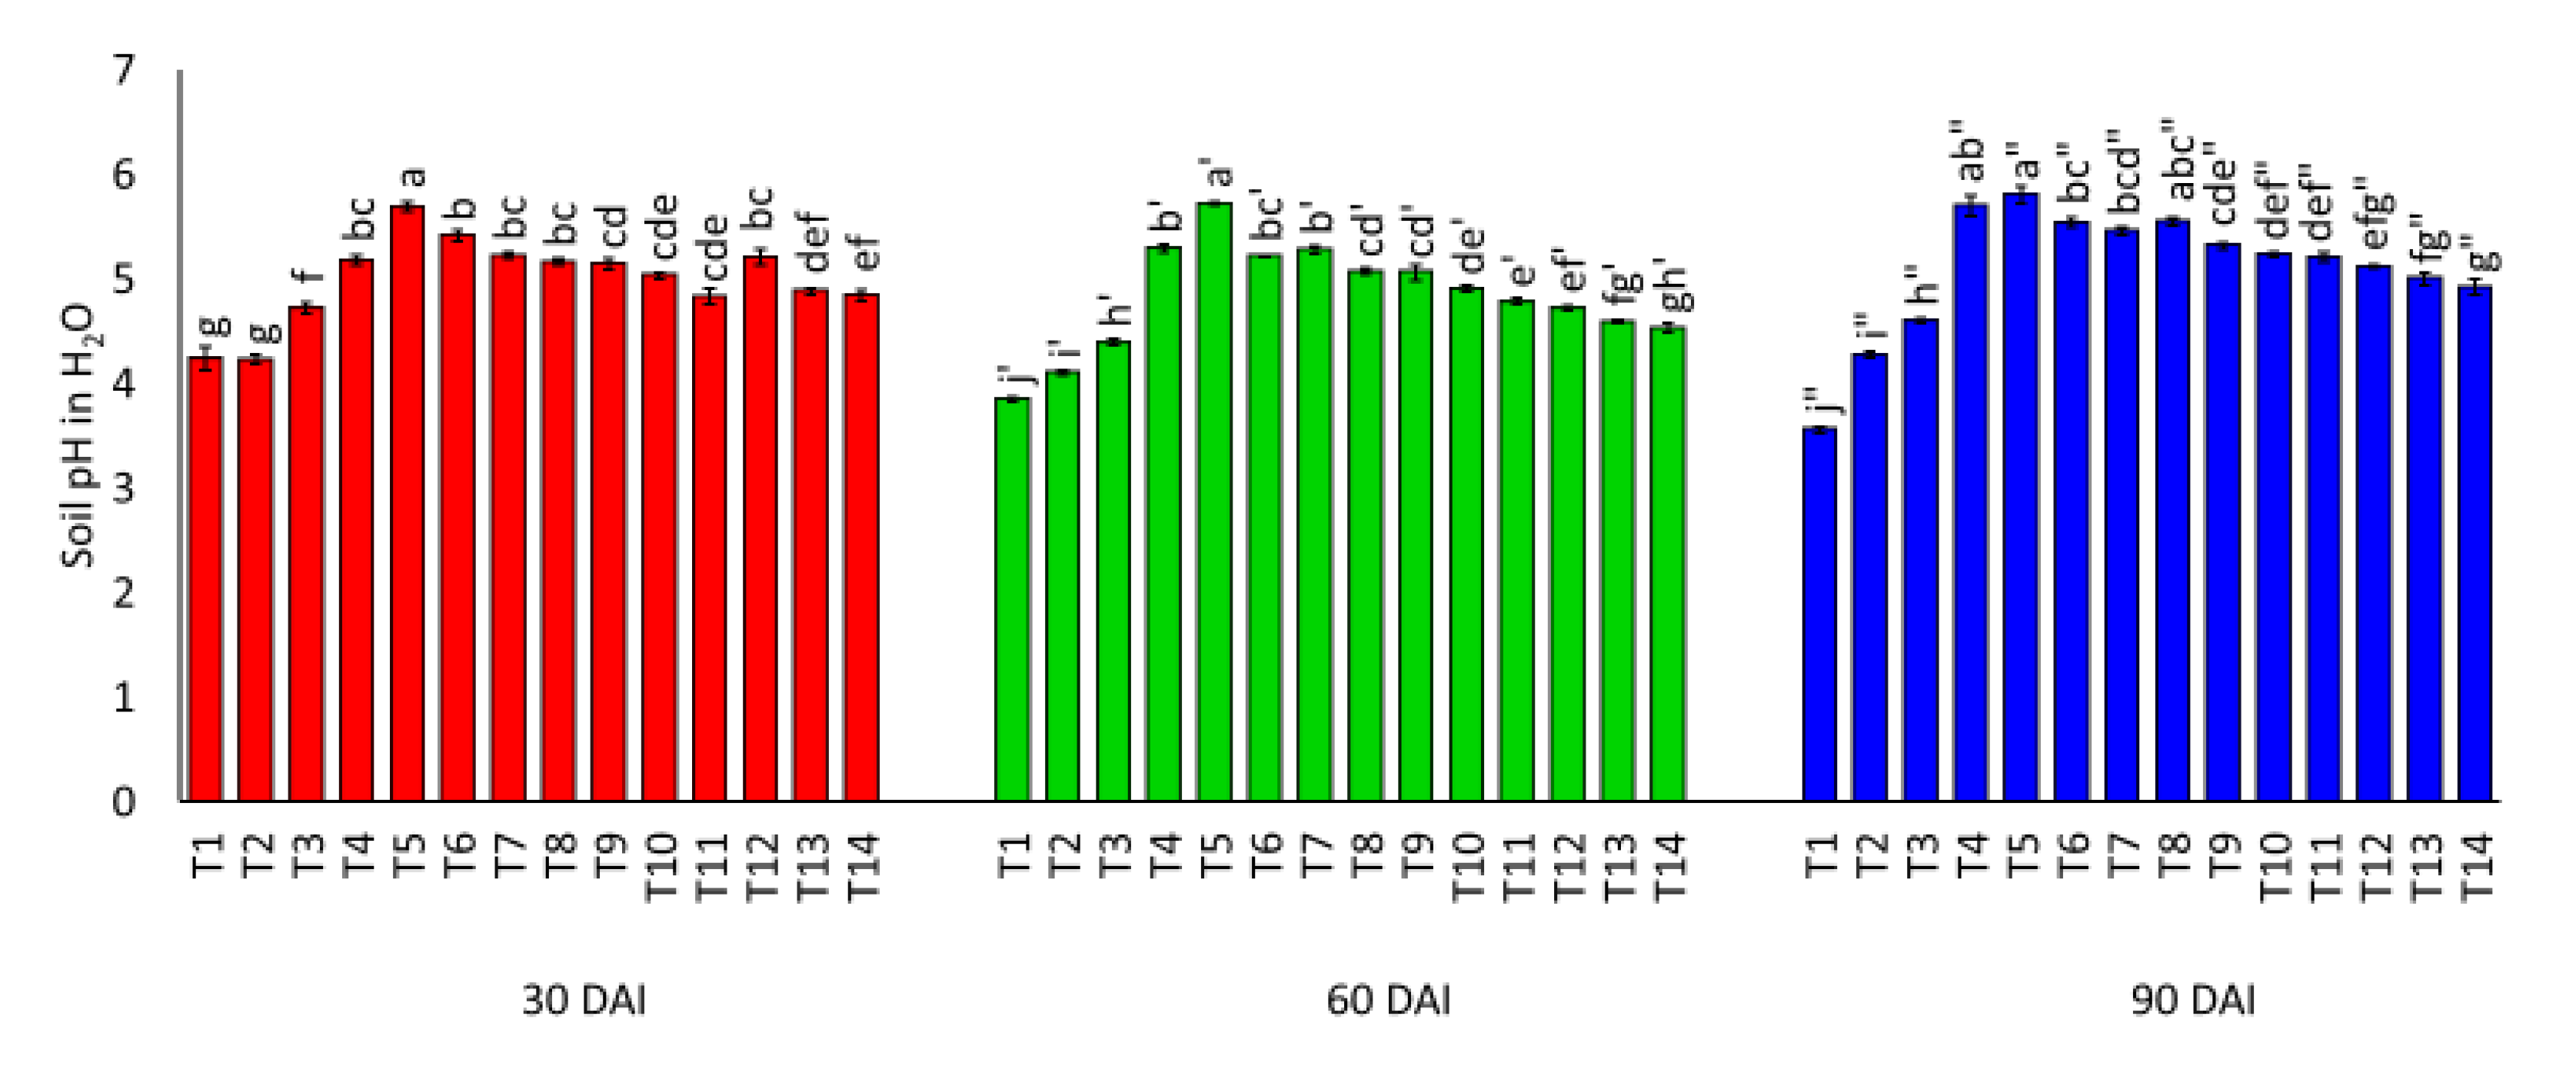
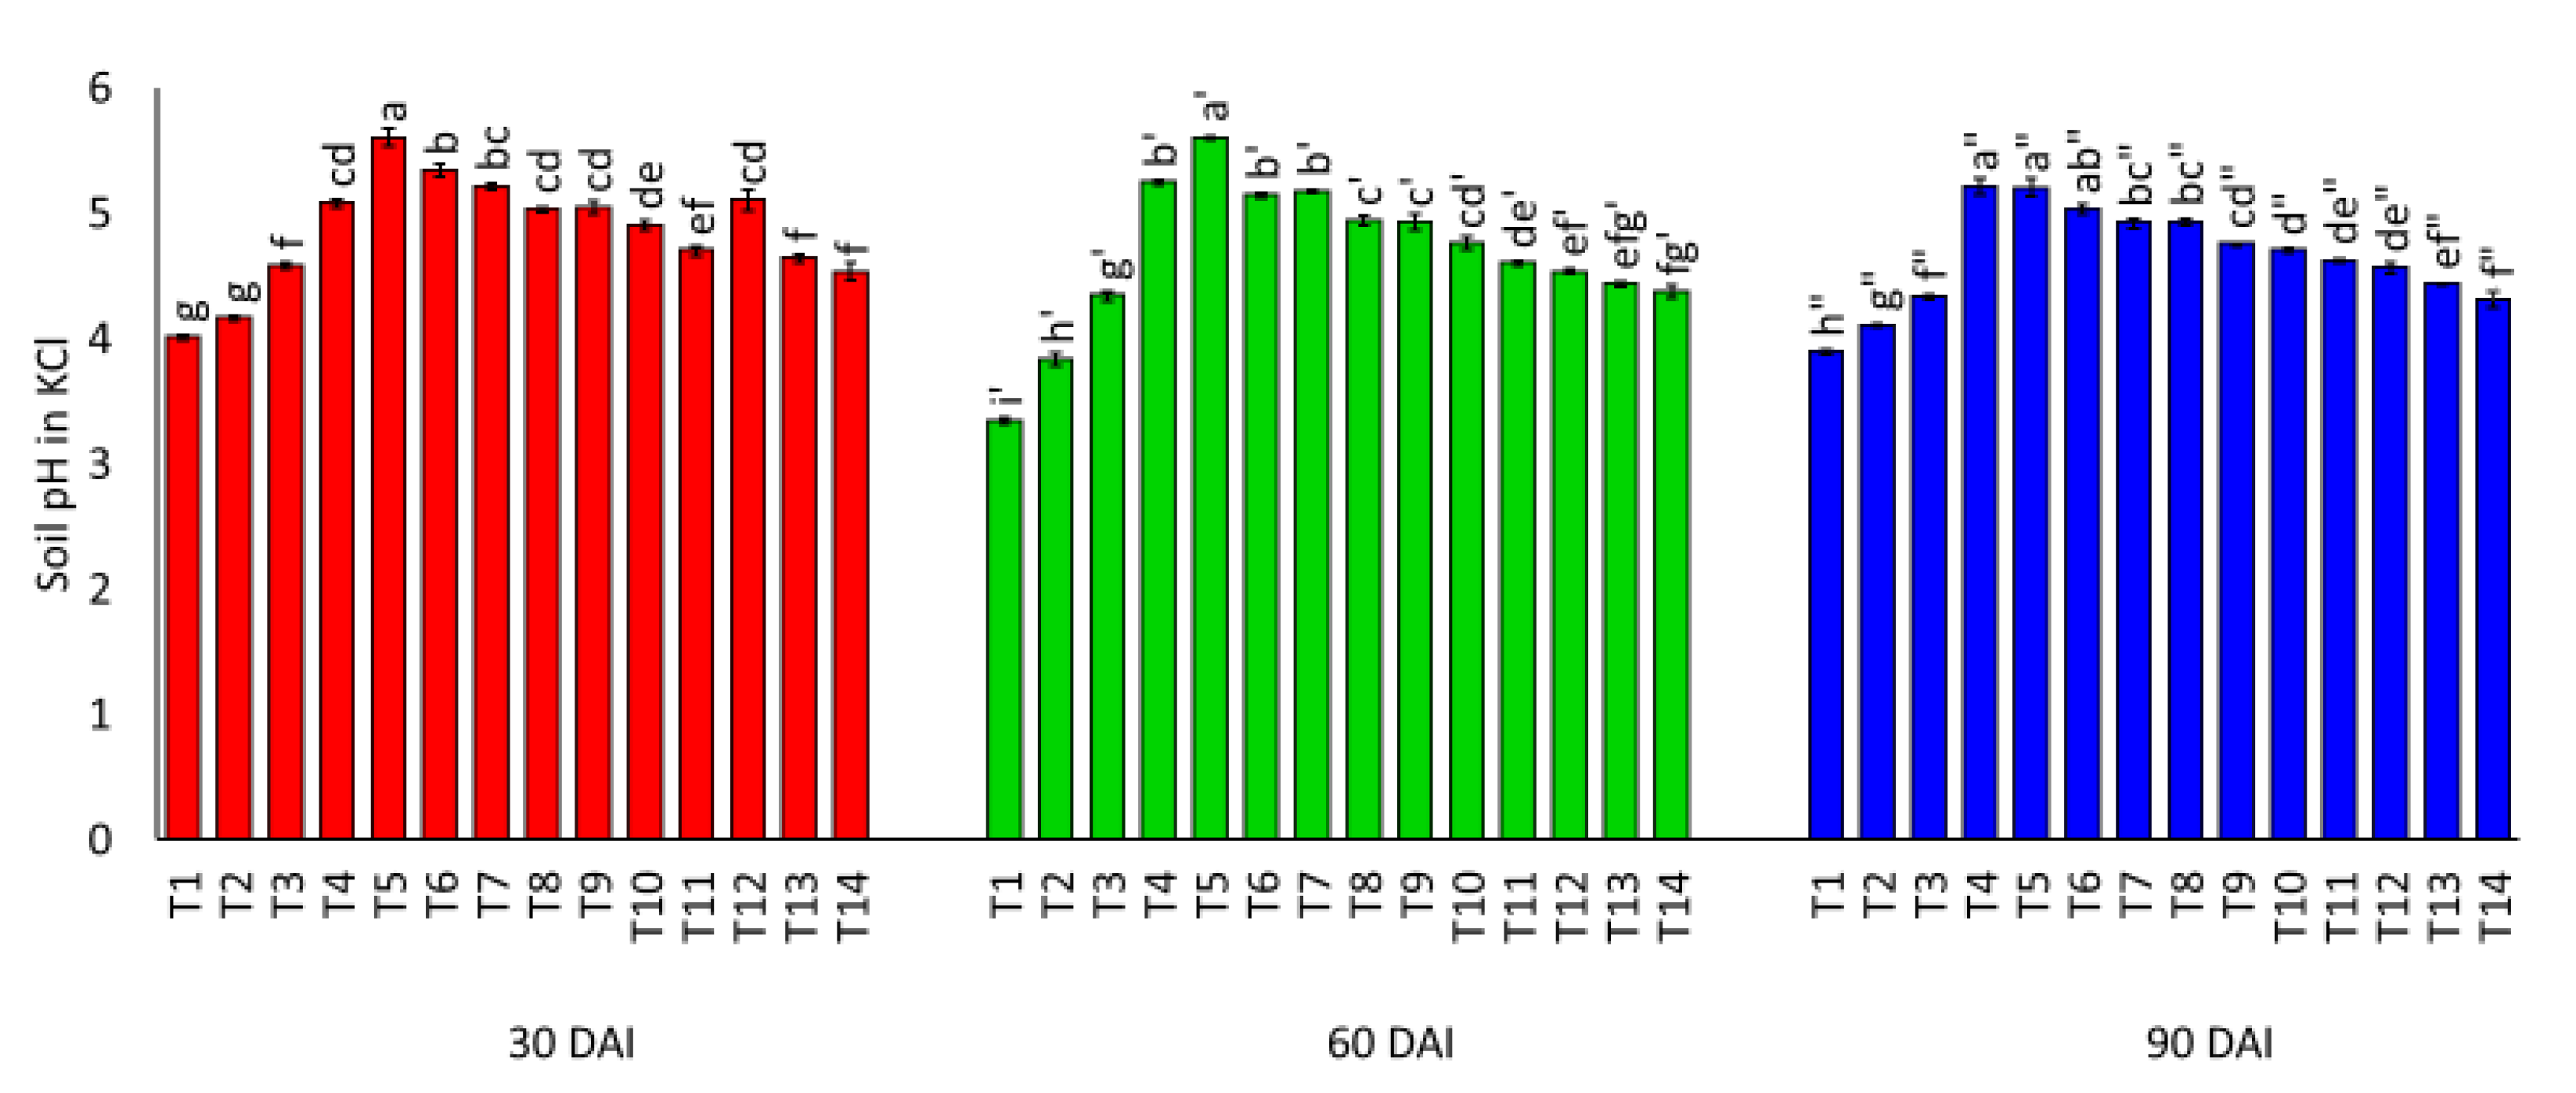
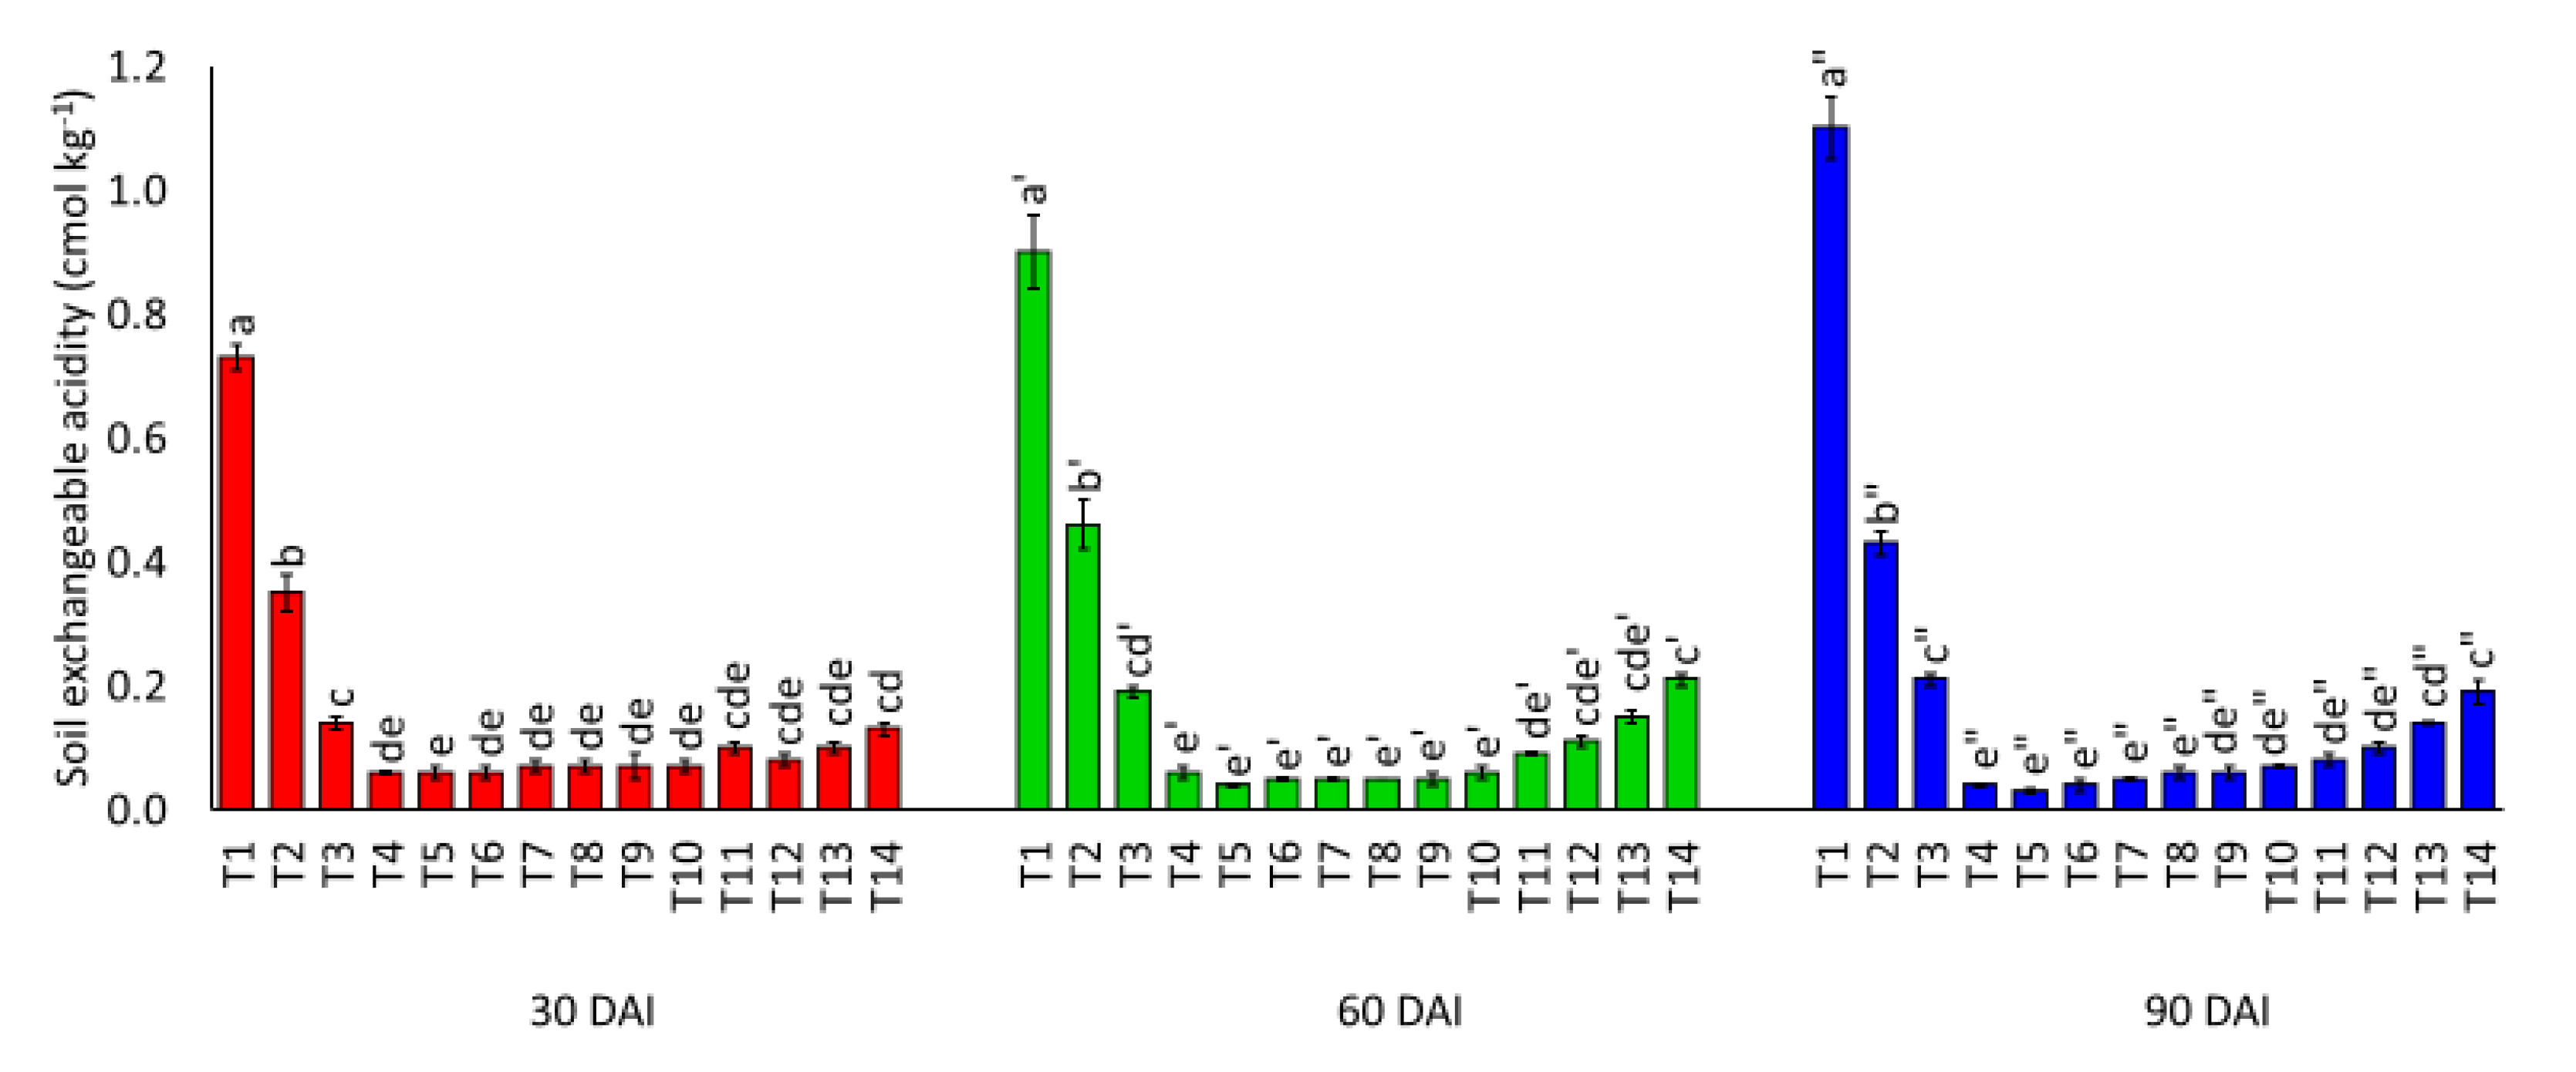
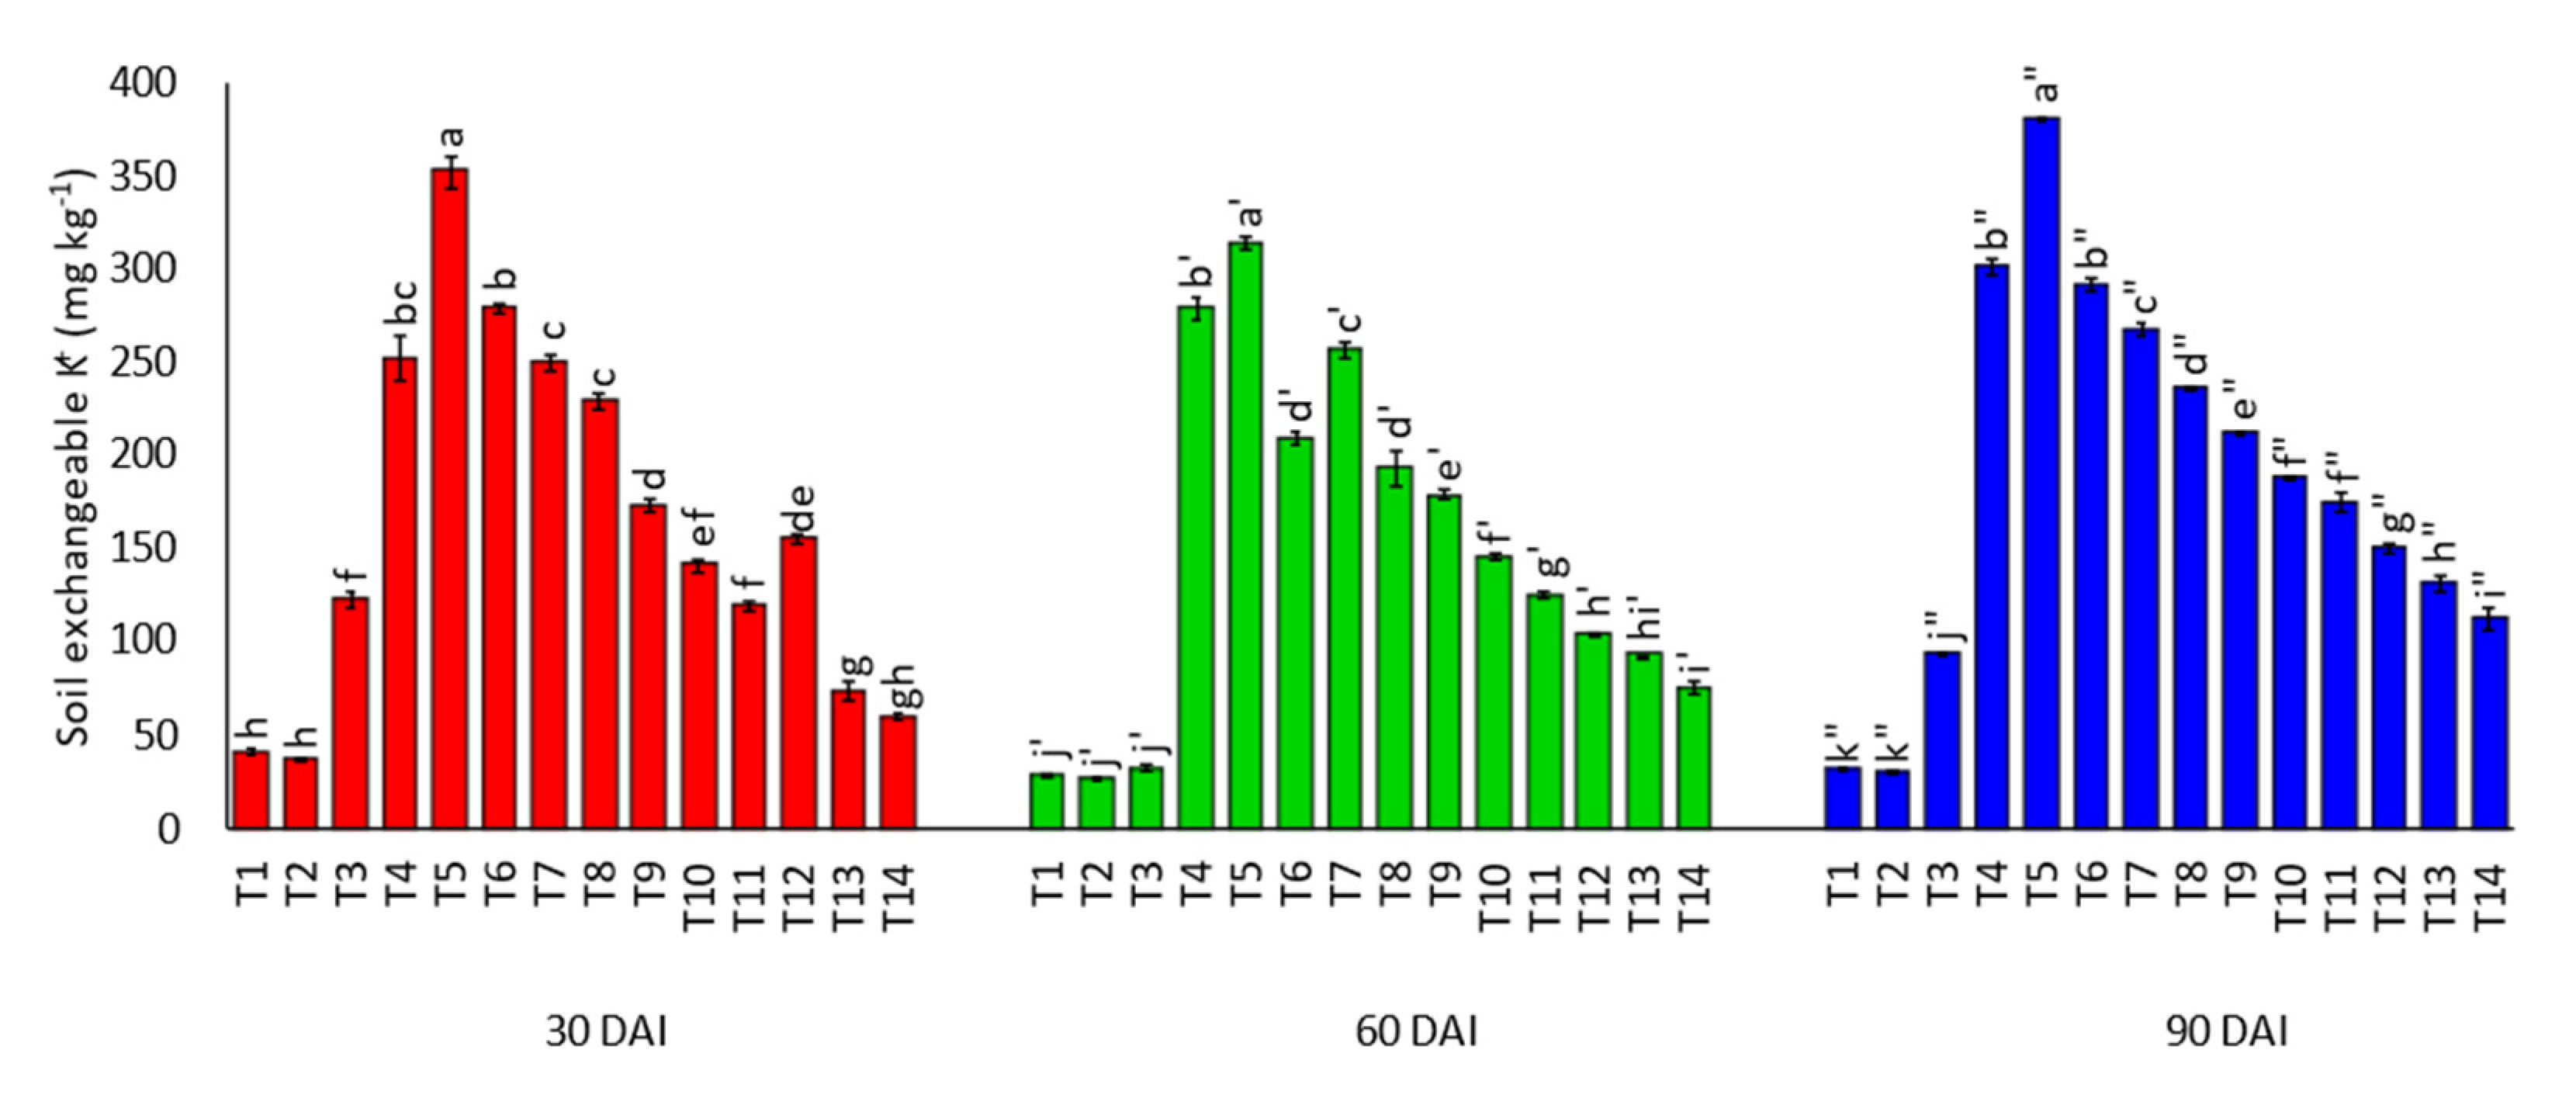
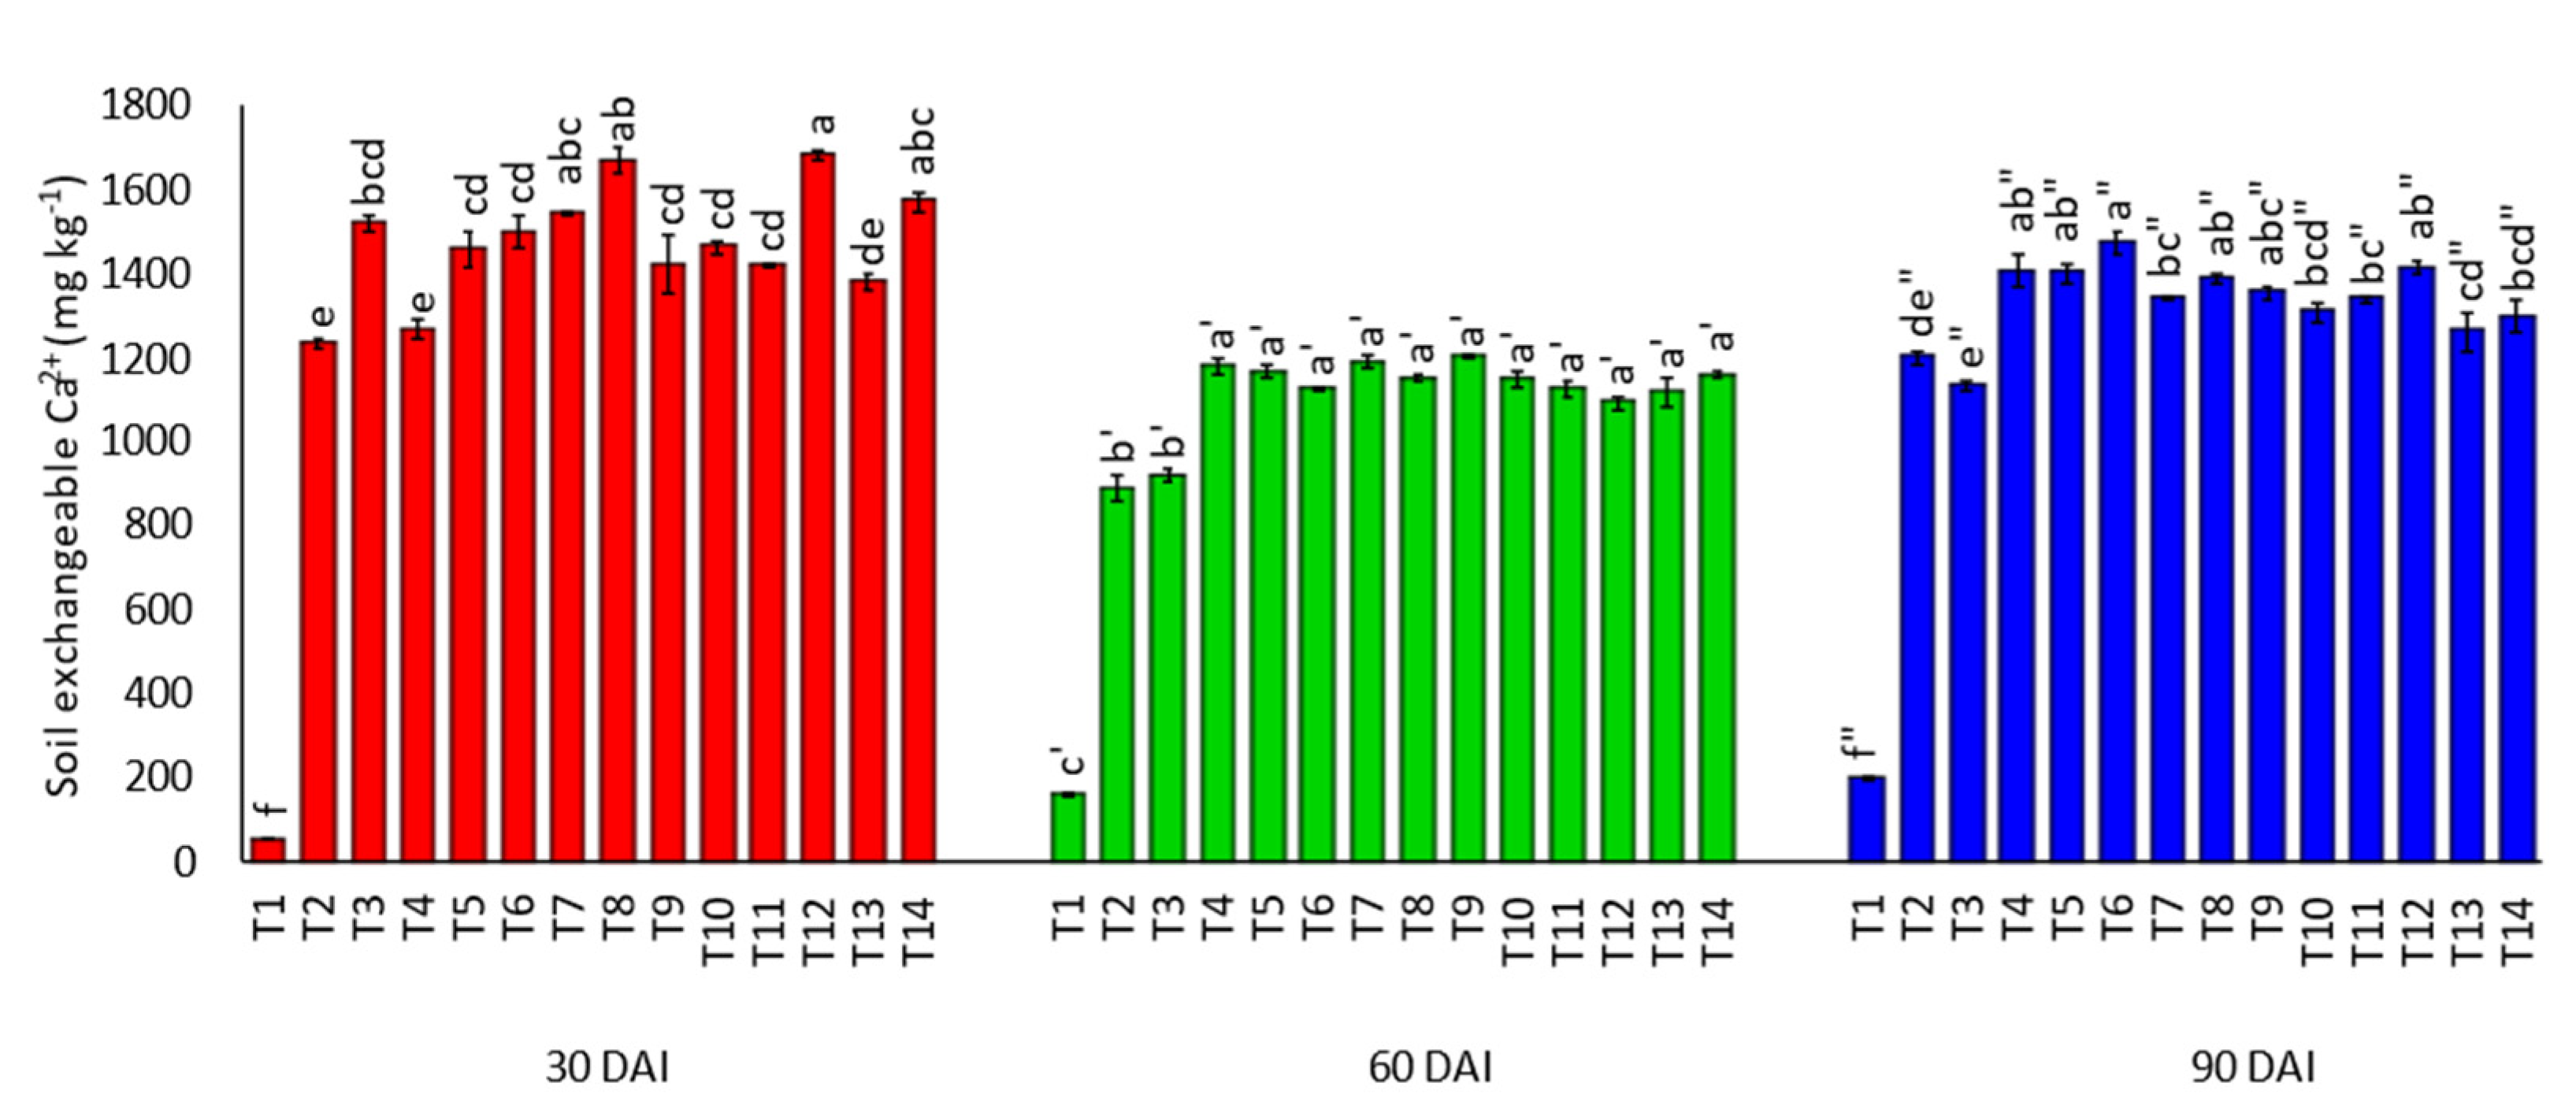
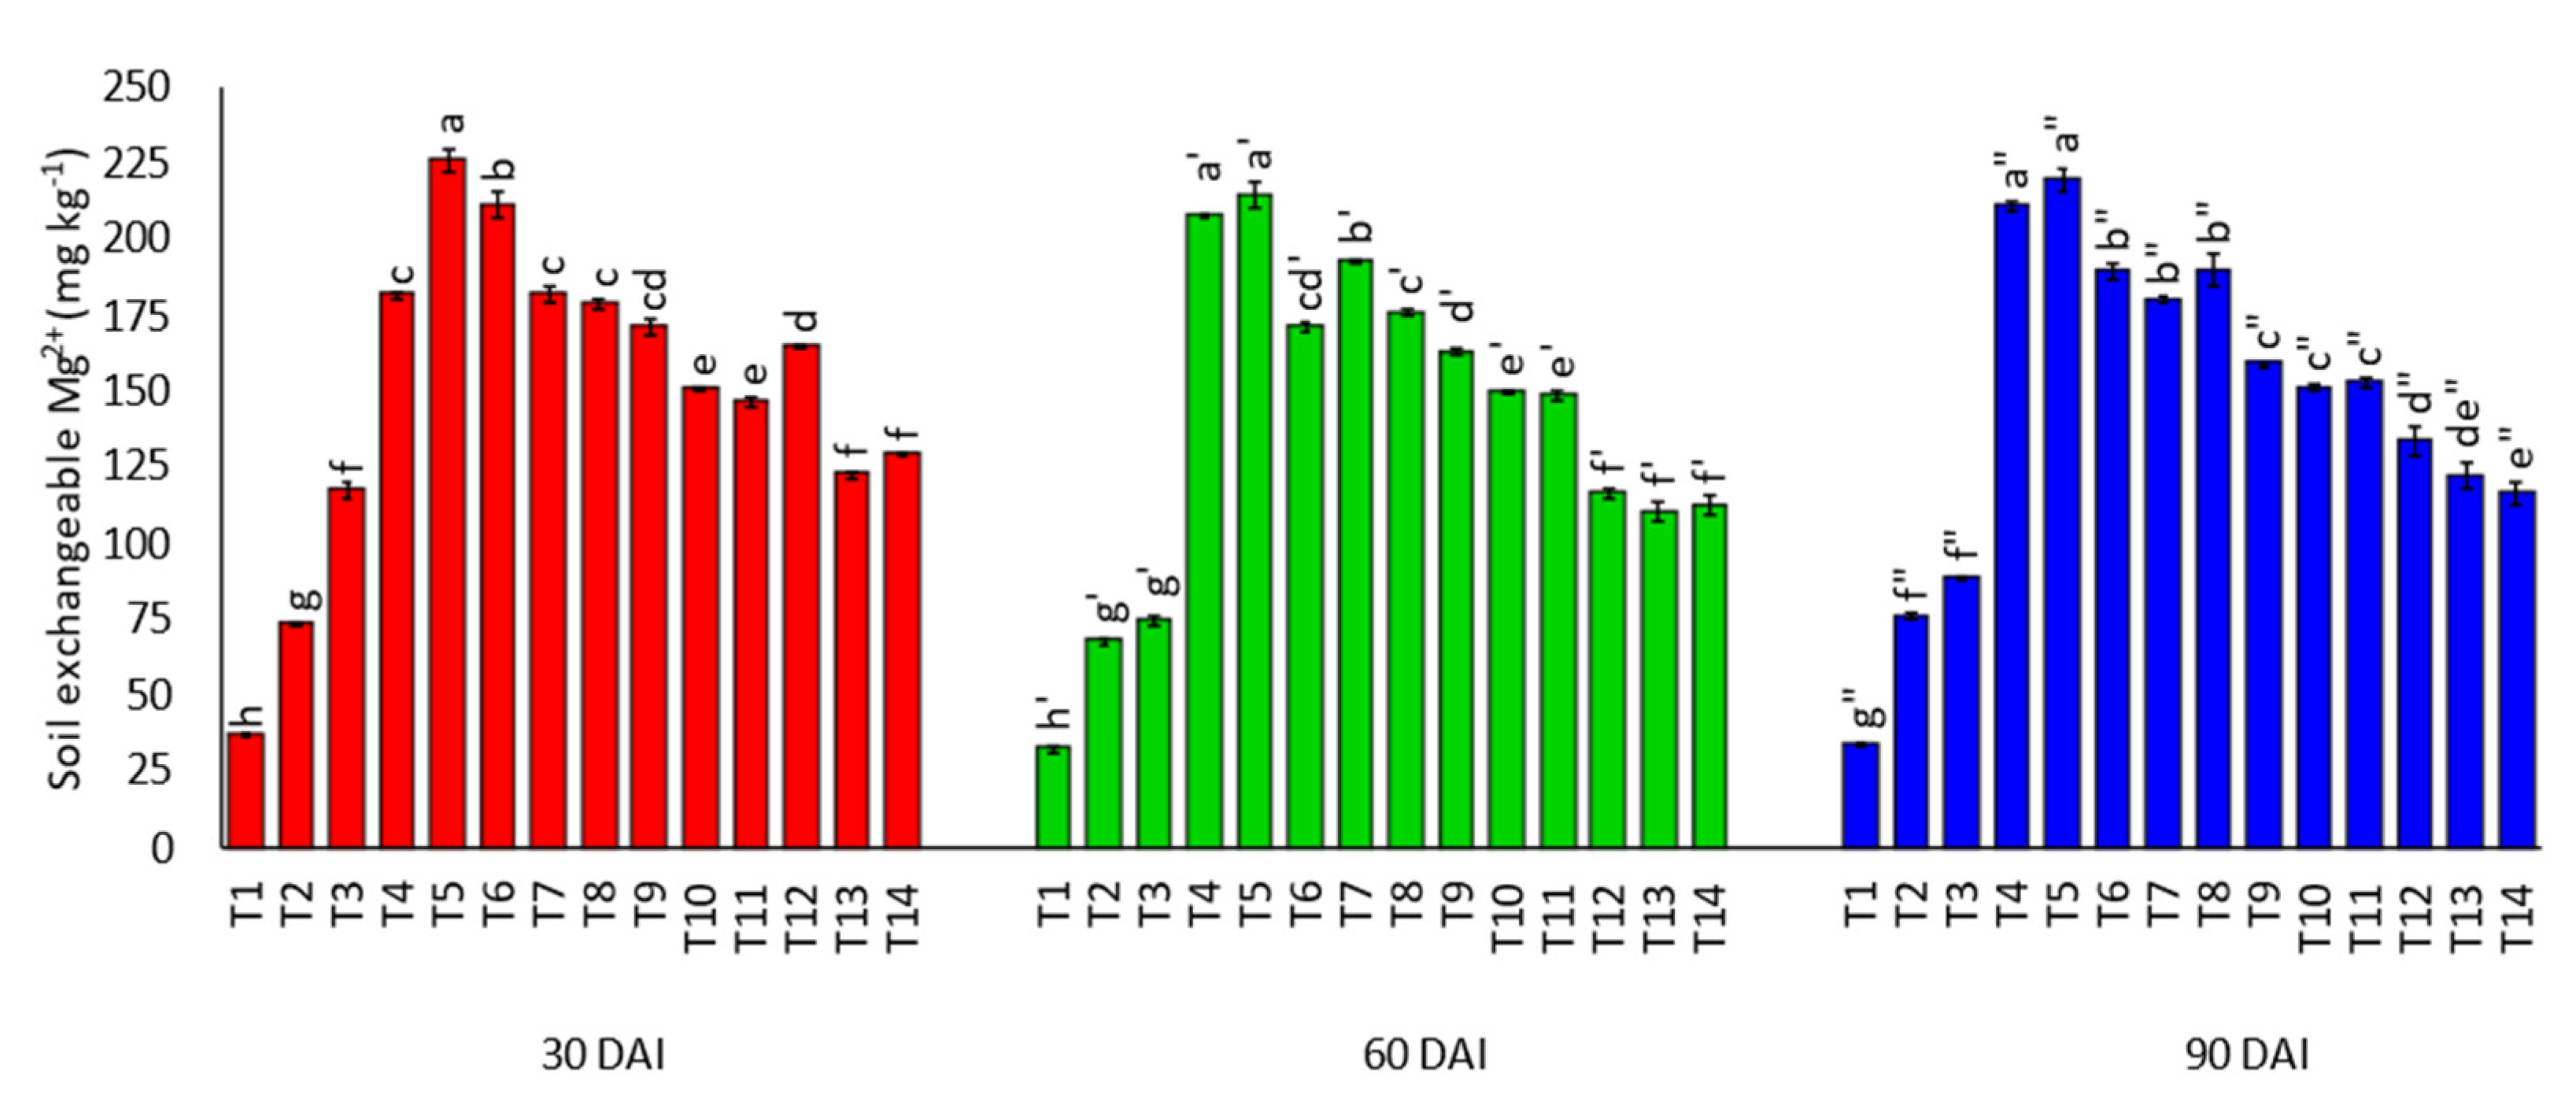
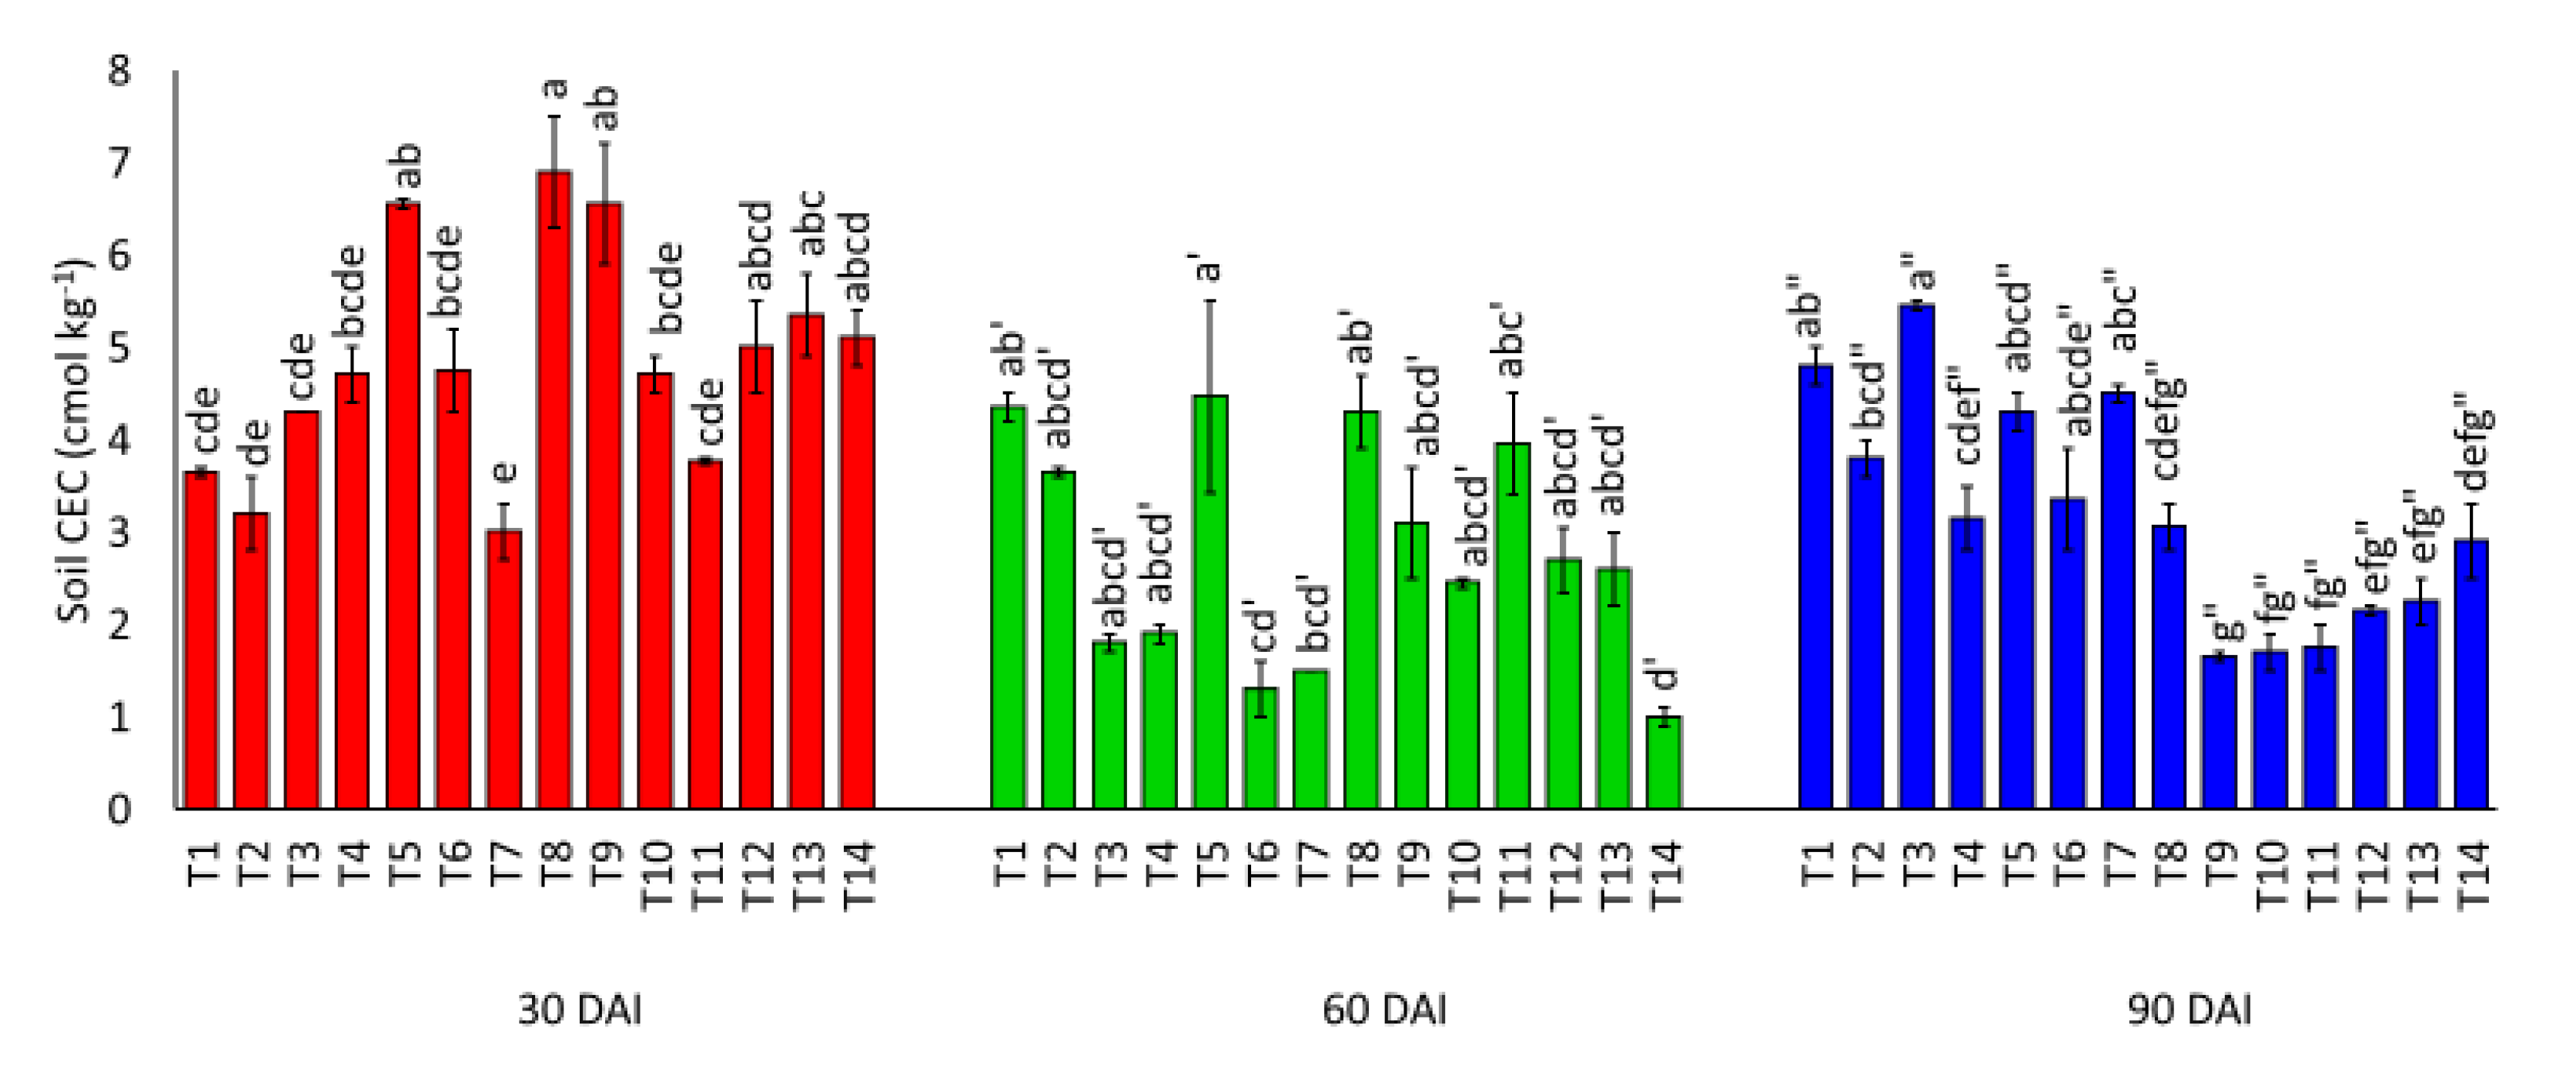
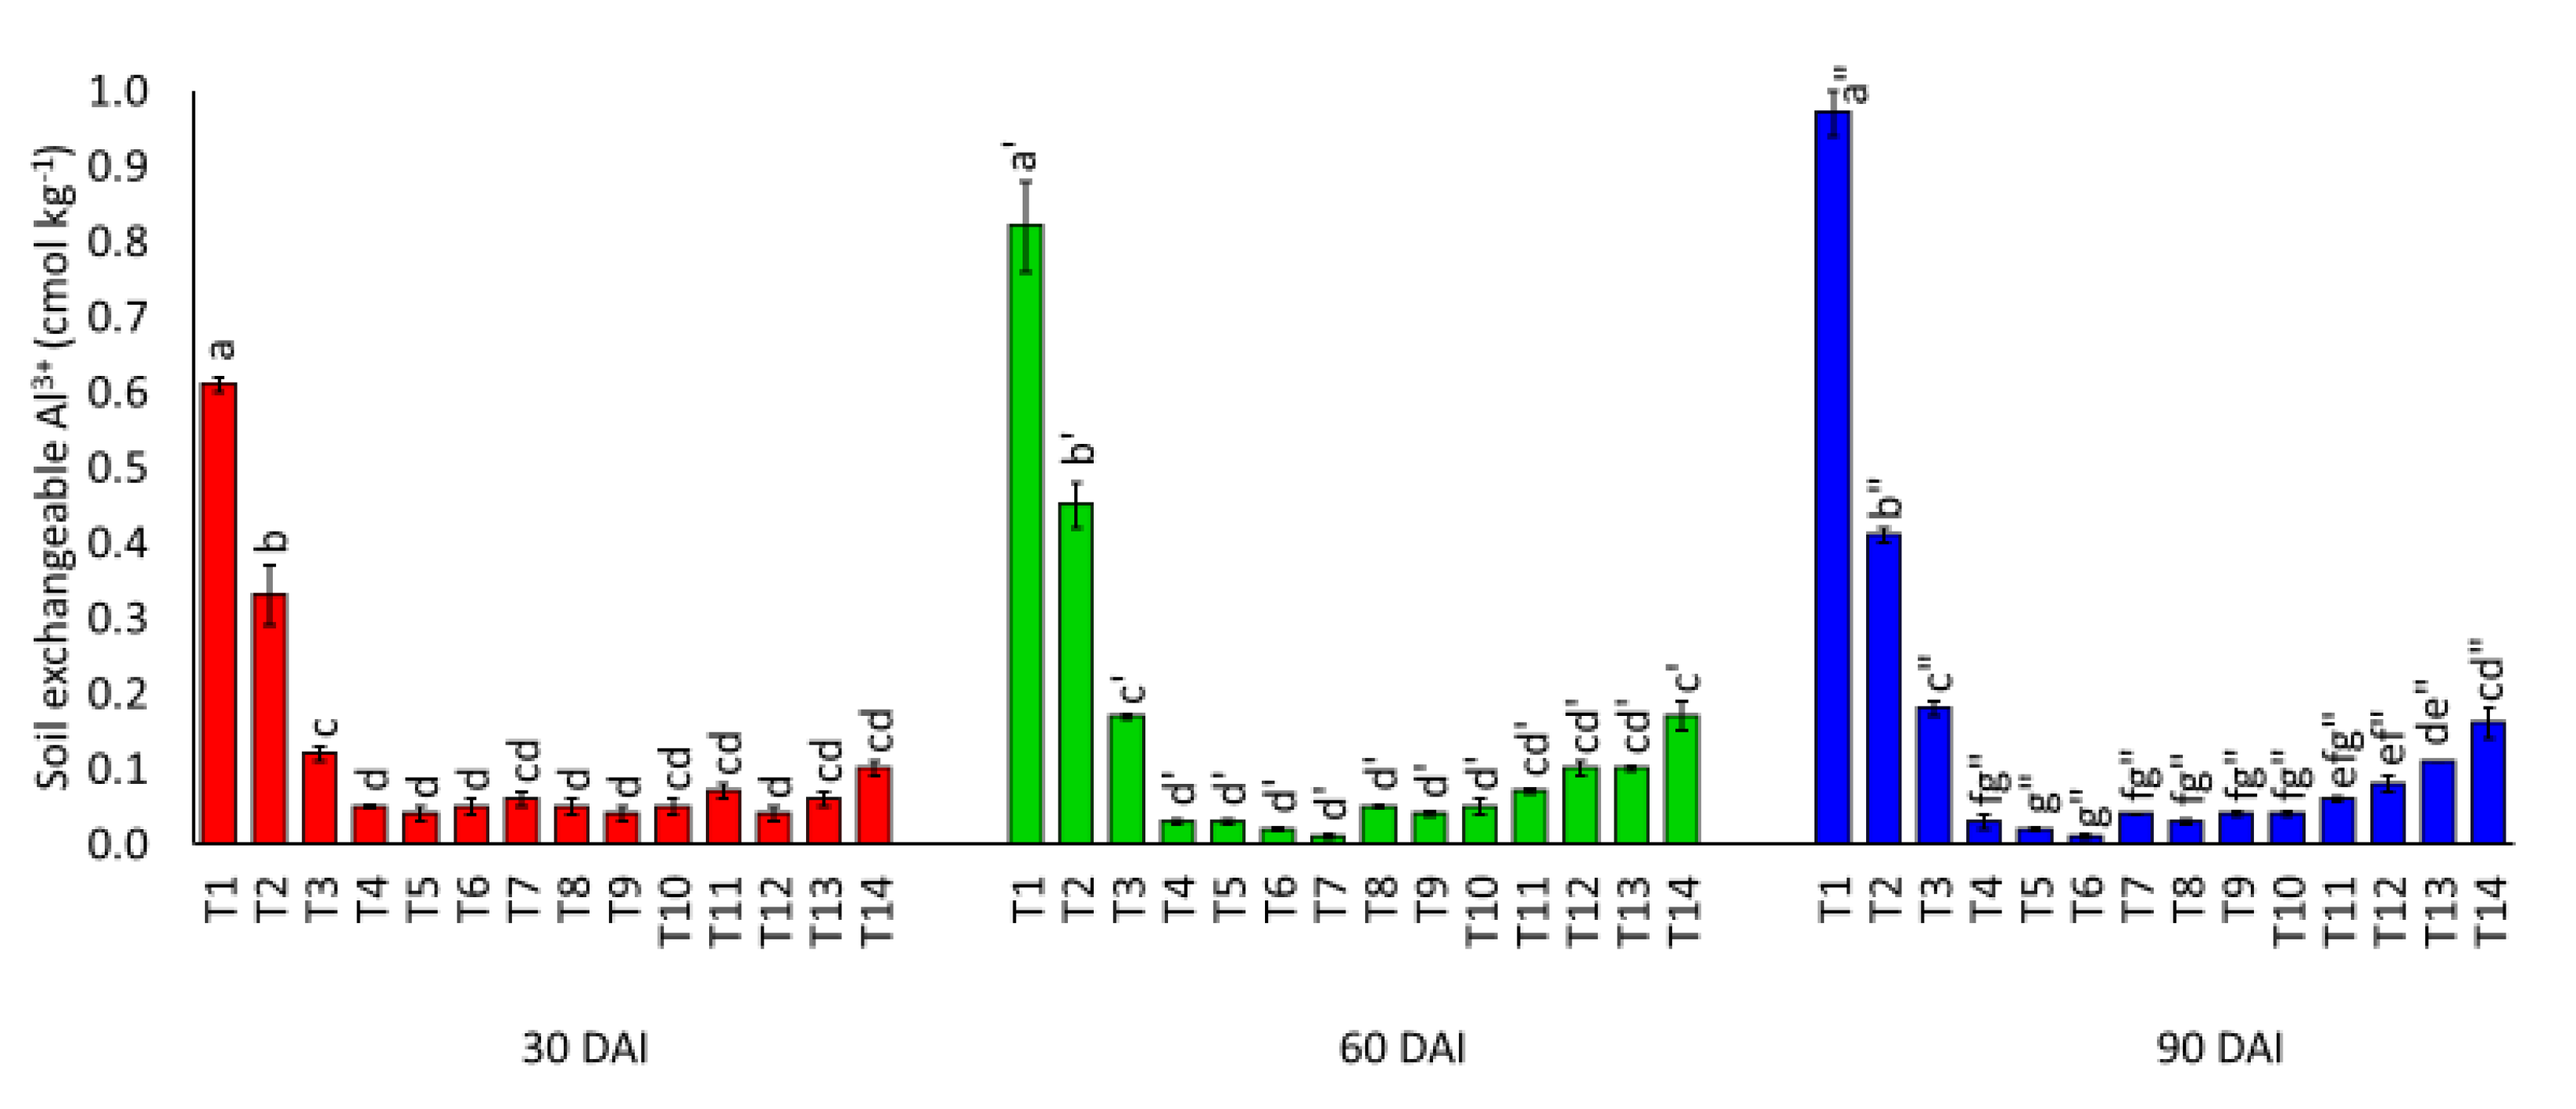
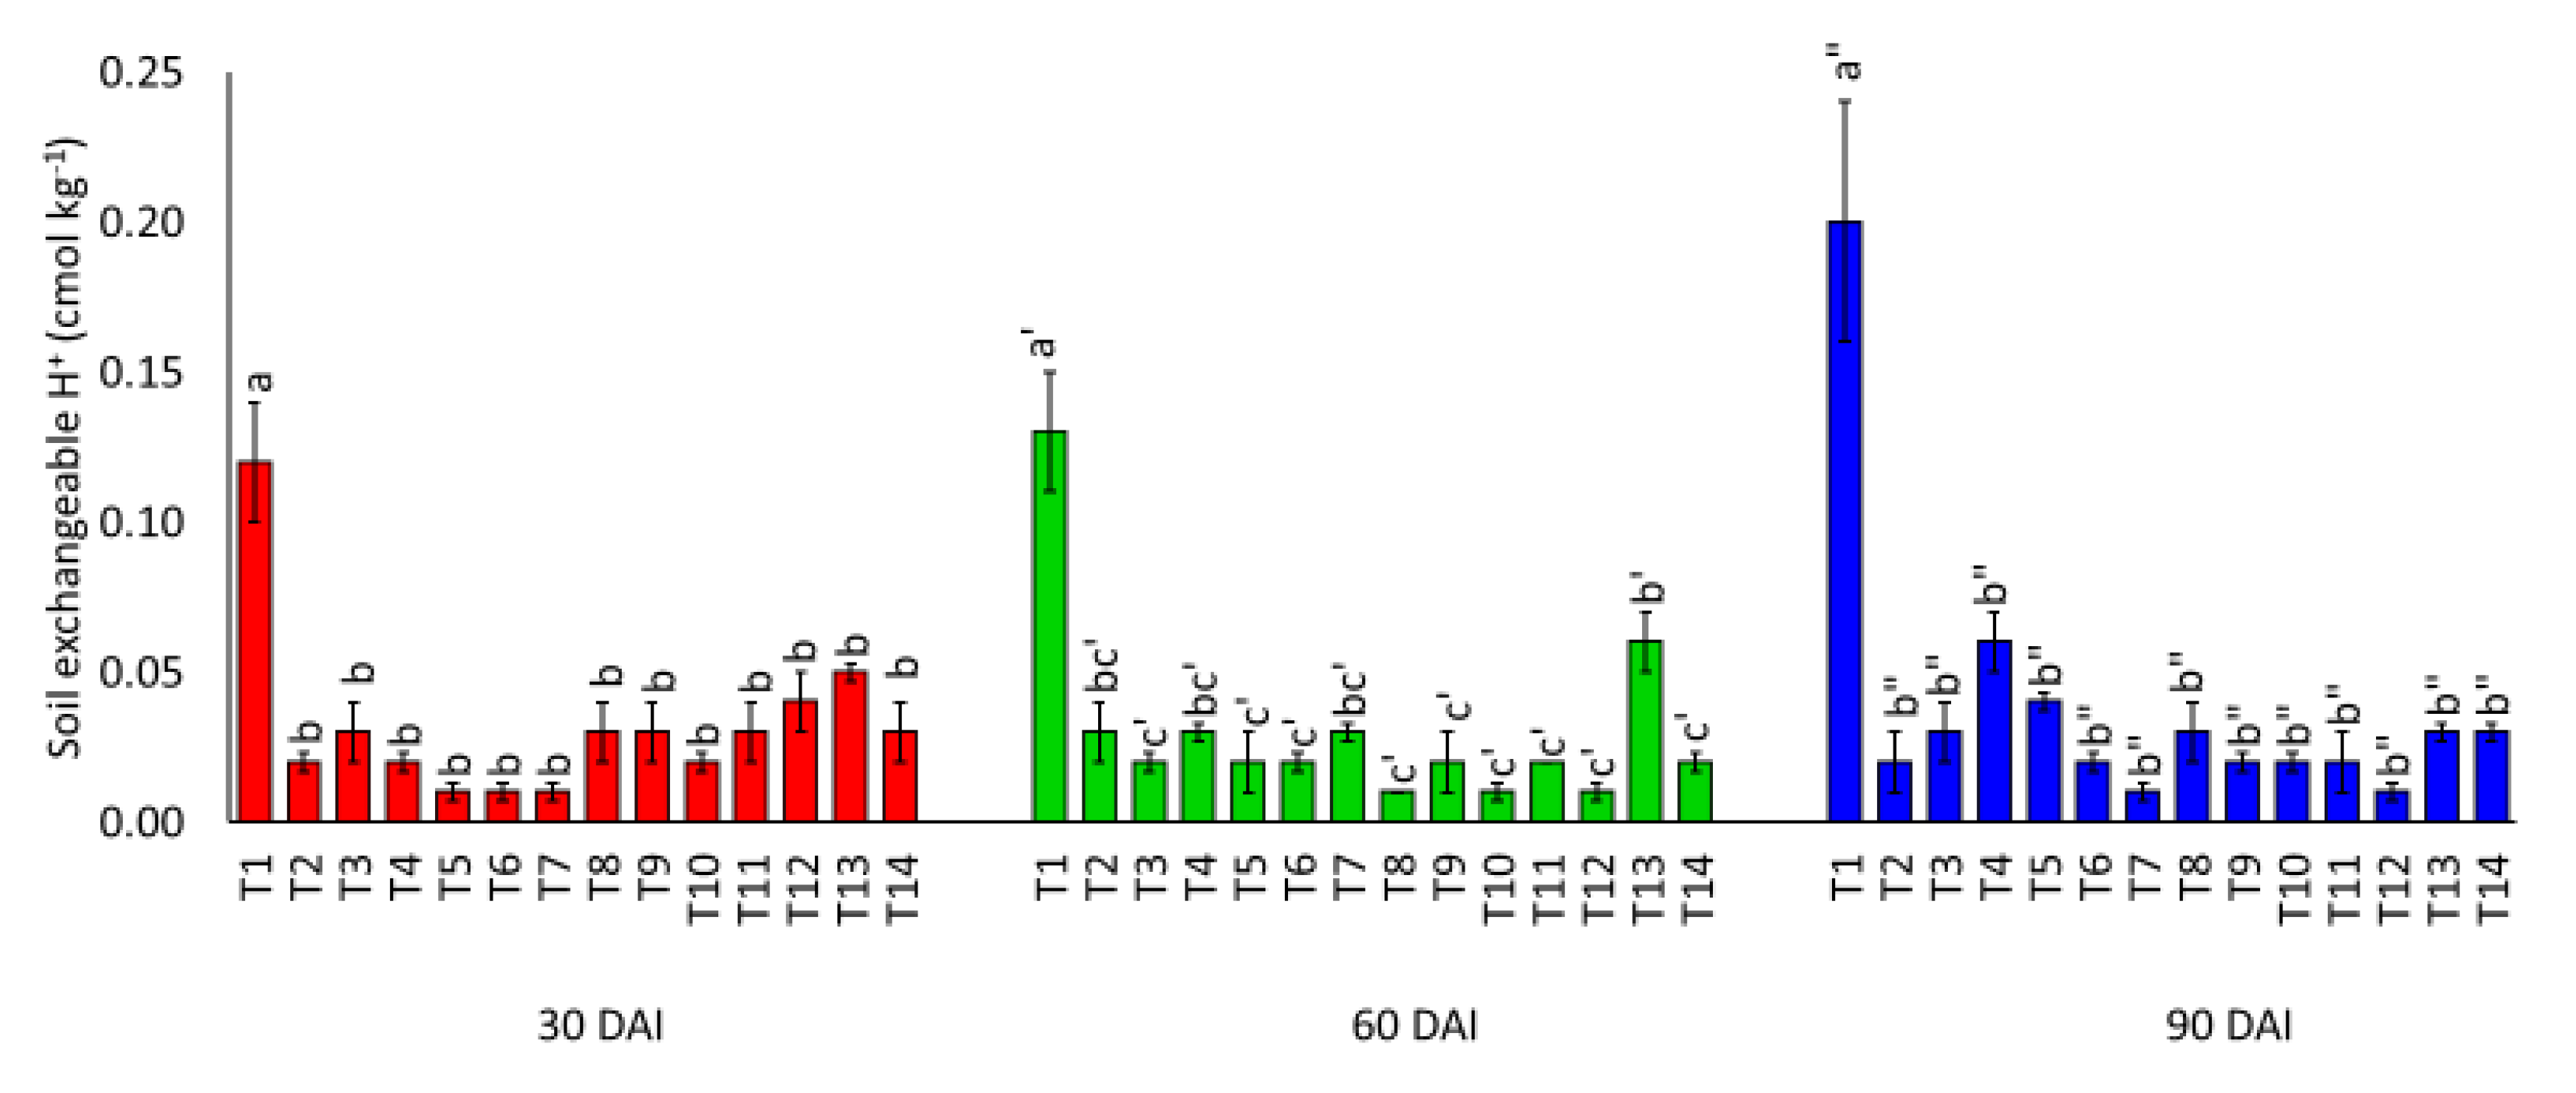
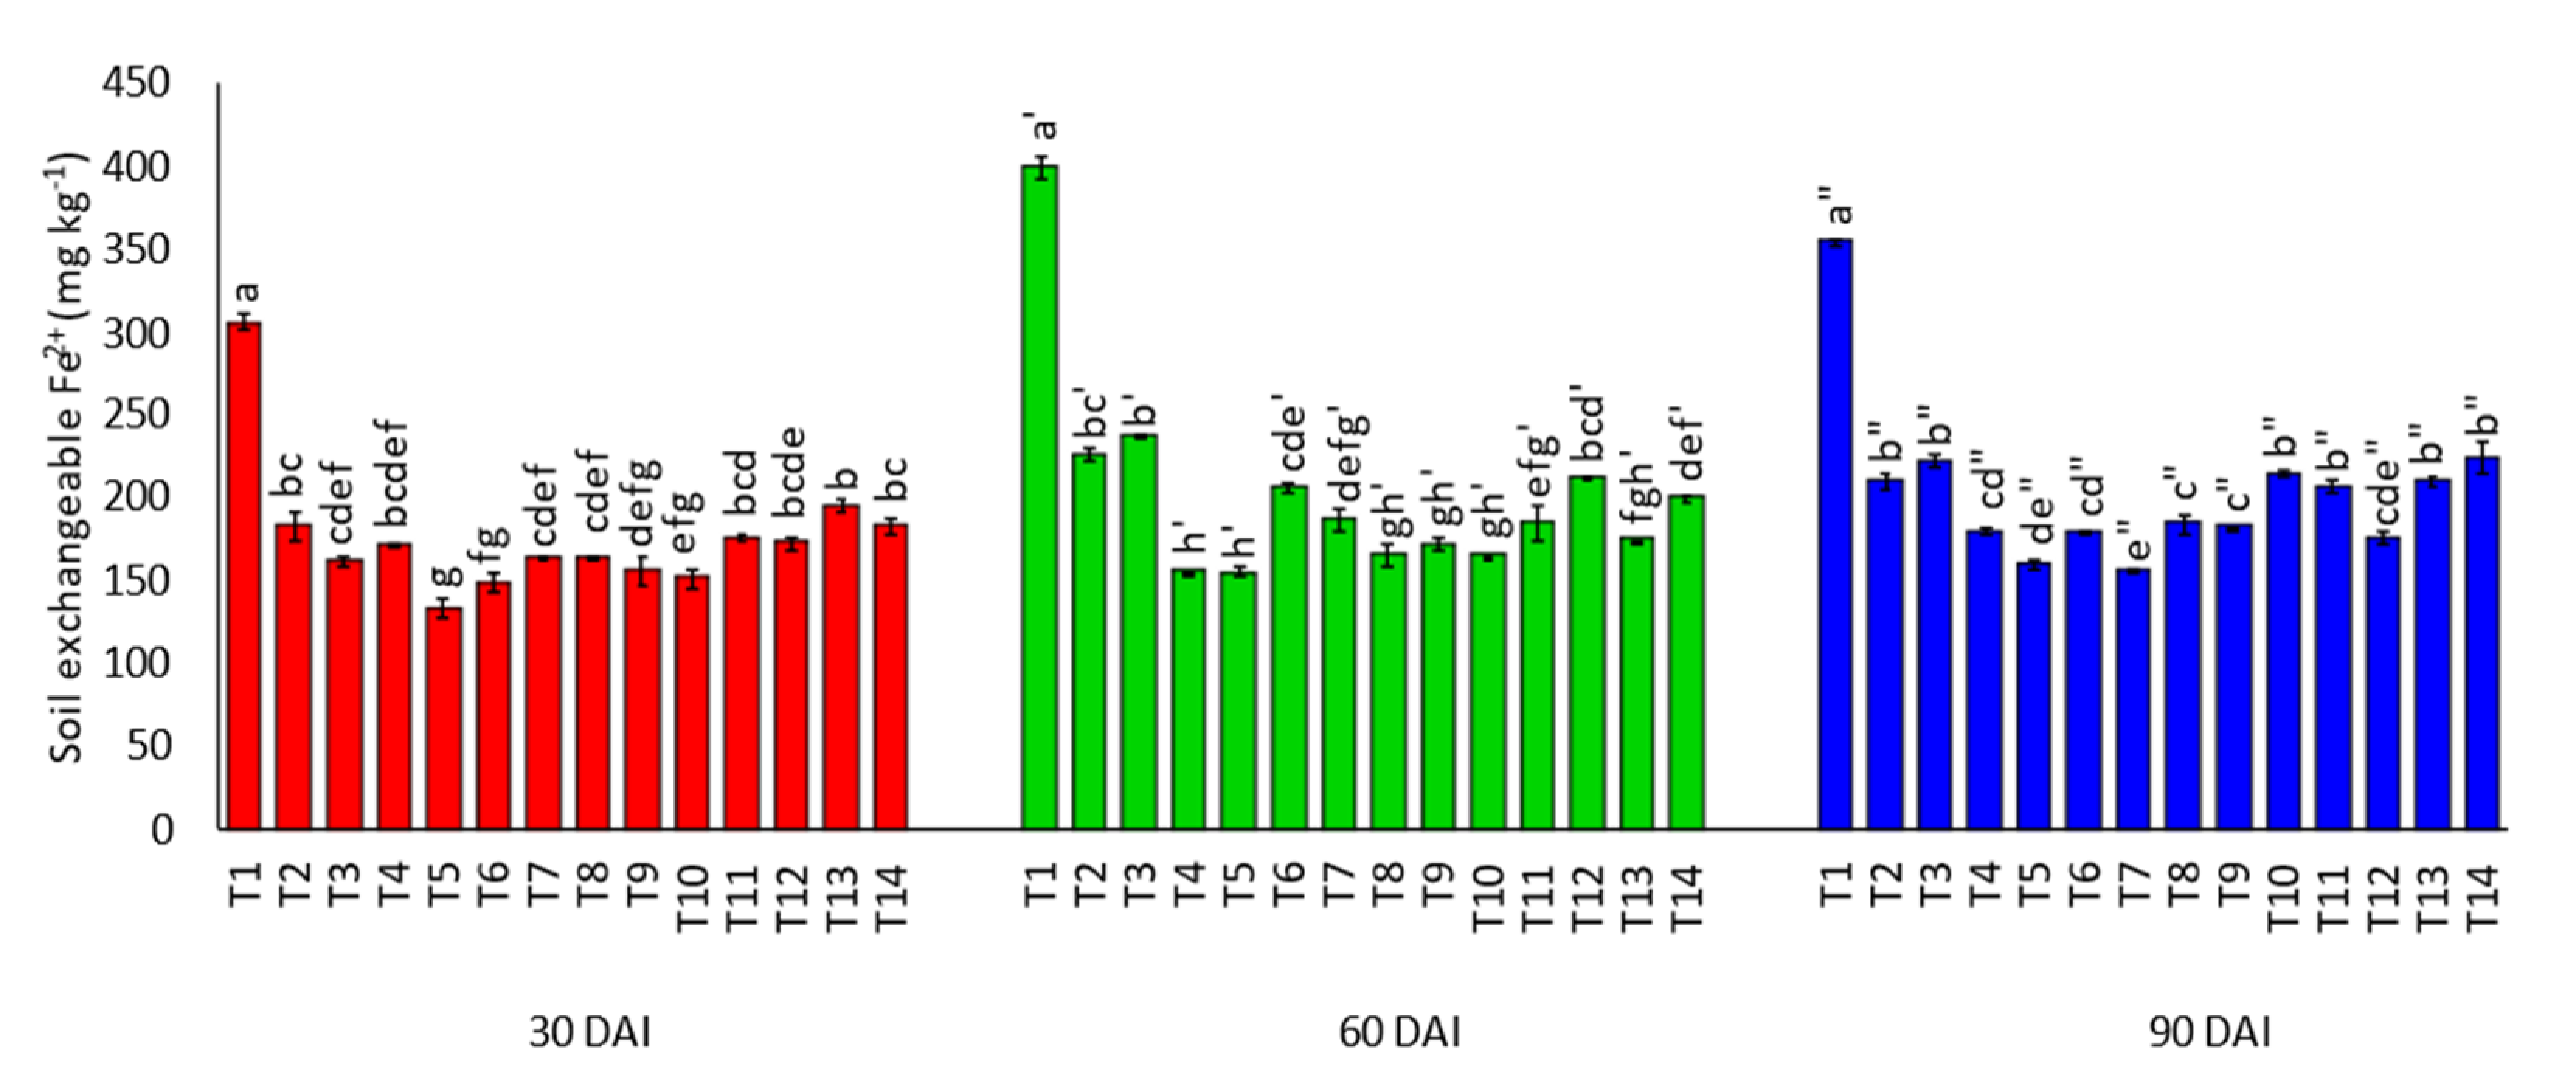
3.1. Effects of Amending Egypt Rock Phosphate with Charcoal and Sago Bark Ash on Selected Soil Chemical Properties

The effects of treatments on soil total carbon (TC) at 30, 60, and 90 days of incubation (DAI) are presented in Figure 2. There was no significant difference in TC for T1 and T2, regardless of incubation period. The treatment with the sago bark ash alone (T4) demonstrated lower contribution towards TC. At 30 DAI, the effects of T3, T5, and T12 on TC were similar but significantly higher than those of T1, T2, T4, T6, T7, T8, T9, T10, T11, T13, and T14. Although T5 had higher content of TC, the effect was not significantly different compared to T9 at 60 DAI and T3 and T12 at 90 DAI. Throughout the incubation study, the TC of the treatments with 25% charcoal (T8, T11, and T14) was, similar irrespective of the amount of sago bark ash used.
Figure 3 and Figure 4 suggest that the treatments without soil amendments (T1 and T2) had significantly lower pH compared with the treatments with the soil amendments (T3, T4, T5, T6, T7, T8, T9, 10, T11, T12, T13, and T14). At 30 and 60 DAI, the soil pH for T5 was significantly higher than other treatments with charcoal and sago bark ash. At 90 DAI, the effect of the treatment with sago bark ash alone (T4) on soil pH was not significantly different compared to the treatments with the combined use of charcoal and sago bark ash at 100% (T5) and the combination of charcoal and sago bark ash at 75% (T6). Among the treatments with the soil amendments, the treatment with charcoal alone (T3) had lower soil pH, regardless of incubation period.
The interaction between the time of incubation and treatment significantly affected soil exchangeable acidity (Figure 5). Among the treatments, T1 recorded the highest soil exchangeable acidity followed by T2. Soil exchangeable acidity increased as the amount of sago bark was reduced from 100% to 75%, 50%, and 25%. Throughout the incubation study, the effect of the treatment with charcoal alone at the rate of 100% (T3) on soil exchangeable acidity was not significantly different compared to treatment with the combination of charcoal at 75%, 50%, and 25% and sago bark ash at 25% (T12, T13, and T14). A similar trend was also found in soil exchangeable Al3+ (Figure 6). Soil exchangeable Al3+ of soil alone (T1) and ERP alone (T2) were significantly higher than those with charcoal and sago bark ash. Between T1 and T2, T2 demonstrated significantly lower soil exchangeable Al3+. Regardless of the incubation period, soil exchangeable Al3+ for the treatment with sago bark ash alone (T4) was not significantly different compared to the treatments with charcoal and sago bark ash.
The effects of treatments on soil exchangeable H+ are demonstrated in Figure 7. Soil exchangeable H+ for T1 was significantly higher than those of T2, T3, T4, T5, T6, T7, T8, T9, T10, T11, T12, T13, and T14 at 30, 60, and 90 DAI. In addition, soil exchangeable H+ of T1 increased with time. There was no significant difference in soil exchangeable H+ for the soil with ERP, charcoal, and sago bark ash, irrespective of incubation time.
Among the treatments, T1 had the highest soil exchangeable Fe2+ at 30, 60, and 90 DAI (Figure 8). Upon application of charcoal and sago bark ash, soil exchangeable Fe2+ reduced. There was no significant difference in soil exchangeable Fe2+ between T2 and T3, irrespective of incubation time.
Figure 9 demonstrates that the application of charcoal and sago bark ash increased soil exchangeable K+. Treatment five had significantly higher soil exchangeable K+ compared with other treatments which were amended with charcoal and sago bark ash. The effects of the treatment with sago bark alone (T4) on soil exchangeable K+ was similar to those of T6, T7, and T8 at 30 DAI and T6 at 90 DAI. At 60 and 90 DAI, soil exchangeable K+ decreased as the rate of sago bark ash reduced from 75% to 50% and 25%. The treatment with charcoal alone (T3) showed a low contribution towards soil exchangeable K+.
Exchangeable Ca2+ increased when charcoal and sago bark ash were applied to the soil (Figure 10). Treatment one had the lowest soil exchangeable Ca2+. The effect of T2 on soil exchangeable Ca2+ was significantly higher compared with T1 although this treatment had no charcoal and sago bark ash. There was no significant difference in soil exchangeable Ca2+ of T2 and T3 at 60 and 90 DAI. Among the treatments with the soil amendments, the soil exchangeable Ca2+ values of T8 and T12 were higher than those of T4, T5, T6, T9, T10, T11, and T13 at 30 DAI and T13 at 90 DAI. However, at 60 DAI, the effects of the soil with charcoal and sago bark ash on exchangeable Ca2+ were similar.
Soil exchangeable Mg2+ of the treatments with ERP and soil amendments (T2, T3, T4, T5, T6, T7, T8, T9, T10, T11, T12, T13, and T14) were improved compared with the treatment without ERP and soil amendments (T1) (Figure 11). At 30 DAI, the effect of T2 on soil exchangeable Mg2+ was similar to those of T13 and T14. There was no significant difference in soil exchangeable Mg2+ between T2 and T3 at 60 and 90 DAI. Additionally, at 60 and 90 DAI, soil exchangeable Mg2+ contents increased significantly following the introduction of sago bark ash alone (T4) or combined application with charcoal (T5, T6, T7, T8, T9, T10, T11, T12, T13, and T14) compared with the treatment with charcoal alone (T3).
Throughout the incubation study, T1 showed the lowest soil exchangeable Na+ compared with other treatments (Figure 12). The effects of T2 and T3 on soil exchangeable Na+ were similar but significantly lower than those of T4, T5, T6, T7, T8, T9, T10, T11, T12, T13, and T14. There was no significant difference in soil exchangeable Na+ for the treatments with 25% sago bark ash (T12, T13, and T14), regardless of the rate of charcoal used and incubation period. Although soil exchangeable Na+ decreased when the rate of sago bark ash was reduced by 25%, with time, soil exchangeable Na+ increased.
The interaction between time of incubation and treatment significantly affected soil CEC (Figure 13). At 30 DAI, the soil CEC of T2 and T7 were similar but significantly lower compared with T5, T8, T9, and T13. Although T5 showed the highest soil CEC at 60 DAI, the effect was not significantly different compared to T1, T2, T3, T4, T8, T9, T10, T11, T12, and T13. At 90 DAI, soil CEC of T2 was significantly higher than those of T9, T10, T11, T12, and T13 but significantly lower compared with T3.

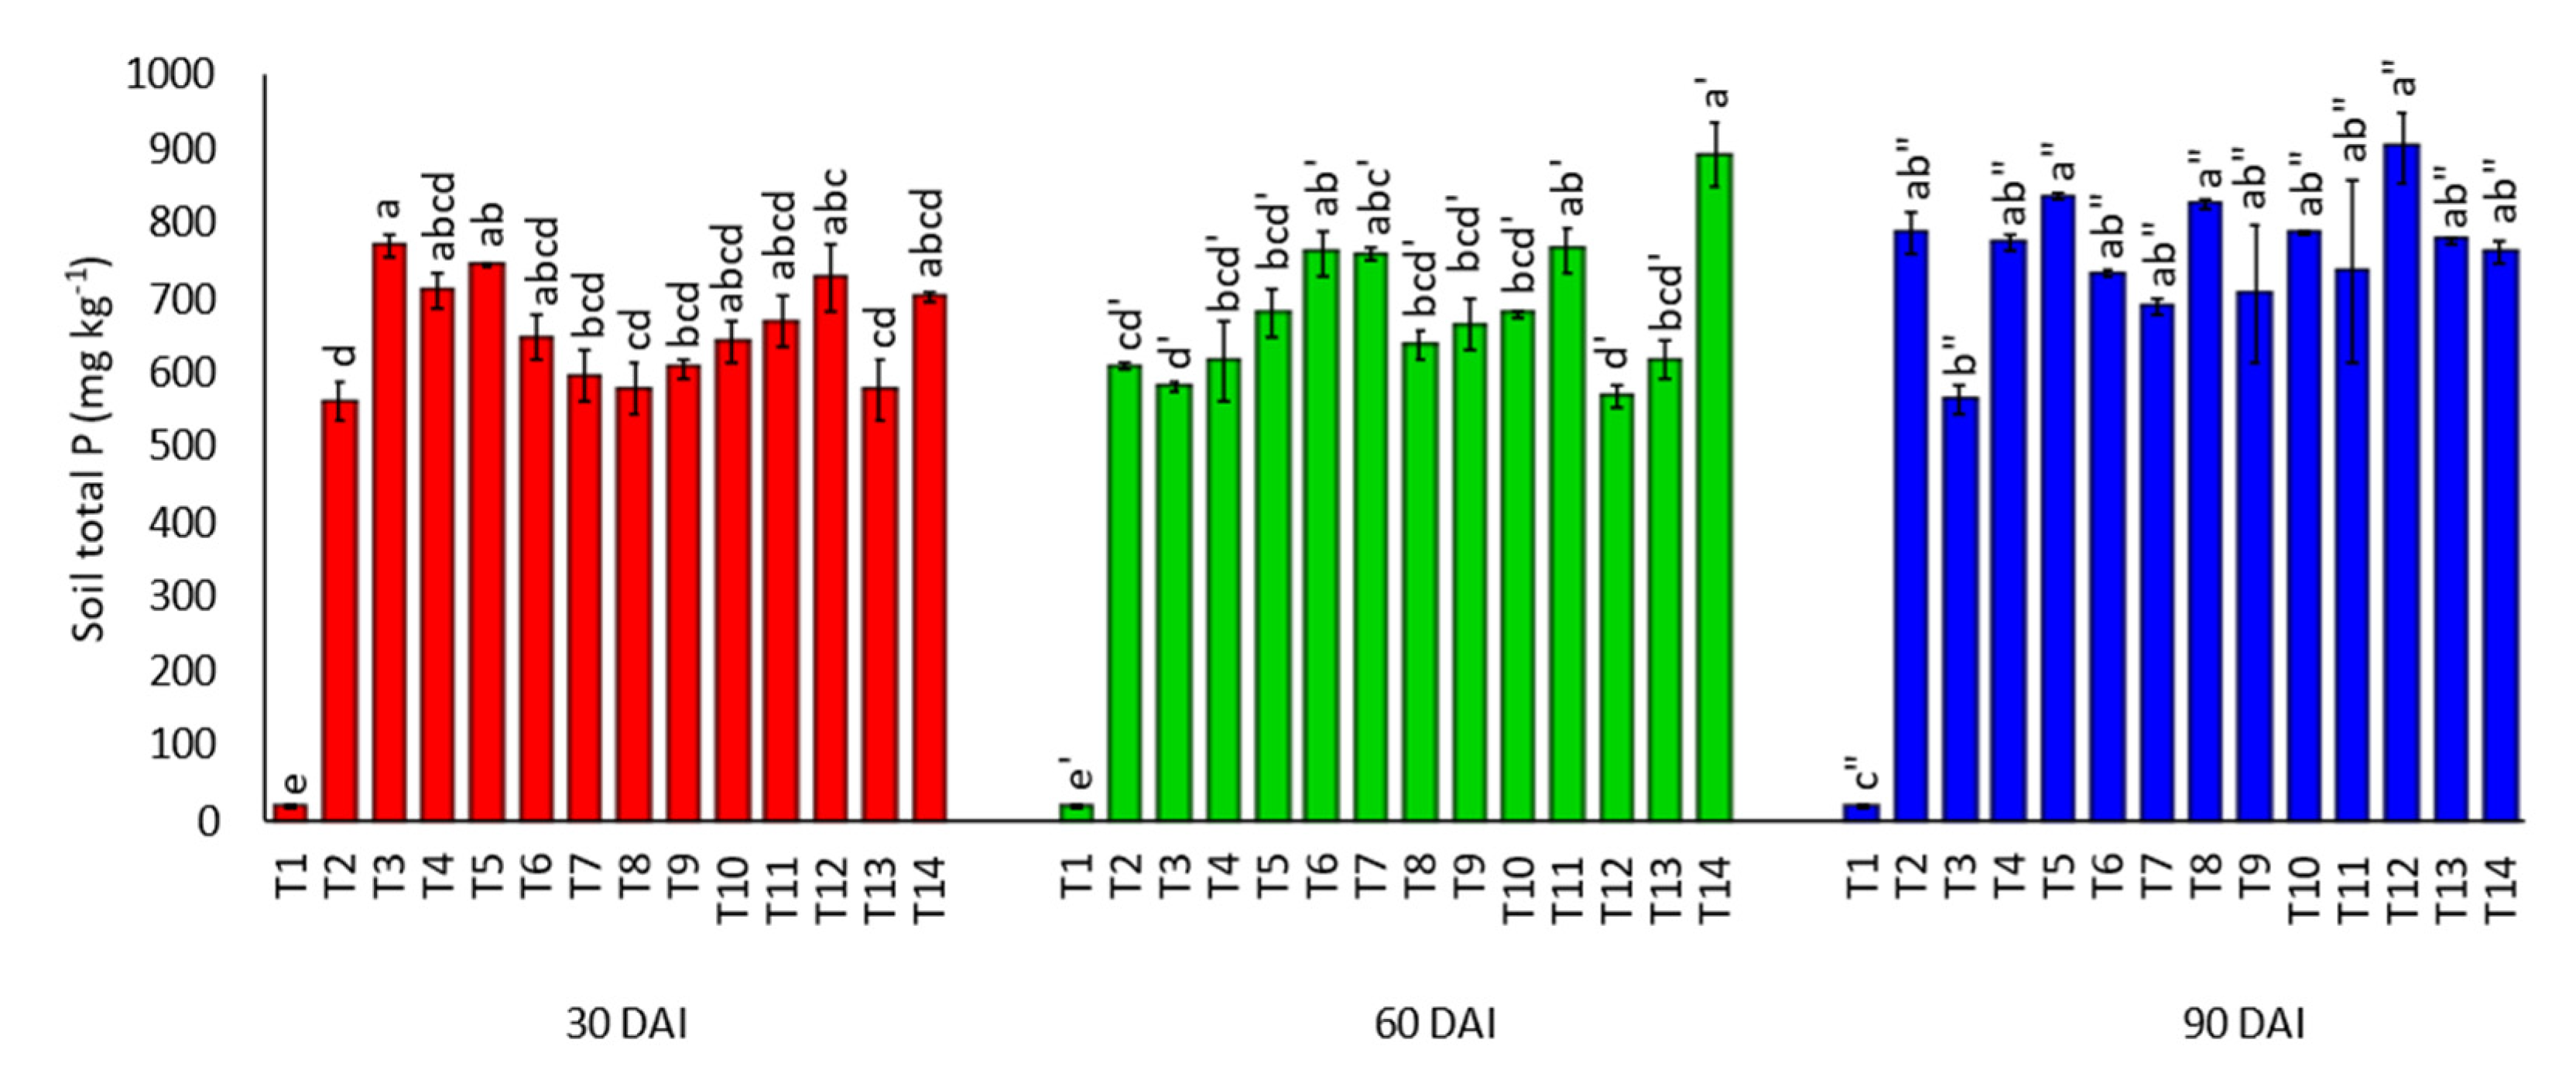
3.2. Effects of Amending Egypt Rock Phosphate with Charcoal and Sago Bark Ash on Soil Total Phosphorus and Mehlich-Phosphorus

Irrespective of treatment, soil total P increased with increasing incubation period (Figure 14). Treatment one showed the lowest soil total P compared with the treatments with ERP, charcoal, and sago bark ash. At 30 DAI, soil total P of the treatment with ERP alone (T2) was significantly lower compared with T3, T5, and T12. However, this trend was not consistent throughout the incubation study. At 60 DAI, the soil total P of T6, T11, and T14 were similar but significantly higher than those of T2, T3, and T12. Towards the end of the incubation study (90 DAI), the soil total P values of the treatments were not significantly different except for T1. The treatment with charcoal alone (T3) demonstrated lower soil total P at 60 and 90 DAI compared with 30 DAI.
Soil Mehlich-P demonstrated a different trend compared with soil total P (Figure 15). Regardless of incubation period, soil Mehlich-P of T1 was the lowest among the treatments. The effects of the treatments with ERP, charcoal, and sago bark ash (T2, T3, T4, T5, T6, T7, T8, T9, T10, T11, T12, T13, and T14) on soil Mehlich-P were higher at 30 DAI, decreased at 60 DAI, and recovered at 90 DAI. At 30 DAI, there was no significant difference in soil Mehlich-P between T2 and the treatments with ERP, charcoal, and sago bark ash. Soil Mehlich-P of T2 was significantly lower than those of T9 and T11 but significantly higher compared with T3 at 60 DAI. At 90 DAI, the effects of T2, T6, T12, and T13 on soil Mehlich-P were similar but higher than those of T3, T5, and T7.

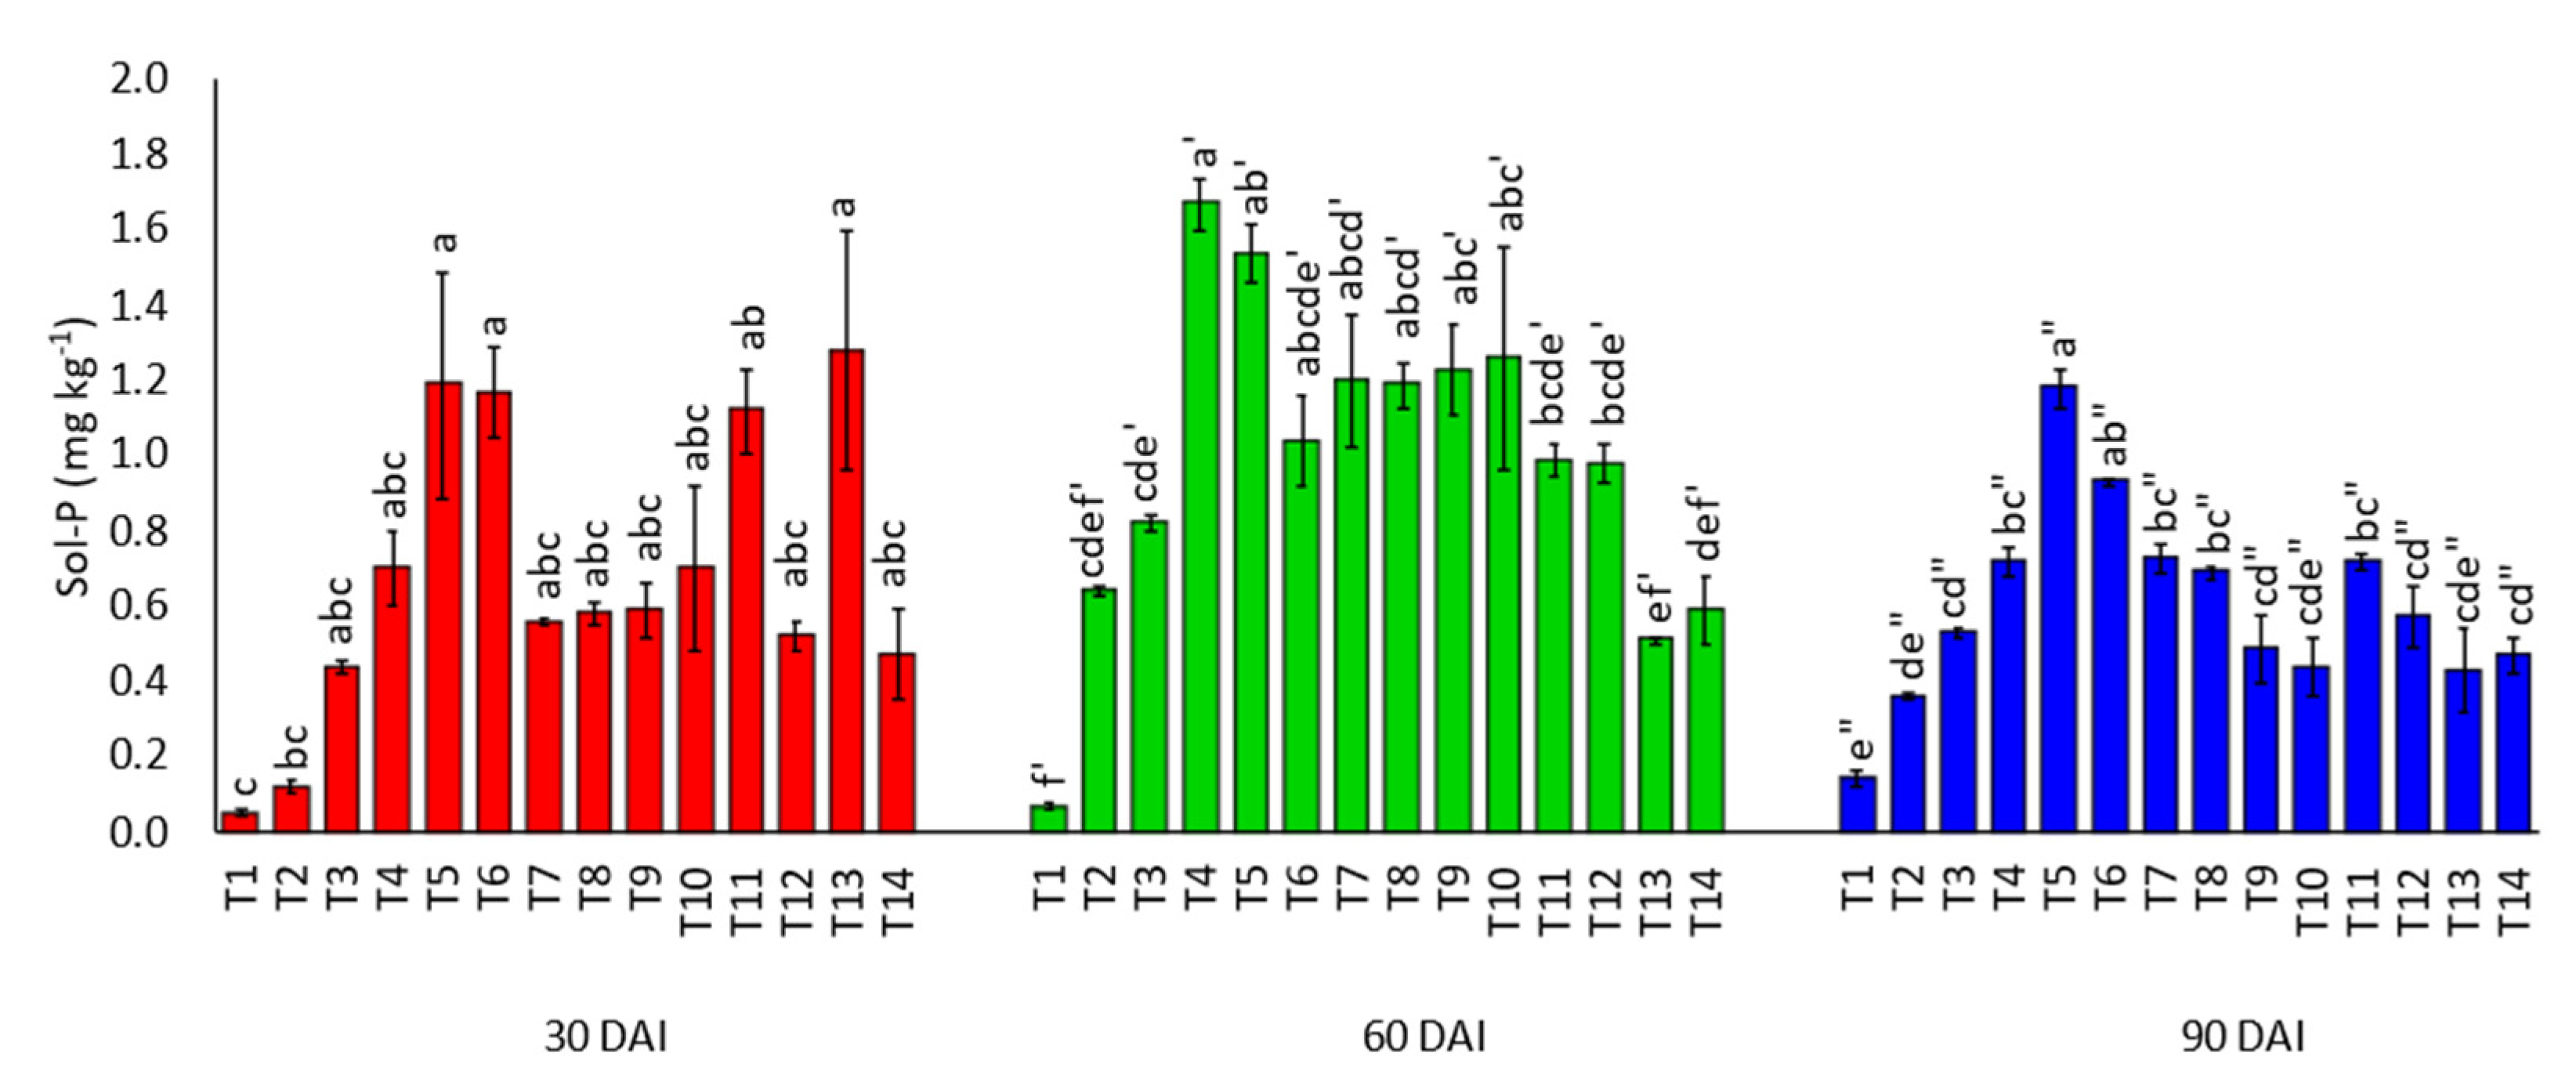
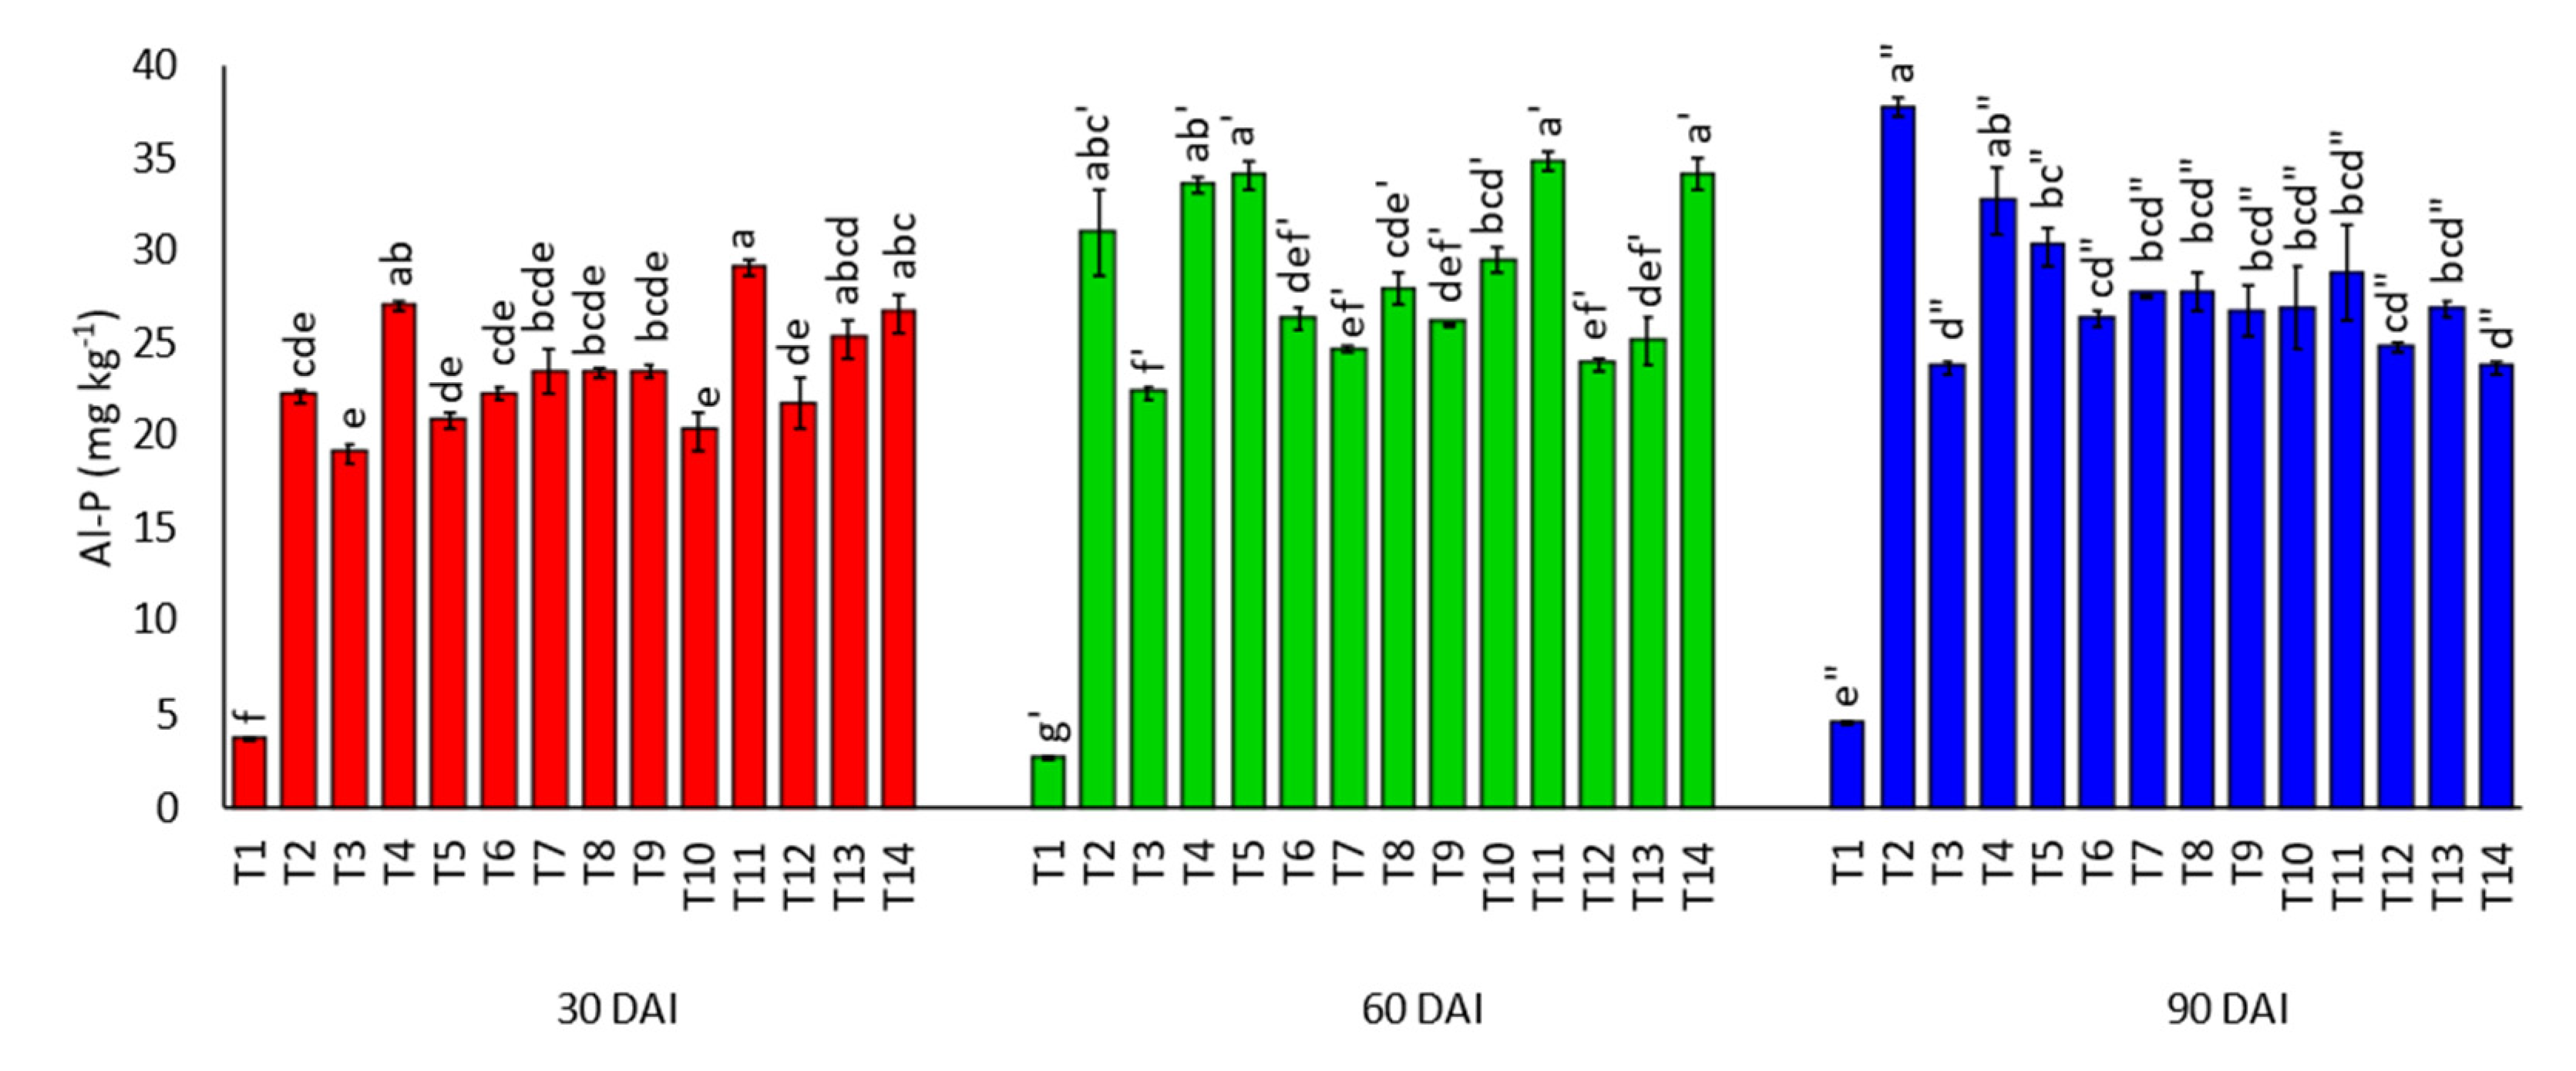
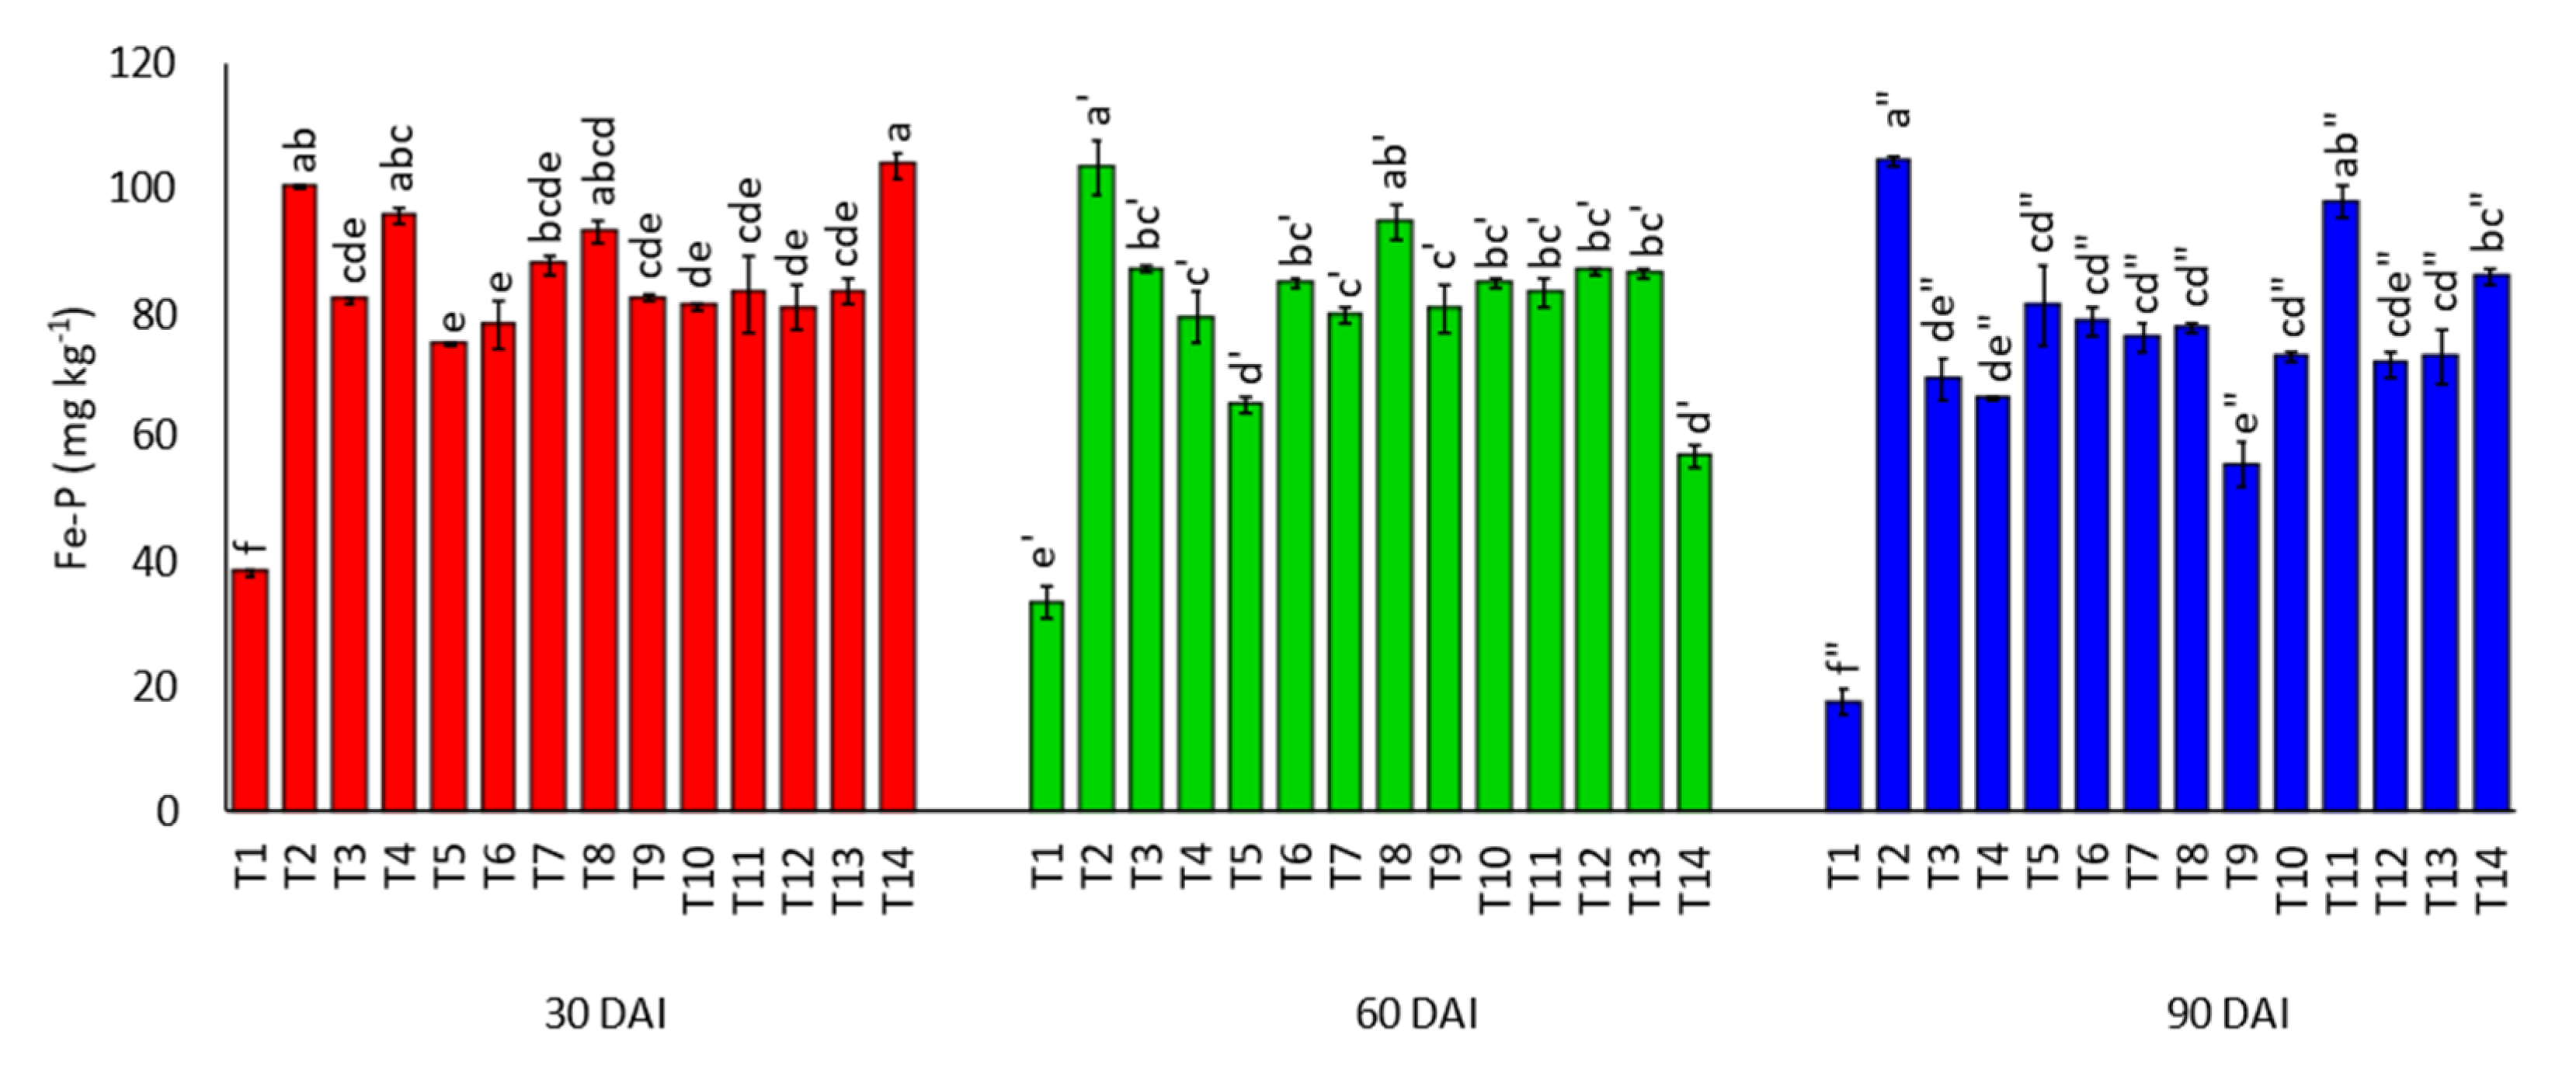
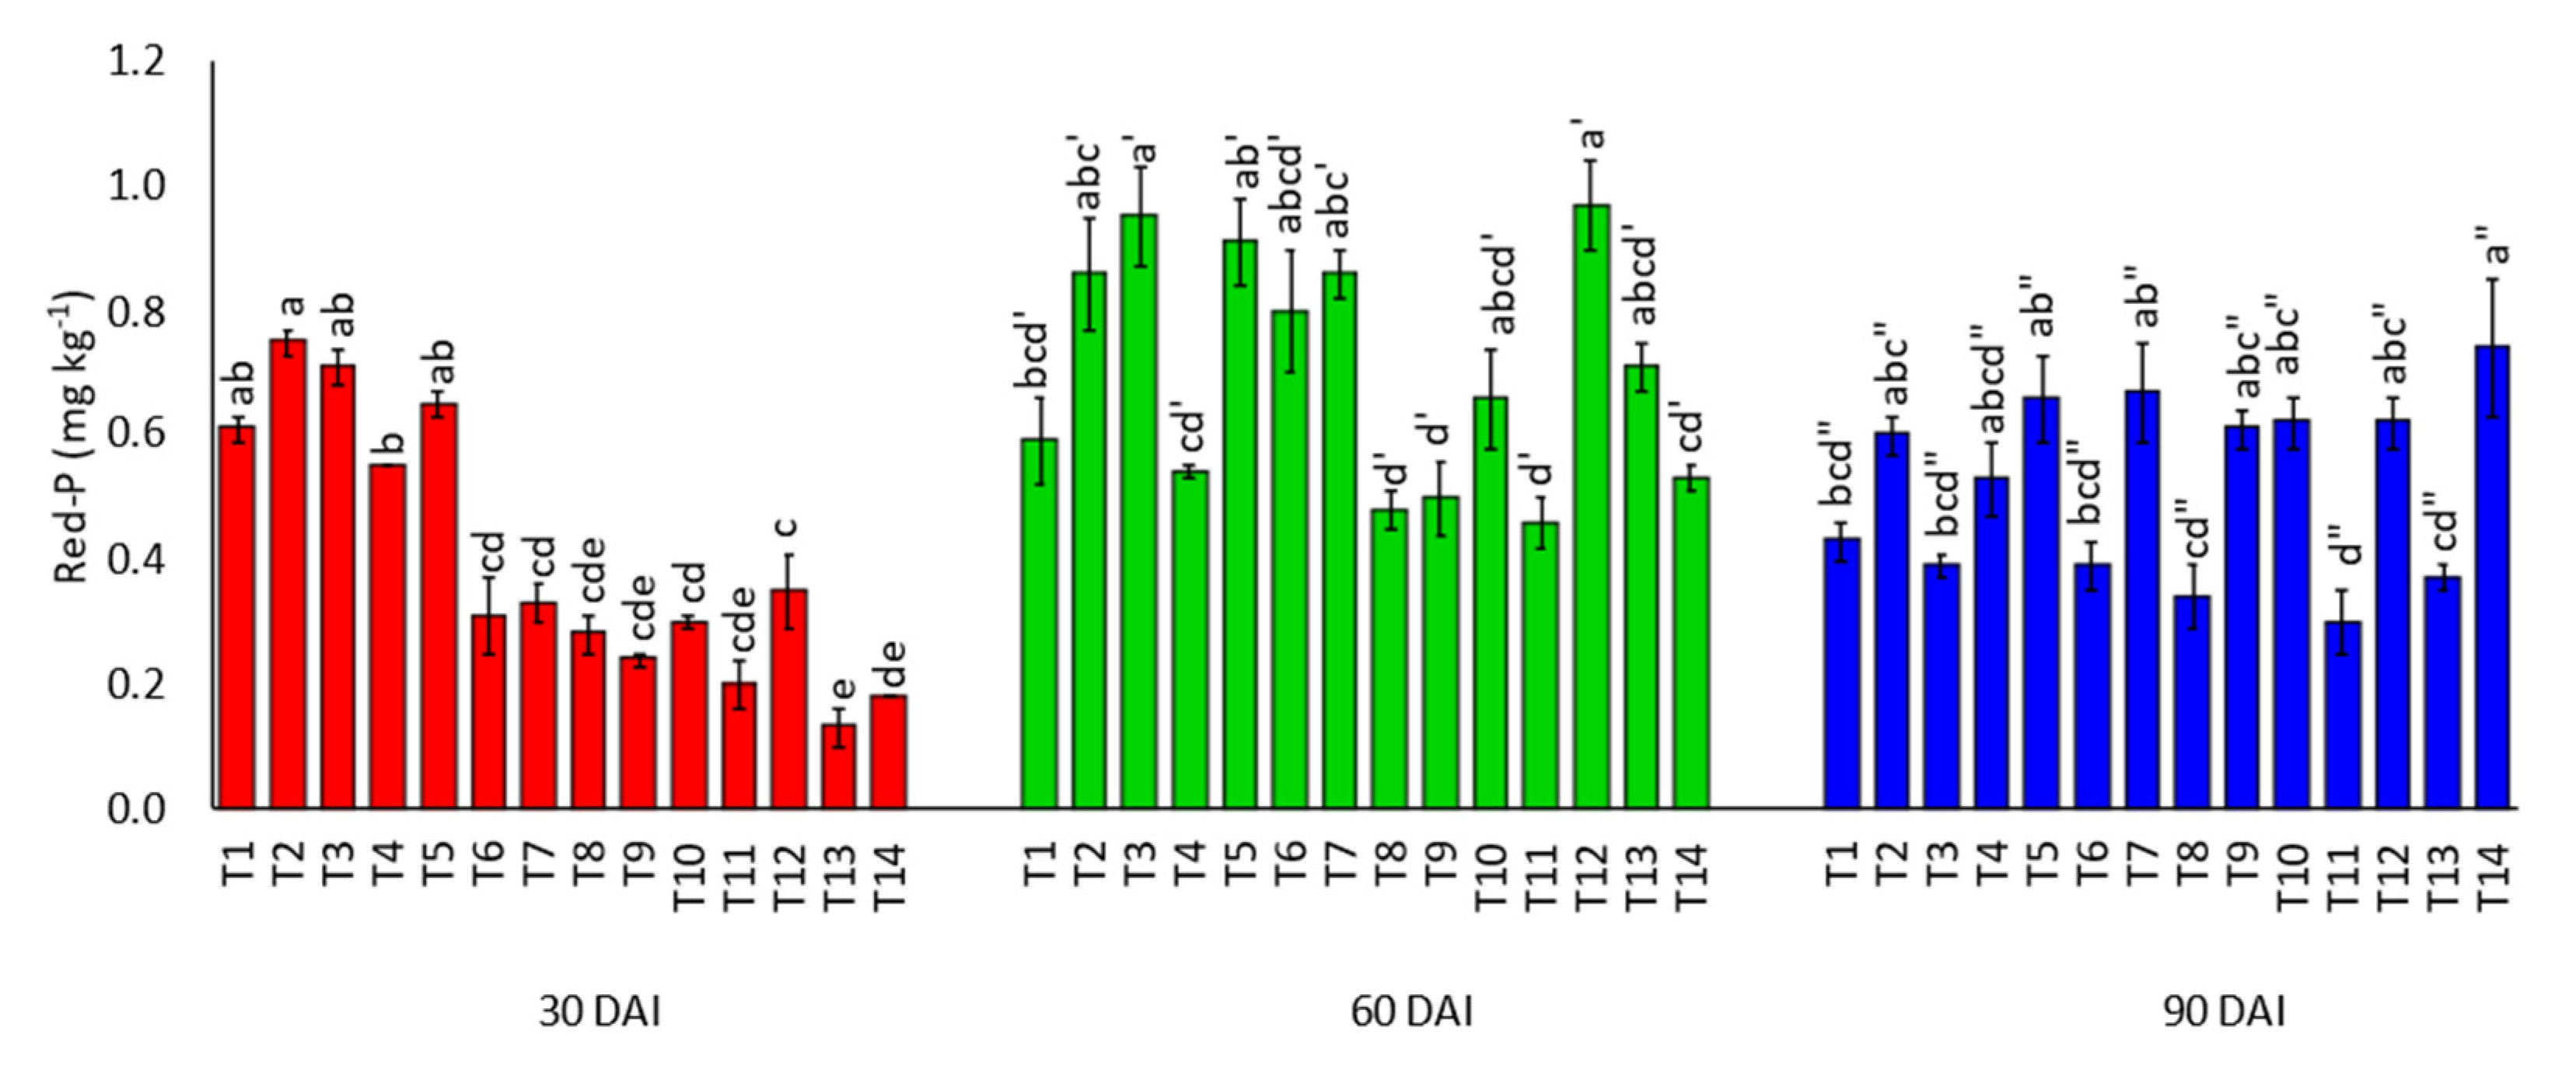
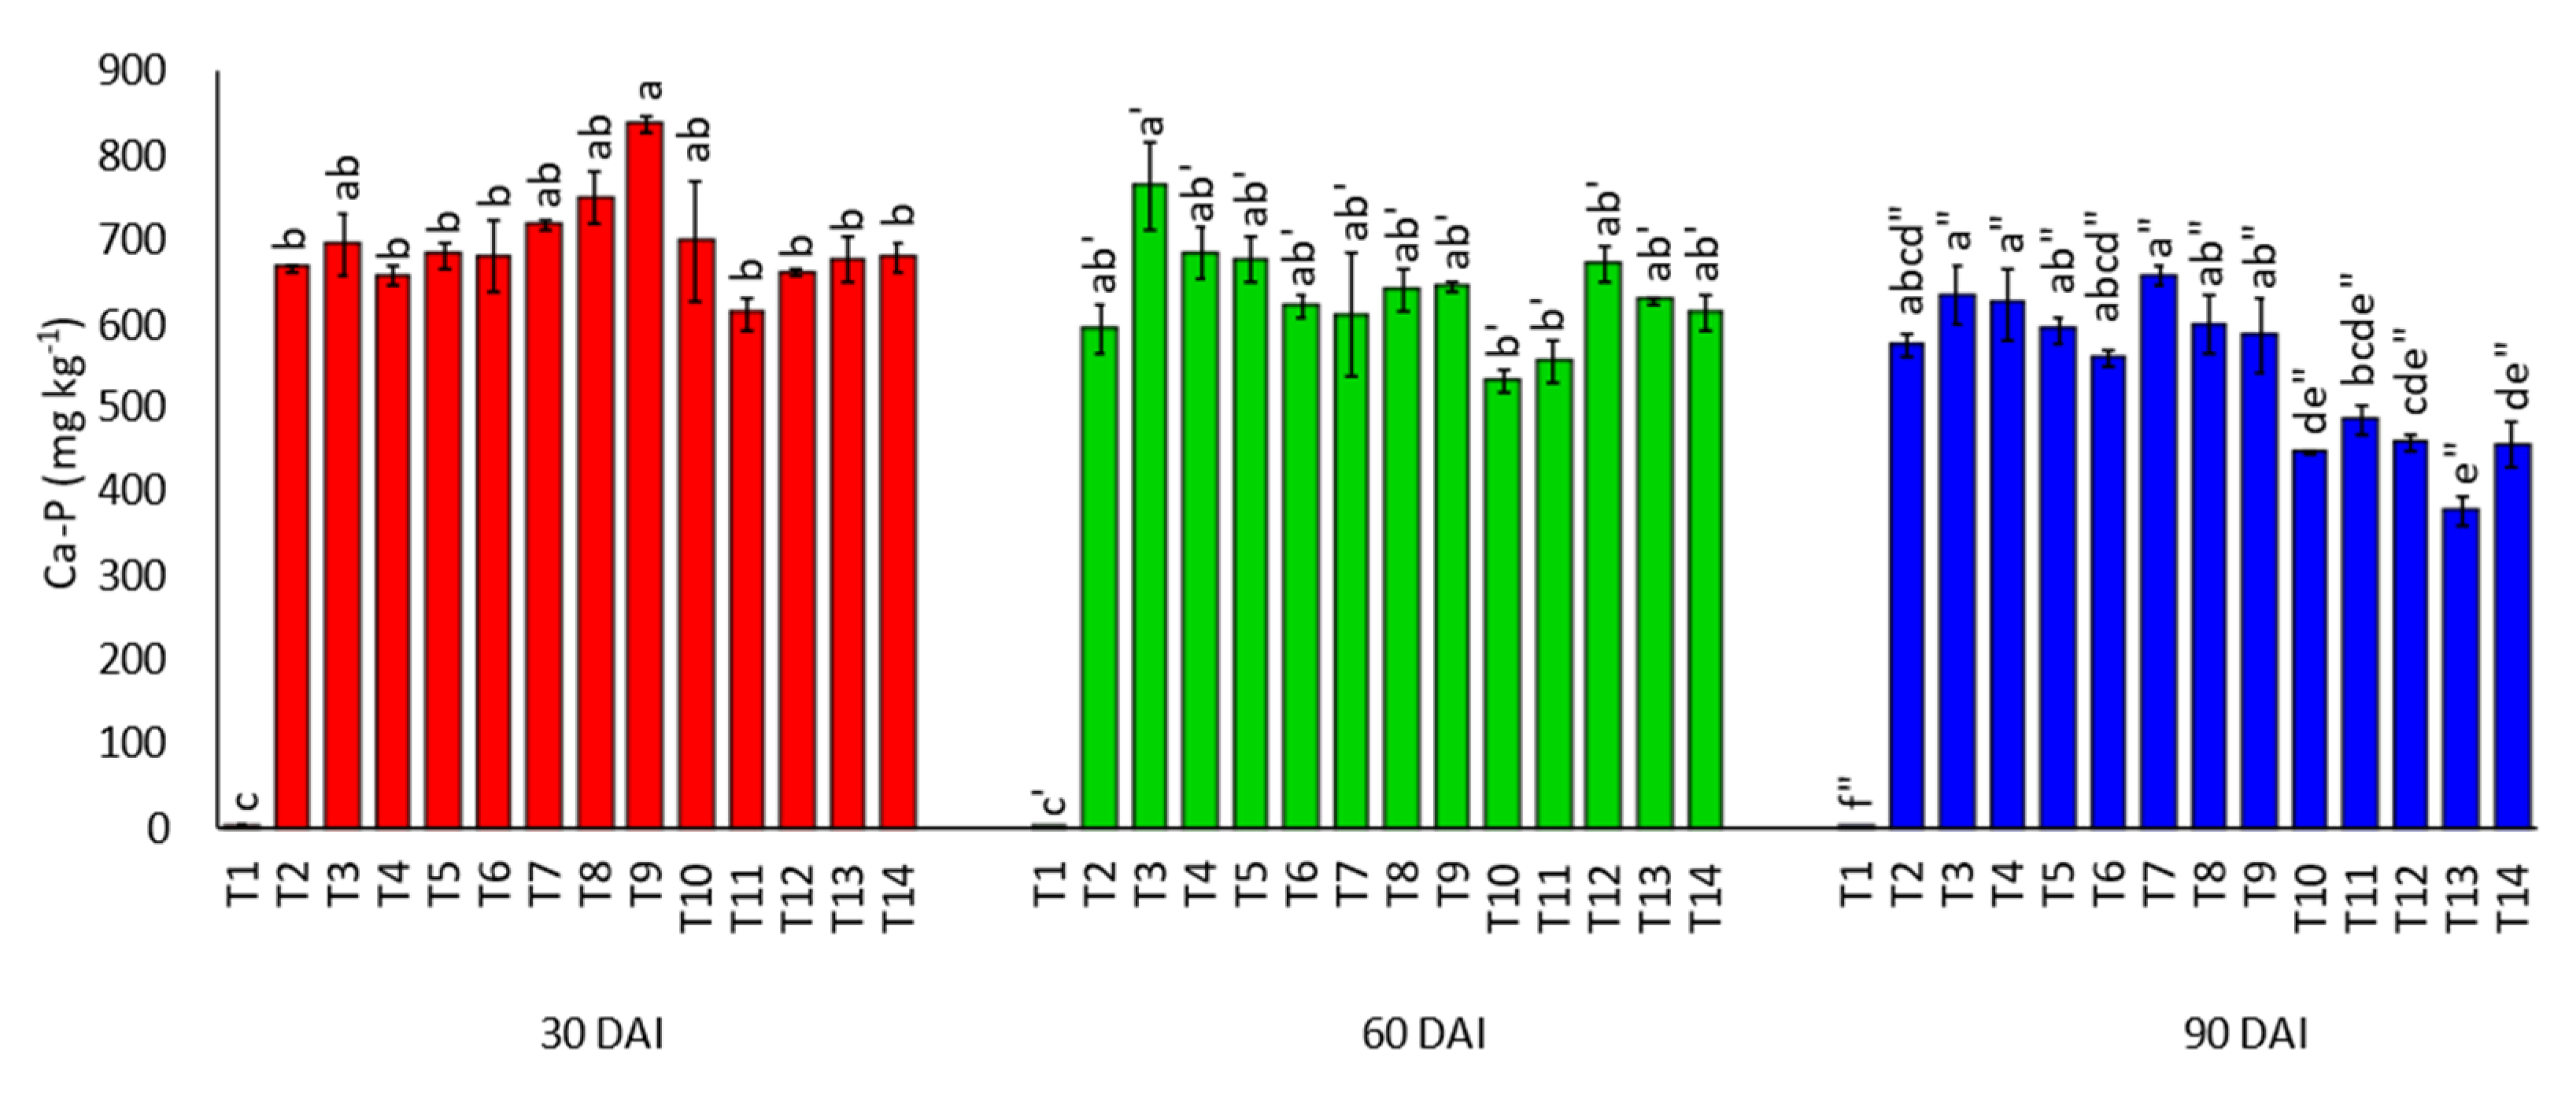
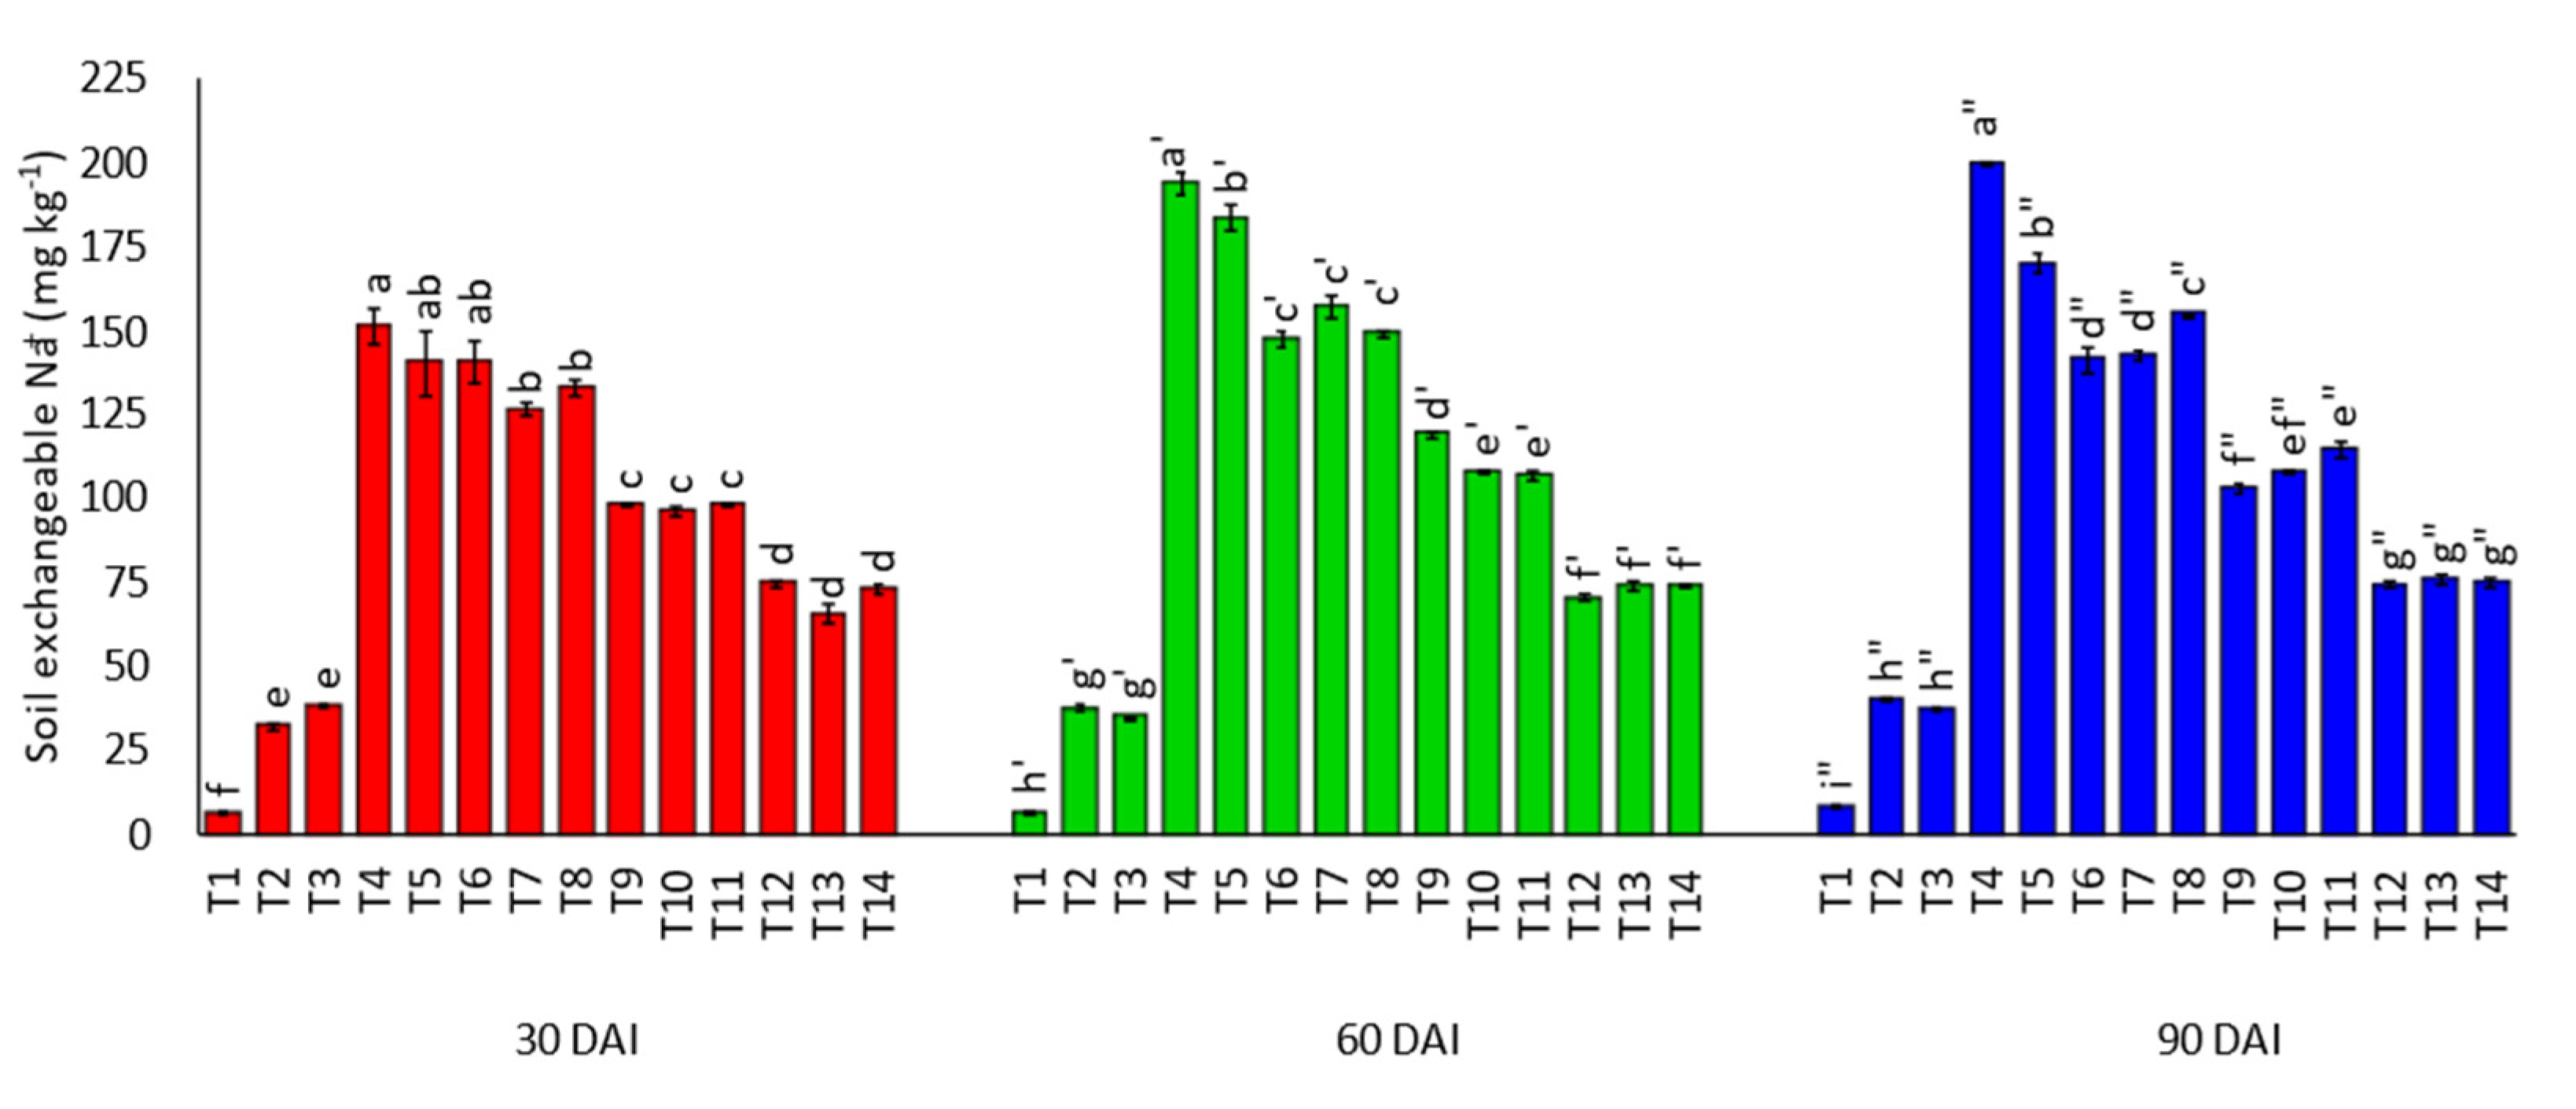
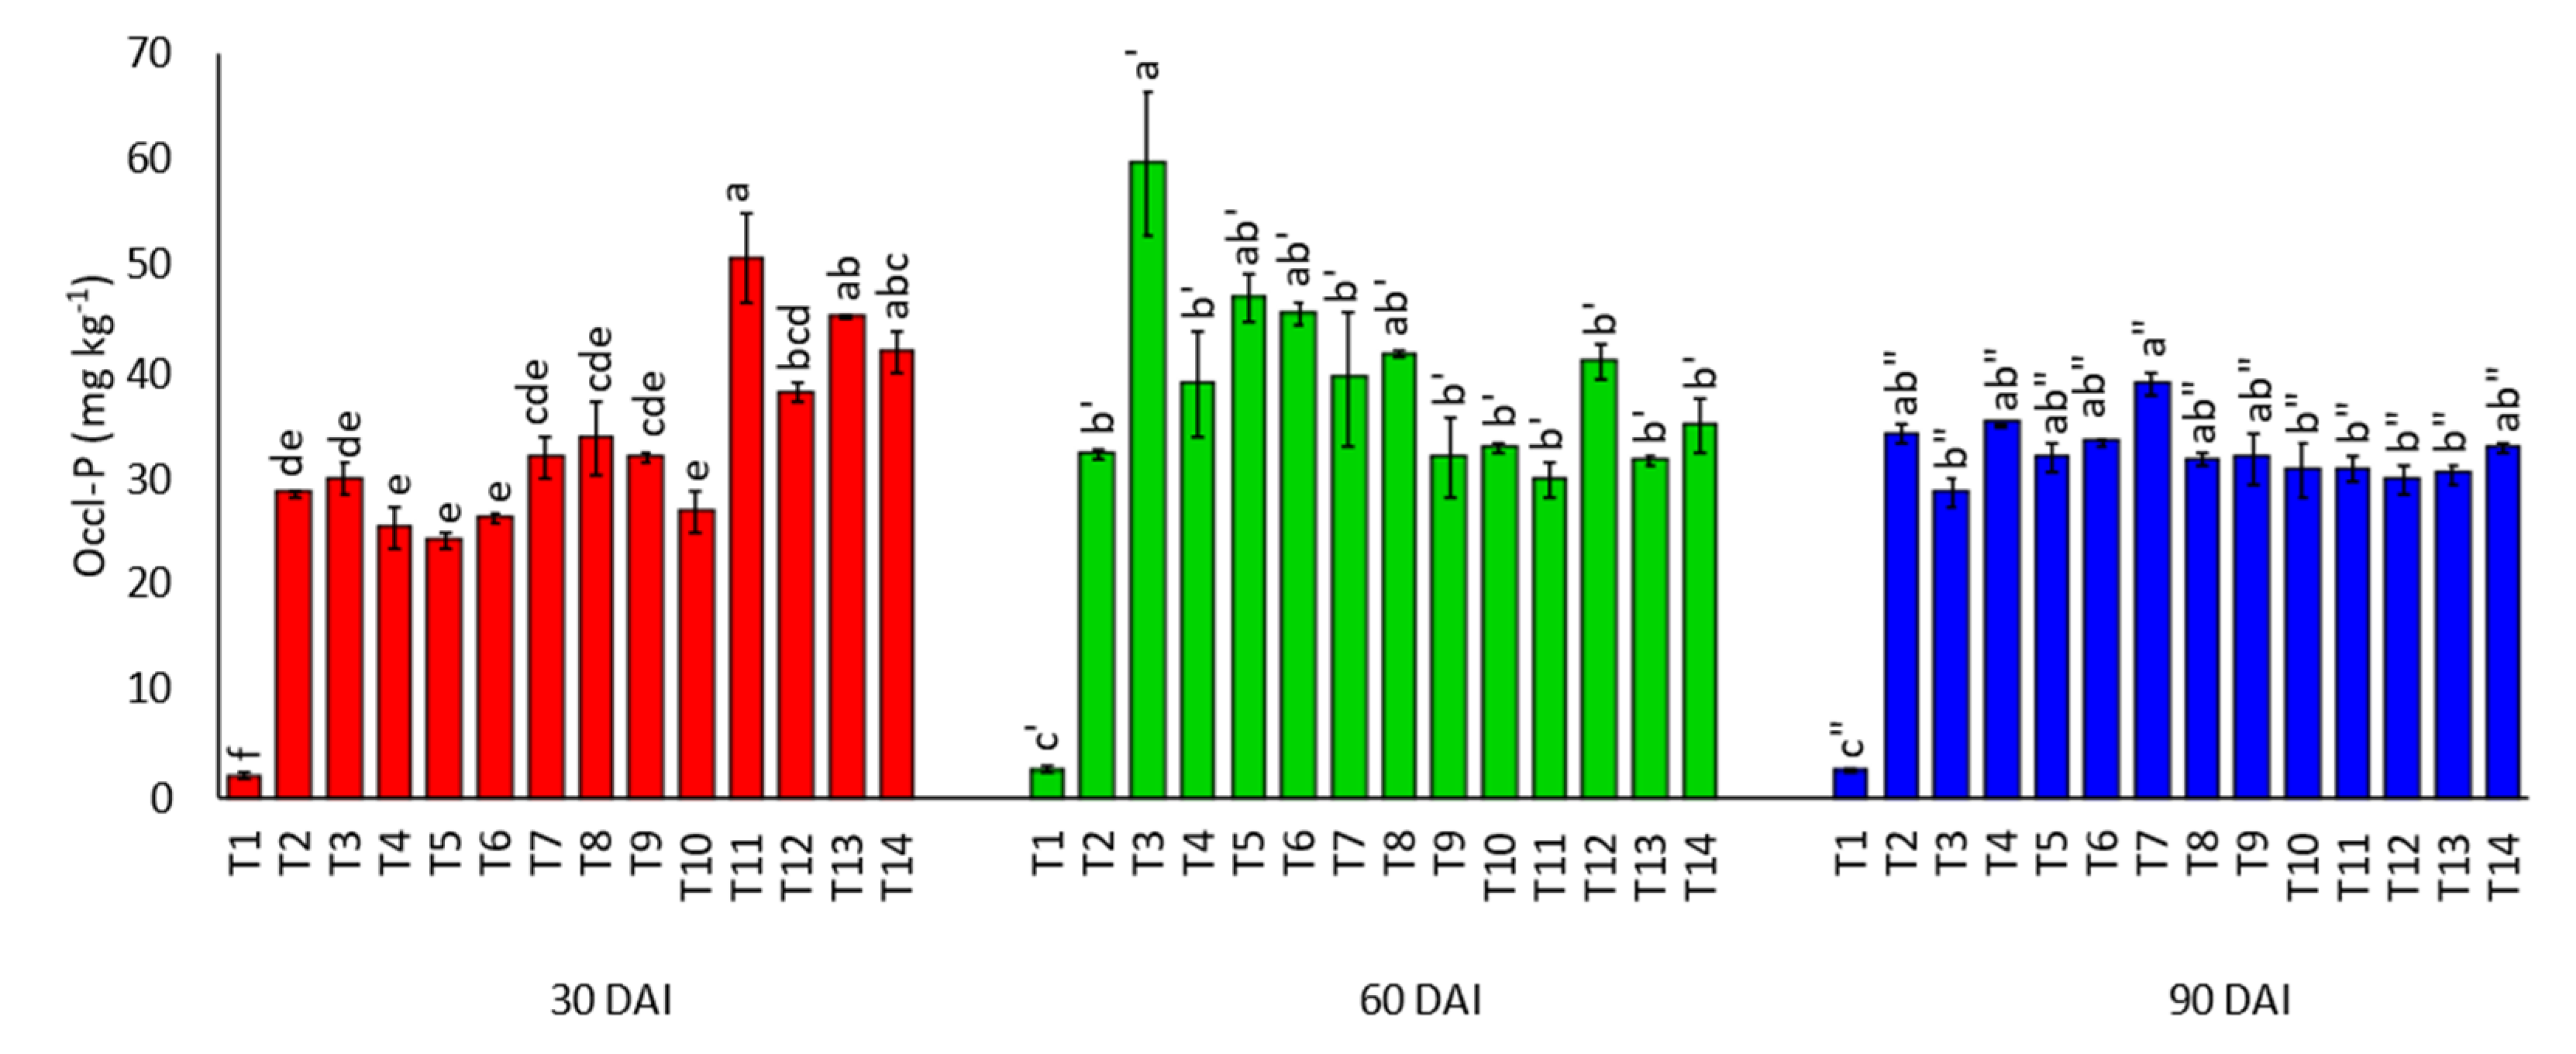
3.3. Effects of Amending Egypt Rock Phosphate with Charcoal and Sago Bark Ash on Soil Inorganic Phosphorus Fractions

Figure 16 demonstrates that Sol-P increased following the addition of P to the soil. However, application of ERP alone (T2) had lower Sol-P compared with T5, T6, and T13 at 30 DAI, T4 and T5 at 60 DAI, and T4, T5, T6, T7, T8, and T11 at 90 DAI. Although T3 and T4 represents charcoal alone and sago bark ash alone, their effects on Sol-P were similar to those of the soil with both charcoal and sago bark ash, irrespective of incubation time. It was noticed that, at 90 DAI, the Sol-P fraction was slightly lower than at 60 DAI.
The result in Figure 17 demonstrates that the addition of ERP increased the Al-P fraction. Aluminium-bound P for the treatment with ERP alone (T2) was significantly lower compared with T4 and T11 at 30 DAI. However, at 60 DAI, the effect of T2 on Al-P was significantly higher than those of T3, T6, T7, T9, T12, and T13 at 60 DAI. Additionally, the increase in Al-P of T2 was detected at 90 DAI, where T2 had higher Al-P compared with T3, T5, T6, T7, T8, T9, T10, T11, T12, T13, and T14.
An appreciable amount of P was also fixed by Fe (Figure 18). Regardless of the incubation period, T1 demonstrated a lower Fe-P fraction compared with the treatments with ERP. There was no significant difference in Fe-P for T2 and T4, T7, T8, and T14 at 30 DAI, T8 at 60 DAI, and T11 at 90 DAI. Iron-bound P for the treatments with charcoal and sago bark ash decreased at 90 DAI.
Regardless of treatment, the fixation of P as Red-P was not consistent throughout the incubation study (Figure 19). With time, T9, T10, and T11 increased the Red-P fraction, whereas fluctuation was noticed for other treatments. At 30 DAI, the effect of T2 on Red-P fraction was similar to T3 and T5 but significantly higher than those of T4, T6, T7, T8, T9, T10, T11, T12, T13, and T14. Reductant soluble P of T2 was significantly higher compared with T8, T9, and T11 at 60 DAI, and T11 at 90 DAI.
The results further reveal that Ca-P increased with the application of ERP (Figure 20). There were no significant differences in Ca-P for the soil with ERP alone (T2) and soil with charcoal and sago bark ash at 30, 60, and 90 DAI.
At 30 DAI, Occl-P of T11 was higher than those of T2, T3, T4, T5, T6, T7, T8, T9, T10, and T12 (Figure 21). However, the trend changed at 60 DAI, where T3 was significantly higher compared with T2, T4, T7, T9, T10, T11, T12, T13, and T14. Regardless of treatment, Occl-P fraction was uniform towards the end of incubation study (90 DAI), with almost all treatments with ERP making no significant difference.

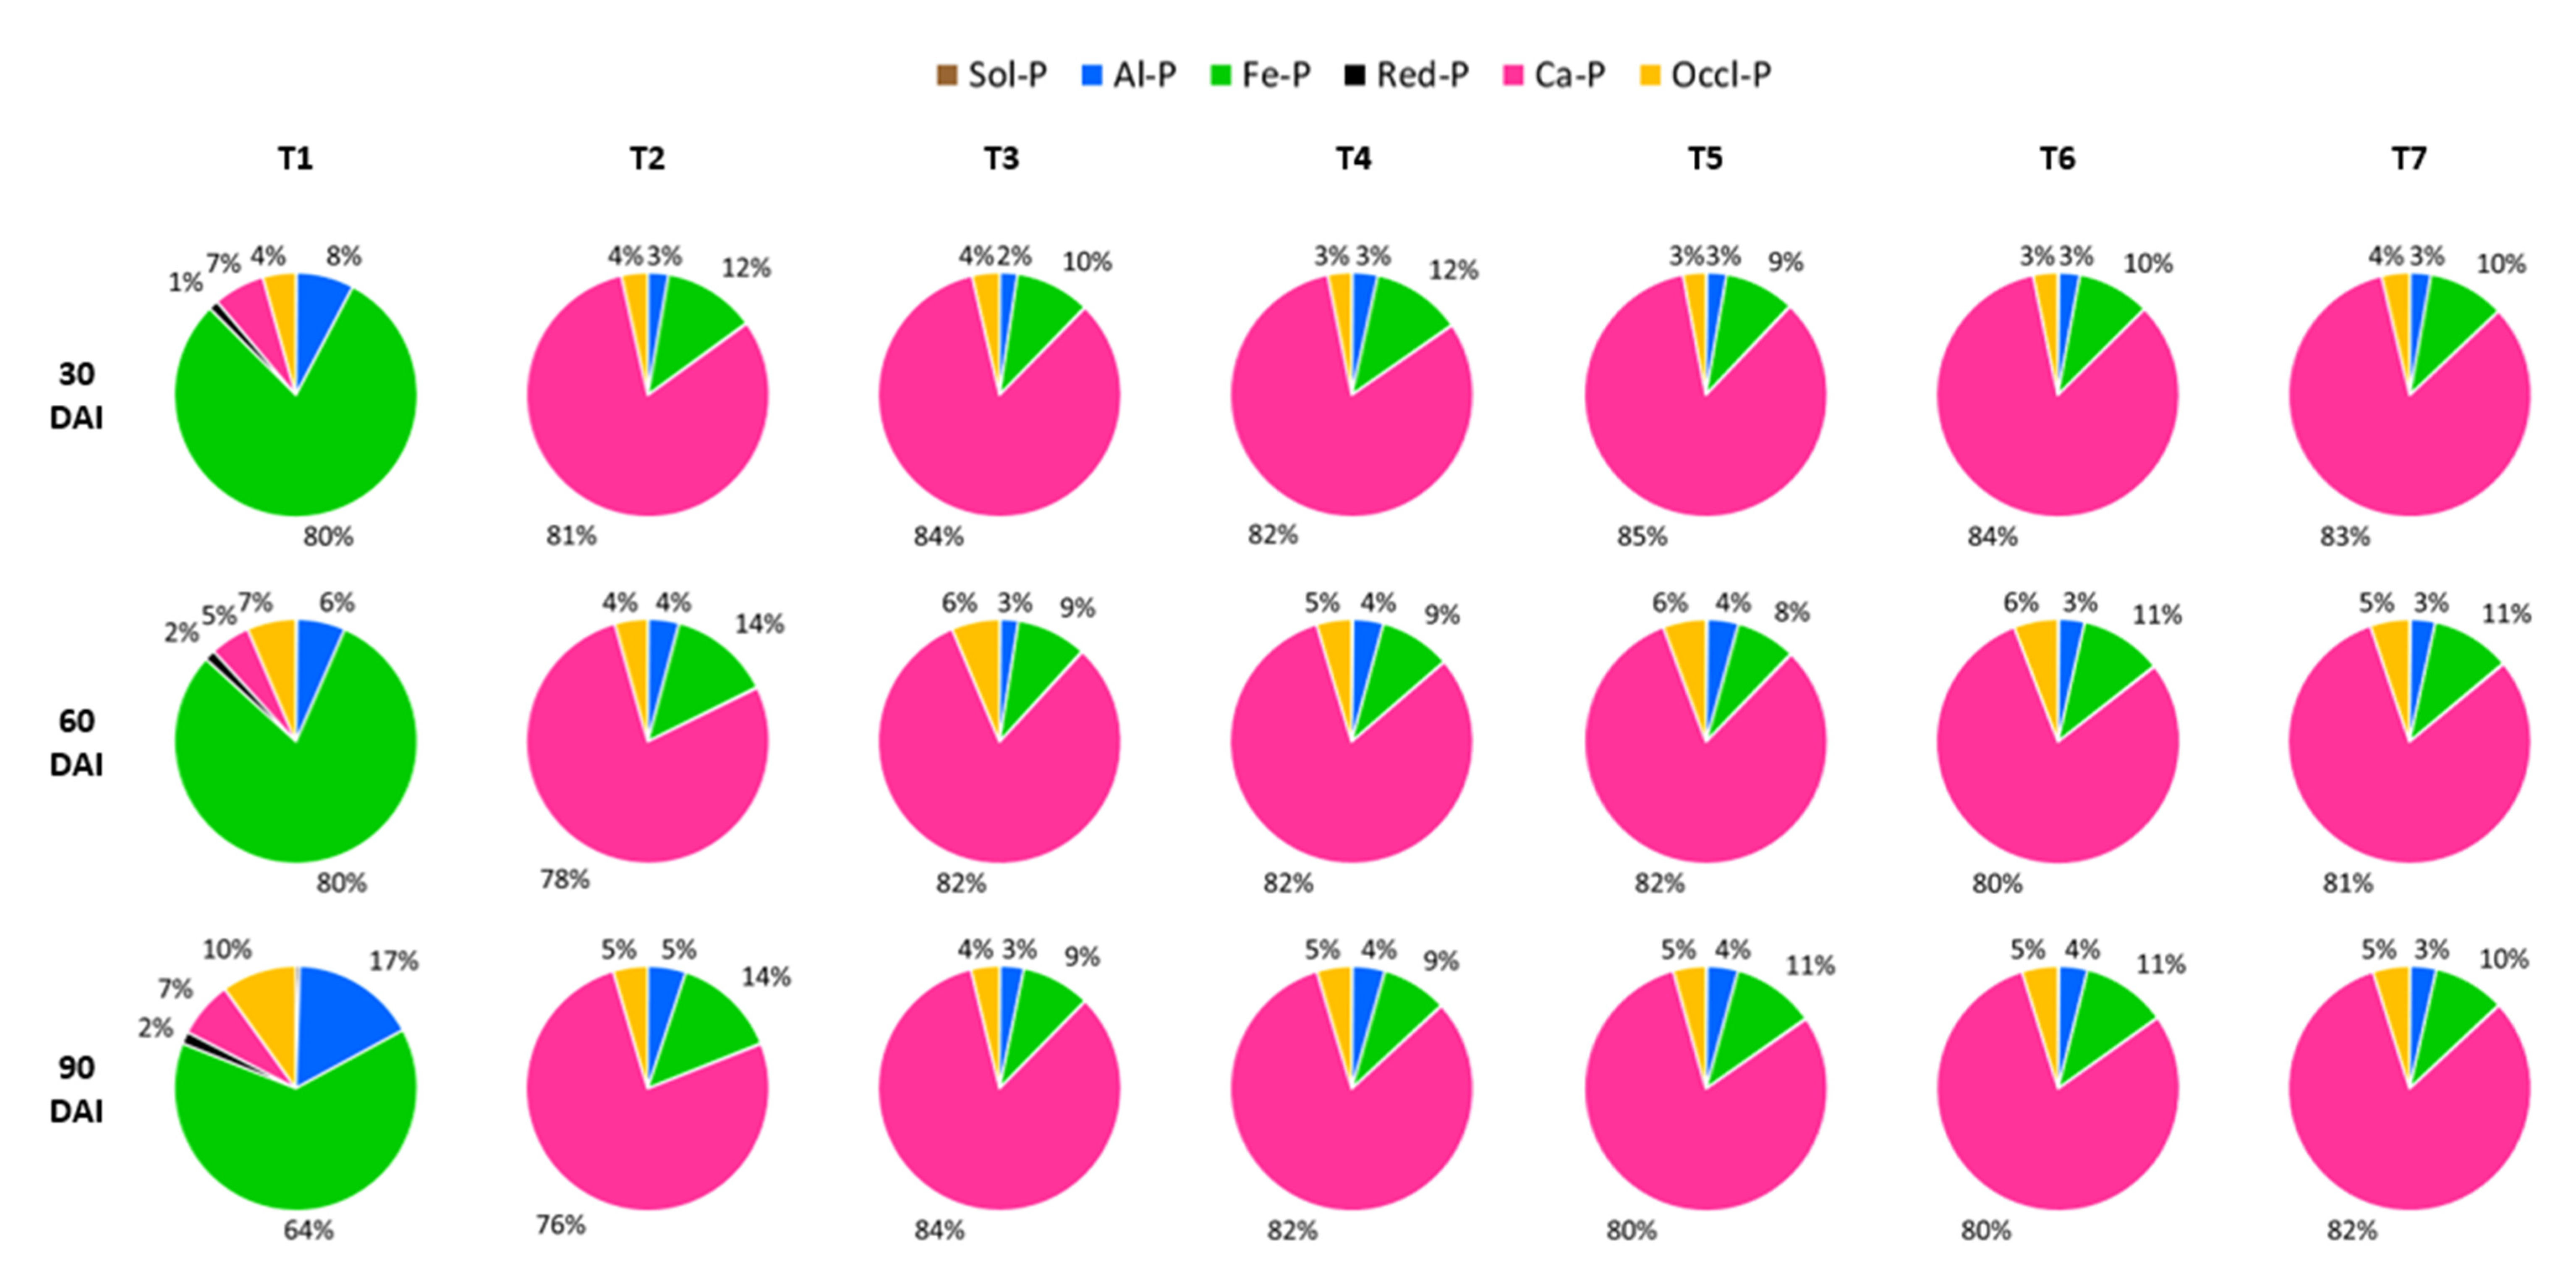
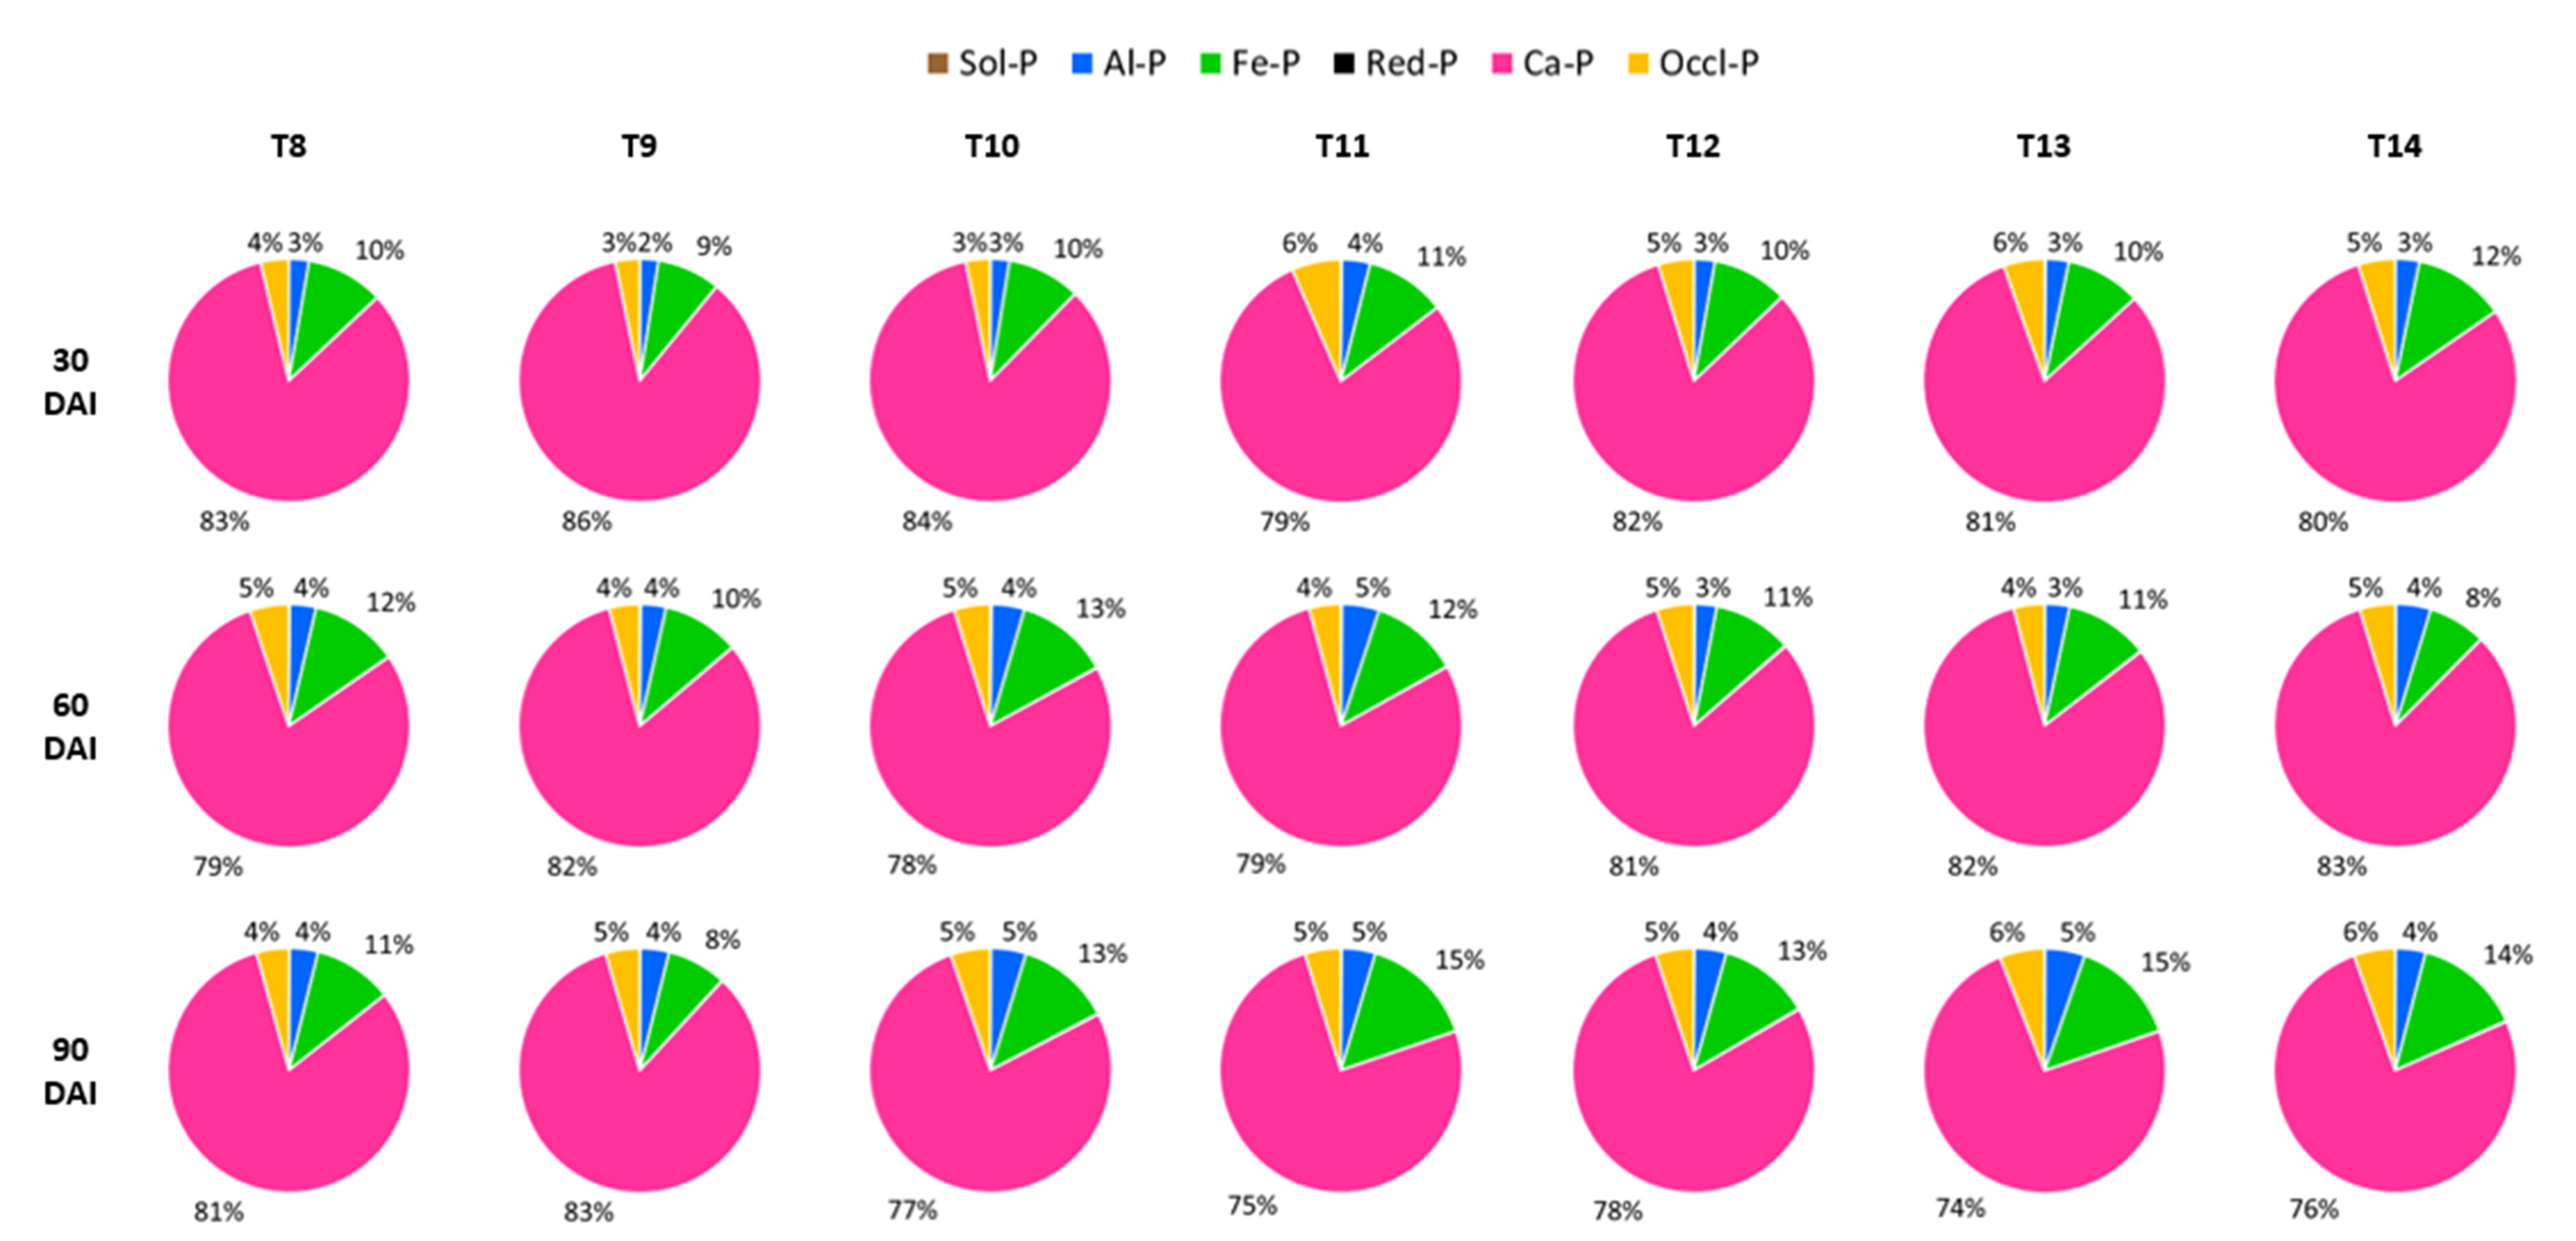
3.4. Percentages of Soil Inorganic Phosphorus Distribution by Treatment after Thirty, Sixty, and Ninety Days of Incubation

The initial inorganic P speciation of the soil used in this present study was in the order of Fe-P (67%) > Occl-P (12%) > Al-P (11%) > Ca-P (7%) > Red-P (3%) > Sol-P (Table 2). Although the order differed from that recorded in a study carried out by Hasbullah et al. [78]—Fe-P (68%) > Al-P (13%) > Red-P (10%) > Occl-P (7%) > Ca-P (2%) > Sol-P—both findings are consistent with that reported by Bidin [79], who mentioned that Fe-P is dominant in Malaysian soils, with an average of 79%.
The percentages of inorganic P following the application of ERP, charcoal, and sago bark ash are summarised in Figure 22 and Figure 23. The proportions of Sol-P and Red-P were limited compared with other fractions, despite the addition of ERP to the soil. Previous findings (Figure 16) showed that Sol-P ranged from 0.05 to 1.67 mg kg−1. The distribution of Red-P was only significant in the soil alone (T1), whereas for the other treatments, the amount was negligible because throughout the incubation study, the maximum amount of Red-P was 0.97 mg kg−1 (Figure 19). Irrespective of incubation time, T1 had Fe-P which was more than half of the soil inorganic P fractions (ranging from 64% to 80%). As ERP was applied to the soil, Ca-P became dominant (>74%), replacing Fe-P. Additionally, treatments with ERP, charcoal, and sago bark ash demonstrated a significant reduction in Al-P and Fe-P, from 88% to approximately 13% at 30 DAI, 86% to approximately 14% at 60 DAI, and 81% to approximately 15% at 90 DAI. The fixation of P in Occl-P of T1 was observed to increase from 4% in 30 DAI to 7% in 60 DAI, and 10% in 90 DAI, whereas for the other treatments, the distribution of Occl-P was within the range of 3% to 6%, irrespective of the incubation time and the rates of charcoal and sago bark ash used.

4. Discussion

4.1. Selected Soil Chemical Properties at Thirty, Sixty, and Ninety Days of Incubation

The sago bark ash alone treatment (T4) had a lower effect on TC because C in the sago bark volatilised during combustion to produce ash [55]. Carbon is mostly present in ash in negligible quantities or is even absent. The increase in TC of the soil with charcoal could be attributed to the relatively high C content in the charcoal. According Phounglamcheik et al. [80], the C content in charcoal ranges between 84.0 and 92.1%, but it has a low O, H, and N content. Phonphuak and Thiansem [81] also described charcoal as an amorphous C in the form of highly porous microcrystalline graphite. The increase in the soil pH following the incorporation of charcoal and sago bark ash was due to the basic nature of these amendments (Table 3). However, the charcoal alone treatment had lower soil pH compared with the treatments with sago bark ash because sago bark ash has a substantial number of neutralising compounds and base cations. Etiegni and Campbell [53] indicated that hydroxides of Ca, Mg, and K are the main contributors to the soluble alkalinity in wood ash. Their reaction with H+ in the soil solution can form CO2 + H2O and this leads to an increase in pH. The slight increase in the soil pH for T2 suggests that dissolution of Ca and Mg from the applied ERP might have contributed to the increase in soil pH.
The reductions in soil exchangeable acidity, Al3+, and Fe2+ for the treatments with charcoal and sago bark ash are related to the increase in soil pH. This finding is consistent with the findings of previous studies which also reported that decrease in exchangeable Al3+ and Fe2+ was directly related with the improvement in soil pH [78,82,83]. This was possible because the hydroxyl ions formed from the dissolution of the CaO, MgO, K2O, and NaOH in the ash neutralise the protons in the soil solution and those bound on the cation exchange sites in the soil [84]. The release of the base cations displaced the protons, Al3+, and Fe2+ occupying the cation exchange site. In addition, the reduction can be associated with the adsorption of Al and Fe by the charcoal complexion sites. This also suggests that charcoal is able to reduce Al and Fe solubility by replenishing the functional groups (for example, carboxylic and phenolic) of humic substances. The increase in soil exchangeable H+ of T1 at 30, 60, and 90 DAI was due to further hydrolysis of Al3+ resulting in an increase in the amount of H+. The releasing of H+ was not consistent in this study because there were no plants to contribute to H+ removal through uptake of nutrients.
The increase in the exchangeable base cations in the soil with the charcoal and sago bark ash is related to the inherent K, Ca, Mg, and Na contents of these amendments. Ammonium acetate extraction for the wood ash by Ohno and Erich [85] revealed 48% of total Mg, 40% of total K, and 5.7% of total P at pH 3.0, whereas Meiwes [86] reported 81% of total Ca, 57% of total Mg, 34% of total K, and 20% of total P at pH 4.2. Glaser et al. [50] stated that application of charcoal which has ash adds free bases such as K, Ca, and Mg to the soil indirectly provide readily accessible nutrients for plant growth. Moreover, the addition of these base cations to the soil contributes to soil acidity regulation and binding of exchangeable Al and Fe in the soil [87,88]. Although there was an improvement in the soil exchangeable cations, the inconsistency in the soil CEC could be associated with the chemical stability of the charcoal and sago bark ash.

4.2. Total Phosphorus and Mehlich-Phosphorus at Thirty, Sixty, and Ninety Days of Incubation

The increase in soil P availability irrespective of treatment could be attributed to mineralisation of organic P in soil [89]. Treatment one had the lowest soil total P and Mehlich-P because there was no addition of mineral P and most of the P ions in the soil were fixed by Al and Fe ions. The lower soil total P value of the treatment with charcoal alone at 60 and 90 DAI indicates that without the sago bark ash, the use of charcoal alone increased soil total P over a short period and the effect lasted for 30 days. The trend of the soil Mehlich-P was different from the soil total P because not all of the soil total P was converted into available form. Some of it was held by the soil particles and organic matter by means of weak outer-sphere mechanisms via anion exchange [90]. The increase in soil Mehlich-P at 30 DAI might be because of the readily available P released by ERP. At 60 DAI, the soil Mehlich-P decreased because some of the added P was fixed by Al and Fe ions. Recovery of the soil Mehlich-P at 90 DAI suggests that fixed P ions were released into soil solution either through dissolution or desorption reactions as a result of the increase in soil pH. This observation corroborates the findings of Demeyer et al. [55] who demonstrated that P contents in soils are not significantly increased following amendment with wood ash. Comparative studies of P uptake by corn have shown that ash is substantially less effective than P fertilisers [91]. These results confirm the conclusions obtained from the chemical characterisation information on wood ash, because wood ash P is weakly soluble and a large portion of the dissolved P is likely to be immobilised in the soil [92].

4.3. Soil Inorganic Phosphorus Fractions at Thirty, Sixty, and Ninety Days of Incubation

The P recovery of the P fractions depends on the P added to the soil, suggesting that an external source of inorganic P is necessary to increase their pool size. The increase in Sol-P for the treatments with charcoal and sago bark ash compared with soil alone and ERP alone is partly related to the readily soluble P released by the charcoal and sago bark ash through mineralisation and dissolution, respectively. However, at 90 DAI, the Sol-P fraction was slightly lower than at 60 DAI because some of the soil solution P might be converted into labile P form as a response to maintain equilibrium of P pools in the soil. The decrease in Al-P and Fe-P following the application of charcoal could be attributed to the production of organic acids during the decomposition of organic material, which temporarily bind to the oxides or hydroxides on the surfaces of clay particles. In addition, sago bark ash as a liming material increases soil pH to reduce the solubility of Al and Fe ions. These chemical reactions prevent P ions from being precipitated with Al and Fe ions. The increase in the Ca-P fraction for the treatments with ERP could be associated with the relatively high concentrations of Ca in this rock phosphate because rock phosphates are generally made up of calcium apatite, which considerably increase Ca-P fraction in soils [93]. The distribution of Red-P was not consistent throughout the incubation study, and this is related to redox reactions involved during the extraction process. The contribution of Occl-P to plant-available P is limited because it is inert to reactions with the soil solution.

4.4. Percentages of Soil Inorganic Phosphorus Distribution after Incubation

In acidic soils, P sorption is generally attributed to hydrous oxides of Fe and Al and to (1:1) clays. The dominance of Fe-P fraction of soil alone (T1) is related to lower pH, higher content of Fe, and the weathering processes of soils. These results corroborated findings on acidic soils where Fe-P contributed the largest proportion of inorganic P [94]. However, following the application of ERP, Ca-P in soils increased significantly because of the relatively high Ca in ERP. This result agrees with the studies of Hongqing et al. [93] and Hasbullah [95], who compared inorganic P speciation of soils with TSP and rock phosphate. The findings demonstrate that dissolution of water soluble fertiliser (TSP) in acidic soils produced Al-P and Fe-P, whereas the application of rock phosphate resulted in Ca-P. This occurs because of incomplete dissolution of rock phosphates. Additionally, the higher content of Ca-P in soils with ERP suggests that rock phosphate dissolved slowly to ensure that it supplies P steadily to plants compared with TSP, which dissolves rapidly. The increase in soil pH explains the low recovery of the Al-P and Fe-P fractions for the soil with ERP, charcoal, and sago bark ash. Moreover, the reduction in these fractions is believed to be associated with the precipitation of exchangeable and soluble Al and Fe as well as insoluble Al and Fe hydroxides on the negatively charged functional groups on charcoal’s surfaces. The increase in Occl-P for soil alone suggests that without the incorporation of soil amendments, the occlusion of adsorbed P becomes severe because more adsorbed P is physically encapsulated by secondary minerals such as Al and Fe oxyhydroxides, which are essentially inaccessible to plants because they are inert.

5. Conclusions

Co-application of charcoal and sago bark ash with ERP affects inorganic P speciation in soils. Calcium-bound P is more pronounced compared with Al-P and Fe-P in soils with ERP, charcoal, and sago bark ash because these soil amendments are able to increase soil pH, and at the same time, they reduce exchangeable acidity, exchangeable Al, and exchangeable Fe. Additionally, amending acidic soils with charcoal and sago bark ash improves the availability of base cations. Although soil Mehlich-P was not significantly improved with charcoal and sago bark ash, the fact that these soil amendments were able to reduce soil acidity indicates that P fixation by Al and Fe could be solved with the continued use of the amendments to build soil organic matter, which are reputed for improving soil available P with time. Therefore, the findings of this study suggest that the optimum rates of charcoal and sago bark ash to minimise P fixation by Al and Fe are 75% sago bark ash with 75%, 50%, and 25% charcoal. The use of sago bark ash at the rate of 100% is not recommended because it might increase soil salinity and sodicity. Incorporation of sago bark ash with charcoal is essential because charcoal has a high affinity for Al and Fe and its negatively charged surfaces can chelate Al and Fe to free the phosphate ions.

Author Contributions

Conceptualization, P.D.J.; data curation, A.M., L.O. and N.A.H.; formal analysis, P.D.J.; funding acquisition, O.H.A.; investigation, P.D.J.; methodology, O.H.A., A.M., L.O. and N.A.H.; project administration, O.H.A.; supervision, O.H.A., L.O. and N.A.H.; visualization, P.D.J.; writing—original draft, P.D.J.; writing—review and editing, O.H.A., A.M., L.O. and N.A.H. All authors have read and agreed to the published version of the manuscript.

Funding

This research was funded by Ministry of Higher Education, Malaysia with grant number [ERGS/1/11/STWN/UPM/02/65].

Institutional Review Board Statement

Not applicable.

Informed Consent Statement

Not applicable.

Data Availability Statement

The data presented in this study are available within the article.

Acknowledgments

The authors would like to acknowledge Ministry of Higher Education, Malaysia for financial assistance and Universiti Putra Malaysia for providing research facilities.

Conflicts of Interest

The authors declare no conflict of interest.

References

  1. Gichangi, E.M.; Mnkeni, P.N.S.; Muchaonyerwa, P. Phosphate sorption characteristics and external P requirements of selected South African soils. J. Agric. Rural Dev. Trop. Subtrop. 2008, 109, 139–149. [Google Scholar]
  2. Brady, N.C.; Weil, R.R. The Nature and Properties of Soils, 14th ed.; Pearson Prentice Hall: Upper Saddle River, NJ, USA, 2008; pp. 1–31. [Google Scholar]
  3. Meyer, J.B.; Frapolli, M.; Keel, C.; Maurhofer, M. Pyrroloquinoline quinone biosynthesis gene pqqC, a novel molecular marker for studying the phylogeny and diversity of phosphate-solubilizing pseudomonads. Appl. Environ. Microbiol. 2011, 77, 7345–7354. [Google Scholar] [CrossRef] [PubMed] [Green Version]
  4. Adnan, A.; Mavinic, D.S.; Koch, F.A. Pilot-scale study of phosphorus recovery through struvite crystallisation-examining to process feasibility. J. Environ. Eng. Sci. 2003, 2, 315–324. [Google Scholar] [CrossRef]
  5. Ch’ng, H.Y.; Ahmed, O.H.; Majid, N.M.A. Improving phosphorus availability in an acid soil using organic amendments produced from agroindustrial wastes. Sci. World J. 2014, 2014, 1–6. [Google Scholar] [CrossRef]
  6. Tsado, P.A.; Osunde, O.A.; Igwe, C.A.; Adeboye, M.K.A.; Lawal, B.A. Phosphorus sorption characteristics of some selected soil of the Nigerian Guinea Savanna. Int. J. Agric. Sci. 2012, 2, 613–618. [Google Scholar]
  7. Li, J.; Shi, Y.L.; Chen, Z.W. Research on phosphorus in southern red soils of China. Chin. J. Soil Sci. 2011, 42, 763–768. [Google Scholar]
  8. Chien, S.H.; Prochnow, L.I.; Tu, S.; Snyder, C.S. Agronomic and environmental aspects of phosphate fertilizers varying in source and solubility: An update review. Nutr. Cycl. Agroecosystems 2011, 89, 229–255. [Google Scholar] [CrossRef]
  9. Wang, Y.L.; Zhang, Y.H.; He, Y.Q. Effect of soil matrix components on phosphate sorption index in red soil. Acta Pedol. Sin. 2012, 49, 552–559. [Google Scholar]
  10. Troeh, F.R.; Thompson, L.M. Soils and Soil Fertility, 6th ed.; Blackwell: New York, NY, USA, 2005. [Google Scholar]
  11. Ch’ng, H.Y.; Ahmed, O.H.; Majid, N.M.A. Improving phosphorus availability, nutrient uptake and dry matter production of Zea mays L. on a tropical acid soil using poultry manure biochar and pineapple leaves compost. Exp. Agric. 2015, 52, 447–465. [Google Scholar] [CrossRef]
  12. Brady, N.C.; Weil, R.R. The Nature and Properties of Soils, 13th ed.; Pearson Education Inc: Upper Saddle River, NJ, USA, 2002. [Google Scholar]
  13. Hinsinger, P. Bioavailability of soil inorganic P in the rhizosphere as affected by root-induced chemical changes: A review. Plant Soil 2001, 237, 173–195. [Google Scholar] [CrossRef]
  14. Takeda, M.; Nakamoto, T.; Miyazawa, K.; Murayama, T.; Okada, H. Phosphorus availability and soil biological activity in an Andosol under compost application and winter cover cropping. Appl. Soil Ecol. 2009, 42, 86–95. [Google Scholar] [CrossRef]
  15. Rahman, Z.A.; Gikonyo, E.; Silek, B.; Goh, K.J.; Soltanghesis, A. Evaluation of phosphate rock sources and rate of application on oil palm yield grown on peat soils of Sarawak, Malaysia. J. Agron. 2014, 13, 12–22. [Google Scholar] [CrossRef] [Green Version]
  16. Elser, J.; Bennett, E. Phosphorus cycle: A broken biogeochemical cycle. Nature 2011, 478, 29–31. [Google Scholar] [CrossRef] [PubMed]
  17. Obersteiner, M.; Peñuelas, J.; Ciais, P.; van der Velde, M.; Janssens, I.A. The phosphorus trilemma. Nat. Geosci. 2013, 6, 897–898. [Google Scholar] [CrossRef]
  18. Roy, E.D.; Richards, P.D.; Martinelli, L.A.; Coletta, L.D.; Lins, S.R.M.; Vazquez, F.F.; Willig, E.; Spera, S.A.; VanWey, L.K.; Porder, S. The phosphorus cost of agricultural intensification in the tropics. Nat. Plants 2016, 2, 16043. [Google Scholar] [CrossRef] [PubMed]
  19. Zhou, Q.; Zhu, Y. Potential pollution and recommended critical levers of phosphorus in paddy soils of the southern Lake Tai area, China. Geoderma 2003, 115, 45–54. [Google Scholar] [CrossRef]
  20. Ruban, V.; Lopez-Sanchez, J.F.; Pardo, P.; Rauret, G.; Muntau, H.; Quevauviller, P.H. Selection and evaluation of sequential extraction procedures for the determination of phosphorus forms in lake sediments. J. Environ. Monit. 1999, 1, 51–56. [Google Scholar] [CrossRef]
  21. Sharpley, A.; Wang, X. Managing agricultural phosphorus for water quality: Lessons from the USA and China. J. Environ. Sci. 2014, 26, 1770–1782. [Google Scholar] [CrossRef]
  22. Vohla, C.; Kõiv, M.; Bavor, H.J.; Chazarenc, F.; Mander, Ü. Filter materials for phosphorus removal from wastewater in treatment wetlands-A review. Ecol. Eng. 2011, 37, 70–89. [Google Scholar] [CrossRef]
  23. Haynes, R.J.; Mokolobate, M.S. Amelioration of Al toxicity and P deficiency in acid soils by additions of organic residues: A critical review of the phenomenon and the mechanisms involved. Nutr. Cycl. Agroecosystems 2001, 59, 47–63. [Google Scholar] [CrossRef]
  24. Antoniadis, V.; Hatzis, F.; Bachtsevanidis, D.; Koutroubas, S.D. Phosphorus availability in low-P and acidic soils as affected by liming and P addition. Commun. Soil Sci. Plant Anal. 2015, 46, 1288–1298. [Google Scholar] [CrossRef]
  25. Parham, J.A.S.P.; Deng, S.; Raun, W.; Johnson, G. Long-term cattle manure application in soil. Biol. Fertil. Soils 2002, 35, 328–337. [Google Scholar] [CrossRef]
  26. Shamshuddin, J.; Daud, N.W. Classification and management of highly weathered soils in Malaysia for production of plantation crops. Princ. Appl. Assess. Soil Sci. 2011, 2011, 75–86. [Google Scholar] [CrossRef] [Green Version]
  27. Shamshuddin, J.; Fauziah, C.I.; Anda, M.; Kapok, J.; Shazana, M.A.R.S. Using ground basalt and/or organic fertilizer to enhance productivity of acid soils in Malaysia for crop production. Malays. J. Soil Sci. 2011, 15, 127–146. [Google Scholar]
  28. Myers, R.J.K.; De Pauw, E. Strategies for management of soil acidity. In Plant-Soil Interaction at Low pH: Principles and Management; Grundon, N.J., Raiment, G.E., Probert, M.E., Eds.; Springer: Dordrecht, The Netherlands, 1995; pp. 729–741. [Google Scholar]
  29. Shafie, S.M.; Othman, Z.; Hami, N. Potential utilisation of wood residue in Kedah: A preliminary study. J. Technol. Oper. Manag. 2017, 12, 60–69. [Google Scholar] [CrossRef]
  30. Hoi, W.K.; Razak, M.A.; Puad, E.; Azmi, M.H. Wood as a Potential Source of Energy. In Proceedings of the Conference of Forestry and Forest Products Research 90, Forest Research Institute Malaysia, Kepong, Selangor, Malaysia, 3 October 1990. [Google Scholar]
  31. Bujang, K. Potentials of bioenergy from the sago industries in Malaysia. In EOLSS-Encyclopedia of Life Support Systems; Doelle, H.W., Rokem, S., Berovic, M., Eds.; EOLSS Publisher: Oxford, UK, 2006; pp. 124–131. [Google Scholar]
  32. Singhal, R.S.; Kennedy, J.F.; Gopalakrishnan, S.M.; Kaczmarek, A.; Knill, C.J.; Akmar, P.F. Industrial production, processing, and utilization of sago palm-derived products. Carbohydr. Polym. 2008, 72, 1–20. [Google Scholar] [CrossRef]
  33. Vikineswary, S.; Shim, Y.L.; Thambirajah, J.J.; Blakebrough, N. Possible microbial utilization of sago processing wastes. Resour. Conserv. Recycl. 1994, 11, 289–296. [Google Scholar] [CrossRef]
  34. Wahi, R.; Abdullah, L.C.; Mobarekeh, M.N.; Ngaini, Z.; Yaw, T.C.S. Utilization of esterified sago bark fibre waste for removal of oil from palm oil mill effluent. J. Environ. Chem. Eng. 2017, 5, 170–177. [Google Scholar] [CrossRef]
  35. Amin, N.; Sabli, N.M.; Izhar, S.; Yoshida, H. Sago Wastes and Its Applications. Pertanika J. Sci. Technol. 2019, 27, 1841–1862. [Google Scholar]
  36. Ch’ng, H.Y. Phosphorus Management for Tropical Acid Soils Using Amendments from Agro-Industrial Wastes. Ph.D. Thesis, Universiti Putra Malaysia, Serdang, Selangor, Malaysia, 2015. [Google Scholar]
  37. Ohno, T.; Amirbahman, A. Phosphorus availability in boreal forest soils: A geochemical and nutrient uptake modeling approach. Geoderma 2010, 155, 46–54. [Google Scholar] [CrossRef]
  38. Ohno, T.; Fernandez, I.J.; Hiradate, S.; Sherman, J.F. Effects of soil acidification and forest type on water soluble soil organic matter properties. Geoderma 2007, 140, 176–187. [Google Scholar] [CrossRef]
  39. Chen, Q.; Zhang, X.; Zhang, H.; Christie, P.; Li, X.; Horlacher, D.; Liebig, H.P. Evaluation of current fertilizer practice and soil fertility in vegetable production in the Beijing region. Nutr. Cycl. Agroecosystems 2004, 69, 51–58. [Google Scholar] [CrossRef] [Green Version]
  40. Imbufe, A.U.; Patti, A.F.; Burrow, D.; Surapaneni, A.; Jackson, W.R.; Milner, A.D. Effects of potassium humate on aggregate stability of two soils from Victoria, Australia. Geoderma 2005, 125, 321–330. [Google Scholar] [CrossRef]
  41. Galinato, S.; Yoder, J.; Granatstein, D. The economic value of biochar in crop production and carbon sequestration. Energy Policy 2011, 39, 6344–6350. [Google Scholar] [CrossRef]
  42. Lehmann, J. A handful of carbon. Nature 2007, 447, 143–144. [Google Scholar] [CrossRef]
  43. DeLuca, T.H.; Aplet, G.H. Charcoal and carbon storage in forest soils of the Rocky Mountain West. Front. Ecol. Environ. 2008, 6, 18–24. [Google Scholar] [CrossRef]
  44. Ogawa, M. Rehabilitation of Pine with Charcoal and Mycorrhiza; Chikushishokan Publishing: Tokyo, Japan, 2007. [Google Scholar]
  45. Herrmann, S.; Oelmuller, R.; Buscot, F. Manipulation of the onset of ectomycorrhiza formation by indole-2-acetic acid, activated charcoal or relative humidity in the association between oak micocuttings and Piloderma croceum: Influence on plant development and photosynthesis. J. Plant Physiol. 2004, 161, 509–517. [Google Scholar] [CrossRef] [Green Version]
  46. Topoliantz, S.; Ponge, J.F.; Ballof, S. Manioc peel and charcoal: A potential organic amendment for sustainable soil fertility in the tropics. Biol. Fertil. Soils 2005, 41, 15–21. [Google Scholar] [CrossRef] [Green Version]
  47. Rutto, K.L.; Mizutani, F. Effect of mycorrhizal inoculation and activated charcoal on growth and nutrition in peach (Prunus perisica Batsch) seedlings treated with peach root-bark extracts. J. Jpn. Soc. Hortic. Sci. 2006, 75, 463–468. [Google Scholar] [CrossRef]
  48. Warnock, D.D.; Lehmann, J.; Kuypern, T.W.; Rilling, M.C. Mycorrhizal response to charcoal in soil-concepts and mechanisms. Plant Soil 2007, 300, 9–20. [Google Scholar] [CrossRef]
  49. Grogan, P.J.; Baar, T.; Bruns, D. Below-ground ectomycorrhizal community structure in a recently burned bishop pine forest. J. Ecol. 2000, 88, 1051–1062. [Google Scholar] [CrossRef] [Green Version]
  50. Glaser, B.; Lehmann, J.; Zesh, W. Ameliorating physical and chemical properties of highly weathered soils in the tropics with charcoal-a review. Biol. Fertil. Soil 2002, 35, 219–230. [Google Scholar] [CrossRef]
  51. Lehmann, J.; da Silva, J.P., Jr.; Rondon, M.; Cravo, M.D.S.; Greenwood, J.; Nehls, T.; Steiner, C.; Glaser, B. Slash-and-char-a feasible alternative for soil fertility management in the central Amazon. In Proceedings of the 17th World Congress of Soil Science, Bangkok, Thailand, 14 August 2002. [Google Scholar]
  52. Tryon, E.H. Effect of charcoal on certain physical, chemical, and biological properties of forest soils. Ecol. Monogr. 1948, 18, 81–115. [Google Scholar] [CrossRef]
  53. Etiegni, L.; Campbell, A.G. Physical and chemical characteristics of wood ash. Bioresour. Technol. 1991, 37, 173–178. [Google Scholar] [CrossRef]
  54. Ohno, T. Neutralization of soil acidity and release of phosphorus and potassium by wood ash. J. Environ. Qual. 1992, 21, 433–438. [Google Scholar] [CrossRef]
  55. Demeyer, A.; Nkana, J.V.; Verloo, M. Characteristics of wood ash influence on soil properties and nutrient uptake: An overview. Bioresour. Technol. 2001, 77, 287–295. [Google Scholar] [CrossRef]
  56. Khanna, P.K.; Raison, R.J.; Falkiner, R.A. Chemical properties of ash derived from Eucalyptus litter and its effects on forest soils. For. Ecol. Manag. 1994, 66, 107–125. [Google Scholar] [CrossRef]
  57. Ludwig, B.; Rumpf, S.; Mindrup, M.; Meiwes, K.J.; Khanna, P.K. Effects of lime and wood ash on soilsolution chemistry, soil chemistry and nutritional status of a pine stand in northern Germany. Scand. J. For. Res. 2002, 17, 225–237. [Google Scholar] [CrossRef]
  58. Saarsalmi, A.; Mälkönen, E.; Piirainen, S. Effects of wood ash fertilization on forest soil chemical properties. Silva. Fenn. 2001, 35, 355–368. [Google Scholar] [CrossRef] [Green Version]
  59. Ferriero, A.; Merino, A.; Diaz, N.; Pineiro, J. Improving the effectiveness of wood-ash fertilization in mixed mountain pastures. Grass Forage Sci. 2011, 66, 337–350. [Google Scholar] [CrossRef]
  60. Dixon, R.K.; Wisniewski, J. Global forest systems: An uncertain response to atmospheric pollutants and global climate change. Water Air Soil Pollut. 1995, 85, 101–110. [Google Scholar] [CrossRef]
  61. Bouyoucos, G.J. Hydrometer method improved for making particle size analysis of soils. Agron. J. 1962, 54, 464–465. [Google Scholar] [CrossRef]
  62. Peech, H.M. Hydrogen-ion Activity. In Methods of Soil Analysis Chemical and Microbiological Properties; Black, C.A., Evans, D.D., White, J.L., Ensminger, L.E., Clark, F.E., Eds.; American Society of Agronomy: Madison, WI, USA, 1965; pp. 914–926. [Google Scholar]
  63. Chefetz, B.; Hatcher, P.H.; Hadar, Y.; Chen, Y. Chemical and biological characterization of organic matter during composting of municipal solid waste. J. Environ. Qual. 1996, 25, 776–785. [Google Scholar] [CrossRef]
  64. Bremner, J.M. Total Nitrogen. In Methods of Soil Analysis: Part 2; Black, C.A., Evans, D.D., Ensminger, L.E., White, J.L., Clark, F.F., Dinauer, R.C., Eds.; American Society of Agronomy: Madison, WI, USA, 1965; pp. 1149–1178. [Google Scholar]
  65. Cottenie, A. Soil testing and plant testing as a basis of fertilizer recommendation. FAO Soils Bull. 1980, 38, 70–73. [Google Scholar]
  66. Rowell, D.L. Soil Science: Methods and Application; Longman Publishers Ltd.: London, UK, 1994; p. 169. [Google Scholar]
  67. Bernas, B. New method for decomposition and comprehensive analysis of silicates by atomic absorption spectrometry. Anal. Chem. 1968, 40, 1682–1686. [Google Scholar] [CrossRef]
  68. Mehlich, A. Determination of P, Ca, Mg, K, Na and NH4. Short Test Methods Used in Soil Testing Division; Department of Agriculture: Raleigh, NC, USA, 1953. [Google Scholar]
  69. Kuo, S. Phosphorus. In Methods of soil analysis. Part 3: Chemical Methods; Sparks, D.L., Ed.; The American Society of Anesthesiologists, Soil Science Society of America: Madison, WI, USA, 1996; pp. 869–920. [Google Scholar]
  70. Murphy, J.; Riley, J.P. A modified single solution method for the determination of phosphate in natural waters. Anal. Chim. Acta 1962, 27, 31–36. [Google Scholar] [CrossRef]
  71. Paramananthan, S. Soil of Malaysia: Their Characteristics and Identification; Academy of Sciences Malaysia: Kuala Lumpur, Malaysia, 2000; Volume 1, pp. 11–125. [Google Scholar]
  72. Malaysian Agricultural Research and Development Institute (MARDI). Jagung Manis Baru, Masmadu [New Sweet Corn, Masmadu]; Malaysian Agricultural Research and Development: Serdang, Selangor, Malaysia, 1993; pp. 3–5. [Google Scholar]
  73. Free, H.F.; McGill, C.R.; Rowarth, J.S.; Hedley, M.J. The effect of biochars on maize (Zea mays) germination. N. Z. J. Agric. Res. 2010, 53, 1–4. [Google Scholar] [CrossRef]
  74. Ndor, E.; Dauda, S.N.; Azagaku, E.D. Response of maize varieties (Zea mays) to biochar amended soil in Lafia, Nigeria. J. Exp. Agric. Int. 2015, 5, 525–531. [Google Scholar] [CrossRef]
  75. Mandre, M.; Pärn, H.; Ots, K. Short-term effects of wood ash on the soil and the lignin concentration and growth of Pinus sylvestris L. For. Ecol. Manag. 2006, 223, 349–357. [Google Scholar] [CrossRef]
  76. Ozolincius, R.; Buozyte, R.; Varnagiryte, K.I. Wood ash and nitrogen influence on ground vegetation cover and chemical composition. Biomass Bioenergy 2007, 31, 710–716. [Google Scholar] [CrossRef]
  77. Perucci, P.; Monaci, E.; Onofri, A.; Vischetti, C.; Casucci, C. Changes in physico-chemical and biochemical parameters of soil following addition of wood ash: A field experiment. Eur. J. Agron. 2008, 28, 155–161. [Google Scholar] [CrossRef]
  78. Hasbullah, N.A.; Ahmed, O.H.; Ab Majid, N.M. Effects of Amending Phosphatic Fertilizers with Clinoptilolite Zeolite on Phosphorus Availability and Its Fractionation in an Acid Soil. Appl. Sci. 2020, 10, 3162. [Google Scholar] [CrossRef]
  79. Bidin, A. Phosphorus utilization in rainfed agriculture in Malaysia. In Proceedings of the Second IMPHOS Regional Seminar: Southern Asia, Fertility Association of India, New Delhi, India, 26–30 August 1986; pp. 161–172. [Google Scholar]
  80. Phounglamcheik, A.; Wang, L.; Romar, H.; Kienzl, N.; Broström, M.; Ramser, K.; Skreiberg, Ø.; Umeki, K. Effects of Pyrolysis conditions and feedstocks on the properties and gasification reactivity of charcoal from woodchips. Energy Fuels 2020, 34, 8353–8365. [Google Scholar] [CrossRef]
  81. Phonphuak, N.; Thiansem, S. Effects of charcoal on physical and mechanical properties of fired test briquettes. Sci. Asia 2011, 37, 120–124. [Google Scholar] [CrossRef]
  82. Asap, A.; Haruna, A.O.; Majid, N.M.A.; Ali, M. Amending triple superphosphate with chicken litter biochar improves phosphorus availability. Eurasian J. Soil Sci. 2018, 7, 121–132. [Google Scholar] [CrossRef]
  83. Ch’ng, H.Y.; Sanusi, S.; Othman, S.B. Effect of Christmas Island rock phosphate and rice straw compost application on soil phosphorus availability and maize (Zea mays L.) growth in a tropical acid soil of Kelantan, Malaysia. Open Agric. 2020, 5, 150–158. [Google Scholar] [CrossRef]
  84. Saarsalmi, A.; Mälkönen, E.; Kukkola, M. Effect of wood ash fertilization on soil chemical properties and stand nutrient status and growth of some coniferous stands in Finland. Scand. J. For. Res. 2004, 19, 217–233. [Google Scholar] [CrossRef]
  85. Ohno, T.; Erich, M.S. Effect of wood ash application on soil pH and soil test nutrient levels. Agric. Ecosyst. Environ. 1990, 32, 223–239. [Google Scholar] [CrossRef]
  86. Meiwes, K.J. Application of lime and wood ash to decrease acidification of forest soils. Water Air Soil Pollut. 1995, 85, 143–152. [Google Scholar] [CrossRef]
  87. Ch’ng, H.Y.; Haruna, A.O.; Majid, N.M.N.A.; Jalloh, M.B. Improving soil phosphorus availability and yield of Zea mays L. using biochar and compost derived from agro-industrial wastes. Ital. J. Agron. 2019, 14, 34–42. [Google Scholar] [CrossRef] [Green Version]
  88. Sanusi, S.; Ch’ng, H.Y.; Othman, S. Effects of incubation period and Christmas Island rock phosphate with different rate of rice straw compost on phosphorus availability in acid soil. AIMS Agric. Food 2018, 3, 384–396. [Google Scholar] [CrossRef]
  89. Noack, S.R.; McLaughlin, M.J.; Smernik, R.J.; McBeath, T.M.; Armstrong, R.D. Phosphorus speciation in mature wheat and canola plants as affected by phosphorus supply. Plant. Soil 2014, 378, 125–137. [Google Scholar] [CrossRef]
  90. Penn, C.J.; Camberato, J.J. A critical review on soil chemical processes that control how soil pH affects phosphorus availability to plants. Agriculture 2019, 9, 120. [Google Scholar] [CrossRef] [Green Version]
  91. Erich, M.S.; Ohno, T. Phosphorus availability to corn from wood ash-amended soils. Water Air Soil Pollut. 1992, 64, 475–485. [Google Scholar] [CrossRef]
  92. Erich, M.S. Agronomic effectiveness of wood ash as a source of phosphorus and potassium. Am. Soc. Agron. Crop. Sci. Soc. Am. Soil Sci. Soc. Am. 1991, 20, 576–581. [Google Scholar] [CrossRef]
  93. Hongqing, H.; Chunying, T.; Chongfa, C.; Jizheng, H.; Xueyuan, L. Availability and residual effects of phosphate rocks and inorganic P fractionation in a red soil of Central China. Nutr. Cycl. Agroecosystems 2001, 59, 251–258. [Google Scholar] [CrossRef]
  94. Hasbullah, N.A.; Osumanu, H.A.; Nik, M. Effects of Clinoptilolite zeolite on phosphorus dynamics and yield of Zea mays L. cultivated on an acid soil. PLoS ONE 2018, 13, e0204401. [Google Scholar] [CrossRef]
  95. Hasbullah, N.A. Use of Clinoptilolite Zeolite to Improve Efficiency of Phosphorus Use in Acid Soils. Ph.D. Thesis, Universiti Putra Malaysia, Serdang, Selangor, Malaysia, 2016. [Google Scholar]
Figure 1. Aerial view of location where soil was sampled for incubation study in Universiti Putra Malaysia Bintulu Sarawak Campus, Malaysia.
Agronomy 11 01803 g001
Figure 2. Effects of treatments on soil total carbon after thirty, sixty, and ninety days of incubation, where T1: soil alone, T2: Egypt rock phosphate alone, T3: Egypt rock phosphate + 100% charcoal, T4: Egypt rock phosphate + 100% sago bark ash, and T5: Egypt rock phosphate + 100% charcoal + 100% sago bark ash, T6: Egypt rock phosphate + 75% charcoal + 75% sago bark ash, T7: Egypt rock phosphate + 50% charcoal + 75% sago bark ash, T8: Egypt rock phosphate + 25% charcoal + 75% sago bark ash, T9: Egypt rock phosphate + 75% charcoal + 50% sago bark ash, T10: Egypt rock phosphate + 50% charcoal + 50% sago bark ash, T11: Egypt rock phosphate + 25% charcoal + 50% sago bark ash, T12: Egypt rock phosphate + 75% charcoal + 25% sago bark ash, T13: Egypt rock phosphate + 50% charcoal + 25% sago bark ash, and T14: Egypt rock phosphate + 25% charcoal + 25% sago bark ash. Means with different letter(s) within the same incubation period indicate significant differences between treatments according to Tukey’s HSD test at p ≤ 0.05, i.e., a > b > c. Bars represent the mean values ± SE.
Agronomy 11 01803 g002
Figure 3. Effects of treatments on soil pH in water after thirty, sixty, and ninety days of incubation, where T1: soil alone, T2: Egypt rock phosphate alone, T3: Egypt rock phosphate + 100% charcoal, T4: Egypt rock phosphate + 100% sago bark ash, and T5: Egypt rock phosphate + 100% charcoal + 100% sago bark ash, T6: Egypt rock phosphate + 75% charcoal + 75% sago bark ash, T7: Egypt rock phosphate + 50% charcoal + 75% sago bark ash, T8: Egypt rock phosphate + 25% charcoal + 75% sago bark ash, T9: Egypt rock phosphate + 75% charcoal + 50% sago bark ash, T10: Egypt rock phosphate + 50% charcoal + 50% sago bark ash, T11: Egypt rock phosphate + 25% charcoal + 50% sago bark ash, T12: Egypt rock phosphate + 75% charcoal + 25% sago bark ash, T13: Egypt rock phosphate + 50% charcoal + 25% sago bark ash, and T14: Egypt rock phosphate + 25% charcoal + 25% sago bark ash. Means with different letter(s) within the same incubation period indicate significant differences between treatments according to Tukey’s HSD test at p ≤ 0.05, i.e., a > b > c. Bars represent the mean values ± SE.
Agronomy 11 01803 g003
Figure 4. Effects of treatments on soil pH in potassium chloride after thirty, sixty, and ninety days of incubation, where T1: soil alone, T2: Egypt rock phosphate alone, T3: Egypt rock phosphate + 100% charcoal, T4: Egypt rock phosphate + 100% sago bark ash, and T5: Egypt rock phosphate + 100% charcoal + 100% sago bark ash, T6: Egypt rock phosphate + 75% charcoal + 75% sago bark ash, T7: Egypt rock phosphate + 50% charcoal + 75% sago bark ash, T8: Egypt rock phosphate + 25% charcoal + 75% sago bark ash, T9: Egypt rock phosphate + 75% charcoal + 50% sago bark ash, T10: Egypt rock phosphate + 50% charcoal + 50% sago bark ash, T11: Egypt rock phosphate + 25% charcoal + 50% sago bark ash, T12: Egypt rock phosphate + 75% charcoal + 25% sago bark ash, T13: Egypt rock phosphate + 50% charcoal + 25% sago bark ash, and T14: Egypt rock phosphate + 25% charcoal + 25% sago bark ash. Means with different letter(s) within the same incubation period indicate significant differences between treatments according to Tukey’s HSD test at p ≤ 0.05, i.e., a > b > c. Bars represent the mean values ± SE.
Agronomy 11 01803 g004
Figure 5. Effects of treatments on soil exchangeable acidity after thirty, sixty, and ninety days of incubation, where T1: soil alone, T2: Egypt rock phosphate alone, T3: Egypt rock phosphate + 100% charcoal, T4: Egypt rock phosphate + 100% sago bark ash, and T5: Egypt rock phosphate + 100% charcoal + 100% sago bark ash, T6: Egypt rock phosphate + 75% charcoal + 75% sago bark ash, T7: Egypt rock phosphate + 50% charcoal + 75% sago bark ash, T8: Egypt rock phosphate + 25% charcoal + 75% sago bark ash, T9: Egypt rock phosphate + 75% charcoal + 50% sago bark ash, T10: Egypt rock phosphate + 50% charcoal + 50% sago bark ash, T11: Egypt rock phosphate + 25% charcoal + 50% sago bark ash, T12: Egypt rock phosphate + 75% charcoal + 25% sago bark ash, T13: Egypt rock phosphate + 50% charcoal + 25% sago bark ash, and T14: Egypt rock phosphate + 25% charcoal + 25% sago bark ash.. Means with different letter(s) within the same incubation period indicate significant differences between treatments according to Tukey’s HSD test at p ≤ 0.05, i.e., a > b > c. Bars represent the mean values ± SE.
Agronomy 11 01803 g005
Figure 6. Effects of treatments on soil exchangeable aluminium ions after thirty, sixty, and ninety days of incubation, where T1: soil alone, T2: Egypt rock phosphate alone, T3: Egypt rock phosphate + 100% charcoal, T4: Egypt rock phosphate + 100% sago bark ash, and T5: Egypt rock phosphate + 100% charcoal + 100% sago bark ash, T6: Egypt rock phosphate + 75% charcoal + 75% sago bark ash, T7: Egypt rock phosphate + 50% charcoal + 75% sago bark ash, T8: Egypt rock phosphate + 25% charcoal + 75% sago bark ash, T9: Egypt rock phosphate + 75% charcoal + 50% sago bark ash, T10: Egypt rock phosphate + 50% charcoal + 50% sago bark ash, T11: Egypt rock phosphate + 25% charcoal + 50% sago bark ash, T12: Egypt rock phosphate + 75% charcoal + 25% sago bark ash, T13: Egypt rock phosphate + 50% charcoal + 25% sago bark ash, and T14: Egypt rock phosphate + 25% charcoal + 25% sago bark ash.. Means with different letter(s) within the same incubation period indicate significant differences between treatments according to Tukey’s HSD test at p ≤ 0.05, i.e., a > b > c. Bars represent the mean values ± SE.
Agronomy 11 01803 g006
Figure 7. Effects of treatments on soil exchangeable hydrogen ions after thirty, sixty, and ninety days of incubation, where T1: soil alone, T2: Egypt rock phosphate alone, T3: Egypt rock phosphate + 100% charcoal, T4: Egypt rock phosphate + 100% sago bark ash, and T5: Egypt rock phosphate + 100% charcoal + 100% sago bark ash, T6: Egypt rock phosphate + 75% charcoal + 75% sago bark ash, T7: Egypt rock phosphate + 50% charcoal + 75% sago bark ash, T8: Egypt rock phosphate + 25% charcoal + 75% sago bark ash, T9: Egypt rock phosphate + 75% charcoal + 50% sago bark ash, T10: Egypt rock phosphate + 50% charcoal + 50% sago bark ash, T11: Egypt rock phosphate + 25% charcoal + 50% sago bark ash, T12: Egypt rock phosphate + 75% charcoal + 25% sago bark ash, T13: Egypt rock phosphate + 50% charcoal + 25% sago bark ash, and T14: Egypt rock phosphate + 25% charcoal + 25% sago bark ash. Means with different letter(s) within the same incubation period indicate significant differences between treatments according to Tukey’s HSD test at p ≤ 0.05, i.e., a > b > c. Bars represent the mean values ± SE.
Agronomy 11 01803 g007
Figure 8. Effects of treatments on soil exchangeable ferrous ions after thirty, sixty, and ninety days of incubation, where T1: soil alone, T2: Egypt rock phosphate alone, T3: Egypt rock phosphate + 100% charcoal, T4: Egypt rock phosphate + 100% sago bark ash, and T5: Egypt rock phosphate + 100% charcoal + 100% sago bark ash, T6: Egypt rock phosphate + 75% charcoal + 75% sago bark ash, T7: Egypt rock phosphate + 50% charcoal + 75% sago bark ash, T8: Egypt rock phosphate + 25% charcoal + 75% sago bark ash, T9: Egypt rock phosphate + 75% charcoal + 50% sago bark ash, T10: Egypt rock phosphate + 50% charcoal + 50% sago bark ash, T11: Egypt rock phosphate + 25% charcoal + 50% sago bark ash, T12: Egypt rock phosphate + 75% charcoal + 25% sago bark ash, T13: Egypt rock phosphate + 50% charcoal + 25% sago bark ash, and T14: Egypt rock phosphate + 25% charcoal + 25% sago bark ash. Means with different letter(s) within the same incubation period indicate significant differences between treatments according to Tukey’s HSD test at p ≤ 0.05, i.e., a > b > c. Bars represent the mean values ± SE.
Agronomy 11 01803 g008
Figure 9. Effects of treatments on soil exchangeable potassium ions after thirty, sixty, and ninety days of incubation, where T1: soil alone, T2: Egypt rock phosphate alone, T3: Egypt rock phosphate + 100% charcoal, T4: Egypt rock phosphate + 100% sago bark ash, and T5: Egypt rock phosphate + 100% charcoal + 100% sago bark ash, T6: Egypt rock phosphate + 75% charcoal + 75% sago bark ash, T7: Egypt rock phosphate + 50% charcoal + 75% sago bark ash, T8: Egypt rock phosphate + 25% charcoal + 75% sago bark ash, T9: Egypt rock phosphate + 75% charcoal + 50% sago bark ash, T10: Egypt rock phosphate + 50% charcoal + 50% sago bark ash, T11: Egypt rock phosphate + 25% charcoal + 50% sago bark ash, T12: Egypt rock phosphate + 75% charcoal + 25% sago bark ash, T13: Egypt rock phosphate + 50% charcoal + 25% sago bark ash, and T14: Egypt rock phosphate + 25% charcoal + 25% sago bark ash. Means with different letter(s) within the same incubation period indicate significant differences between treatments according to Tukey’s HSD test at p ≤ 0.05, i.e., a > b > c. Bars represent the mean values ± SE.
Agronomy 11 01803 g009
Figure 10. Effects of treatments on soil exchangeable calcium ions after thirty, sixty, and ninety days of incubation, where T1: soil alone, T2: Egypt rock phosphate alone, T3: Egypt rock phosphate + 100% charcoal, T4: Egypt rock phosphate + 100% sago bark ash, and T5: Egypt rock phosphate + 100% charcoal + 100% sago bark ash, T6: Egypt rock phosphate + 75% charcoal + 75% sago bark ash, T7: Egypt rock phosphate + 50% charcoal + 75% sago bark ash, T8: Egypt rock phosphate + 25% charcoal + 75% sago bark ash, T9: Egypt rock phosphate + 75% charcoal + 50% sago bark ash, T10: Egypt rock phosphate + 50% charcoal + 50% sago bark ash, T11: Egypt rock phosphate + 25% charcoal + 50% sago bark ash, T12: Egypt rock phosphate + 75% charcoal + 25% sago bark ash, T13: Egypt rock phosphate + 50% charcoal + 25% sago bark ash, and T14: Egypt rock phosphate + 25% charcoal + 25% sago bark ash. Means with different letter(s) within the same incubation period indicate significant differences between treatments according to Tukey’s HSD test at p ≤ 0.05, i.e., a > b > c. Bars represent the mean values ± SE.
Agronomy 11 01803 g010
Figure 11. Effects of treatments on soil exchangeable magnesium ions after thirty, sixty, and ninety days of incubation, where T1: soil alone, T2: Egypt rock phosphate alone, T3: Egypt rock phosphate + 100% charcoal, T4: Egypt rock phosphate + 100% sago bark ash, and T5: Egypt rock phosphate + 100% charcoal + 100% sago bark ash, T6: Egypt rock phosphate + 75% charcoal + 75% sago bark ash, T7: Egypt rock phosphate + 50% charcoal + 75% sago bark ash, T8: Egypt rock phosphate + 25% charcoal + 75% sago bark ash, T9: Egypt rock phosphate + 75% charcoal + 50% sago bark ash, T10: Egypt rock phosphate + 50% charcoal + 50% sago bark ash, T11: Egypt rock phosphate + 25% charcoal + 50% sago bark ash, T12: Egypt rock phosphate + 75% charcoal + 25% sago bark ash, T13: Egypt rock phosphate + 50% charcoal + 25% sago bark ash, and T14: Egypt rock phosphate + 25% charcoal + 25% sago bark ash. Means with different letter(s) within the same incubation period indicate significant differences between treatments according to Tukey’s HSD test at p ≤ 0.05, i.e., a > b > c. Bars represent the mean values ± SE.
Agronomy 11 01803 g011
Figure 12. Effects of treatments on soil exchangeable sodium ions after thirty, sixty, and ninety days of incubation, where T1: soil alone, T2: Egypt rock phosphate alone, T3: Egypt rock phosphate + 100% charcoal, T4: Egypt rock phosphate + 100% sago bark ash, and T5: Egypt rock phosphate + 100% charcoal + 100% sago bark ash, T6: Egypt rock phosphate + 75% charcoal + 75% sago bark ash, T7: Egypt rock phosphate + 50% charcoal + 75% sago bark ash, T8: Egypt rock phosphate + 25% charcoal + 75% sago bark ash, T9: Egypt rock phosphate + 75% charcoal + 50% sago bark ash, T10: Egypt rock phosphate + 50% charcoal + 50% sago bark ash, T11: Egypt rock phosphate + 25% charcoal + 50% sago bark ash, T12: Egypt rock phosphate + 75% charcoal + 25% sago bark ash, T13: Egypt rock phosphate + 50% charcoal + 25% sago bark ash, and T14: Egypt rock phosphate + 25% charcoal + 25% sago bark ash.. Means with different letter(s) within the same incubation period indicate significant differences between treatments according to Tukey’s HSD test at p ≤ 0.05, i.e., a > b > c. Bars represent the mean values ± SE.
Agronomy 11 01803 g012
Figure 13. Effects of treatments on soil cation exchange capacity after thirty, sixty, and ninety days of incubation, where T1: soil alone, T2: Egypt rock phosphate alone, T3: Egypt rock phosphate + 100% charcoal, T4: Egypt rock phosphate + 100% sago bark ash, and T5: Egypt rock phosphate + 100% charcoal + 100% sago bark ash, T6: Egypt rock phosphate + 75% charcoal + 75% sago bark ash, T7: Egypt rock phosphate + 50% charcoal + 75% sago bark ash, T8: Egypt rock phosphate + 25% charcoal + 75% sago bark ash, T9: Egypt rock phosphate + 75% charcoal + 50% sago bark ash, T10: Egypt rock phosphate + 50% charcoal + 50% sago bark ash, T11: Egypt rock phosphate + 25% charcoal + 50% sago bark ash, T12: Egypt rock phosphate + 75% charcoal + 25% sago bark ash, T13: Egypt rock phosphate + 50% charcoal + 25% sago bark ash, and T14: Egypt rock phosphate + 25% charcoal + 25% sago bark ash. Means with different letter(s) within the same incubation period indicate significant differences between treatments according to Tukey’s HSD test at p ≤ 0.05, i.e., a > b > c. Bars represent the mean values ± SE.
Agronomy 11 01803 g013
Figure 14. Effects of treatments on soil total phosphorus after thirty, sixty, and ninety days of incubation, where T1: soil alone, T2: Egypt rock phosphate alone, T3: Egypt rock phosphate + 100% charcoal, T4: Egypt rock phosphate + 100% sago bark ash, and T5: Egypt rock phosphate + 100% charcoal + 100% sago bark ash, T6: Egypt rock phosphate + 75% charcoal + 75% sago bark ash, T7: Egypt rock phosphate + 50% charcoal + 75% sago bark ash, T8: Egypt rock phosphate + 25% charcoal + 75% sago bark ash, T9: Egypt rock phosphate + 75% charcoal + 50% sago bark ash, T10: Egypt rock phosphate + 50% charcoal + 50% sago bark ash, T11: Egypt rock phosphate + 25% charcoal + 50% sago bark ash, T12: Egypt rock phosphate + 75% charcoal + 25% sago bark ash, T13: Egypt rock phosphate + 50% charcoal + 25% sago bark ash, and T14: Egypt rock phosphate + 25% charcoal + 25% sago bark ash. Means with different letter(s) within the same incubation period indicate significant differences between treatments according to Tukey’s HSD test at p ≤ 0.05, i.e., a > b > c. Bars represent the mean values ± SE.
Agronomy 11 01803 g014
Figure 15. Effects of treatments on soil Mehlich-phosphorus after thirty, sixty, and ninety days of incubation, where T1: soil alone, T2: Egypt rock phosphate alone, T3: Egypt rock phosphate + 100% charcoal, T4: Egypt rock phosphate + 100% sago bark ash, and T5: Egypt rock phosphate + 100% charcoal + 100% sago bark ash, T6: Egypt rock phosphate + 75% charcoal + 75% sago bark ash, T7: Egypt rock phosphate + 50% charcoal + 75% sago bark ash, T8: Egypt rock phosphate + 25% charcoal + 75% sago bark ash, T9: Egypt rock phosphate + 75% charcoal + 50% sago bark ash, T10: Egypt rock phosphate + 50% charcoal + 50% sago bark ash, T11: Egypt rock phosphate + 25% charcoal + 50% sago bark ash, T12: Egypt rock phosphate + 75% charcoal + 25% sago bark ash, T13: Egypt rock phosphate + 50% charcoal + 25% sago bark ash, and T14: Egypt rock phosphate + 25% charcoal + 25% sago bark ash. Means with different letter(s) within the same incubation period indicate significant differences between treatments according to Tukey’s HSD test at p ≤ 0.05, i.e., a > b > c. Bars represent the mean values ± SE.
Agronomy 11 01803 g015
Figure 16. Effects of treatments on loosely soluble phosphorus after thirty, sixty, and ninety days of incubation, where T1: soil alone, T2: Egypt rock phosphate alone, T3: Egypt rock phosphate + 100% charcoal, T4: Egypt rock phosphate + 100% sago bark ash, and T5: Egypt rock phosphate + 100% charcoal + 100% sago bark ash, T6: Egypt rock phosphate + 75% charcoal + 75% sago bark ash, T7: Egypt rock phosphate + 50% charcoal + 75% sago bark ash, T8: Egypt rock phosphate + 25% charcoal + 75% sago bark ash, T9: Egypt rock phosphate + 75% charcoal + 50% sago bark ash, T10: Egypt rock phosphate + 50% charcoal + 50% sago bark ash, T11: Egypt rock phosphate + 25% charcoal + 50% sago bark ash, T12: Egypt rock phosphate + 75% charcoal + 25% sago bark ash, T13: Egypt rock phosphate + 50% charcoal + 25% sago bark ash, and T14: Egypt rock phosphate + 25% charcoal + 25% sago bark ash. Means with different letter(s) within the same incubation period indicate significant differences between treatments according to Tukey’s HSD test at p ≤ 0.05, i.e., a > b > c. Bars represent the mean values ± SE.
Agronomy 11 01803 g016
Figure 17. Effects of treatments on aluminium-bound phosphorus after thirty, sixty, and ninety days of incubation, where T1: soil alone, T2: Egypt rock phosphate alone, T3: Egypt rock phosphate + 100% charcoal, T4: Egypt rock phosphate + 100% sago bark ash, and T5: Egypt rock phosphate + 100% charcoal + 100% sago bark ash, T6: Egypt rock phosphate + 75% charcoal + 75% sago bark ash, T7: Egypt rock phosphate + 50% charcoal + 75% sago bark ash, T8: Egypt rock phosphate + 25% charcoal + 75% sago bark ash, T9: Egypt rock phosphate + 75% charcoal + 50% sago bark ash, T10: Egypt rock phosphate + 50% charcoal + 50% sago bark ash, T11: Egypt rock phosphate + 25% charcoal + 50% sago bark ash, T12: Egypt rock phosphate + 75% charcoal + 25% sago bark ash, T13: Egypt rock phosphate + 50% charcoal + 25% sago bark ash, and T14: Egypt rock phosphate + 25% charcoal + 25% sago bark ash. Means with different letter(s) within the same incubation period indicate significant differences between treatments according to Tukey’s HSD test at p ≤ 0.05, i.e., a > b > c. Bars represent the mean values ± SE.
Agronomy 11 01803 g017
Figure 18. Effects of treatments on iron-bound phosphorus after thirty, sixty, and ninety days of incubation, where T1: soil alone, T2: Egypt rock phosphate alone, T3: Egypt rock phosphate + 100% charcoal, T4: Egypt rock phosphate + 100% sago bark ash, and T5: Egypt rock phosphate + 100% charcoal + 100% sago bark ash, T6: Egypt rock phosphate + 75% charcoal + 75% sago bark ash, T7: Egypt rock phosphate + 50% charcoal + 75% sago bark ash, T8: Egypt rock phosphate + 25% charcoal + 75% sago bark ash, T9: Egypt rock phosphate + 75% charcoal + 50% sago bark ash, T10: Egypt rock phosphate + 50% charcoal + 50% sago bark ash, T11: Egypt rock phosphate + 25% charcoal + 50% sago bark ash, T12: Egypt rock phosphate + 75% charcoal + 25% sago bark ash, T13: Egypt rock phosphate + 50% charcoal + 25% sago bark ash, and T14: Egypt rock phosphate + 25% charcoal + 25% sago bark ash. Means with different letter(s) within the same incubation period indicate significant differences between treatments according to Tukey’s HSD test at p ≤ 0.05, i.e., a > b > c. Bars represent the mean values ± SE.
Agronomy 11 01803 g018
Figure 19. Effects of treatments on reductant soluble phosphorus after thirty, sixty, and ninety days of incubation, where T1: soil alone, T2: Egypt rock phosphate alone, T3: Egypt rock phosphate + 100% charcoal, T4: Egypt rock phosphate + 100% sago bark ash, and T5: Egypt rock phosphate + 100% charcoal + 100% sago bark ash, T6: Egypt rock phosphate + 75% charcoal + 75% sago bark ash, T7: Egypt rock phosphate + 50% charcoal + 75% sago bark ash, T8: Egypt rock phosphate + 25% charcoal + 75% sago bark ash, T9: Egypt rock phosphate + 75% charcoal + 50% sago bark ash, T10: Egypt rock phosphate + 50% charcoal + 50% sago bark ash, T11: Egypt rock phosphate + 25% charcoal + 50% sago bark ash, T12: Egypt rock phosphate + 75% charcoal + 25% sago bark ash, T13: Egypt rock phosphate + 50% charcoal + 25% sago bark ash, and T14: Egypt rock phosphate + 25% charcoal + 25% sago bark ash. Means with different letter(s) within the same incubation period indicate significant differences between treatments according to Tukey’s HSD test at p ≤ 0.05, i.e., a > b > c. Bars represent the mean values ± SE.
Agronomy 11 01803 g019
Figure 20. Effects of treatments on calcium-bound phosphorus after thirty, sixty, and ninety days of incubation, where T1: soil alone, T2: Egypt rock phosphate alone, T3: Egypt rock phosphate + 100% charcoal, T4: Egypt rock phosphate + 100% sago bark ash, and T5: Egypt rock phosphate + 100% charcoal + 100% sago bark ash, T6: Egypt rock phosphate + 75% charcoal + 75% sago bark ash, T7: Egypt rock phosphate + 50% charcoal + 75% sago bark ash, T8: Egypt rock phosphate + 25% charcoal + 75% sago bark ash, T9: Egypt rock phosphate + 75% charcoal + 50% sago bark ash, T10: Egypt rock phosphate + 50% charcoal + 50% sago bark ash, T11: Egypt rock phosphate + 25% charcoal + 50% sago bark ash, T12: Egypt rock phosphate + 75% charcoal + 25% sago bark ash, T13: Egypt rock phosphate + 50% charcoal + 25% sago bark ash, and T14: Egypt rock phosphate + 25% charcoal + 25% sago bark ash. Means with different letter(s) within the same incubation period indicate significant differences between treatments according to Tukey’s HSD test at p ≤ 0.05, i.e., a > b > c. Bars represent the mean values ± SE.
Agronomy 11 01803 g020
Figure 21. Effects of treatments on occluded phosphorus after thirty, sixty, and ninety days of incubation, where T1: soil alone, T2: Egypt rock phosphate alone, T3: Egypt rock phosphate + 100% charcoal, T4: Egypt rock phosphate + 100% sago bark ash, and T5: Egypt rock phosphate + 100% charcoal + 100% sago bark ash, T6: Egypt rock phosphate + 75% charcoal + 75% sago bark ash, T7: Egypt rock phosphate + 50% charcoal + 75% sago bark ash, T8: Egypt rock phosphate + 25% charcoal + 75% sago bark ash, T9: Egypt rock phosphate + 75% charcoal + 50% sago bark ash, T10: Egypt rock phosphate + 50% charcoal + 50% sago bark ash, T11: Egypt rock phosphate + 25% charcoal + 50% sago bark ash, T12: Egypt rock phosphate + 75% charcoal + 25% sago bark ash, T13: Egypt rock phosphate + 50% charcoal + 25% sago bark ash, and T14: Egypt rock phosphate + 25% charcoal + 25% sago bark ash. Means with different letter(s) within the same incubation period indicate significant differences between treatments according to Tukey’s HSD test at p ≤ 0.05, i.e., a > b > c. Bars represent the mean values ± SE.
Agronomy 11 01803 g021
Figure 22. Percentages of soil inorganic phosphorus distribution in T1, T2, T3, T4, T5, T6, and T7 after thirty, sixty, and ninety days of incubation, where T1: soil alone, T2: Egypt rock phosphate alone, T3: Egypt rock phosphate + 100% charcoal, T4: Egypt rock phosphate + 100% sago bark ash, T5: Egypt rock phosphate + 100% charcoal + 100% sago bark ash, T6: Egypt rock phosphate + 75% charcoal + 75% sago bark ash, and T7: Egypt rock phosphate + 50% charcoal + 75% sago bark ash.
Agronomy 11 01803 g022
Figure 23. Percentages of soil inorganic phosphorus distribution in T8, T9, T10, T11, T12, T13, and T14 after thirty, sixty, and ninety days of incubation, where T8: Egypt rock phosphate + 25% charcoal + 75% sago bark ash, T9: Egypt rock phosphate + 75% charcoal + 50% sago bark ash, T10: Egypt rock phosphate + 50% charcoal + 50% sago bark ash, T11: Egypt rock phosphate + 25% charcoal + 50% sago bark ash, T12: Egypt rock phosphate + 75% charcoal + 25% sago bark ash, T13: Egypt rock phosphate + 50% charcoal + 25% sago bark ash, and T14: Egypt rock phosphate + 25% charcoal + 25% sago bark ash.
Agronomy 11 01803 g023
Table 1. Selected physico-chemical properties of the soil used in incubation study.
Property Value ObtainedStandard Range *
pH (water) 4.614.6–4.9
pH (KCl) 3.953.8–4.0
EC (µS cm−1) 35.10NA
Bulk density (g cm−1) 1.25NA
Total carbon (%) 2.160.57–2.51
Total N (%) 0.080.04–0.17
Total P (mg kg−1) 23.65NA
Available P (mg kg−1) 1.13NA
CECcmol kg−14.673.86–8.46
Exchangeable acidity1.15NA
Exchangeable Al3+1.02NA
Exchangeable H+0.13NA
Exchangeable K+0.060.05–0.19
Exchangeable Ca2+0.020.01
Exchangeable Mg2+0.220.07–0.21
Exchangeable Na+0.030.01
Exchangeable Mn2+0.01NA
Exchangeable Fe2+1.09NA
Soil texture Sand (%): 71.9Sand (%): 72–76
Silt (%): 13.5Silt (%): 8–9
Clay (%): 14.6Clay (%): 16–19
Sandy loamSandy clay loam
Note: * Standard range subjected to the soil development by Paramananthan [71]; NA: not available; Available P: P that was extracted using Mehlich 1 method (Mehlich-P).
Table 2. Percentages of inorganic phosphorus speciation in soil before incubation study.
Inorganic PhosphorusPercentage (%)
Loosely soluble phosphorus (Sol-P)0
Aluminium bound phosphorus (Al-P)11
Iron bound phosphorus (Fe-P)67
Reductant soluble phosphorus (Red-P)3
Calcium bound phosphorus (Ca-P)7
Occluded phosphorus (Occl-P)12
Total100
Table 3. Selected chemical properties of charcoal and sago bark ash.
Property CharcoalSago Bark Ash
pH (water) 7.749.99
pH (KCl) 7.319.66
EC (dS m−1) 0.275.75
Available P (mg kg−1) 31.2555.83
Exchangeable K+cmol kg−13.6723.33
Exchangeable Ca2+11.7116.77
Exchangeable Mg2+3.373.57
Exchangeable Na+0.431.51
Exchangeable Fe2+0.150.03
Note: Available P: P that was extracted using Mehlich 1 method (Mehlich-P).
Publisher’s Note: MDPI stays neutral with regard to jurisdictional claims in published maps and institutional affiliations.

