Article

Standing Vegetation Exceeds Soil Microbial Communities in Soil Type Indication: A Procrustes Test of Four Salt-Affected Pastures

1
Centre for Agricultural Research, Institute for Soil Sciences, Herman O. út 15, H-1022 Budapest, Hungary
2
Doctoral School of Environmental Sciences, Loránd Eötvös University, Pázmány P. stny. 1/C, H-1117 Budapest, Hungary
3
Department of Botany, Hungarian Natural History Museum, Könyves K. krt. 40, H-1089 Budapest, Hungary
4
Department of Plant Systematics, Ecology and Theoretical Biology, Institute of Biology, Loránd Eötvös University, Pázmány P. stny. 1/C, H-1117 Budapest, Hungary
5
Group of Agrobotany, Department of Botany, Institute of Crop Production, Hungarian University of Agricultural and Life Sciences, Páter K. u. 1, H-2100 Gödöllő, Hungary
6
Piarist High School, Piarista u. 1, H-1052 Budapest, Hungary
*
Author to whom correspondence should be addressed.
Agronomy 2021, 11(8), 1652; https://doi.org/10.3390/agronomy11081652
Submission received: 24 April 2021 / Revised: 11 August 2021 / Accepted: 16 August 2021 / Published: 19 August 2021

Abstract

:
Organisms with different life histories are able to act as indicators of different characteristics of their environment. Here, we compared the precision of habitat indication by the vegetation and soil microbial communities in four salt-affected pastures: annual open salt sward, Pannonic Puccinellia limosa hollow, Artemisia saline puszta and grassy saline puszta. Dissimilarity of habitats was evaluated by standardized principal component analysis (PCA) based on four different datasets: catabolic profiles of microbial communities in June (a) and September (b), composition of vascular vegetation (c) and physical and chemical properties of the soil (d). Procrustes analysis was used to quantify the resemblance between pairs of PCA ordinations based on soil properties (d) and various biotic communities (a, b, c). PCA ordination based on vegetation most closely matched the soil data-based ordination, thus vegetation appears to better indicate habitat conditions than soil microbial communities do. For microbial communities, a better agreement with the soil data-based ordination was reached in September than in June. Most probably, the long-lived sedentary habit of perennial plants in these communities requires adaptation to long-term average habitat conditions. In contrast, short-lived soil microbes can quickly follow environmental changes, thus the composition of soil microbial communities better reflect actual soil conditions.

1. Introduction

One of the key principles in ecology is the general indication principle, which says that with its presence, every organism has an indicative role towards the environment where it occurs. Beyond its presence, the organism’s phenological stage, physiological status and other traits also carry information [1]. Similarly, communities of various biota types (microbes, plants, animals) are also indicative of their environment, and most often, these multi-species assemblages reflect the state of the environment in a more sophisticated way than individual species do [2]. Vegetation ecologists have long been studying spatial patterns of vegetation zones along various environmental gradients [3,4,5,6]. As instrumental measurements became widespread and data processing methods developed, the recognized relationship between various habitat properties and standing vegetation status has become more sophisticated and precise [2,7,8]. Studies on soil microbial communities started later compared to those for vegetation, but it is quite clear that these communities are also strongly determined by habitat conditions [9,10,11,12].
Specifically, for salt-affected habitats, the mosaic-like pattern of the vegetation, as well as the spatial heterogeneity of soil properties, has long been known [13,14,15]. Relationships between soil variables and the presence of halophytic plant species, as well as vegetation types, have also been documented [16,17,18,19,20]. Adaptation of soil microbial communities to various salinity levels, or micro-habitats on salt-affected soils, are being revealed more recently [21,22,23]. Consequently, both the standing vegetation and the soil microbial community have the capacity to indicate soil quality. However, our knowledge is much more limited on the precision with which the two biota types (plants versus microbes) are able to indicate soil conditions in various habitats.
The aim of the present study is to provide a quantitative evaluation and comparison of the precision with which the vegetation and the soil microbial communities indicate habitat differences in a diversified salty landscape described by measured soil variables.

2. Materials and Methods

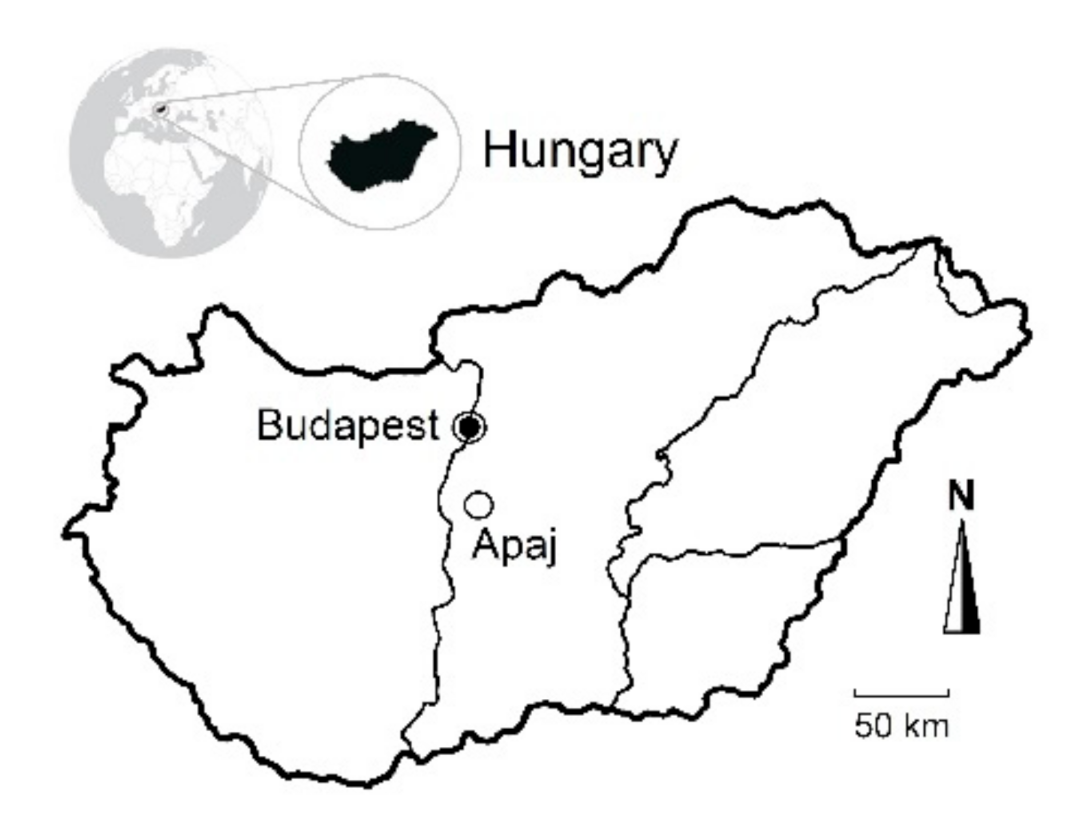
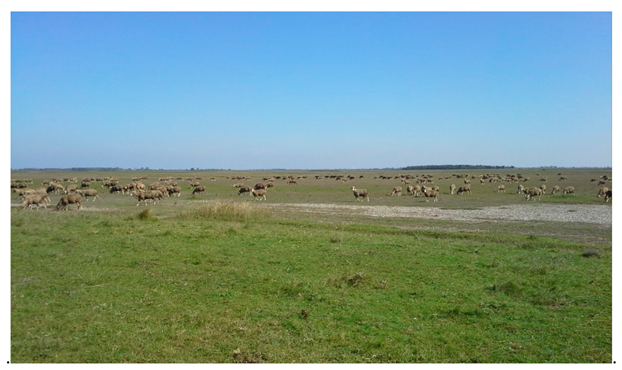
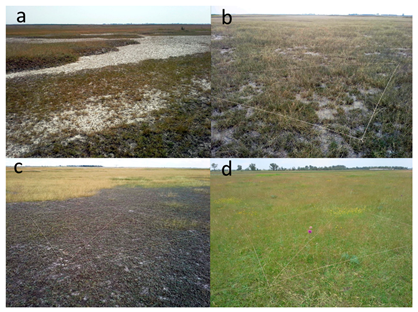
2.1. Study Site Description

A plain called “Apajpuszta” (N 47°05′12.5″, E 19°05′54.1″, 94 m a.s.l.), south of the village Apaj in the Danube-Tisza Interfluve (Hungary), was selected as the study region (Figure 1). The area is known for the variety of salt-affected soils and corresponding halophytic vegetation moderately grazed by sheep in the last few decades (Figure 2).
Within the study region, four characteristic habitat types were chosen as study sites for detailed soil, vegetation and soil microbiome investigations: (1) annual open salt sward—Lepidio crassifolii-Camphorosmetum annuae (CAM), (2) Pannonic Puccinellia limosa hollow—Lepidio crassifolii-Puccinellietum limosae (PUC), (3) Artemisia saline puszta—Artemisio santonici-Festucetum pseudovinae (ART) and (4) grassy saline puszta—Achilleo setaceae-Festucetum pseudovinae (ACH) [24,25,26]. These four habitats represent a toposequence in terms of vegetation productivity, where CAM is the least productive whereas ACH can produce the highest plant biomass and also supports the highest number of vascular plant species.

2.2. Sampling Methods and Data Analysis
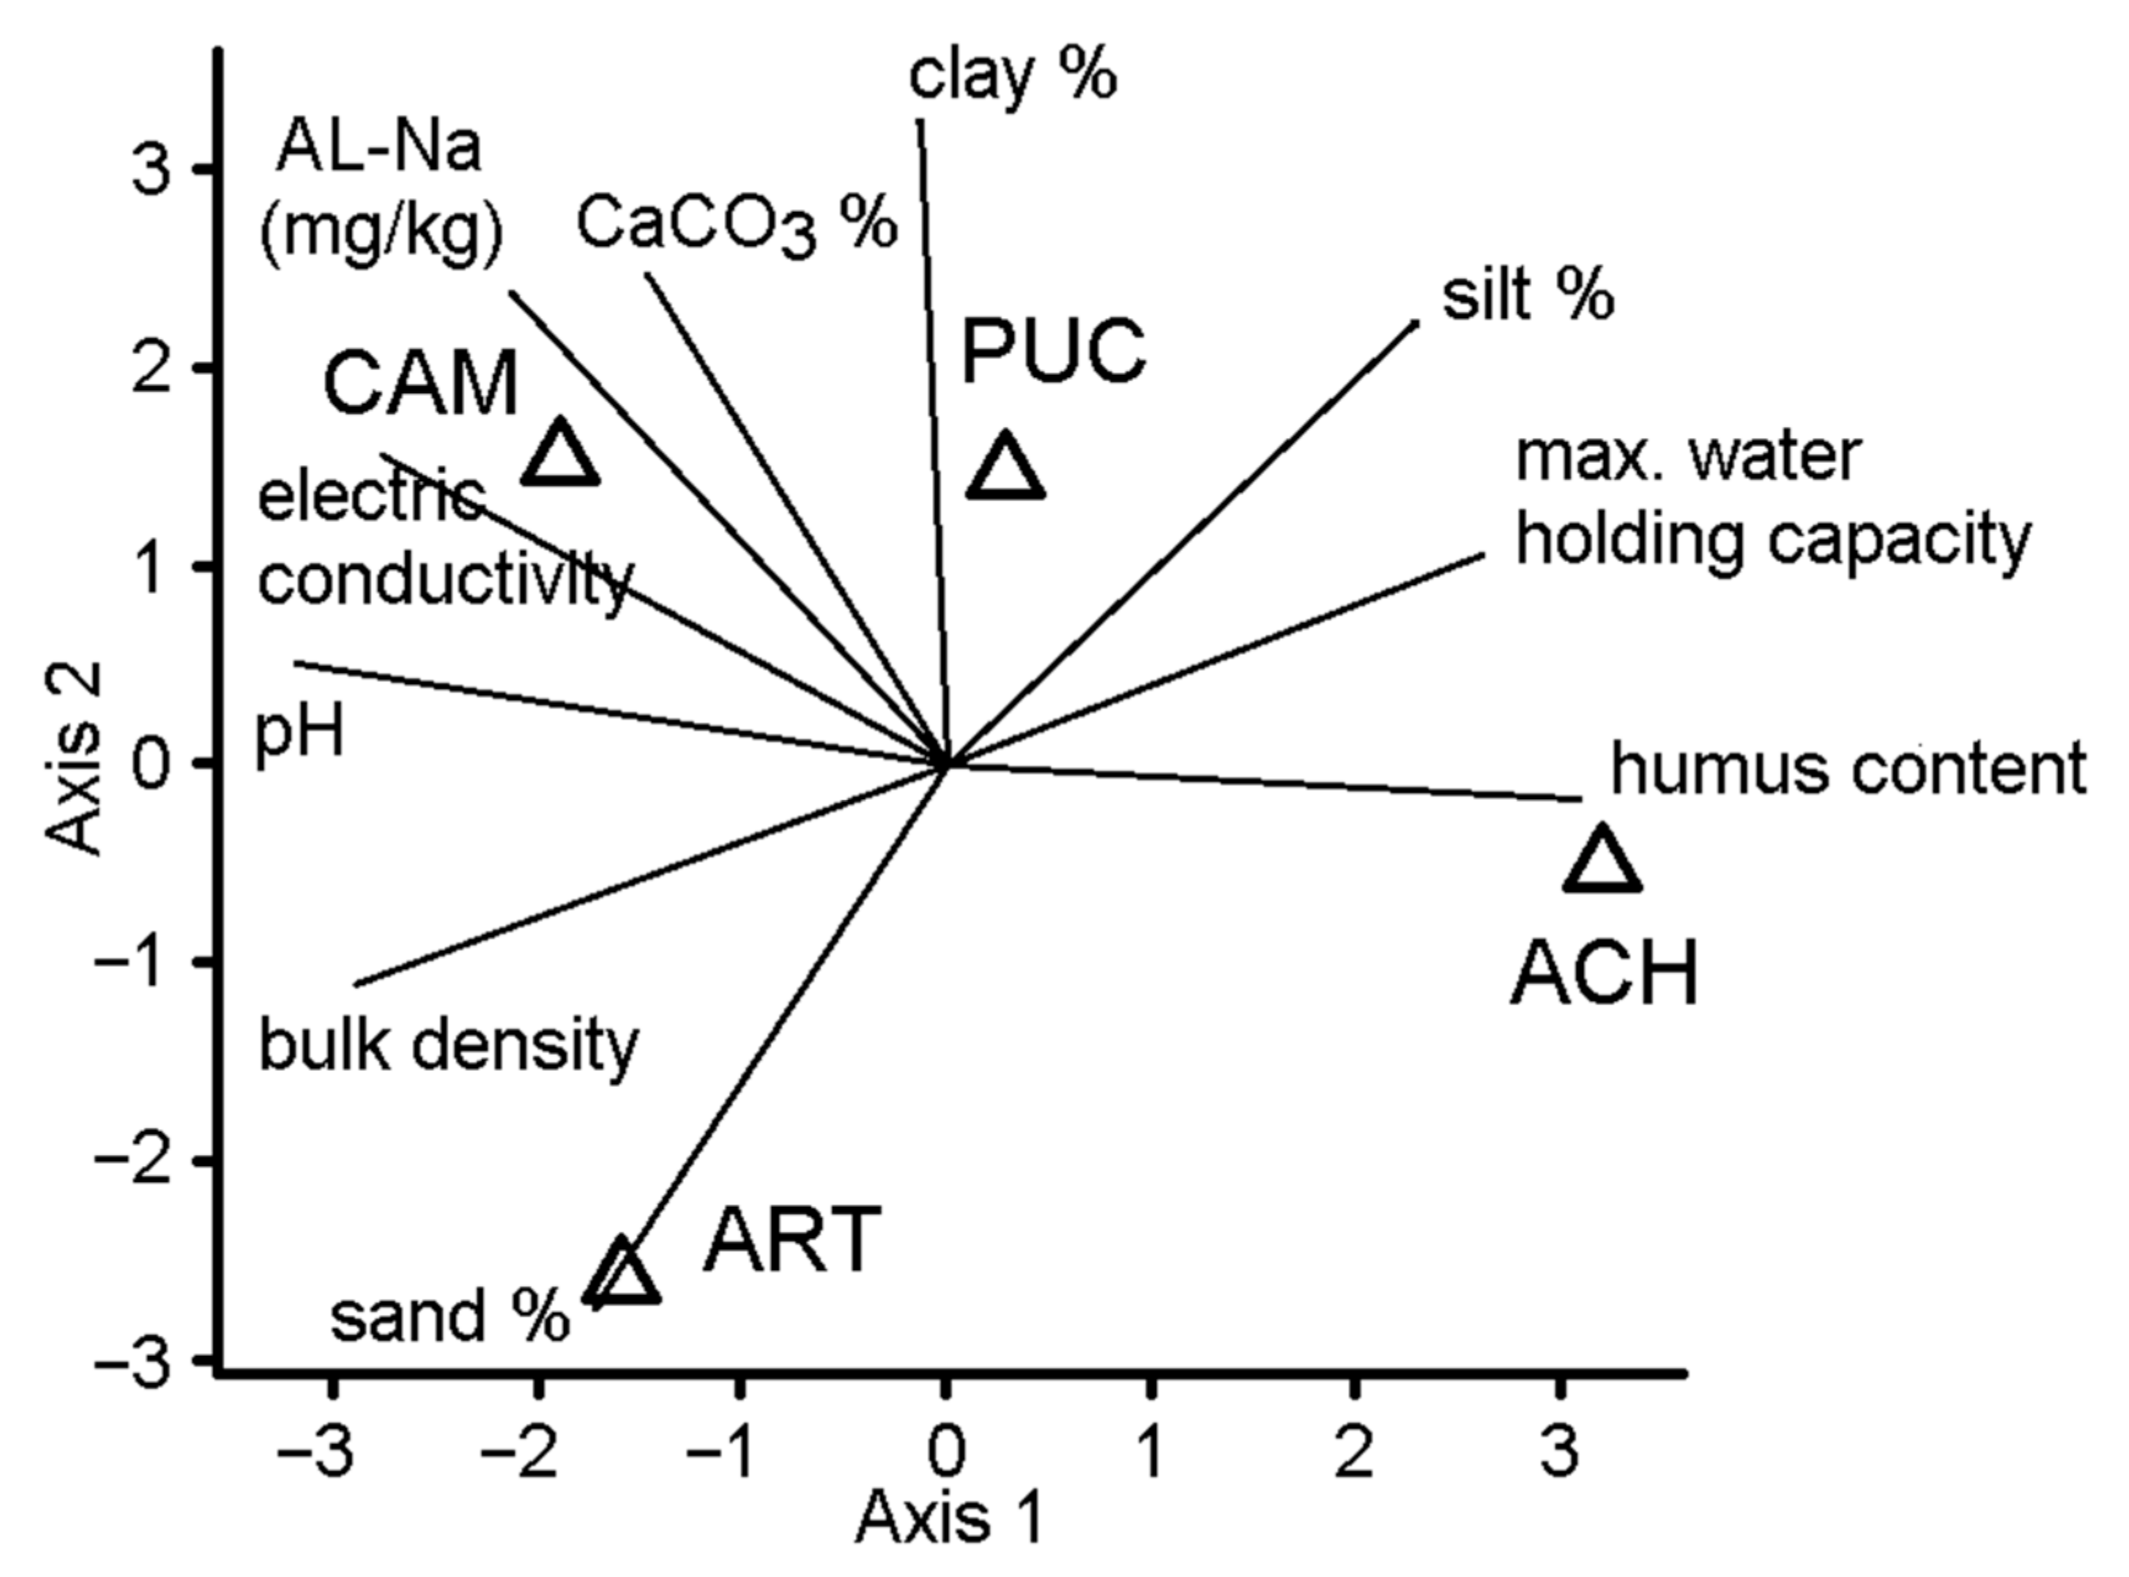
From each of the 4 study sites, 4 replicate soil samples were taken from 0–10 cm depth. Samples were thoroughly homogenized by manual mixing, then each was divided into two parts. One was used for determining soil physical and chemical properties, and the other for recording catabolic activity profiles. Approximately 15 g of soil from each sample was oven-dried at 105 °C to determine gravimetric soil water content.
Samples for physical and chemical analysis were air-dried, ground manually by mortar and pestle, then sieved (2 mm mesh size). Soil texture was determined from the particle size distribution of clay, silt and sand particles measured by the pipetting method. The electrical conductivity (EC 2.5) and pHH2O were determined from 1:2.5 soil:water suspensions. CaCO3 content of the samples was measured by a calcimeter. Total organic carbon was determined, then humus content values were calculated. Water content (m/m%) at saturation (pF0) was determined, as well as bulk density (g·cm−3) of soils. These measurements were completed according to the Hungarian soil standards [27,28]. The ammonium-lactate (AL)-soluble Na+ content (mg·kg−1) was determined by inductively coupled plasma emission (ICP) spectrometry according to Hungarian Standards [29].
Samples for microbial activity measurements were stored in PE bags at 4 °C until use. From each site, the catabolic activity profiles of 3 parallel samples was determined using the MicroResp method [30,31]. For these measurements, the water content of the soil samples was set to 50% of their water-holding capacity by ultraclean distilled water, then samples were sieved through 2 mm mesh. From each sample, approximately 40 g was measured into 96-well deep-well microplates (one sample per plate, the exact amount of soil was measured for each). Plates were then covered with Parafilm M, and then were preincubated for 5 days in a desiccator at room temperature, as instructed by the manufacturer. After preincubation, 15 different organic sole-carbon sources and ultrapure distilled water (as control) were added to the samples, each in 6 replicates per plate. The abbreviations and concentrations of substrates are listed in Table 1. A 20 min preincubation was applied, to avoid bias from potential abiotic CO2 evolution, then the plates were covered with gas-tight MicroResp seals and detector plates, which contained an indicator gel with Cresol red indicator. Plates were then incubated for 5 h at 24.5 °C. The evolved CO2 was measured by the absorbance change in the wells of the detector plate, measured with a microplate reader at 570 nm. Respiration rates were then calculated from the normalized % CO2 data as described by the manufacturer [30]. The above-described measurements on microbial activity were identically carried out on samples collected in June and in September.
Vascular plant species were sampled in 4 by 4 m quadrats with 5 replicates in each of the 4 salt-affected plant associations (Figure 3). This size of quadrates agreed or surpassed the minimum-area of the studied plant communities, proved by autochthonous pilot studies using spatial sequences of increasing quadrat sizes [32]. Phytosociological samplings were made between 10 July 2014 and 9 June 2015 according to the methods of the Central European school of phytosociology, i.e., the cover of each vascular plant species was estimated (by visual inspection) considering its orthogonal projection to the ground, but the proportion of a given species was expressed in percentage instead of using the traditional five-staged ordinal scale. To make the cover estimation of species more precise, a portable 1 by 1 m rectangle, with a grid of 25 sub-squares, was used during the sampling [33].
In our previous reports, each of the four raw datasets (concerning soil, microbial and vegetation data) was analyzed separately by principal component analysis, and in all cases, replicates from the four study sites formed well-separated (non-overlapping) groups [34]. Therefore, raw data of the 4, 3 and 5 replicates for soil, microbial and vegetation samples respectively, from a given study site (i.e., habitat type), were substituted by their average values, and the averaged datasets were used in a subsequent two-step test. In the first step, the differences among the four different salt-affected habitat types were analyzed by standardized principal component analysis (PCA) based on four distinct descriptor datasets: soil variables, microbial communities in June, microbial communities in September and vegetation data, thus resulting in four different ordination scattergrams. In the second step, the four different ordination scattergrams were compared by Procrustes analysis, known as a powerful tool used to compare multi-variate datasets [35]. The multivariate analyses were completed by using SYN-TAX 5 and SYN-TAX 2000 program packages [36,37].

3. Results

The measured values of soil physical and chemical properties of the four habitat types are listed in Table 2. Results of the PCA based on ten soil variables are shown in Figure 4. The low-productivity annual open salt sward (CAM), which is known as a habitat having a high degree of abiotic stress factors, was characterized by high pH, electric conductivity and AL-soluble Na content in its soil. On the other end of the studied toposequence, the grassy saline puszta (ACH) had the highest humus content and water-holding capacity in its soil, in accordance with the more diverse and complex vegetation cover of this habitat type. For the PUC and ART habitat types, which are intermediate in terms of productivity, the share of clay and sand fractions in their soils proved to be the most important distinctive feature.
Results of the PCA ordinations according to the soil microbial activities in June and September, as well as the one based on the vegetation survey data, are shown in Figure 5. When the quantity of microbe groups specialized for utilization of different carbon sources were used as input variables (see Appendix A, Table A1 for detailed data), the resulted ordination scattergrams differed considerably from the one based on the soil variables. For June data, the annual open salt sward (CAM) and the Pannonic Puccinellia limosa hollow (PUC) were positioned strikingly close to each other (Figure 5A), whereas for September data, habitat types were more evenly distributed, with CAM and ACH appearing at the two ends of the gradient (Figure 5B). In the PCA ordination based on the vegetation survey, the four habitat types were sorted by yet another pattern. The species-rich grassy saline puszta (ACH) proved to be considerably separated from the other three habitats, which support rather species-poor vegetation types (Figure 5C) (Appendix A, Table A2).
To compare the resemblance of the ordination results obtained from different types of input datasets (soil, microbial and vegetation data), and to decide whether the soil microbial communities or the vascular vegetation describe soil properties more precisely, a Procrustes analysis was performed on all pairs of datasets. The resulted dissimilarity values (ranging from 0 to 1) are shown in Table 3. The smallest deviation from the soil data-based ordination was found for the ordination based on the vascular vegetation data (0.210). The analysis of the soil microbial communities resulted in less similar ordination of the four habitat types than the one based on the soil data. Nevertheless, for the two sampling dates, the September results provided a better match.
Summarizing the results, (i) the four different input data matrices (soil properties, vegetation data and two versions of microbial data) resulted in four different PCA ordination scattergrams, i.e., showed distinct configurations of the resemblance structure among the four salt-affected habitat types. (ii) The indicator capacity of each biota community (vascular plants and microbes in June and September) was evaluated by comparing the PCA results for each community with the one obtained when soil properties were used to describe the similarities among the four habitat types. (iii) In the Procrustes analysis, both the vegetation-based and the microbial community-based analyses indicated a more or less similar picture of the resemblance structure for the four habitats as the one described by the soil properties (dissimilarities were lower than 0.5 in all pairwise comparisons). (iv) However, the better agreement of PCA results was detected between the pair of soil properties versus vascular vegetation data (dissimilarity = 0.210), thus the vegetation can be considered the best indicator, at least in the present study.

4. Discussion

The soil data-based PCA ordination showed that out of the four salt-affected grassland types, the two extreme ones—the low productivity annual open salt sward and the grassy saline puszta of relatively high productivity—are well-defined by certain environmental factors. The other two habitats of intermediate productivity—PUC and ACH—characteristically differ in the sand and clay content of their soils. These suggest that vegetation dynamics can follow two distinct trajectories between the low-productivity stage and the grassy saline puszta, and it is governed by the sand-to-clay ratio of the soil. However, this explanation disagrees with other studies, where a unidirectional toposequence across stages of CAM, PUC, ART and ACH was considered merely based on elevational gradients [38,39]. Further in-depth studies are required to resolve this inconsistency and to clarify the effect of the sand/clay ratio in the soil to the vegetation succession, but that is beyond the scope of this study.
At the same time, the results obtained in this study are perfectly suitable for testing our main question, i.e., if soil microbes or vascular vegetation better reflect the differences among four salt-affected habitat types distinguished based upon precisely measured soil variables. The implicit assumption in this study is that the soil properties of a given natural habitat are considerably stable through time; therefore, plant and microbe species arriving to the site are filtered by site conditions, and thus their surviving communities indicate local soil conditions.
The Procrustes analysis revealed that vascular vegetation better reflected the differences in soil conditions of the four habitat types than soil microbial communities did. A previous study on a similar salt-affected grassland complex also reported correlation between vegetation types and soil properties [17]. For soil microbial data, PCA ordination based on September sampling showed higher similarity to PCA ordination based on soil properties compared to that calculated for June sampling, when the arrangements of the four habitats were compared in the Procrustes analysis.
A possible interpretation of the results could be related to the differences in the lifespan and the length of the reproductive cycle of plants and microbes. Plants are relatively long-lived compared to microbes, most of them are perennials in the given habitats, and in any case, they are sessile organisms. These traits require that plants have to adapt to long-term average conditions in their preferred habitat. Therefore, to a certain extent, the formation of vegetation at a given site is under similar environmental control that governs the soil formation, although the latter obviously refers to a longer time span.
In contrast, soil microbes are short-lived, and their reproductive cycle is even shorter than that of ephemeral plants. It enables microbes to quickly follow the changes of their environment, and with accelerated reproduction of temporarily adaptive species, their community structure can deviate considerably from site average at a given sampling time. This feature of soil microbes can be especially important in the studied saline habitats, where the aridity level undergoes considerable fluctuations during the growing season [40]. Consequently, soil microbial communities could be rather more related to actual soil conditions than to average quality of the habitat. The indicator properties of these above-ground and below-ground biotas could be considered in the evaluation for sustainable use and conservation of salt-affected vegetation grazed by sheep or other livestock.
To conclude, the approximately accurate soil indicator role of vascular vegetation can be used for large-scale mapping of major saline soil types, including methods based on the processing of visual data from aerial photographs. In contrast, changes in soil microbial community composition and thus soil catabolic activity are well related to changes in soil conditions along the aridity–humidity gradient. Such a response by the microbial community may be predictive of how saline soils will participate in the global carbon cycle if their water balance changes significantly due to climate change.
Finally, regarding the use of Procrustes analysis itself as a tool in ecological research, we found it effective in objectively evaluating the results of our multiple approach study. This method was successfully applied, too, when community composition of aquatic hyphomycetes was compared to decomposable substrates and water chemistry data of creeks in North Hungary [41]. The method was also used in evaluating soil microbiological and other pedological data in the past, and the frequency of its application has increased in recent years, e.g., [42,43,44]. Nevertheless, its potential is not yet fully exploited, and we recommend a wider use of Procrustes analysis where applicable.

Author Contributions

Conceptualization, P.C. and T.S.-K.; methodology, P.C., M.M. and T.S.-K.; formal analysis, P.C., M.M. and T.K.; investigation, M.M. and P.R.; data curation, P.R., J.T. and Á.M.; writing—original draft preparation, P.C. and M.M.; writing—review and editing, P.C. and G.P.; visualization, P.C., M.M., J.T. and Á.M.; project administration, P.C. and T.S.-K.; supervision, K.P. and T.S.-K.; funding acquisition, T.S.-K. All authors have read and agreed to the published version of the manuscript.

Funding

This research was supported by the Ministry of Innovation and Technology within the framework of the Thematic Excellence Program 2020, Institutional Excellence Sub-Program (TKP2020-IKA-12) in the topic of water-related researches of Szent István University, and by the European Regional Development Fund and the Hungarian Government (GINOP-2.3.2-15-2016-00056). Financial support from the Hungarian National Research, Development and Innovation Office is greatly acknowledged (NKFIH-OTKA grant number K-108572 for P.C., M.M., R.P. and T.S-K, and K-125423 for P.G. and P.K.).

Institutional Review Board Statement

Not applicable.

Informed Consent Statement

Not applicable.

Data Availability Statement

The data related to this study are available for scientific purposes upon request from the corresponding author.

Acknowledgments

Many thanks are due to János Podani (L. Eötvös University) and Tibor Tóth (Centre for Agricultural Research) for consultations and suggestions. We are grateful to the two anonymous reviewers for their valuable suggestions on the first version of the manuscript.

Conflicts of Interest

The authors declare no conflict of interest.

Appendix A

Table A1. Substrate-induced respiration rates (µg CO2-C/g soil/h) of soil microbial communities of the four salt-affected habitat types at Apajpuszta, Hungary (each value is an average of 3 replicate measurements). Jun. = June, Sep. = September.
CAMPUCARTACH
Carbon SourcesJun.Sep.Jun.Sep.Jun.Sep.Jun.Sep.
D-galactose0.12570.11240.49860.20611.38220.43141.78900.9274
L-(+)-Arabinose0.12890.11770.44530.21091.84030.49191.87301.0139
Trehalose0.12930.11270.64850.21731.60570.41111.51990.8489
D-(−)-Fructose0.14590.12720.78670.23222.77810.59262.74871.3151
D-Glucose0.14670.12080.93470.23773.37800.71203.13721.4760
DL-Malic acid0.57740.17080.75270.39583.97640.51713.01461.3326
Citric acid monohydrate0.44070.16780.40730.46661.89650.41851.40270.7385
L-Alanine0.23240.20990.29520.28280.80970.35910.93230.6061
Succinic acid0.13020.11820.60860.28651.62000.45561.51160.8497
L-Glutamine0.19860.18630.34730.29191.29730.45141.18250.7143
L-lysine-monohydrochloride0.16820.16680.20620.26860.52030.30560.47480.3756
L-Arginine0.09640.12730.10540.20310.26510.28990.33280.4129
L-Leucine0.14370.14710.19560.20470.46260.27840.56840.3908
L-Glutamic acid0.16520.15940.47680.27951.18110.55621.24500.8223
3.4-Dihydroxi-benzoic acid0.12000.11060.34840.51632.11730.53100.69410.3596
Table A2. Species composition of the four salt-affected vegetation types, studied at Apaj, Hungary. Numbers are percentage cover values for each species calculated as the average of its cover values observed in five, 4 by 4 m quadrats. Abbreviations: CAM = Lepidio crassifolii-Camphorosmetum annuae, PUC = Lepidio crassifolii-Puccinellietum limosae, ART = Artemisio santonici-Festucetum pseudovinae, ACH = Achilleo setaceae–Festucetum pseudovinae.
Species NameCAMPUCARTACH
Achillea setacea W. et K.00012.2
Agrimonia eupatoria L.0000.02
Arenaria serpyllifolia L.0000.22
Artemisia santonicum L.00210
Bromus commutatus Schrad.0001.8
Bromus hordeaceus L.0001.6
Calamagrostis epigeios (L.) Roth0000.02
Camphorosma annua Pall.8.80.0200
Carduus nutans L.0001.44
Centaurea pannonica (Heuff.) Simk.0000.02
Cerastium pumilum Curt.0005.02
Convolvulus arvensis L.0001.8
Cruciata pedemontana (Bell.) Ehrend.0000.46
Dactylis glomerata L.0001.42
Daucus carota L.0000.08
Elymus repens (L.) Gould000.22.22
Eryngium campestre L.0000.84
Euphorbia cyparissias L.0000.2
Falcaria vulgaris Bernh.0000.02
Festuca pseudovina Hack. ex Wiesb.007.637
Galium verum L.0000.82
Hieracium caespitosum Dum.0001.24
Hordeum hystrix Roth0000.04
Koeleria cristata (L.) Pers.0004.8
Leontodon hispidus L.0002.02
Lepidium crassifolium W. et K.6.20.2200
Lepidium draba L.0000.06
Limonium gmelinii (Willd.) O. Kuntze0000.02
Linum austriacum L.0000.2
Lolium perenne L.0000.02
Lotus corniculatus L.0005.66
Medicago falcata L.0001.2
Medicago lupulina L.0001.2
Medicago minima (L.) Grufbg.0000.6
Myosotis ramosissima Rochel0000.06
Ononis spinosa L.0000.2
Phragmites australis (Cav.) Trin.0.10.400
Plantago lanceolata L.00010
Plantago maritima L.0.040.02150
Poa angustifolia L.0000.04
Poa bulbosa L.000.020
Podospermum canum C.A. Mey.000.060.04
Potentilla argentea L.0003.02
Puccinellia limosa (Schur) Holmbg.1.44681.260
Thymus pannonicus All.0004.02
Tragopogon dubius Scop.0000.02
Trifolium campestre Schreb.0001.62
Trifolium repens L.0003
Veronica arvensis L.0000.28
Veronica prostrata L.0000.02
Vicia angustifolia L.0000.24
indet. dicotyledonous seedling00.0200
Number of species56744

References

  1. Juhász-Nagy, P. Lack, Need and Tasks of An Oprative Ecology; Akadémiai Kiadó: Budapest, Hungary, 1986; pp. 1–251. (In Hungarian) [Google Scholar]
  2. Piernik, A. Inland halophilious vegetation as indicator of soil salinity. Basic Appl. Ecol. 2003, 4, 525–536. [Google Scholar] [CrossRef]
  3. Clements, F.E. Nature and Structure of the Climax. J. Ecol. 1936, 24, 252–284. Available online: https://www.jstor.org/stable/2256278?seq=1#metadata_info_tab_contents (accessed on 18 August 2021). [CrossRef]
  4. Whittaker, R.H.; Niering, W.A. Vegetation of the Santa Catalina Mountains, Arizona. II. A gradient analysis of the south slope. Ecology 1965, 46, 429–452. [Google Scholar] [CrossRef]
  5. Whittaker, R.H.; Niering, W.A. Vegetation of the Santa Catalina Mountains, Arizona. V. Biomass, production, and diversity along the elevation gradient. Ecology 1975, 56, 771–790. [Google Scholar] [CrossRef] [Green Version]
  6. Gentry, A.H. Changes in plant community diversity and floristic composition on environmental and geographical gradients. Ann. Mo. Bot. Gard. 1988, 75, 1–34. [Google Scholar] [CrossRef]
  7. Pennings, S.C.; Grant, M.B.; Bertness, M.D. Plant zonation in low-latitude salt marshes: Disentangling the roles of flooding, salinity and competition. J. Ecol. 2005, 93, 159–167. [Google Scholar] [CrossRef]
  8. Hemp, A. Continuum or zonation? Altitudinal gradients in the forest vegetation of Mt. Kilimanjaro. Plant Ecol. 2006, 184, 27–42. [Google Scholar] [CrossRef]
  9. Lupwayi, N.Z.; Rice, W.A.; Clayton, G.W. Soil microbial diversity and community structure under wheat as influenced by tillage and crop rotation. Soil Biol. Biochem. 1998, 30, 1733–1741. [Google Scholar] [CrossRef]
  10. Elhottova, D.; Szili-Kovács, T.; Triska, J. Soil microbial community of abandoned sand fields. Folia Microbiol. 2002, 47, 435–440. [Google Scholar] [CrossRef]
  11. Merilä, P.; Malmivaara-Lämsä, M.; Spetz, P.; Stark, S.; Vierikko, K.; Derome, J.; Fritze, H. Soil organic matter quality as a link between microbial community structure and vegetation composition along a successional gradient in a boreal forest. Appl. Soil Ecol. 2010, 46, 259–267. [Google Scholar] [CrossRef]
  12. Felföldi, T. Microbial communities of soda lakes and pans in the Carpathian Basin: A review. Biol. Futur. 2020, 71, 393–404. [Google Scholar] [CrossRef]
  13. Niering, W.A.; Warren, R.S. Vegetation patterns and processes in New England salt marshes. BioScience 1980, 30, 301–307. [Google Scholar] [CrossRef]
  14. Corwin, D.L.; Kaffka, S.R.; Hopmans, J.W.; Mori, Y.; van Groenigen, J.W.; van Kessel, C.; Lesch, S.M.; Oster, J.D. Assessment and field-scale mapping of soil quality properties of a saline-sodic soil. Geoderma 2003, 114, 231–259. [Google Scholar] [CrossRef]
  15. Semple, W.S.; Koen, T.B.; Eldridge, D.J.; Düttmer, K.M.; Parker, B. Variation in soil properties on two partially revegetated saline scalds in south-eastern Australia. Aust. J. Exp. Agr. 2006, 46, 1279–1289. [Google Scholar] [CrossRef]
  16. Bodrogközy, G.; Györffy, G. Ecology of the halophilic vegetation of the Pannonicum. VII. Zonation study along the Bega-backwatersin the Viovodina (Yugoslavia). Acta Biol. Szeged 1970, 16, 25–41. Available online: http://acta.bibl.u-szeged.hu/21732/1/biologica_016_fasc_003_004_025-041.pdf (accessed on 18 August 2021).
  17. Tóth, T.; Rajkai, K. Soil and plant correlations in a solonetzic grassland. Soil Sci. 1994, 157, 253–262. [Google Scholar] [CrossRef]
  18. Piernik, A. Vegetation-environment relations on inland saline habitats in Central Poland. Phytocoenologia 2005, 35, 19–37. [Google Scholar] [CrossRef]
  19. Piernik, A.; Hulisz, P.; Rokicka, A. Micropattern of halophytic vegetation on technogenic soils affected by the soda industry. Soil Sci. Plant. Nutr. 2013, 61 (Suppl. S1), 98–112. [Google Scholar] [CrossRef] [Green Version]
  20. Ping, Y.; Cui, L.; Pan, X.; Li, W.; Li, Y.; Kang, X.; Song, T.; He, P. Decomposition Processes in Coastal Wetlands: The Importance of Suaeda salsa Community for Soil Cellulose Decomposition. Pol. J. Ecol. 2018, 66, 217–226. [Google Scholar] [CrossRef]
  21. Sardinha, M.; Muller, T.; Schmeisky, H.; Joergensen, R.G. Microbial performance in soils along a salinity gradient under acidic conditions. Appl. Soil Ecol. 2003, 23, 237–244. [Google Scholar] [CrossRef]
  22. Borsodi, A.K.; Bárány, Á.; Krett, G.; Márialigeti, K.; Szili-Kovács, T. Diversity and ecological tolerance of bacteria isolated from the rhizosphere of halophyton plants living nearby Kiskunság soda ponds, Hungary. Acta Microbiol. Immunol. Hung. 2015, 62, 183–197. [Google Scholar] [CrossRef] [Green Version]
  23. Canfora, L.; Lo Papa, G.; Antisari, L.V.; Bazan, G.; Dazzi, C.; Benedetti, A. Spatial microbial community structure and biodiversity analysis in "extreme" hypersaline soils of a semiarid Mediterranean area. Appl. Soil Ecol. 2015, 93, 120–129. [Google Scholar] [CrossRef] [Green Version]
  24. Molnár, Z.; Borhidi, A. Hungarian alkali vegetation: Origins, landscape history, syntaxonomy, conservation. Phytocoenologia 2003, 33, 377–408. [Google Scholar] [CrossRef]
  25. Tóth, T. Salt-affected soils and their native vegetation in Hungary. In Sabkha Ecosystems: Volume III: Africa and Southern Europe; Ozturk, M., Böer, B., Barth, H.-J., Clüsener-Godt, M., Ajmal Khan, M., Breckle, S.-W., Eds.; Springer Science & Business Media B.V.: Dordrecht, The Netherlands, 2011; pp. 113–132. [Google Scholar] [CrossRef]
  26. Borhidi, A.; Kevey, B.; Lendvai, G. Plant. Communities of Hungary; Akadémiai Kiadó: Budapest, Hungary, 2012; p. 544. [Google Scholar]
  27. Buzás, I. Manual for Soil and Agrochemical Analyses 2: Physico-Chemical and Chemical Analysis of Soils; Mezőgazdasági Kiadó: Budapest, Hungary, 1988; pp. 1–242. (In Hungarian) [Google Scholar]
  28. Buzás, I. Manual for Soil and Agrochemical Analyses 1: Physical, Water Management and Mineral Analysis of Soils; Inda Kiadó: Budapest, Hungary, 1993; pp. 1–357. (In Hungarian) [Google Scholar]
  29. MSZ 2006. Hungarian Standard MSz 21470-50/2006. Environmental Testing of Soils. Determination of Total and Soluble Toxic Element, Heavy Metal and Chromium(VI) Content; Hungarian Standards Institution: Budapest, Hungary, 2006; p. 33. (In Hungarian) [Google Scholar]
  30. Campbell, C.D.; Chapman, S.J.; Cameron, C.M.; Davidson, M.S.; Potts, J.M. A rapid microtiter plate method to measure carbon dioxide evolved from carbon amendments so as to determine the physiological profiles of soil microbial communities by using whole soil. Appl. Environ. Microbiol. 2003, 69, 3593–3599. [Google Scholar] [CrossRef] [PubMed] [Green Version]
  31. Szili-Kovács, T.; Bárány, Á.; Füzy, A.; Takács, T.; Krett, G.; Kovács, R.; Borsodi, A. Analysis of the microbial metabolic activity patterns and mycorrhizal fungal colonisation in the rhizosphere of three soils neighbouring sodic lakes. Agrokémia és Talajt. 2017, 66, 149–164. [Google Scholar] [CrossRef] [Green Version]
  32. Csontos, P.; Mjazovszky, Á.; Ragályi, P.; Szili Kovács, T. Studies on the Minimal Area of Salt Affected Plant Communities. In Abstracts of the "XVIII. Apáczai-napok" Scientific Conference, Győr, Hungary, 21–22 October 2014; University of Western Hungary, Apáczai Csere János Faculty: Győr, Budapest, 2014; p. 58. (In Hungarian) [Google Scholar]
  33. Mueller-Dombois, D.; Ellenberg, H. Aims and Methods of Vegetation Ecology; Wiley & Sons: New York, NY, USA, 1974; pp. 1–547. [Google Scholar]
  34. Mucsi, M.; Csontos, P.; Borsodi, A.; Krett, G.; Gazdag, O.; Szili-Kovács, T. Use of the microrespiration method to analyse the metabolic activity patterns in the soil of four characteristic sodic plant associations. Agrokémiai és Talajt. 2017, 66, 165–179, (In Hungarian, English summary). [Google Scholar] [CrossRef]
  35. Peres-Neto, P.R.; Jackson, D.A. How well do multivariate data sets match? The advantages of a Procrustean superimposition approach over the Mantel test. Oecologia 2001, 129, 169–178. [Google Scholar] [CrossRef]
  36. Podani, J. SYN-TAX Version 5.0, User’s Guide; Scientia Publishing: Budapest, Hungary, 1993; p. 104. [Google Scholar]
  37. Podani, J. SYN-TAX 2000—Computer Programs for Data Analysis in Ecology and Syste–Matics. User’s Manual; Scientia Publishing: Budapest, Hungary, 2001; p. 53. [Google Scholar]
  38. Zalatnai, M.; Körmöczi, L.; Tóth, T. Community boundaries and edaphic factors in saline-sodic grassland communities along an elevation gradient. Tiscia 2007, 36, 7–15. Available online: https://www.researchgate.net/publication/237325142_Community_boundaries_and_edaphic_factors_in_saline-sodic_grassland_communities_along_an_elevation_gradient (accessed on 18 August 2021).
  39. Deák, B.; Valkó, O.; Alexander, C.; Mücke, W.; Kania, A.; Tamás, J.; Heilmeier, H. Fine-scale vertical position as an indicator of vegetation in alkali grasslands—Case study based on remotely sensed data. Flora 2014, 209, 693–697. [Google Scholar] [CrossRef] [Green Version]
  40. Borsodi, A.K.; Mucsi, M.; Krett, G.; Szabó, A.; Felföldi, T.; Szili-Kovács, T. Variation in sodic soil bacterial communities associated with different alkali vegetation types. Microorganisms 2021, 9, 1673. [Google Scholar] [CrossRef]
  41. Gönczöl, J.; Csontos, P.; Révay, Á. Catchment scale patterns of aquatic hyphomycetes. The role of physicochemical variables and substrate composition in structuring conidial communities. Arch. Hydrobiol. 2003, 157, 249–266. [Google Scholar] [CrossRef]
  42. Singh, B.K.; Munro, S.; Reid, E.; Ord, B.; Potts, J.M.; Paterson, E.; Millard, P. Investigating microbial community structure in soils by physiological, biochemical and molecular fingerprinting methods. Eur. J. Soil Sci. 2006, 57, 72–82. [Google Scholar] [CrossRef]
  43. Dirilgen, T.; Arroyo, J.; Dimmers, W.J.; Faber, J.; Stone, D.; da Silva, P.M.; Carvalho, F.; Schmelz, R.; Griffiths, B.S.; Francisco, R.; et al. Mite community composition across a European transect and its relationships to variation in other components of soil biodiversity. Appl. Soil Ecol. 2016, 97, 86–97. [Google Scholar] [CrossRef]
  44. Luo, G.; Li, B.; Lo, L.G.; Zhang, T.; Angelidaki, I. Antibiotic resistance genes and correlations with microbial community and metal resistance genes in full-scale biogas reactors as revealed by metagenomic analysis. Environ. Sci. Technol. 2017, 51, 4069–4080. [Google Scholar] [CrossRef] [PubMed]
Figure 1. Geographic position of Apaj on the map of Hungary.
Agronomy 11 01652 g001
Figure 2. Early autumn view of the salt-affected landscape with grazing sheep at “Apajpuszta” near Apaj village, Hungary.
Agronomy 11 01652 g002
Figure 3. Salt-affected communities at Apajpuszta: (a) Lepidio crassifolii-Camphorosmetum annuae (CAM) in the depressions, (b) Lepidio crassifolii-Puccinellietum limosae (PUC), (c) Artemisio santonici-Festucetum pseudovinae (ART) with “Puccinellietum” in the background, (d) Achilleo setaceae-Festucetum pseudovinae.
Agronomy 11 01652 g003
Figure 4. PCA ordination diagram according to ten soil variables for the four characteristic habitats in the salt-affected landscape of Apajpuszta, Hungary. CAM = annual open salt sward, PUC = Pannonic Puccinellia limosa hollow, ART = Artemisia saline puszta, ACH = grassy saline puszta. For a detailed description of soil variables, see the text in the Materials and Methods section.
Agronomy 11 01652 g004
Figure 5. PCA ordination diagram for the four characteristic habitat types (at Apajpuszta, Hungary) according to soil microbial activity in June (A), soil microbial activity in September (B) and vegetation data (C). Abbreviations of habitats are the same as in Figure 4.
Agronomy 11 01652 g005aAgronomy 11 01652 g005b
Table 1. Organic carbon sources and their concentrations applied to evaluate microbe communities in the salt-affected soil of Apajpuszta, Hungary.
Carbon SourceAbbreviationConcentration
(g/1000·cm−3)
1.D-galactoseGAL80
2.L-(+)-ArabinoseARA80
3.TrehaloseTRE80
4.D-(-)-FructoseFRU80
5.D-GlucoseGLC80
6.DL-Malic acidMAL40
7.Citric acid monohydrateCIT40
8.L-AlanineALA40
9.Succinic acidSUC40
10.L-GlutamineGLN20
11.L-lysine-monohydrochlorideLYS40
12.L-ArginineARG12
13.L-LeucineLEU12
14.L-Glutamic acidGLU12
15.3,4-Dihydroxi-benzoic acidDHB12
Table 2. Average values of soil physico-chemical properties of the four studied salt-affected habitats in Apajpuszta, Hungary (n = 4). CAM = annual open salt sward, PUC = Pannonic Puccinellia limosa hollow, ART = Artemisia saline puszta, ACH = grassy saline puszta.
Soil PropertiesCAMPUCARTACH
Max. water-holding capacity, m/m% (pF0)34.6132.4427.641.882
Bulk density, g/cm31.4661.30491.4921.2825
Sand % (2–0.05 mm)23.8721.12741.6421.554
Silt % (0.05–0.002 mm)48.4451.4937.2354.298
Clay % (0.002 > mm)27.6927.38321.1324.148
pH (H2O)10.369.48259.9288.035
Electric Conductivity, µS/cm19931148.31048282
Humus content, m/m%0.4951.95591.0512.6681
CaCO3, m/m%20.1823.01814.6912.35
AL-Na, mg/kg47793041112774
Table 3. Semi-matrix of dissimilarities between pairs of PCA ordination results of the four salt-affected habitat types at Apajpuszta, Hungary. Individual PCA ordinations were based on soil variables, on microbial activities in June and September and on vegetation survey data, then were compared by Procrustes analysis.
Soil VariablesSoil Microbes in JuneSoil Microbes in SeptemberVascular Vegetation
Soil Variables00.4020.3630.210
Soil Microbes in June 00.2920.613
Soil Microbes in September 00.191
Vascular Vegetation 0
Publisher’s Note: MDPI stays neutral with regard to jurisdictional claims in published maps and institutional affiliations.

