Article

Cactus Pear (Opuntia ficus-indica) Productivity, Proximal Composition and Soil Parameters as Affected by Planting Time and Agronomic Management in a Semi-Arid Region of India

by
Sunil Kumar
1,
Mounir Louhaichi
2,3,
Palsaniya Dana Ram
1,
Kiran Kumar Tirumala
4,
Shahid Ahmad
1,
Arvind Kumar Rai
5,
Ashutosh Sarker
6,
Sawsan Hassan
7,
Giorgia Liguori
8,*,
Ghosh Probir Kumar
9,
Prabhu Govindasamy
1,
Mahendra Prasad
1,
Sonu Kumar Mahawer
1 and
Bhargavi Hulgathur Appaswamygowda
1
1
Indian Council of Agricultural Research (ICAR), Indian Grassland and Fodder Research Institute, Jhansi 284003, India
2
International Center for Agricultural Research in the Dry Areas (ICARDA), Tunis 1004, Tunisia
3
Department of Animal and Rangeland Science, Oregon State University, Corvallis, OR 97331, USA
4
Indian Council of Agricultural Research (ICAR), Central Tobacco Research Institute, Rajahmundry 533105, India
5
Indian Council of Agricultural Research (ICAR), Central Soil Salinity Research Institute, Karnal 132001, India
6
ICARDA South Asia & China Regional Program Office Block-C, NASC Complex DPS Marg, New Delhi 110012, India
7
International Center for Agricultural Research in the Dry Areas (ICARDA), Amman 11195, Jordan
8
Department of Agricultural, Food and Forest Sciences, University of Palermo, VialedelleScienze, Ed. 4, 90128 Palermo, Italy
9
Indian Council of Agricultural Research (ICAR), National Institute of Biotic Stress Management, Raipur 493225, India
*
Author to whom correspondence should be addressed.
Agronomy 2021, 11(8), 1647; https://doi.org/10.3390/agronomy11081647
Submission received: 15 July 2021 / Revised: 2 August 2021 / Accepted: 13 August 2021 / Published: 18 August 2021

Abstract

:
Study of appropriate planting time and response to agronomic management practices is imperative for the newly introduced cactus pear (Opuntia ficus-indica (L.) Mill.) into a semi-arid region of India. Responses of cactus pear to agronomic practices (planting time and irrigation and fertilizer application) were evaluated to determine the potential for fodder production and livestock feed in a semi-arid environment of India. We assessed four planting times (February, March, July and October) and two agronomic managements (with and without irrigation and fertilizer application) during 2016–2020 at Jhansi, India. Cactus pear establishment and growth improved with planting time in July and October due to favorable soil moisture and congenial temperature. However, plant height (19 cm) and cladode weight (118 g) were greater in July than in October planting. Nutrient uptake and crude protein contents, however, were higher for the earlier plantings of February and April compared to June and October. Irrigation and nutrients application had little effect on the cactus pear plant growth, except on plant width and cladode length and width. Cactus pear can be planted during July in moderately fertile soils without any agronomic intervention in semi-arid situations of India and has potential as an effective alternative source of forage for livestock during the summer months.

1. Introduction

Drylands (arid, semi-arid and dry subhumid) cover 41.3% of the Earth’s land surface [1]. Approximately 44% of farming land is in drylands and supports nearly one billion people and 50% of the world’s livestock and wildlife [1]. Semi-arid regions alone cover approximately 15% of the dryland area and support 14.4% of the world’s population [2]. Semi-arid regions receive 200–700 mm of average annual precipitation and have an aridity index of 0.20–0.50 [3,4]. Farming practices in such ecosystems are extremely vulnerable to precarious climate [5], land degradation [6], marginal land [7] and desertification [1]. Desertification and degradation alone result in a USD 42 billion annual loss of revenue in these regions.
A highly prevalent farming practice in semi-arid and arid regions is the “mixed crop–livestock farming system” [8]. Livestock numbers are high, but feed and water supply are a major concern of farmers in these regions. In India, the practice of open grazing on community land and roadsides is common during the non-cropped season (April–June). In India, the area under fodder cultivation is 8.3 million hectares (Mha) and available green and dry fodder and concentrates are 126, 365 and 34 million tons (Mt), respectively. The current estimated deficit of green and dry fodder in India is 31% and 12%, respectively [9]. In India, the area under forage crops accounts for about 5% of the total gross cropped area and has remained constant over the past few decades. Major drivers of the low productivity of fodder crops are considering fodder crops as a secondary venture after food crops, lower commercial value compared to food crops, use of degraded and marginal land for fodder cultivation, input constraints for most livestock farmers with small land holdings and lack of quality seeds.
These constraints can be managed by practices such as introducing fodder crops in food-based production systems, intercropping with food crops, encouraging intercropping in fodder crops, hortipastoral and silvopastoral systems and promoting new niche areas such as field boundaries, bunds, channels, degraded lands, community pasture resources and other noncompetitive land [10]. When perennial forages are planted in new niche areas (e.g., field boundaries, bunds and channels), they also need care and inputs. In these new niches, forage crops that require minimal management, less attention and less input are preferred by farmers and grazing communities. Cactus pear (Opuntia ficus-indica (L.) Mill.) is a crop that requires little input and care under such situations and it is very popular in low-fertile and water-deficit regions of the world [11,12]. Cactus pear belongs to the Cactaceae family, which includes 122 genera and 1600 species. The genus Opuntia comprises 180 species, among which O. albicarpa, O. ficus-indica and O. robusta are commonly cultivated [13].
Cactus pear has potential to grow in nontraditional areas and can provide a significant amount of forage for livestock. It can produce more dry matter with less irrigation water due to its specialized photosystem namedcrassulacean acid metabolism [14]. Additionally, cactus pear prevents wind and water erosion of soil in dry areas. An established cactus pear plantation can produce ~250 t ha−1 under limited water conditions [13]. It also contains 71 and 264 g kg−1 of crude protein in field and greenhouse conditions, respectively [15]. It is therefore considered a low-cost fodder crop in dry areas.
Although cactus pear is a low-input crop, it can respond well to manipulating agronomic practices and soil types. Previous studies reported that applying higher rates of bovine manure (71.8 Mg ha−1 year−1) promoted nutrient extraction, cactus pear quality, nutrient uptake and dry matter yield [16,17]. Cactus pear accumulated higher nitrogen (N, 191.3 kg ha−1 year−1) and phosphorus (P, 161 kg ha−1 year−1) with application of 190 kg N ha−1 year−1 and 56.8 kg P2O5 ha−1 year−1 under a biennial harvest system, showing that cactus pear responds well to fertilizer rate gradient [18]. Ramos et al. [19] also reported that the biomass yield of cactus pear was 123.81 Mg ha−1 year−1 greater for farmyard manure (FYM) application of 20 Mg ha−1 year−1 compared to without FYM. Nevertheless, the response of cactus pear to supplementation of nutrients and other management practices is highly dependent on soil type and its fertility status.
Soil physiochemical properties can be influenced by tillage [20,21], manure application [22,23] and irrigation [24]. In Nigeria, applying poultry manure and a combination of poultry and cow dung manure improved organic matter (by 14.11–14.70%), organic carbon (OC, by 14–14.66%) and nitrogen (N) content (by 33–43%) in soil polluted with crude oil [25]. Similarly, Tadesse et al. [23] reported that FYM application of 15 t ha−1 increased soil organic carbon (SOC) and N contents and water-holding capacity.
However, only limited studies are available on planting time and nutrient management response of cactus pear for semi-arid regions [26,27]. To realize the full genetic potential of cactus pear, it is necessary to evaluate its planting time, nutritional and water requirements. Such studies are required for obtaining better yields in each soil and climatic situation. This study was undertaken to evaluate the response of cactus pear growth and soil properties to different planting times and farmyard manure (FYM) and irrigation application. The results are expected to provide guidance to farmers about when to plant and how to manage cactus pear with minimal input resources for semi-arid situations in India.

2. Materials and Methods

2.1. Experimental Site

A field experiment was set up at the ICAR-Indian Grassland and Fodder Research Institute (IGFRI), Crop Production Research Farm (25°31′38.5″ N, 78°33′39.4″ E, 233 m asl) in Jhansi, Uttar Pradesh, India, during 2016–2020. Soil type of the experimental site is a sandy clay loam, with pH 6.56, medium soil fertility (N (215.75 kg ha−1), phosphorus (P, 16.53 kg ha−1) and potassium (K, 271.44 kg ha−1)) and low organic C (OC, 0.41%). The five-year (2016–2020) average maximum and minimum temperatures of the study site varied from 31.7–32.9 °C and 19.3–20.3 °C, respectively and total annual rainfall also varied from 690–1121 mm (Table 1), while the long-term average annual rainfall of this region is 887.8 mm.

2.2. Experimental Design and Treatments Description

The best-performing cactus pear accession “Yellow San Cono” was used for this study based on results obtained from previous evaluation observation in IGFRI, Jhansi [9]. The trial consisted of four planting dates: February, April, July and October 2016 and two agronomic managements (two fertilizer and irrigation combinations): control and irrigation and fertilization treatments, during planting time 2 kg plant−1 of farmyard manure (4.0 N, 1.16 P and 3.1 K, g kg−1) and 10 L plant−1 of water were applied for both control and irrigation and fertilization treatments.Afterwards, in the irrigation and fertilizer treatment, the application of 2 kg plant−1 of FYM was scheduled according to irrigation and fertilizer treatment plots annually during the three growing seasons (summer, rainy and winter seasons) and need-based irrigation (when cladodes showed shrinking and displaying yellowing symptoms) was also applied, whereas the control plots were maintained without any irrigation or FYM application. Weed management was carried out using a directed spray of glyphosate (1.0 kg a.i. ha−1) during the rainy season of each year.
All treatments were replicated three times in a randomized complete block design. Individual plots were 10 m long and 8 m wide, separated by 3 m alleys. The cactus pear cladodes were planted at 2 m row spacing and 1 m plant spacing.

2.3. Agronomical Observations

Data on cactus pear growth and biomass yield were first recorded during 2018 at 2 years after planting (i.e., 2016) and in 2020 after another gap of 2 years. For growth observations, three plants were randomly identified and tagged from each plot and the average values taken as a final observation. Plant height was measured from the plant base up to the highest point and plant width was measured as the maximum width of the plant. The numbers of cladodes per plant were also counted for the randomly selected plants. Cladode length was measured from the base of the cladode and cladode width was measured at the broadest part using a digital caliper (VCF200, MGW precision, c/o Amazon Seller Services Private Limited, Bangalore, India). For this, we randomly selected 10 cladodes (age 2 years). Fresh and dry weights of cladodes were measured during harvest of cladodes. To calculate the dry weight, the cladodes were chopped, airdried for a few days and then oven dried (PTE-510-H, Unique Tech Engineering, Bhopal, India) at 65 °C to a constant weight. For both years of the study, three cactus pear plants (randomly selected) plot−1 were harvested and weighed to determine the fresh biomass yield plant−1.

2.4. Laboratory Analysis for Proximate Values

The plant parts (cladodes and primary and secondary branches) were collected at maturity from 4-year-old plants, washed with 0.2% detergent solution, 0.1 N HCl and finally with double distilled water. They were dried at 60 °C for 48 h in a hot-air oven (PTE-510-H, Unique Tech Engineering, Bhopal, India). The dry plant materials were finely ground. Plant N and crude protein (N content × 6.25) were analyzed using the modified Kjeldahl method (DISTYL EMS, KEL PLUS [28]). After the digestion using 10 mL of diacid mixture (4:1 v/v HNO3:HClO4), the plant P and K were analyzed using colorimetric (U128, Hitachi, Fukuoka, Japan [28]) and flame photometer meter methods (T-128, Systronics, Ahmedabad, India [29]), respectively. The Fe, Mn, Zn and Cu contents in cladode dry matter were determined using an atomic absorption spectrophotometer (AA240, Varian, Mulgrave, Australia) as per the procedure outlined by Tandon [30].

2.5. Soil Analysis

During December 2018 and 2020, topsoil (0–15 cm) using a soil auger was collected from the center of each plot. For each control and irrigation and fertilization treatments, soil samples collected from the same replicate were combined into one composite sample (six per treatment per year). Prior to chemical analysis, soil samples were airdried and crushed to a diameter of 2 mm. Soil pH and electrical conductivity (EC) were determined using the methods of Jackson [29], SOC by wet oxidation method [30], available N by KMnO4 oxidizable method [31], available P using 0.5 M NaHCO3 at pH 8.5 [32] and available K using 1 N neutral ammonium acetate [33]. Micronutrients such as iron (Fe), zinc (Zn), copper (Cu) and manganese (Mn) were analyzed using atomic absorption spectroscopy (AA240, Varian, Mulgrave, Australia; [34]). Soil microbial biomass carbon (SMBC) was determined by chloroform fumigation–incubation method [35].

2.6. Data Handling and Analysis

All biometric parameter data were subjected to a two-way variance analysis (ANOVA) using PROC GLIMMIX in SAS 9.3. The two-way ANOVA followed a mixed model procedure (i.e., random effects were year and replication and fixed effects were planting time and agronomical management). The normality of residuals was checked before performing ANOVA using the PROC UNIVARIATE procedure (Shapiro–Wilk test) and all data were found to be normal. For soil properties and nutrient data, a two-way ANOVA was also conducted with year and agronomic practices as main effects and replication as a random effect. The soil data relating to the sowing date were not considered for this statistical analysis because of the lack of a practical relationship between the sowing date and soil properties. The plant proximal composition was also analyzed using the same ANOVA procedure of PROC GLIMMIX, with year and replication kept as random effects and planting time and agronomic management as fixed effects. The least significant difference test was used to test significance (p < 0.05) between treatments.

3. Results and Discussion

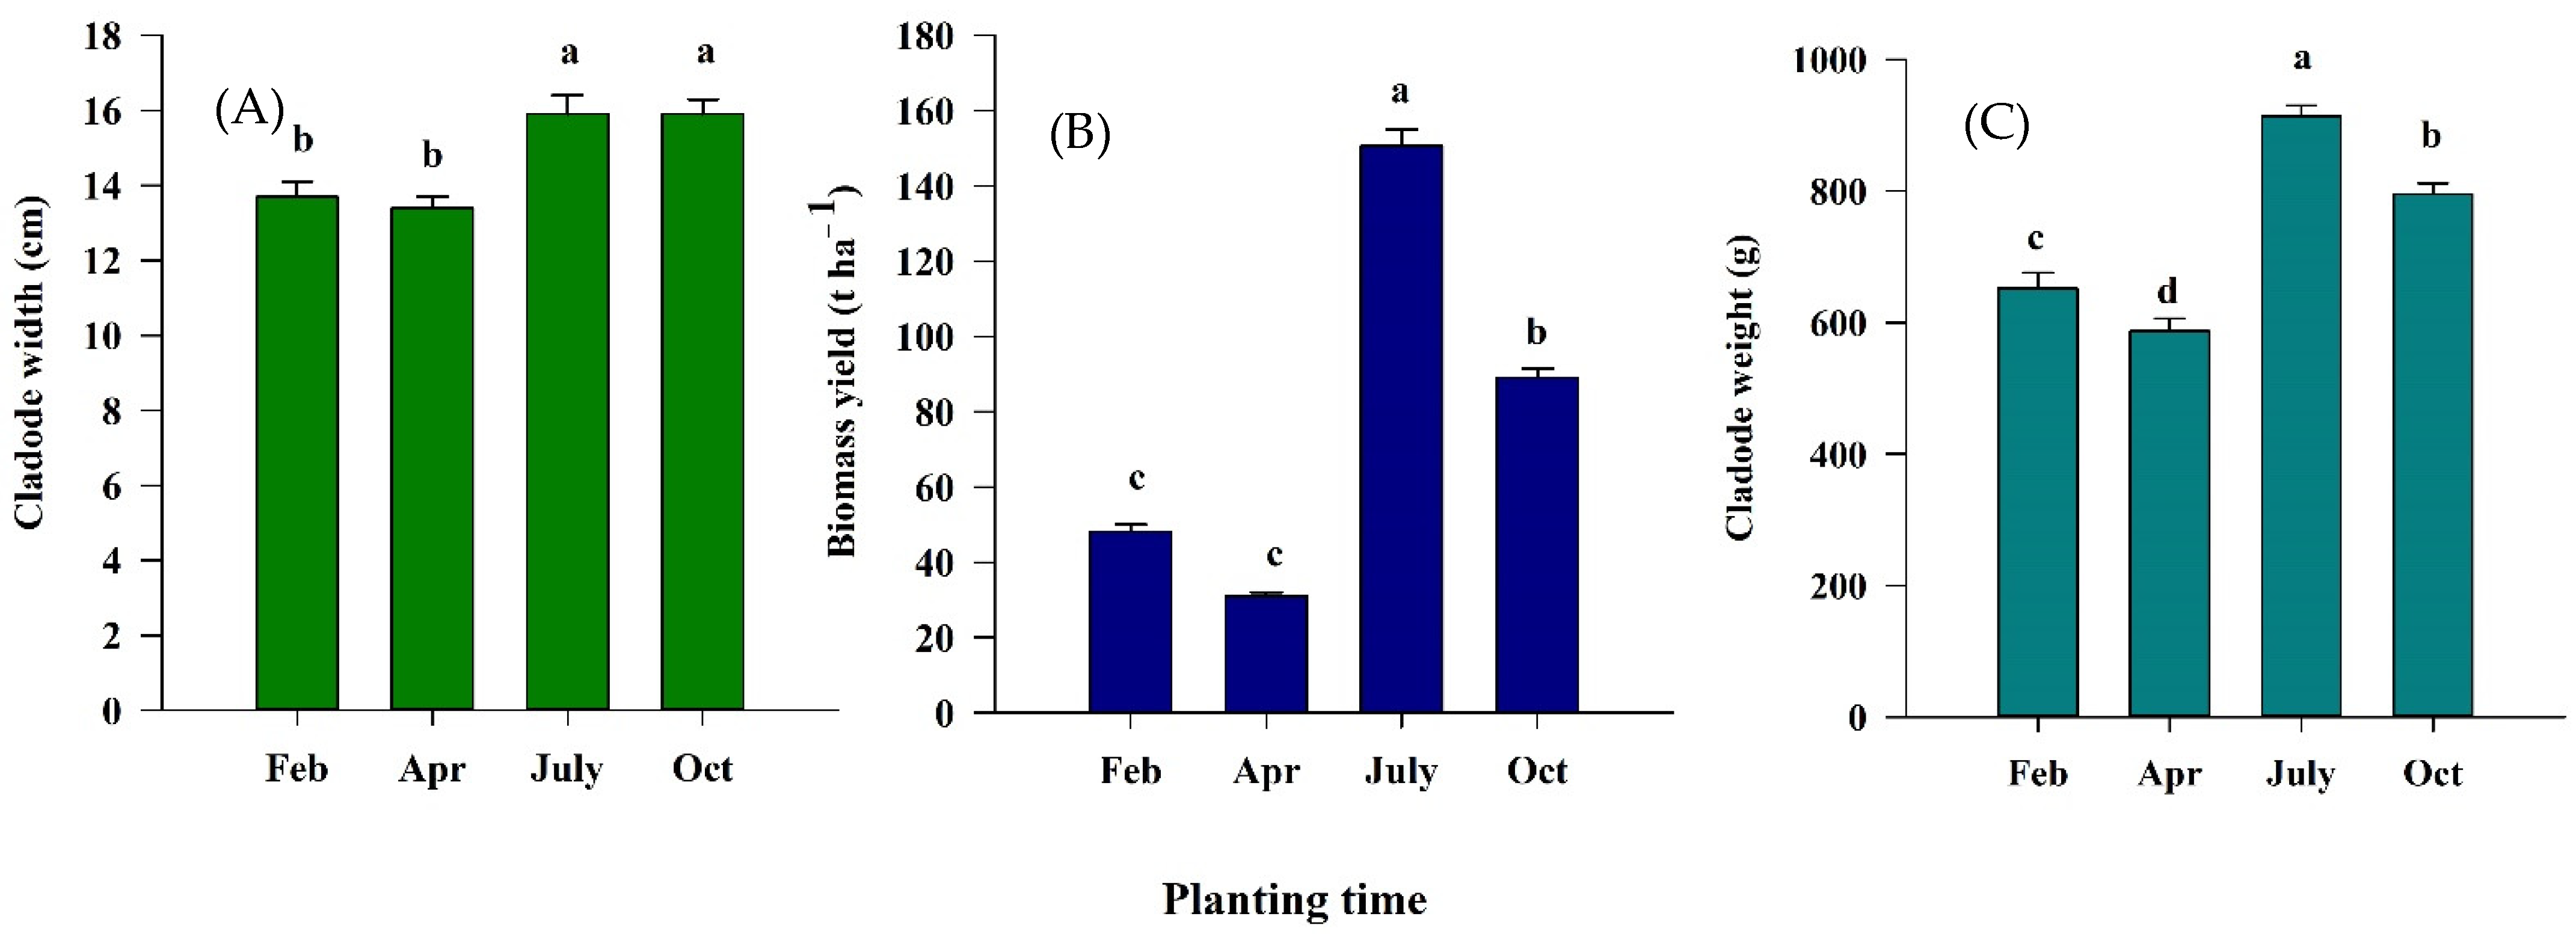
3.1. Agronomic Management Practices and Cactus Pear Growth

The planting time × agronomic management practices interaction was not significant (p > 0.05) for the growth and yield parameters. However, the main effect of planting time had a significant effect (p < 0.05) on all growth and yield parameters of cactus pear (Table 2).
Cladodes planted in July had greater plant height, plant width, cladode number, cladode weight and biomass yield, followed by planting in October (Table 3). However, there was no significant difference in cladode width between July- and October-planted cladodes (Figure 1). The July-planted cladodes had greater plant height (130.1 cm), plant width (126.4 cm), cladode number (32.5 cladode plant−1), cladode weight (914 g) and biomass yield (157 t ha−1) compared to October-planted cladodes (Table 3 and Figure 1). Compared to July and October planting, lower plant height (by 34–41%; 76.8–86 cm), plant width (37–48%; 66–79.1 cm), cladode number (56–69%; 10.2–14.2 cladode plant−1), cladode weight (28–36%; 585.1–652.2 g) and biomass yield (68–79%; 29.5–47.5 t ha−1) were recorded during April and February, respectively. This could highlight differences in weather and soil moisture availability during the planting season. The average annual rainfall and temperature were highly variable over the months during the growing season (Table 1). Changes in weather variables have a significant effect on cactus pear growth and biomass yield [36]. In Brazil, Souza et al. [37] also reported that optimal maximum and minimum temperatures for better cactus pear growth and development were 28.5–31.5 °C and 8.6–20.4 °C, respectively. In India, optimal temperatures for cactus pear growth prevailed during the second half (July–December) compared to the first half of the year (January–June). In addition, the monsoon season (July–December) also encourages cactus pear growth and development compared to the drier months of January–June (Table 1). Therefore, planting during July–October may be favorable for sprouting, growth and biomass yield of cactus pear in similar semi-arid areas.
The ANOVA demonstrated a significant effect of agronomic management practices for plant width, cladode length and cladode width. However, plant height, cladode number, cladode weight and biomass yield were not influenced by agronomic practices (Table 4).
The irrigated and fertilized plots showed greater plant width (100.1 cm), cladode length (33.5 cm) and cladode width (15.4) compared to without irrigation and fertilizer plots where the plant width, cladode length and cladode width were recorded as 91, 32.1 and 14 cm, respectively (Table 4).
Previous studies have also shown that cactus pear responds strongly to fertilizer application and irrigation [38,39]. A study conducted in Brazil showed a positive response of cactus pear growth and yield with an increase in N and P fertilization rate up to 130 kg ha−1 N and 190 kg ha−1 P under an annual harvest schedule [18]. Similarly, cactus pear also responds to irrigation, with higher plant growth and yield [40,41]. The significant response of plant growth and yield to irrigation and fertilizer application may be due to higher capacity to produce biomass per unit time [18,42]. The lack of effect of agronomic management on plant height, cladode number, cladode weight and biomass yield could be due to several other factors such as plant character, acclimatization ability in a new environment and genotype genetic potential. Overall, fertilizer application and irrigation clearly affected some growth attributes of cactus pear.

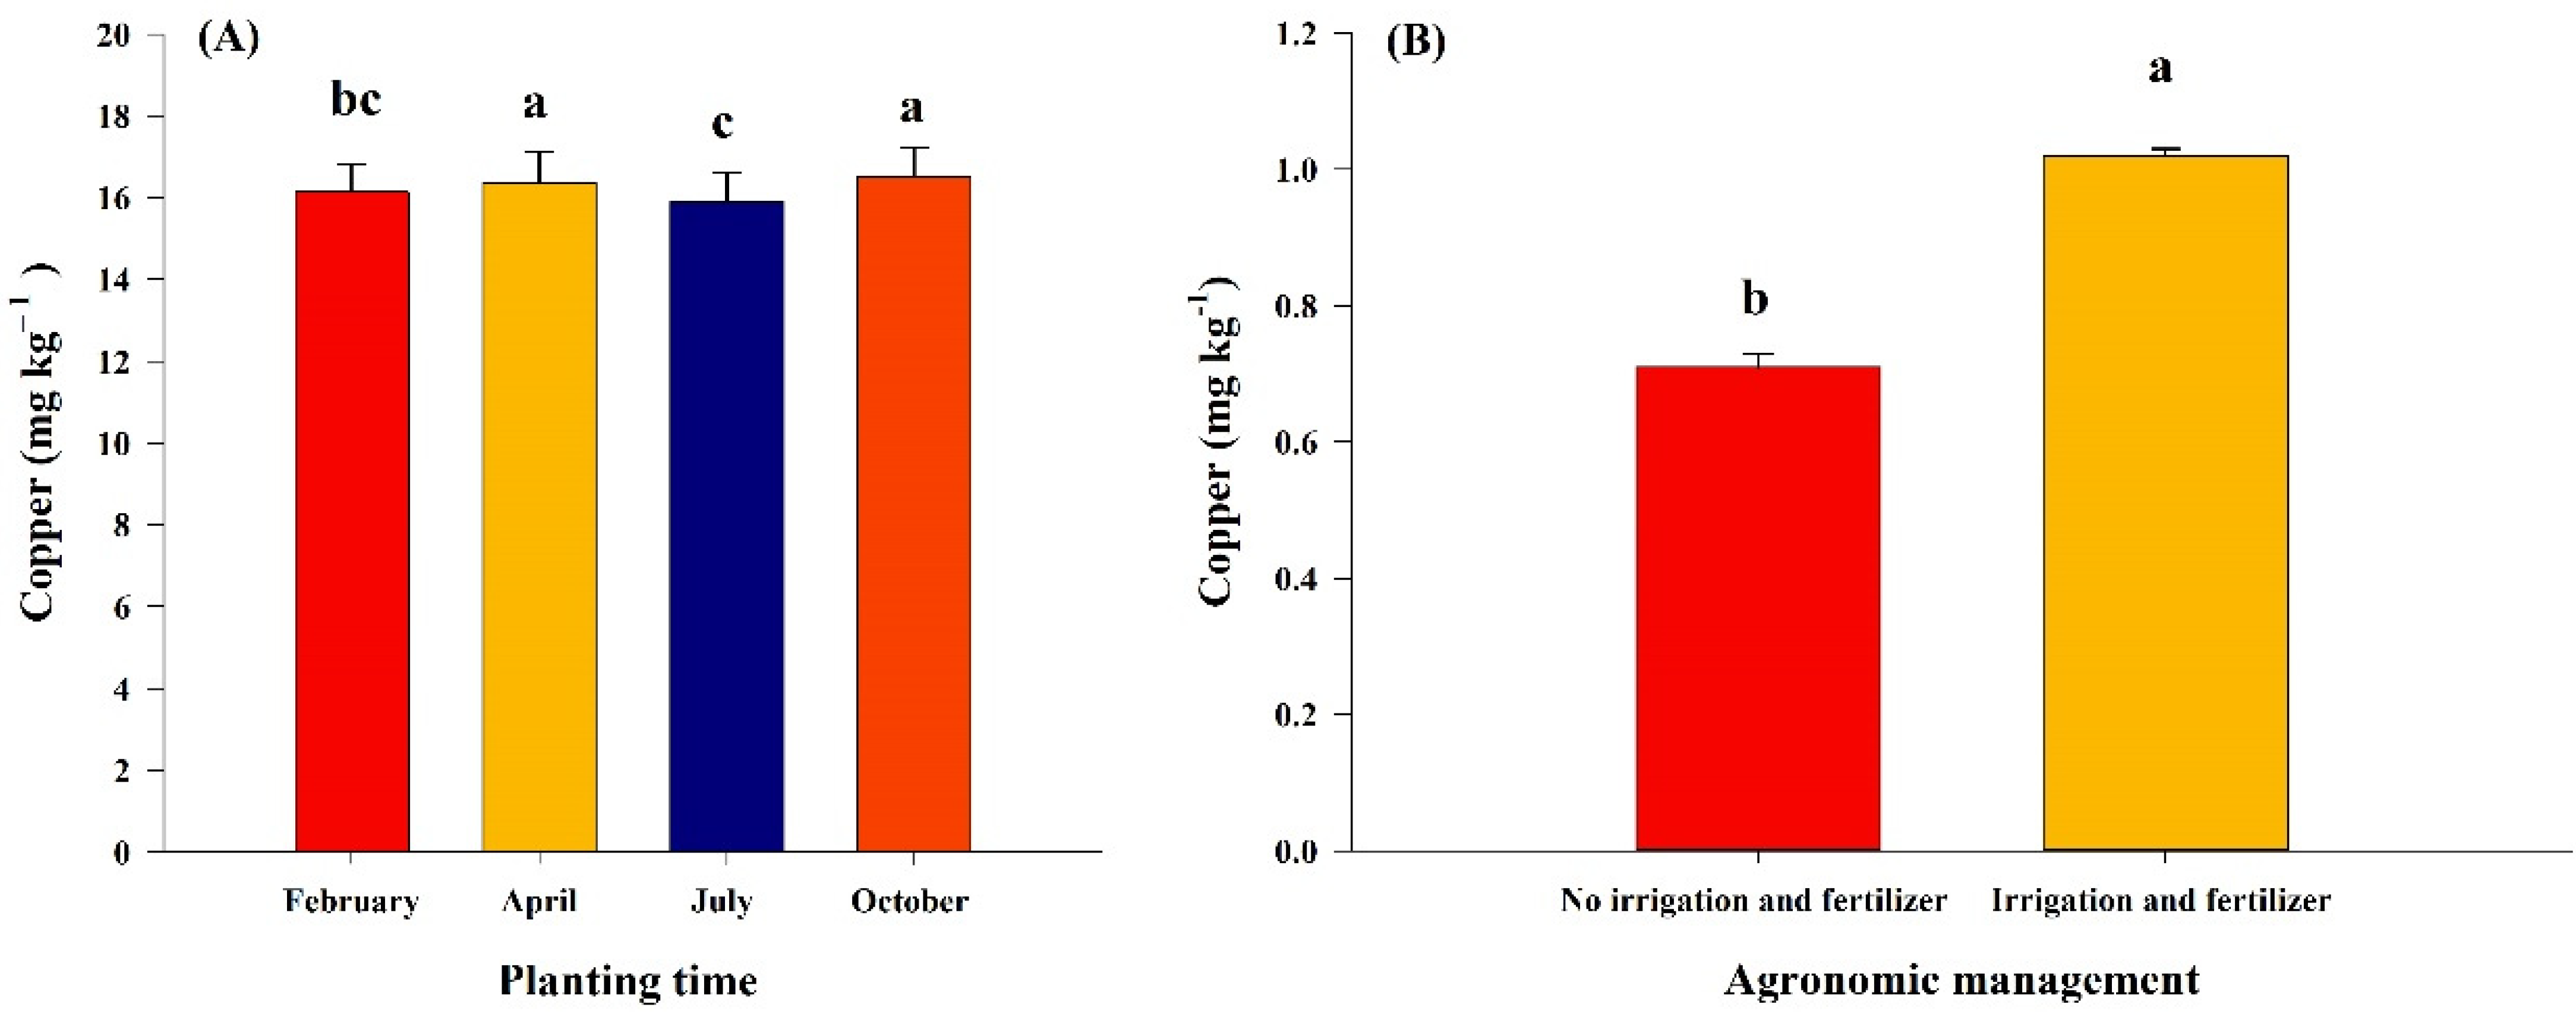
3.2. Cactus Pear Nutrient and Crude Protein Content

The main effect of both planting time and application of irrigation and fertilizer treatments and their interaction on crude protein and all nutrient contents in cactus pear were significant except for Cu, which was affected by the main effects of irrigation and fertilizer application and planting time, but not by their interaction (Table 5 and Figure 2).
Macronutrient uptake by plants varied considerably with planting time, but all responded in the same way to agronomic management practice. However, total N only was affected by agronomic management practices; irrigation and fertilizer treatment recorded a higher total N uptake than the without irrigation and fertilizer. Total P and K uptake was higher in those planted in April and February compared with July and October (Table 5). Plant total P and K contents ranged within 1.4–2.6 g kg−1 and 23.7–29.7 g kg−1, respectively. Among micronutrients, plant Zn and Mn contents were greater in February-planted cactus pear with application of irrigation and fertilizer (Table 5). However, Fe and Cu levels in plants were higher in July and in April and October, respectively, with irrigation and fertilizer application (Table 5). Similar to plant total K, Zn and Mn, the crude protein content was also higher in February-planted cactus pear with the application of irrigation and fertilizer (Table 5). Several studies conducted on different forage crops concluded that the uptake of nutrients and crude protein was influenced by planting time and agronomic practices [43,44]. Rao and Northup [44] reported that delayed planting (i.e., after June) of forage crops is more beneficial for crop yield and vice versa for quality aspects. It is evident from our study that cactus pear planted after June produced higher biomass but a lower nutrient content than cactus pear planted earlier. Probably, cladodes planted in June accumulated more moisture and used all their energy and photosynthates for growth rather than accumulation of nutrients and protein. Fertilizer, irrigation and appropriate timing of planting were likely the reasons for differences in accumulation of macronutrients and micronutrients.

3.3. Change in Soil Properties and Nutrient Status

The year × agronomic practices interaction effect was not significant for soil properties and nutrient content (p > 0.05). However, the individual effects of year and agronomic practices were significant for bulk density (BD), SOC, N and P (Table 6 and Table 7). Some soil properties and nutrients (i.e., pH, EC, SMBC, K, Fe, Zn, Cu and Mn) were only affected by agronomic practices (Table 6 and Table 7).
The SOC and SMBC were 3.57 and 6.92% higher at the study site in the irrigated and fertilized plots (5.9 g kg−1, 867 mg kg−1, respectively) than in the site without irrigation and fertilizer plots (5 g kg−1, 807 mg kg−1, respectively, Table 6); however, soil pH and electrical conductivity were higher in the control plots (6.81, 0.11 dS m−1, respectively) than plots with irrigation and fertilizer (6.55, 0.09 dS m−1, respectively, Table 6). The only notable effect of the year factor was for BD and SOC; compared to 2018, these were 1.4% and 1.81% higher in 2020, respectively, this is due to the role of cactus pear in enhancing accumulation of SOC in soils through the root turnover [45,46]. Due to the cactus pear high water-use efficiency, the addition of organic manure and irrigation may have enhanced the water availability and root absorption of both water nutrients, which consequently enable greater growth of cactus pear roots and cladodes and increased the soil organic matter (SOM) caused by root activity [47,48]. SMBC is highly affected by SOM and this significant positive relationship was reported by many researchers [49,50,51,52]. High variability in the relationship between manure application and soil acidity was found in the literature [53]. In the current study, the decrease in soil pH might be related to the soil conditions or to the acidifying effect of manure application [53,54]. In a short-term study (7 years), Li et al. [55] observed a 10% decrease in soil pH and a 44.19% increase in SOC under drip irrigation with organic fertilizer treatment compared to before the treatments commenced.
Soil macronutrient (i.e., N, P and K) and micronutrient (i.e., Fe, Zn, Cu and Mn) status was greatly influenced by the application of irrigation and fertilizer (Table 7). In the irrigated and fertilized plots, the N, P, K, Fe, Ze, Cu and Mn contents were higher than in the non-irrigated and nonfertilized plots. In irrigated and fertilized plots, the mean of mineral contents was 234, 19 and 327 kg ha−1 for N, P and K, respectively; Fe, Zn, Cu and Mn contents in the irrigated and fertilized plots were recorded as 21, 1.5, 1.6 and 22.4 mg kg−1, respectively and were higher by 23.8, 20, 20 and 20.8% than in the non-irrigated and nonfertilized plots. The levels of N (234–250 kg ha−1), P (19–20 kg ha−1,), K (327–363 kg ha−1,), Fe (16–21 mg kg−1), Zn (1.2–1.5 mg kg−1), Cu (1.3–1.6 mg kg−1) and Mn (17.9–22.4 mg kg−1) were in the medium range in the study site. The positive effect of year was observed only in soil N and P contents; in 2020, soil N (243 kg ha−1) and P (20 kg ha−1) contents were higher compared to 2018, with 241 and 20 kg ha−1, respectively. Our findings are consistent with previous research [56]. Increases in macronutrient and micronutrient contents in the irrigated and fertilized plots were probably due to the combined effect of irrigation and fertilizer, which might have promoted the conversion of crop residues to SOC and growth of the microbial population [55,57]. Overall, the short-term application of a combination of irrigation and fertilizer could promote microbial activity, SOC buildup and nutritional status of cactus pear.

4. Conclusions

Cactus pear is gaining increasing interest across the globe because of its unique characteristics, which provide resilience to climate change impact and population pressures. Despite its relatively recent introduction into India, cactus pear has proven its potential to make a contribution in minimizing green fodder shortage. Nevertheless, a proper understanding of the yield responses to different strategies of agronomic management under field conditions would help to increase crop productivity. The aim of this study was to explore the effects of planting time and agronomic practices (irrigation and FYM application) on cactus pear growth and development in a semi-arid region of India. Establishment and growth were better for planting in July and October due to having enough soil moisture and optimal temperature. However, July was a better planting time than October in many aspects (plant height and width and cladode number and weight), indicating that cactus pear responded well to the monsoon season. Similarly, agronomic practices also influenced some of the biometric characteristics, such as plant width, cladode length and cladode width, but not important agronomic features, such as plant height, cladode number, cladode weight and biomass yield. This could be due to soil fertility at the study site, which was sufficient to support cactus pear growth without irrigation and fertilizer application. The nutrients and crude protein contents were influenced by planting time and agronomic management practices and vice versa for biomass yield. This study clearly showed that cactus pear cladodes planted in July in moderately fertile soils with no nutrient supply and irrigation under semi-arid conditions in India showed better results than other planting times. However, the response to management practices (i.e., nutrients and irrigation application) may depend on ecosystem soil type and rainfall.

Author Contributions

Conceptualization, M.L., S.K., S.H. and G.P.K.; methodology, S.K., M.L., P.D.R., K.K.T., S.A., A.K.R., S.H. and G.P.K.; software, P.G., M.P., S.K.M. and B.H.A.; validation, M.L., S.H. and G.L.; formal analysis, M.P. and P.G.; investigation, P.D.R., K.K.T., S.A. and A.K.R.; resources, S.K., M.L., S.H. and G.P.K.; writing—original draft preparation, P.G. and S.K.; writing—review and editing, S.K., M.L., G.L., G.P.K., P.G., S.K.M. and B.H.A.; visualization, P.G., S.K.M. and B.H.A.; supervision, M.L., G.P.K. and S.K.; project administration, A.S., M.L. and G.P.K.; funding acquisition, S.A. and M.L. All authors have read and agreed to the published version of the manuscript.

Funding

This research was funded by the Indian Council of Agricultural Research and the CGIAR Research agreement No. 200091 and Program on Livestock Agri-Food Systems agreement No 200173.

Institutional Review Board Statement

Not applicable.

Informed Consent Statement

Not applicable.

Data Availability Statement

Data sharing is not applicable to this article.

Acknowledgments

This work was undertaken by ICARDA as part of promoting cactus pear (Opuntia ficus-indica) as a drought-resilient feed resource under different agroecological production systems across India within the framework of the CGIAR Research Program on Livestock Agri-Food Systems. The opinions expressed in this work belong to the authors and do not necessarily reflect those of ICARDA, or CGIAR.

Conflicts of Interest

The authors declare no conflict of interest.

References

  1. UNDDD. United Nation Decade for Desert and the Fight against Desertification. 2009. Available online: https://www.un.org/en/events/desertification_decade/whynow.shtml (accessed on 12 July 2021).
  2. Huang, J.; Ji, M.; Xie, Y.; Wang, S.; He, Y.; Ran, J. Global semi-arid climate change over last 60 years. Clim. Dyn. 2016, 46, 1131–1150. [Google Scholar] [CrossRef] [Green Version]
  3. Gallart, F.; Solé, A.; Puigdefábregas, J.; Lázaro, R. Badland Systems in the Mediterranean; John Wiley & Sons, Ltd.: Chichester, UK, 2002; pp. 299–326. [Google Scholar]
  4. Lal, R. Carbon sequestration in dryland ecosystems. Environ. Manag. 2004, 33, 528–544. [Google Scholar] [CrossRef]
  5. Huang, J.; Minnis, P.; Yan, H.; Yi, Y.; Chen, B.; Zhang, L.; Ayers, J. Dust aerosol effect on semi-arid climate over Northwest China detected from A-Train satellite measurements. Atmos. Chem. Phys. 2010, 10, 6863–6872. [Google Scholar] [CrossRef] [Green Version]
  6. Li, A.; Wu, J.; Huang, J. Distinguishing between human-induced and climate-driven vegetation changes: A critical application of RESTREND in inner Mongolia. Landsc. Ecol. 2012, 27, 969–982. [Google Scholar] [CrossRef]
  7. Liu, H.; Yin, Y.; Tian, Y.; Ren, J.; Wang, H. Climatic and anthropo-genic controls of topsoil features in the semi-arid East Asian steppe. Geophys. Res. Lett. 2008, 35, L04401. [Google Scholar] [CrossRef]
  8. Schiere, H.; Louis Baumhardt, R.; Van Keulen, H.; Whitbread, A.M.; Bruinsma, A.S.; Goodchild, T.; Gregorini, P.; Slingerland, M.; Hartwell, B. Mixed crop-livestock systems in semiarid regions. Dryland Agric. 2006, 23, 227–291. [Google Scholar]
  9. IGFRI. Vision 2050; ICAR-Indian Grassland and Fodder Research Institute: Jhansi, India, 2015. [Google Scholar]
  10. Gupta, G.; Palsaniya, D.R.; Upadhyay, D.; Manjanagouda, S.S.; Suman, M.; Chand, K.; Patel, R.K.; Sharma, R.K. Fodder technology intervention for round the year feed security to livestock. Vigyan Varta 2020, 1, 1–5. [Google Scholar]
  11. Guevara, J.C.; Felker, P.; Balzarini, M.G.; Páez, S.A.; Estevez, O.R.; Paez, M.N.; Antúnez, J.C. Productivity, cold hardiness and forage quality of spineless progeny of the Opuntia ficus-indica 1281 x O. lindheimerii 1250 cross in Mendoza plain. Argentina. J. Prof. Assoc. Cactus Dev. 2011, 13, 48–62. [Google Scholar]
  12. Guevara, J.C.; Suassuna, P.; Felker, P. Opuntia forage production systems: Status and prospects for rangeland applications. Range. Ecol. Manag. 2009, 62, 428–434. [Google Scholar] [CrossRef]
  13. Dev, R.; Dayal, D.; Shamshudeen, M.; Yadav, O.P. Thornless cactus: An unconventional, valuable fodder resource in arid region of India. Indian Farming. 2018, 68, 101–103. [Google Scholar]
  14. Pessoa, D.V.; de Andrade, A.P.; Magalhães, A.L.; Teodoro, A.L.; dos Santos, D.C.; de Araújo, G.G.; de Medeiros, A.N.; do Nascimento, D.B.; de Lima Valença, R.; Cardoso, D.B. Forage cactus of the genus Opuntia in different with the phenological phase: Nutritional value. J. Arid Environ. 2020, 181, 104243. [Google Scholar] [CrossRef]
  15. Mayer, J.A.; Cushman, J.C. Nutritional and mineral content of prickly pear cactus: A highly water-use efficient forage, fodder and food species. J. Agron. Crop. Sci. 2019, 205, 625–634. [Google Scholar] [CrossRef]
  16. Donato, P.E.; Donato, S.L.; Silva, J.A.; Pires, A.J.; Junior, S. Extraction/exportation of macronutrients by cladodes of ‘Gigante’ cactus pear under different spacings and organic fertilization. Rev. Bras. Eng. Agric. Ambient. 2017, 21, 238–243. [Google Scholar] [CrossRef] [Green Version]
  17. Donato, P.E.; Pires, A.J.; Donato, S.L.; Bonomo, P.; Silva, J.A.; Aquino, A.A. Morfometria e rendimento da palma forrageira ‘Gigante’ sob diferentes espaçamentos e doses de adubação orgânica. Rev. Bras. Cienc. Agrar. 2014, 9, 151–158. [Google Scholar] [CrossRef] [Green Version]
  18. Lopes, M.N.; Cândido, M.J.D.; Silveira, W.M.; Maranhão, T.D.; Soares, I.; Pompeu, R.C.F.F.; Silva, R.G.D.; Carneiro, M.S.D.S. Accumulation and export of nutrients in cactus pear cladodes (Opuntia ficus-indica) under different managements in the Brazilian Semiarid. Rev. Bras. Zootec. 2018, 47, e20170077. [Google Scholar] [CrossRef] [Green Version]
  19. Ramos, J.P.D.F.; Santos, E.M.; Cruz, G.R.B.; Pinho, R.M.A.; de Freitas, P.M.D. Effects of harvest management and manure levels on cactus pear productivity. Rev. Caatinga 2015, 28, 135–142. [Google Scholar]
  20. Govindasamy, P.; Liu, R.; Provin, T.; Rajan, N.; Hons, F.; Mowrer, J.; Bagavathiannan, M. Soil carbon improvement under long-term (36 years) no-till sorghum production in a sub-tropical environment. Soil Use Manag. 2021, 37, 37–48. [Google Scholar] [CrossRef]
  21. Govindasamy, P.; Mowrer, J.; Rajan, N.; Provin, T.; Hons, F.; Bagavathiannan, M. Influence of long-term (36 years) tillage practices on soil physical properties in a grain sorghum experiment in southeast Texas. Arch. Agron. Soil Sci. 2021, 67, 234–244. [Google Scholar] [CrossRef]
  22. Adeyemo, A.J.; Agele, S.O. Effects of tillage and manure application on soil physicochemical properties and yield of maize grown on a degraded intensively tilled alfisol in southwestern Nigeria. J. Soil Sci. Environ. Manag. 2010, 1, 205–216. [Google Scholar]
  23. Tadesse, T.; Dechassa, N.; Bayu, W.; Gebeyehu, S. Effects of farmyard manure and inorganic fertilizer application on soil physico-chemical properties and nutrient balance in rain-fed lowland rice ecosystem. Am. J. Plant. Sci. 2013, 4, 309–316. [Google Scholar] [CrossRef] [Green Version]
  24. Zhang, C.; Li, X.; Yan, H.; Ullah, I.; Zuo, Z.; Li, L.; Yu, J. Effects of irrigation quantity and biochar on soil physical properties, growth characteristics, yield and quality of greenhouse tomato. Agric. Water Manag. 2020, 241, 106263. [Google Scholar] [CrossRef]
  25. Obasi, N.A.; Eze, E.; Anyanwu, D.I.; Okorie, U.C. Effects of organic manures on the physicochemical properties of crude oil polluted soils. Afr. J. Biochem. Res. 2013, 7, 67–75. [Google Scholar]
  26. Singh, R.S.; Singh, V. Growth and development influenced by size, age, and planting methods of cladodes in cactus pear (Opuntia ficus-indica (L.) Mill.). J. PACD 2003, 10, 47–54. [Google Scholar]
  27. Soni, M.L.; Yadava, N.D.; Kumar, S.; Roy, M.M. Evaluation for growth and yield performance of prickly pear cactus (Opuntia ficus-indica (L.) Mill) accessions in hot arid region of Bikaner, India. Range Manag. Agrofor. 2015, 36, 19–25. [Google Scholar]
  28. Gupta, P.K. Methods in environmental analysis water, soil and air. Agrobios 2000, 5, 1–400. [Google Scholar]
  29. Jackson, M.L. Soil Chemical Analysis, 2nd ed.; Advanced Course: Madison, WI, USA, 1973. [Google Scholar]
  30. Walkley, A.; Black, I.A. An examination of the Degtjareff method for determining soil organic matter, and a proposed modification of the chromic acid titration method. Soil Sci. 1934, 37, 29–38. [Google Scholar] [CrossRef]
  31. Subbiah, B.V.; Asija, G.L. A rapid method for estimation of available N in soil. Curr. Sci. 1956, 25, 259–260. [Google Scholar]
  32. Olsen, S.R.; Cole, C.V.; Watanabe, F.S.; Dean, L.A. Estimation of Available Phosphorus in Soils by Extraction with Sodium Bicarbonate; United States Department of Agriculture: Washington, DC, USA, 1954.
  33. Hanway, J.J.; Heidel, H. Soil analysis methods as used in Iowa state college soil testing laboratory. Iowa Agric. 1952, 57, 1–31. [Google Scholar]
  34. Tandon, H.L.S. Methods of Analysis of Soils, Plants, Waters, Fertilizers and Organic Manures; Fertilizer Development and Consultation Organization: New Delhi, India, 2013. [Google Scholar]
  35. Jenkinson, D.S.; Powlson, D.S. The effects of biocidal treatments on metabolism in soil—V: A method for measuring soil biomass. Soil Boil. Biochem. 1976, 8, 209–213. [Google Scholar] [CrossRef]
  36. Silva, R.R.; Sampaio, E.V.S.B. Palmas forrageiras Opuntia fícus-indica e Nopalea cochenillifera: Sistemas de produção e usos (Opuntia fícus-indica and Nopalea cochenillifera cacti: Production systems and uses). Rev. Geama. 2015, 1, 151–161. [Google Scholar]
  37. Souza, L.S.B.; de Moura, M.S.B.; da Silva, T.G.F.; Soares, J.M.; do Carmo, J.F.A.; Brandão, E.O. Indicadoresclimáticos Para o Zoneamentoagrícola da Palmaforrageira (Opuntia sp.). 2008. Available online: https://www.alice.cnptia.embrapa.br/bitstream/doc/156105/1/OPB2185.pdf (accessed on 12 July 2021).
  38. Dubeux, J.C.B., Jr.; Araújo Filho, J.T.; Santos, M.V.F.; Lira, M.A.; Santos, D.C.; Pessoa, R.A.S. Adubação mineral no crescimento e composição mineral da palma forrageira—Clone IPA-20. Rev. Bras. Cienc. Agrar. 2010, 5, 129–135. [Google Scholar]
  39. Silva, J.A.; Bonomo, P.; Donato, S.L.R.; Pires, A.J.V.; Rosa, R.C.C.; Donato, P.E.R. Composição mineral em cladódios de palma forrageira sob diferentes espaçamentos e adubações química. Rev. Bras. Cienc. Agrar. 2012, 7, 866–875. [Google Scholar] [CrossRef] [Green Version]
  40. Arba, M.; Falisse, A.; Choukr-Allah, R.; Sindic, M. Effect of irrigation at critical stages on the phenology of flowering and fruiting of the cactus Opuntia spp. Braz. J. Biol. 2018, 78, 653–660. [Google Scholar] [CrossRef] [PubMed] [Green Version]
  41. Freire, J.D.L.; Santos, M.V.F.; Dubeux, J.C.B., Jr.; BezerraNeto, E.G.Í.D.I.O.; Lira, M.D.A.; Cunha, M.V.; Santos, D.C.; Amorim, S.O.; Mello, A.C.L. Growth of cactus pear cv. Miúda under different salinity levels and irrigation frequencies. An. Acad. Bras. Cienc. 2018, 90, 3893–3900. [Google Scholar] [CrossRef] [PubMed]
  42. Silva, N.G.D.M.E.; Santos, M.V.F.D.; Dubeux, J.C.B., Jr.; Cunha, M.V.D.; Lira, M.D.A.; Ferraz, I. Effects of planting density and organic fertilization doses on productive efficiency of cactus pear. Rev. Caatinga 2016, 29, 976–983. [Google Scholar] [CrossRef]
  43. Graybill, J.S.; Cox, W.J.; Otis, D.J. Yield and quality of forage maize as influenced by hybrid, planting date, and plant density. Agron. J. 1991, 83, 559–564. [Google Scholar] [CrossRef]
  44. Rao, S.C.; Northup, B.K. Planting date affects production and quality of grass pea forage. Crop. Sci. 2008, 48, 1629–1635. [Google Scholar] [CrossRef]
  45. Hassan, S.; Inglese, P.; Gristina, L.; Liguori, G.; Novara, A.; Louhaichi, M.; Sortino, G. Root growth and soil carbon turnover in Opuntia ficus-indica as affected by soil volume availability. Eur. J. Agron. 2019, 105, 104–110. [Google Scholar] [CrossRef]
  46. Novara, A.; Pereira, P.; Santoro, A.; Kuzyakov, Y.; La Mantia, T. Effect of cactus pear cultivation after Mediterranean maquis on soil carbon stock, δ13C spatial distribution and root turnover. Catena 2014, 118, 84–90. [Google Scholar] [CrossRef]
  47. Dijkstra, F.A.; Carrillo, Y.; Pendall, E.; Morgan, J.A. Rhizosphere priming: A nutrient perspective. Front. Microbiol. 2013, 4, 216. [Google Scholar] [CrossRef] [Green Version]
  48. Murphy, C.J.; Baggs, E.; Morley, N.; Muro, D.; Paterson, E. Rhizosphere priming can promote mobilisation of N-rich compounds from soil organic matter. Soil Biol. Biochem. 2015, 81, 236–243. [Google Scholar] [CrossRef]
  49. Wang, Q.; Wang, S. Response of labile soil organic matter to changes in forest vegetation in subtropical regions. Appl. Soil Ecol. 2011, 47, 210–216. [Google Scholar] [CrossRef]
  50. Chen, C.; Liu, W.; Jiang, X.; Wu, J. Effects of rubber-based agroforestry systems on soil aggregation and associated soil organic carbon: Implications for land use. Geoderma 2017, 299, 13–24. [Google Scholar] [CrossRef]
  51. Padalia, K.; Bargali, S.S.; Bargali, K.; Khulbe, K. Microbial biomass carbon and nitrogen in relation to cropping systems in Central Himalaya, India. Curr. Sci. 2018, 115, 1741–1749. [Google Scholar] [CrossRef]
  52. Lepcha, N.T.; Devi, N.B. Effect of land use, season, and soil depth on soil microbial biomass carbon of Eastern Himalayas. Ecol. Process. 2020, 9, 65. [Google Scholar] [CrossRef]
  53. Rayne, N.; Aula, L. Livestock Manure and the Impacts on Soil Health: A Review. Soil Syst. 2020, 4, 64. [Google Scholar] [CrossRef]
  54. O’Hallorans, J.M.; Munoz, M.A.; Colbery, O. Effect of chicken manure on chemical properties of a Mollisol and tomato production. J. Agric. Univ. Puerto Rico 1993, 77, 181–191. [Google Scholar] [CrossRef]
  55. Li, F.; Yuan, C.; Lao, D.; Yao, B.; Hu, X.; You, Y.; Wang, L.; Sun, S.; Liang, X. Drip irrigation with organic fertilizer application improved soil quality and fruit yield. Agron. J. 2020, 112, 608–623. [Google Scholar] [CrossRef]
  56. Abdelhafez, A.A.; Abbas, M.H.H.; Attia, T.M.S.; Bably, W.E.; Mahrous, S.M. Mineralization of organic carbon and nitrogen in semi-arid soils under organic and inorganic fertilization. Environ. Technol. Innov. 2018, 9, 243–253. [Google Scholar] [CrossRef]
  57. Wu, Y.P.; Li, Y.F.; Zheng, C.Y.; Zhang, Y.F.; Sun, Z.J. Organic amendment application influence soil organism abundance in saline alkali soil. Eur. J. Soil Biol. 2013, 54, 32–40. [Google Scholar] [CrossRef]
Figure 1. Influence of planting time on cactus pear (A) cladode width, (B) biomass yield and (C) cladode weight (different letters above the bars indicate the significance (p < 0.05)).
Agronomy 11 01647 g001
Figure 2. Plant copper accumulation response of cactus pear to (A) planting time and (B) agronomic management practices (different letters above the bars indicate the significance).
Agronomy 11 01647 g002
Table 1. Weather parameters of the planting area at Jhansi, India *.
MonthMaximum Temperature (°C) Minimum Temperature (°C) Rainfall (mm)
201620172018201920202016201720182019202020162017201820192020
January24.723.424.422.822.410.198.98.29.31283412
February28.528.328.826.226.513.112.613.110.712.51221117
March34.133.334.931.532.818.517.318.415.517.3561108
April39.439.538.738.638.824.123.923.322.922.9002106
May42.341.942.74241.42928.829.228.327.447228
June40.237.840.141.238.729.928.729.630.428.86372703697
July32.833.133.334.332.525.925.826.226.926.2414214270330290
August31.332.131.531.83124.925.525.125.225.2442186250337261
September32.733.131.832.331.62525.223.924.124.2157165239375138
October33.034.8343332.320.221.220.119.420.221653219
November30.129.630.330.828.713.11313.714.215.5117126
December26.425.824.222.722.4109.97.96.510.9172189
Mean32.932.732.832.231.720.320.019.919.320.01121
Total 6908471167871
* Meteorological observatory, ICAR-IGFRI, Jhansi.
Table 2. Analysis of variance for plant height, plant width, cladode number, cladode length, cladode width, cladode weight and biomass yield of cactus pear.
VariablesNdfPlant Height Plant Width Cladode Number Cladode Length Cladode Width Cladode WeightBiomass Yield
p-value
Planting time 43<0.0001<0.0001<0.0001<0.0001<0.0001<0.0001<0.0001
Agronomic management210.150.030.160.030.0010.060.14
Time of planting × Agronomic management 3 × 130.980.990.790.640.680.720.83
Table 3. Effect of planting time on cactus pear height, width and cladode number of cactus pear at Jhansi, India.
Planting TimePlant Height
(cm)
Plant Width
(cm)
Cladode Number
(plant−1)
Cladode Weight
(g)
February 86.0 (±3.3 *) c **79.1 (±8.5) c14.2 (±2.5) c652.2 (±24.2) c
April 76.8 (±2.8) d66.0 (±6.0) d10.2 (±1.3) c585.1 (±19.2) d
July 130.1 (±6.4) a126.4 (±7.5) a32.5 (±4.4) a914.0 (±16.3) a
October 111.1 (±5.2) b110.7 (±8.5) b22.1 (±2.8) b796.0 (±16.0) b
p-value 0.0010.001<0.0001<0.0001
* Standard error; ** values with different letters indicate the significance (p < 0.05).
Table 4. Effect of agronomic management on cactus pear cladode length and width and green biomass yield at Jhansi, India.
Agronomic ManagementPlant Width
(cm)
Cladode Length
(cm)
Cladode Width
(cm)
Irrigation and fertilizer 100.1 (±7.4 *) a **33.5 (±0.7) a15.4 (±0.4) a
No irrigation and fertilizer91.0 (±7.1) b32.1 (±0.8) b14.0 (±0.3) b
p-value0.030.030.001
* Standard error; ** values with different letters indicate the significance (p < 0.05).
Table 5. Short-term effect of irrigation and fertilizer application and planting time on cactus pear: proximate values at Jhansi, India.
Agronomic ManagementPlanting TimeTotal P
(g kg−1)
Total K
(g kg−1)
Zn
(mg kg−1)
Mn
(mg kg−1)
Fe
(mg kg−1)
Crude Protein
(g kg−1)
No irrigation and fertilizer February1.4 (±0.09 *) g23.7 (±0.3) f73.56 (±2.2) e197.17 (±4.0) 295.5 (±4.6) e44.2 (±1.3) g **
April1.6 (±0.09) e24.6 (±0.3) d74.87 (±2.1) d202.50 (±4.0) 290.1 (±5.6) f46.2 (±1.4) e
July1.6 (±0.09) f24.2 (±0.3) e71.80 (±2.1) f205.50 (±4.2) 299.1 (±4.6) d45 (±1.4) f
October1.7 (±0. 11) e25 (±0.3) d67.36 (±2.3) g194.17 (±4.0) 292.1 (±4.4) f46.9 (±1.1) d
Irrigation and fertilizerFebruary2 (±0.09) d29.7 (±0.2) a90.78 (±2.0) a245.50 (±4.6) 338.1 (±7.4) b65.2 (±1.2) a
April2.6 (±0.06) a29.1 (±0.1) b89.51 (±1.6) b243.50 (±4.6) 299.1 (±6.2) c63.3 (±1.4) b
July2.2 (±0.09) c28.4 (±0.3) c88.94 (±2.2) b236.50 (±3.6) 350.1 (±4.4) a63.5 (±1.4) b
October2.4 (±0007) b29.4 (±0.1) b74.87 (±2.3) c239.83 (±3.8) 341.1 (±4.4) b61.5 (±1.2) c
ANOVA dfp-value
Planting time 3<0.0001<0.0001<0.0001<0.0001<0.00010.001
Agronomic management1<0.0001<0.0001<0.0001<0.0001<0.0001<0.0001
Planting time × Agronomic management3<0.0001<0.0001<0.0001<0.0001<0.0001<0.0001
* Standard error; ** different superscript lowercase letters (column) indicate differences between mean values for each treatment (p < 0.05).
Table 6. Short-term effect of fertilizer and irrigation application vs. no irrigation and no fertilizer application on soil properties of cactus pear planting area at Jhansi, India.
TreatmentpHEC
(dS m−1)
BD
(Mg m−3)
PD
(Mg m−3)
SOC
(mg kg−1)
SMBC
(mg kg−1)
Agronomic management
No irrigation and fertilizer 6.81 (±0.01 *) b0.11 (±0.02) a **1.35 (±0.02) b2.30 (±0.02) a5 (±0.12) b807 (±3.06) b
Irrigation and fertilizer6.55 (±0.03) a0.09 (±0.01) b1.40 (±0.01) a2.33 (±0.01) a5.9 (±0.13) a867 (±7.95) a
Year
20206.70 (±0.06) a0.11 (±0.02) a1.38 (±0.01) a2.33 (±0.02) a5.5 (±0.21) a839 (±14.51) a
20186.66 (±0.05) a0.10 (±0.02) a1.36 (±0.01) b2.30 (±0.01) a5.4 (±0.12) b834 (±14.51) a
ANOVA dfp-value
Agronomic management 10.00040.0002<0.00010.11<0.00010.0002
Year10.300.23<0.00010.150.0020.52
Agronomic management × Year10.371.001.000.821.001.00
EC, electrical conductivity; BD, bulk density; PD, particle density; SOC, soil organic carbon; SMBC, soil microbial biomass carbon. * Standard error; ** different superscript lowercase letters (column) indicate differences between mean values for each treatment (p < 0.05).
Table 7. Short-term effect of fertilizer and irrigation application vs. no irrigation and no fertilizer application on soil nutrients of cactus pear planting area at Jhansi, India.
TreatmentN
(kg ha−1)
P
(kg ha−1)
K
(kg ha−1)
Fe
(mg kg−1)
Zn
(mg kg−1)
Cu
(mg kg−1)
Mn
(mg kg−1)
Agronomic management
No irrigation and fertilizer 234 (±4.57 *) b19 (±0.68) b **327 (±10.93) b16 (±1.42) b1.2 (±0.02) b 1.3 (±0.02) b17.9 (±1.33) b
Irrigation and fertilizer250 (±4.30) a20 (±0.73) a363 (±7.31) a21 (±0.99) a1.5 (±0.03) a1.6 (±0.01) a22.4 (±1.18) a
Year
2020243 (±3.05) a20 (±0.78) a346 (±12.28) a19 (±1.72) a1.4 (±0.08) a1.5 (±0.07) a20.2 (±1.61) a
2018241 (±5.75) b19 (±0.48) b344 (±10.28) a18 (±1.72) a1.4 (±0.06) a1.5 (±0.07) a20.1 (±1.61) a
ANOVA dfp-value
Agronomic management 1<0.0001<0.00010.001<0.0001<0.0001<0.0001<0.0001
Year10.00060.0010.730.630.050.110.78
Agronomic management × Year11.001.001.001.001.001.001.00
* Standard error; ** different superscript lowercase letters (column) indicate differences between mean values for each treatment (p < 0.05).
Publisher’s Note: MDPI stays neutral with regard to jurisdictional claims in published maps and institutional affiliations.

