1. Introduction
Rice (
Oryza sativa L.) is one of the most important grain crops for more than 50% of the world’s population, providing approximately 20% of total energy intake for humans [
1]. Rice is also a substantial part of the protein intake for about 520 million people living in poverty in Asia. In Asia, more than 2000 million people obtain 70% of their calories from rice and its products [
2]. In sub-Saharan Africa, rice consumption among urban dwellers in Tanzania has steadily grown, with a per capita consumption that has doubled since 1970 [
1]. An annual increase of 8–10 million tons is estimated as necessary to meet future needs [
1]. According to FAO [
3], 59 million tons of additional milled rice will be needed by 2020 above the 2007 consumption of 422 million tons. Since there is limited capacity to increase the area of rice cultivation due to urbanization and severe water constraints, additional production must come from less land, less water, and less production costs.
Rice production in Africa consists of only 3% of the world’s total production, the biggest producers being countries in Western Africa, such as Nigeria, Cote d’lvoire, and Mali. Other major producing countries are Egypt, Madagascar, Tanzania, and Mozambique [
3]. Water is essential for growth and development of rice plants. However, continuous flooding irrigation results in a large amount of unproductive water outflows through evaporation, seepage through bunds, runoff, and deep percolation [
4,
5,
6,
7]. This causes loss of nutrients from the field and pollution of groundwater supplies.
Rice is also the largest consumer of water among all crops [
7,
8]. The water productivity of rice is lower than those of other crops [
9]. Water productivity of rice that ranges from 0.1 to 0.14 kg m
−3 has been recorded in Tanzania, which is lower when compared to 0.60–1.60 kg m
−3 in other parts of the world [
10]. On average, 2500 L of water is used, ranging from 800 L to more than 5000 L to produce one kg of rice [
7,
10]. About 50% of the world’s rice production is affected by water deficit [
7,
11]. It has also been reported that by 2025, 15–20 million ha of irrigated rice is estimated to suffer from some degree of water scarcity [
7].
About 75% of the global rice volume is produced conventionally in irrigated lowland systems under continuously flooded (CF) conditions [
12,
13,
14,
15]. In Tanzania, about 90% of rice is grown under continuous flooding, a practice that requires large amounts of water with less productivity [
3]. A study during 2011 in Mkindo [Mvomero district] by Kahimba et al. [
16] reported water productivity of 0.47 kg m
−3 in AWD and 0.14 kg m
−3 in CF irrigation.
The shortage of water across Tanzania occurs due to climate change that leads to low level of exploitation of suitable land for irrigation. Tanzania is among the most vulnerable countries to climate change. Materu et al. [
17] reported that increasing irrigation withdrawals and spatial and temporal variability in rainfall and surface flows are causing water scarcity in many parts of Tanzania, such as the Pangani and Rufiji River basins.
Extreme climatic conditions, such as droughts and floods have already affected production of rice [
18,
19]. Conversely, estimated rice consumption greatly exceeds the level of production in the country. Kangile et al. [
20] reported milled rice production of 1.4 million tons against a consumption of 1.6 million tons in 2014. Rice demand is expected to triple over the next decade as population grows and becomes more urbanized. Another driver of demand is the change in consumers’ preference of rice both in urban and rural areas. Rice consumption symbolizes increased status compared with eating other cereals; it is the premium staple consumers aspire eat as their incomes increase [
20]. This demand can be met through increasing production of rice in irrigated schemes by the development of water-saving rice production technologies, especially in sub-Saharan Africa where the population is expected to double by 2030. Water plays an essential role in agricultural production, especially for paddy rice, which requires more water than other staple crops such as wheat and maize [
21]. However, with climate change and the increasing water demand from rapid economic development and the urbanization process [
22], increasing food production and increasing agricultural water productivity with limited water resources have become a top priority for the agricultural sector [
21,
23].
Many water-saving techniques have been developed for rice production, in response to irrigation water scarcity. The selection of water-saving methods and the optimum thresholds for obtaining maximum benefits of these regimes are largely site-specific, depending mainly on soil type, management, and the environment [
24]. Examples of water-saving methods includes saturated soil culture [
25], aerobic rice [
26], system of rice intensification [
27], non-flooded mulching cultivation [
28], safe alternate wetting and drying irrigation (AWD) [
4,
29], among others. Among these methods, safe AWD is a practice in which water is applied to the field in a number of days after the disappearance of ponded water. This indicates that the rice field is not kept submerged at all times as practiced in conventional irrigation but is allowed to dry out to a degree when soil water potential reaches −10 kPa to −30 kPa before it is re-irrigated again [
30,
31]. A safe AWD allows the water level in the rice field to potentially drop to 15 cm below the soil surface before the crop is irrigated again [
32].
Water productivity and the response of rice under AWD irrigation is highly variable. Studies have demonstrated that AWD can save irrigation water and improve productivity compared with traditional flood irrigation [
4,
31,
33], but the effect of AWD on rice yield is still in debate in most of African countries where few studies have been conducted. Several studies have shown that the adoption of AWD can maintain [
33] or increase rice yield from 9% to 15% [
33,
34,
35,
36,
37]. However, reduction in rice yield was also reported by [
4,
38]. Arif et al. [
4] summarized 31 published research studies on AWD and concluded that 92% of AWD treatments led to yield decreases compared with continuously flooded treatments. The differences in frequency and threshold of the drying cycles of the AWD, soil types, groundwater table depths, and rice varieties used may contribute to the contrasting results. Whether AWD can obtain the advantageous goal of saving irrigation water and increasing rice grain yield and water productivity, it is still a challenge faced by most researchers [
39].
While the AWD practice has been demonstrated to provide advantages in terms of reducing water use and increasing crop productivity, few studies have been conducted to evaluate potential water-saving irrigation, especially under interaction of water and nitrogen fertilizer in Tanzania [
2,
16,
17,
40,
41]. In addition to water, nitrogen is one of the most important nutrients that determine rice yields [
12,
42,
43]; thus, its deficiency is a limiting factor for sustainable rice production. However, the use of N fertilizer is generally inefficient, and the average apparent recovery efficiency of N fertilizer is about 33% for rice globally [
12].
Studies have shown that AWD interaction with nitrogen increase grain yield as well as water, and nitrogen use efficiency. Harell et al. [
44] reported a linear response of rice to nitrogen rate below 150 kg N ha
−1 and a plateau when the applied N rate is greater than 150 kg N ha
−1. Peng et al. [
45] and Djaman et al. [
42] reported a curvilinear response of rice yield to a nitrogen applied rate. The nitrogen fertilizer applied rates that achieved maximum yield were 157 and 151 kg N ha
−1 [
44,
46,
47] reported that nutrients and water interaction had significant effect on growth, yield, and nutrient content of rice. In the dynamics of sustainable system intensification, there is a need for proper nitrogen fertilizer and water management practices under changing climate [
7,
48]. Thus, the objectives of this study are to investigate water-saving strategies under different N fertilizer levels and quantify crop water use, water productivity, yield, and water saving.
2. Material and Methods
2.1. Site Description and Experimental Pot Establishment
A screenhouse pot experiment was conducted from March–July of 2019 with soil sampled from lowland production ecology.
In this study, we define lowland soils used for rice cultivation as soils logically located in lower areas of the landscape and are considered to be flooded at least once per rice-growing season. They have a finer particle size distribution compared to upland soils, which are set in higher and often sloping areas and hence have never been flooded.
The experiment was conducted in the screen house at the Department of Soil and Geological Sciences of Sokoine University of Agriculture, Morogoro, Eastern Tanzania, located at latitude 6°5′ S and 37°37′ E at an elevation of 525 m above sea level in the leeward side of Uluguru mountain.
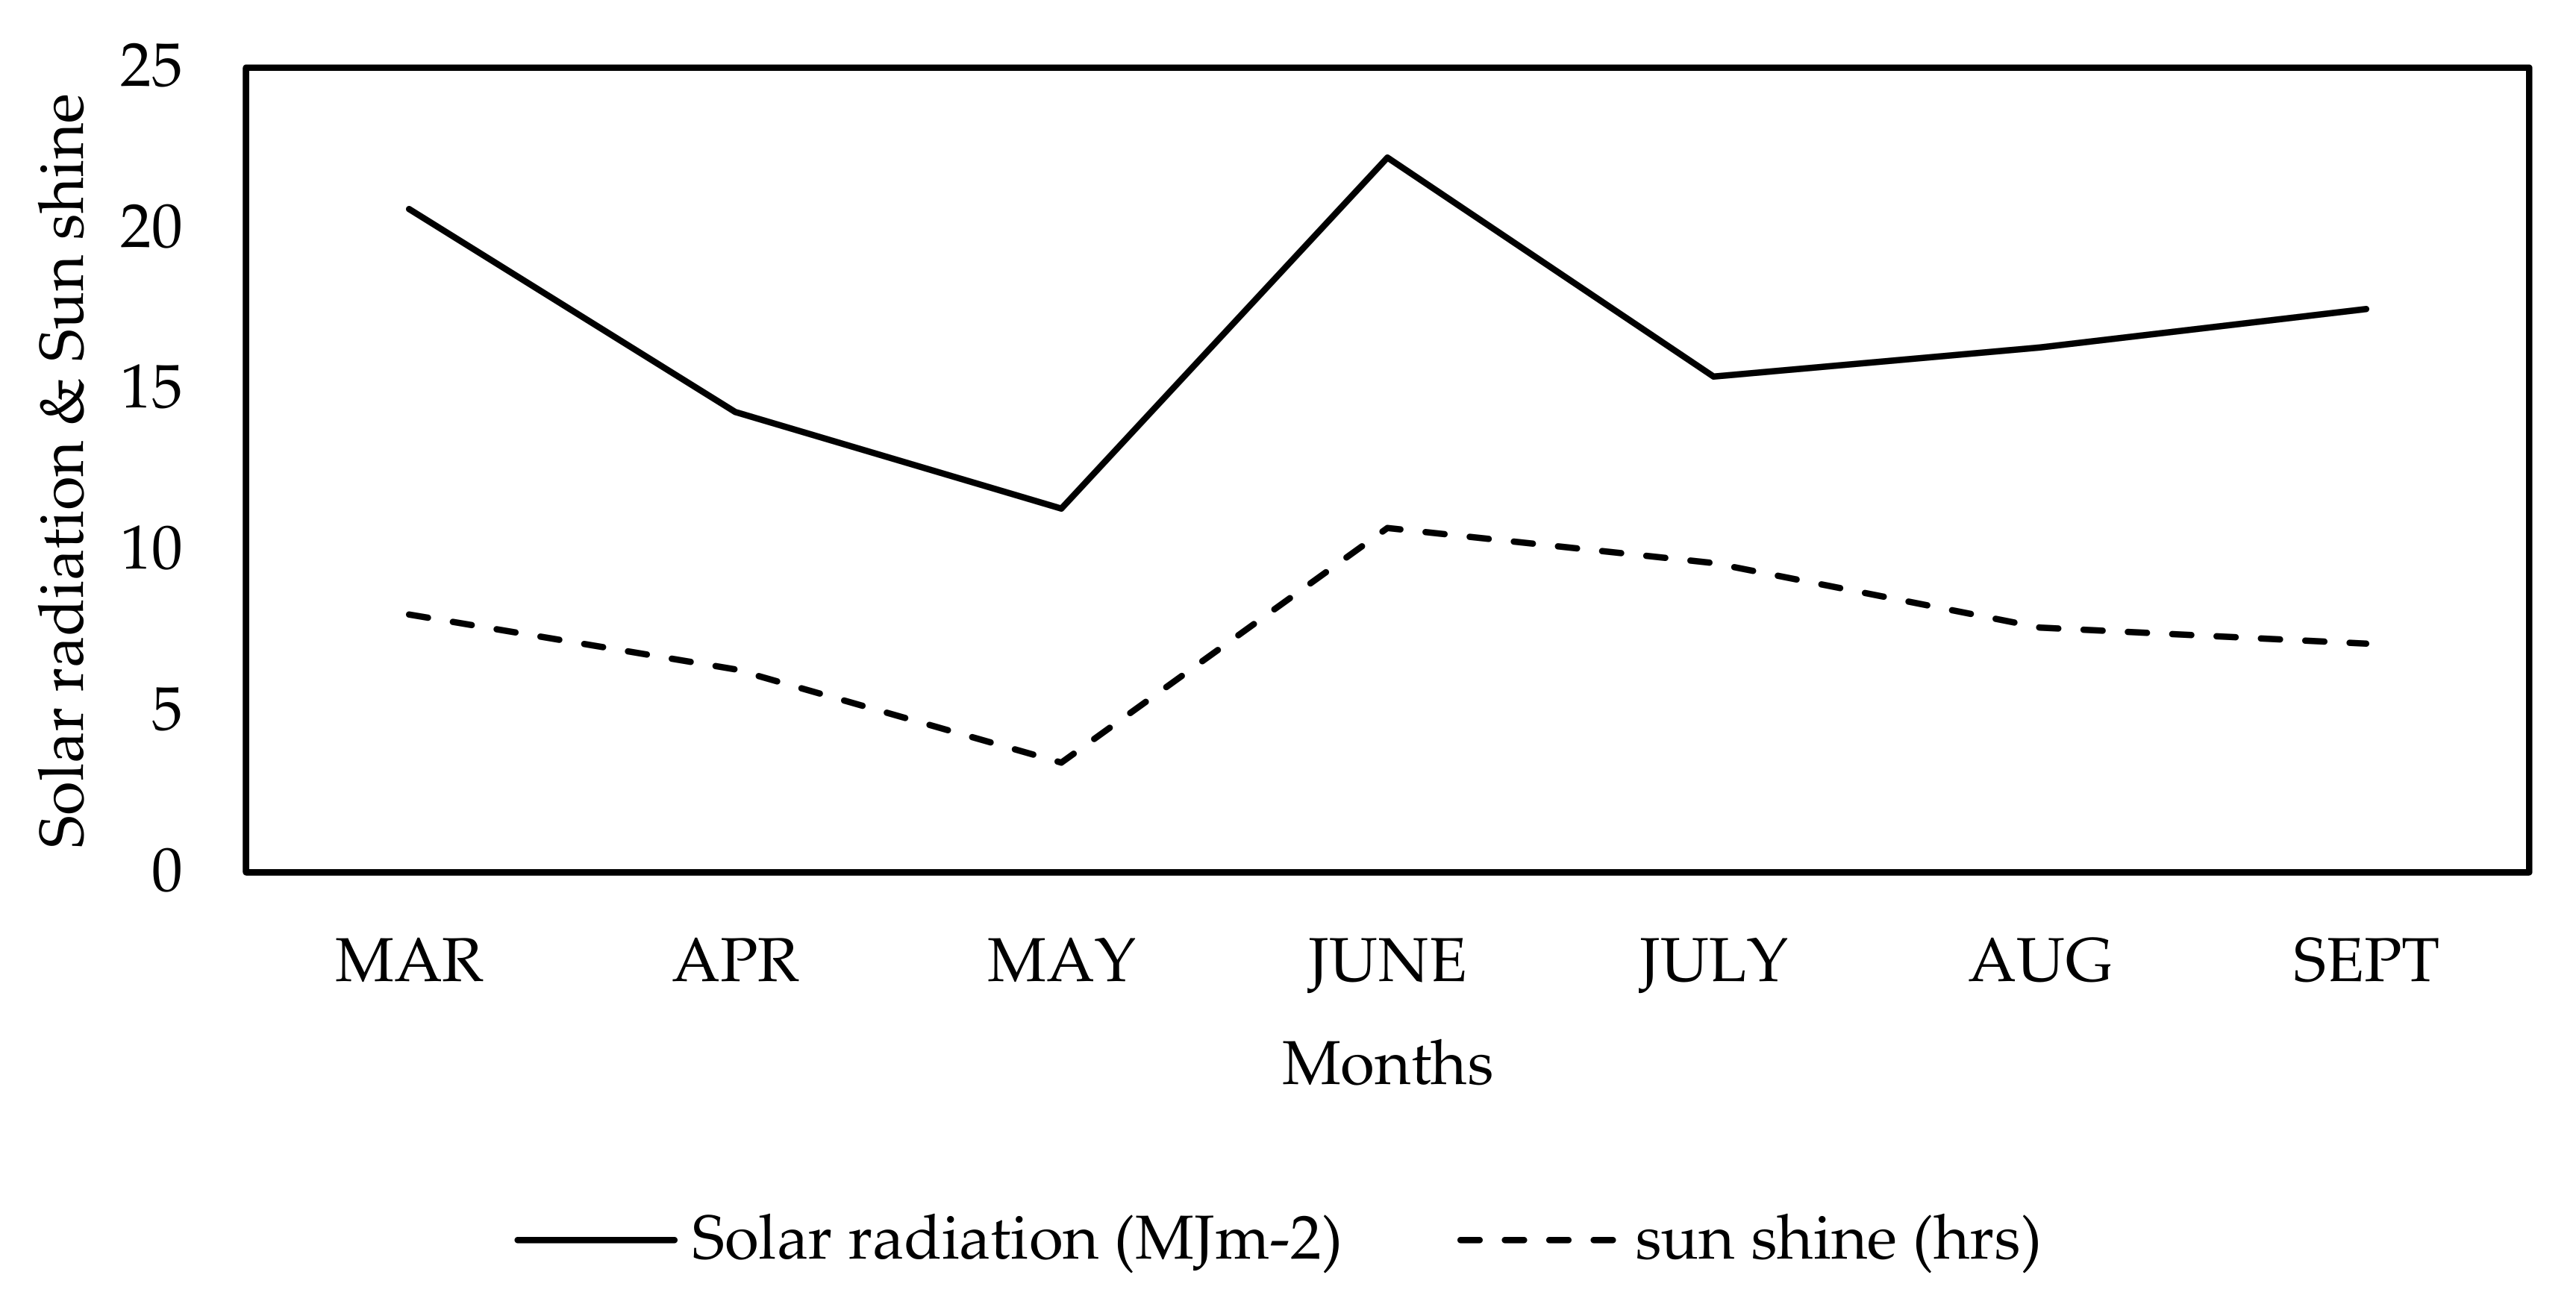
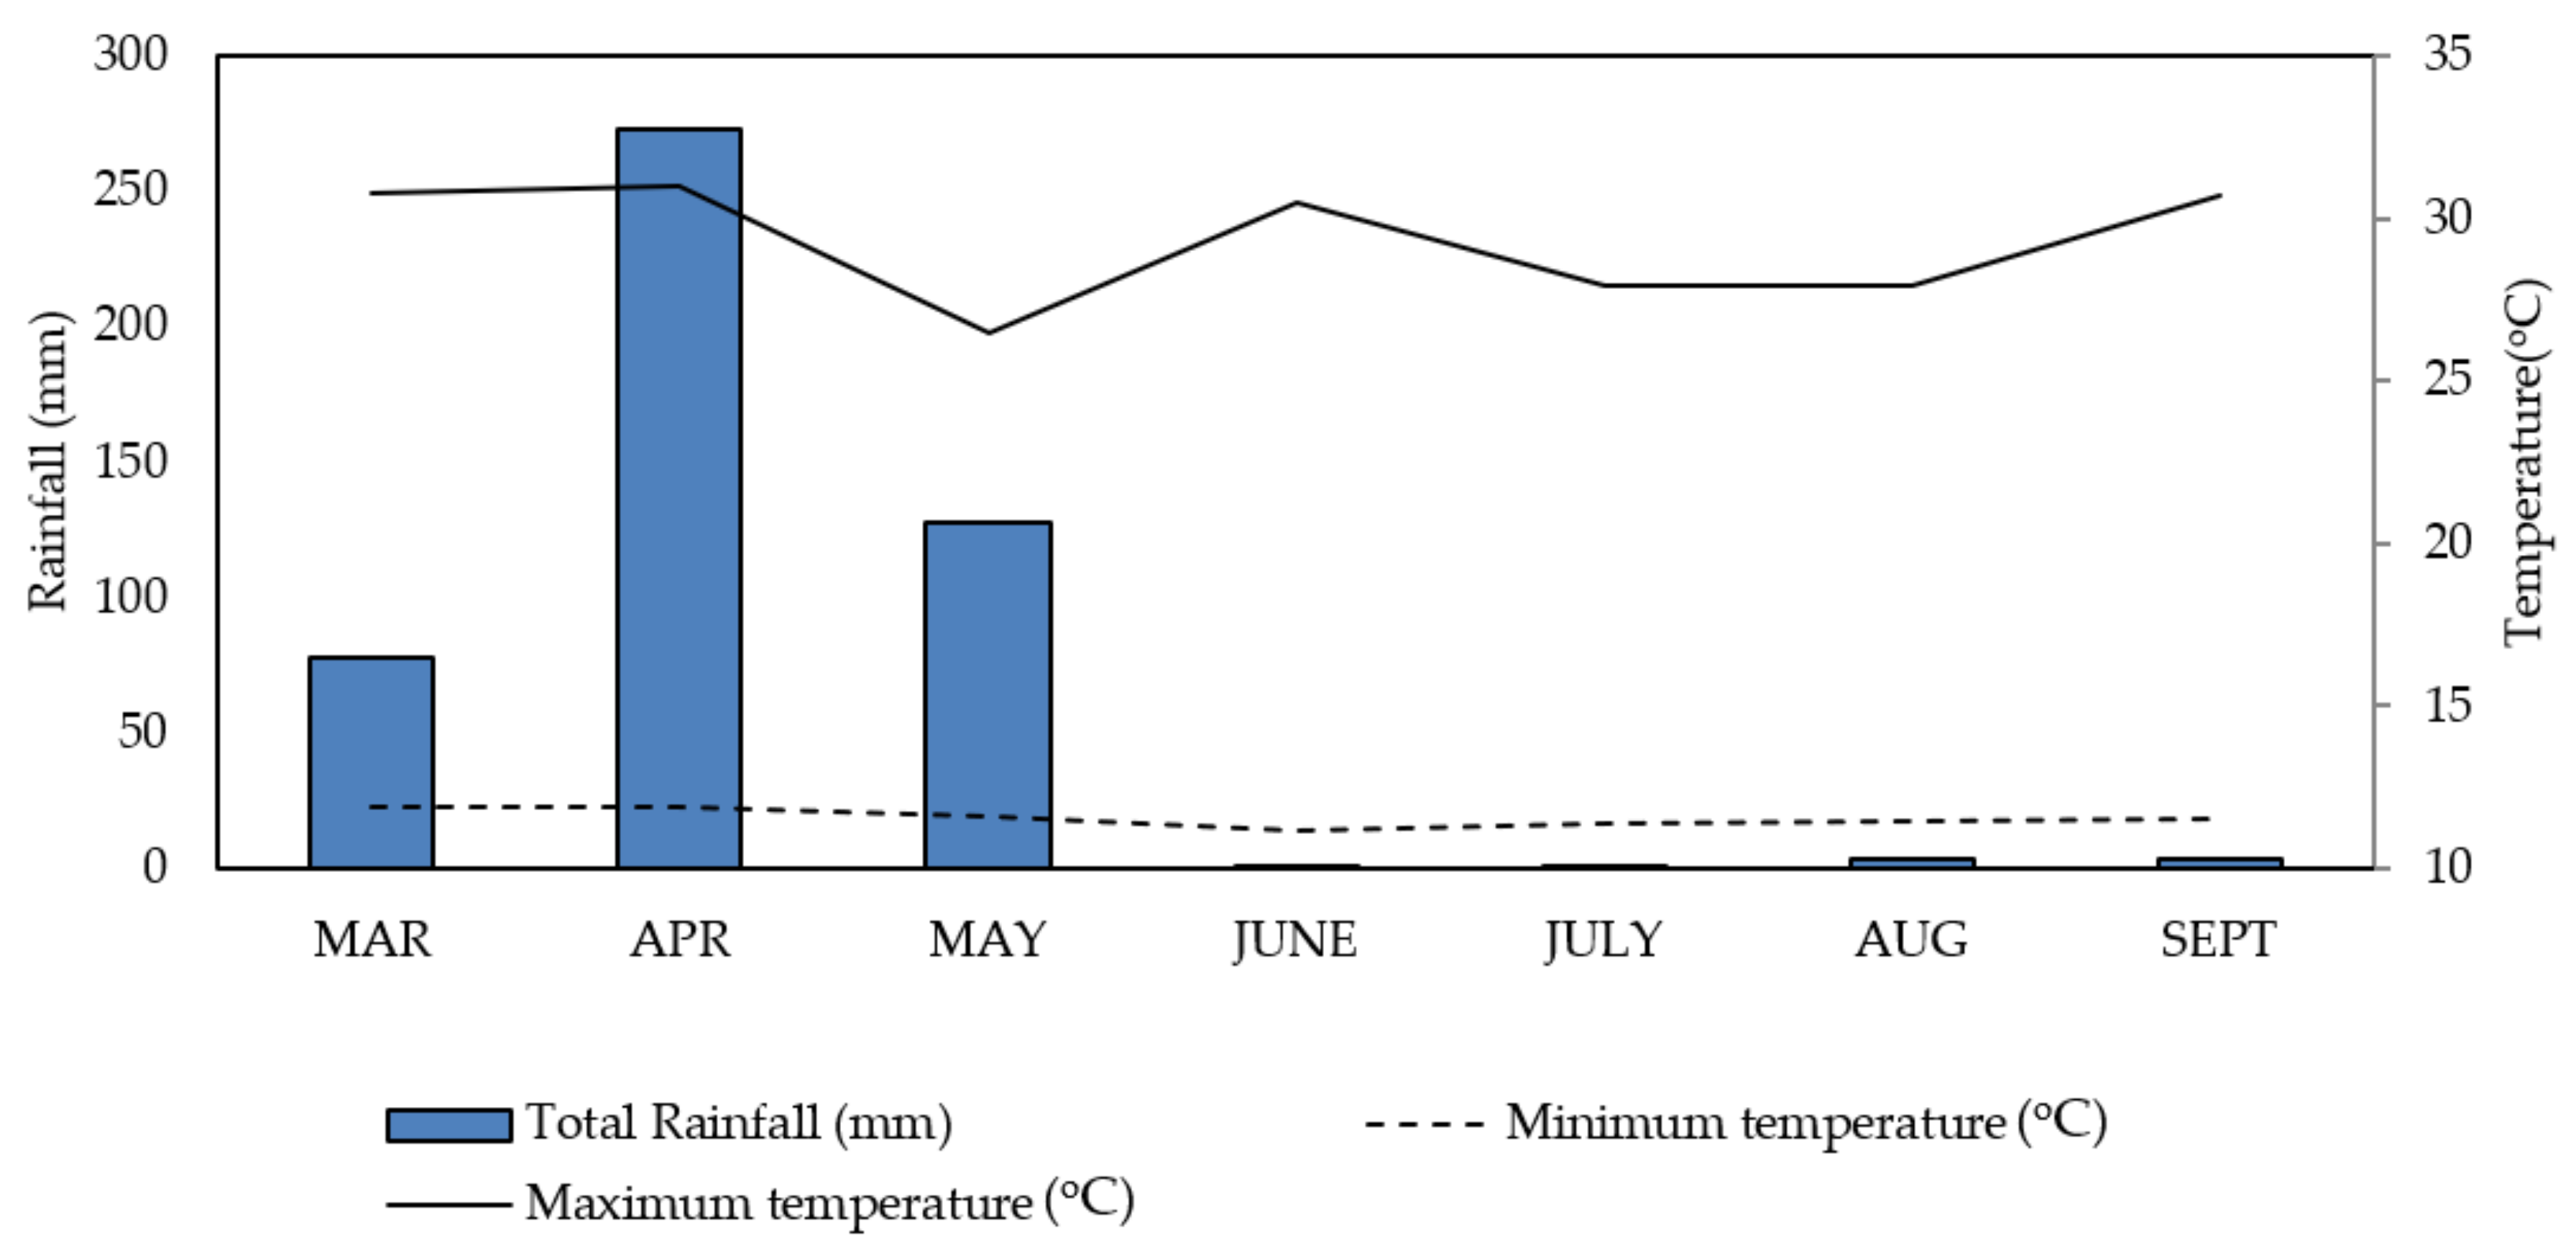
The climate of the area is between sub-humid and semi- arid with soils that are predominantly Alfisols and Entisols. The mean annual temperature of this area ranges from 24–34 °C (
Figure 1) with relative humidity that ranges from 70–90%, and the average annual rainfall ranges from 716.5 to 1503.5 mm [
40]. Meteorological weather data during growing seasons were collected from Tanzania Meteorological Agency Weather station located at Sokoine University of Agriculture, Morogoro Tanzania (
Figure 1 and
Figure 2).
Soils were collected from the plough layer (0–20 cm depth) of a paddy field at Mkindo farmer-managed irrigation scheme for the lowland trial. The Mkindo farmer-managed irrigation scheme is located in Mvomero District in Morogoro region, eastern Tanzania. The district is located between latitude 6°16′ and 6°18′ S and longitude 37°32′ and 37°36′ E, and its altitude ranges between 345 and 365 masl. The experimental farm is located at latitude 6°15′13″ S and longitude 37°32′19″. The Mkindo farmer-managed irrigation scheme is located about 85 km from Morogoro municipality [
16].
2.2. Soil Sampling, Preparation and Analysis
Mkindo soil is classified as Eutric Fluvisols [
49].Soil samples were collected using auger from the field before plowing at a 0–20 cm depth. Samples were air-dried under a shed, sieved through 2 mm mesh, and analyzed in the laboratory using standard techniques as described in
Table 1, where basic physical and chemical properties were estimated as shown in
Table 2.
2.3. Experimental Design and Treatment Details
The greenhouse pot experiment involving soil collected from Mkindo farmer-managed irrigation scheme was located in a lowland area. Treatments used in the experiment are shown in
Table 3. The experiment covered the period of 18 February 2019 to 30 June 2019. The experiment consisted of two irrigation water management systems and six levels of nitrogen fertilization, resulting in a total of twelve different treatments as described in
Table 3. The experiment had a split-plot design with irrigation water management as the main factor and the six levels of nitrogen treatments as a subfactor. Two separate randomization processes were used, one for the main factor and another for the subfactor, which were performed using Genstart software 4th edition developed by Rothamsted Research in the United Kingdom. In each replication, the main factor treatments were first randomly assigned, followed by a random assignment of the subfactor treatments within each main factor. There were three replications of each treatment, producing a total of 36 experimental pots.
From each of the six identified sampling spots, soil was collected from a depth of 0–20 cm, totaling 288 kg of soil. The soils were transferred to the laboratory, air-dried under shed, ground, and sieved to pass through 8 mm mesh. Then, the soil was mixed thoroughly to form one uniform composite soil sample for pot experiment and analysis of physiochemical properties.
Plastic pots with 10 L capacity, 30 cm height, and 10 cm diameter were filled with 8 kg of air-dried soil mixed with the respective fertilizer treatments. The amount of fertilizer applied in each pot was calculated based on the 8 kg air-dried soil. The treatment details adopted are presented in
Table 3.
Fertilizer treatments comprised six nitrogen levels; these included absolute control treatment (ABC), which did not receive fertilizer. The absolute control treatment was intended to evaluate rice response under natural soil fertility. The fertilizer treatments also included a control treatment (N0) without a nitrogen fertilizer application but the soil received phosphorus (P) and potassium (K) fertilizers. This treatment was required to assess crop response to a nitrogen fertilizer application. The other treatments (60, 90, 120, and 150 kg N ha−1) were 50%, 75%, 100%, and 125%, respectively, of the blanket recommended amount of nitrogen fertilization for rice in the Mkindo area. The current blanket recommendation for rice grown in the eastern part of Tanzania is 120 kg N ha−1.
The nitrogen fertilizer source was urea (46%) and was applied two times: 50% at 14 days after transplanting and at 50% at panicle initiation. Application of the second split of nitrogen was performed 55 days after transplanting; at this time, the crop was at panicle initiation growth stage.
Panicle initiation (PI) is the second best time to apply nitrogen to a rice crop with pre-permanent water being the most efficient. Nitrogen applications at PI are relatively efficient because the full crop canopy reduces fertilizer volatilization and the extensive near-surface root system absorbs nitrogen soon after application.
The source of full dose of P (60 kg ha−1) was triple super phosphate, and K (60 kg ha−1) was from Muriate of potash. Phosphorus and K were evenly broadcasted and mixed with soil during transplanting.
The irrigation water treatments comprised two water regimes, alternate wetting and drying (AWD) and continuous flooding (CF). In AWD, irrigation water was applied to maintain the soil at a saturated condition instead of ponding. Irrigation was applied 1–3 days after the disappearance of water from the soil surface after 15 days of transplanting. Thereafter, the alternate wetting and drying method of irrigation was followed.
Continuously- flooded pots were given water on alternate days in order to maintain a ponded water layer of 1–5 cm depth during the entire vegetative stage until one week before harvest. The impact of rainfall was avoided using the screen house rain shelter to rigorously control the soil water content in the pots.
Each pot was individually irrigated using a graduated measuring cylinder. In each pot, the depth of water was measured at three selected spots immediately after irrigation using an ordinary scale meter with mm and cm marks.
Water depths above the soil surface were monitored daily. On the basis of these observations, the mean depth of irrigation water was calculated for each pot as shown in
Table 4. The quantity of water applied during irrigation was summed to calculate the total amount of water applied to the pot throughout the cropping season.
2.4. Crop Establishment
TXD 360 (SARO 5), a popular rice variety, was used in this study. It was developed by scientists at Agricultural Research Institute-Dakawa in Tanzania in 1999. It was accepted in 2000, and released by KATRIN Agricultural Institute in 2002. TXD 360 is a semi-aromatic variety, referred to commonly as Saro. This variety is a mid-late season rice (120–130 days cycle) which can be grown under rainfed or irrigated production ecologies with a yield potential of 7.0–8.5 t/ha. Farmer yields vary from 4.5–5.5 t/ha. It is medium in stature, resistant to lodging, and has good tillering ability (more than 20 tillers per hill depending on management).
Before sowing in the nursery, seeds were prepared by separating the unfilled grains from filled grains to obtain vigorous plants. Only seeds with good density and formation were used for nursery preparations.
To obtain the best seeds, clean tap water and seed priming techniques were used. Seeds were submerged in a container of clean tap water and stirred well; light and inferior seeds that floated in the water were discarded. The best seeds were then soaked in clean water for 48 h (seed priming) and incubated in a warm and dark place for three days.
The practice of soaking seeds before planting enhances the rate of germination and seedling emergence. Incubation keeps the seeds warm, hence increasing growth of the embryo and resulting in more uniform germination. Thereafter, the pre-germinated seeds were transferred to the seedbed, where they were uniformly sown.
Three weeks after germination, seedlings were transplanted in pots, followed by other intercultural operations as needed.
2.5. Agronomic Performance and Yield Data Collection
2.5.1. Plant Height and Number of Tillers
Observations on rice growth, yield-forming characters, and yield were recorded. Plant height was measured with a graduated straight edge (ruler) from the base of the shoot at the soil surface to the tip of the tallest leaf, and during maturity, plant height was measured from the base of the plant to the tip of the tallest flag leaf every two weeks. All measurements were recorded in centimeters.
The number of tillers was counted from each plant per pot on the same day that the plant height data was collected.
2.5.2. Determination of Flag Leaf Area and Leaf Chlorophyll Content
Flag leaf area was estimated by measuring the length and average width of the leaf and multiplying by a factor of 0.75, following Yoshida [
57] and was measured at the booting stage of the crop.
Chlorophyll content (CC) of leaves was measured using atLEAF CHL PLUS meter (FT Green LLC, 1000N.West St.Suite 1200# 638 Wilmington, DE 19801, USA,
www.atleaf.com accessed on 2 May 2019). The CC was recorded during maturity and for each pot, 5 leaves were randomly taken for measurement per treatment.
2.5.3. Yield and Yield Components
Rice parameters that were collected after harvest include number of productive tillers per plant, number of non-productive tillers per plant, percentage of productive tillers, panicle length, panicle weight, number of grain spikelets per panicle, number of filled grains per panicle, grain weight per panicle, 1000-g weight, and yield.
The number of effective tillers per plant and number of non-effective tillers per plant were also determined. The determination of these two parameters was performed by counting the number of tillers with panicles bearing at least one filled grain, which are referred to as effective tillers. Tillers with panicles having no filled grains were termed as non-effective tillers. An average was found for each parameter and recorded.
The rice panicles (with spikelets) were cut and collected from every pot before drying in an oven at 60 °C for 2 days. Panicle length was measured using a ruler, and weight per pot was measured using an electronic weighing balance. Then, the rice grains were separated from the panicle and grouped into unfilled and filled grains. To determine 1000-grain weight, 1000 filled grains from the sampled panicles were counted by the Seedburo 801 Count-A-Pak ® seed counter (Model 801-10/C model, serial Co 655 Chicago Illlinois USA and weighed on an Endel Precision Weighing Scale, EJB-NB-6000, Dubai.
Meanwhile, the straw biomass was collected from the remaining plants (without panicles) and dried in an Memmert 854 oven, (MEMMERT GmbH + Co. KG Schwabach, 91126 Bavaria, Germany at 70 °C for 3 days to constant weight. After threshing, cleaning, and drying, the grain yields were measured by 8988N grain moisture meter (Xiamen Hyhoo Imp. & Exp. Co., Ltd., Xiamen, China) and adjusted to 14% moisture content using Equation (1). The rice grain yield per pot per treatment was computed, and the grain harvest index was calculated based on the ratio of grain yield to total biomass produced (Equation (3)).
where Wf is the final weight at 14% moisture;
mcf is the final moisture (14%);
mci is the initial moisture and
Wi is the initial grain weight. This was also performed to all parameters involving weights.
Relative increases were calculated and compared to the control using a relationship modified by Gachengo et al. [
58], Badu et al. [
59].
2.6. Water Productivity Assessment
Water productivity was calculated as grain yield divided by total amount of water supplied to the pot and was expressed in kg m
−3 according to Equation (4). [
5]
Water saving was determined with reference to the irrigation water and calculated as the difference in irrigation under the two irrigation regimes divided by the irrigation water applied under the CF regime as shown in Equation (5). The number of irrigations was determined by calculating mean number of all irrigations for each pot.
2.7. Statistical Analysis
The two water management practices and six nitrogen levels were statistically analyzed using the analysis of variance (ANOVA) technique as applicable to combined analyses in the split-plot design [
60].
To determine the significance of the difference between the means of the treatments, least significant difference (LSD) was calculated at the 5% probability level. All statistical analyses were performed using GenStat (14th Edition by Rothamsted Research in the UK).
3. Results and Discussion
3.1. Effect of Water Management and Nitrogen Levels on Plant Height and Number of Tillers
The variations in plant height are shown in
Table 5. The plant height increased rapidly during the early tillering stage and then grew slowly during the middle and late tillering stages when vigorous tillering took place. The plant height increased most rapidly during the jointing-booting stage and reached the highest value during the heading-flowering stage.
Plant height was less variable and tended to be stable during the milky stage and the ripening stage, which represented the reproductive stage.
The height of rice plants receiving continuous flooding treatments ranged from 34.4 to 106.4 cm, and for plants receiving alternate wetting and drying water treatments (AWD), it ranged from 35.5 to 110.2 cm. The difference was not significant (p > 0.05) except at 28 days after transplanting (DAT).
Nitrogen levels that were highly significantly (p < 0.05) affected plant height from 28 DAT to harvest stage, thus from initial tillering to maturity. The greatest plant height of 112.7 cm, followed by 112.5 cm, was recorded at harvest stage under treatments of 60 and 90 kg N ha−1. The shortest plant height was recorded with absolute control (98.6 cm) followed by control (0 kg ha−1) (98.8 cm) treatments at harvest.
Interaction of water management and nitrogen levels affected plant height significantly at 42 DAT, with no significant difference in plant height during the other stages, although the highest plant height of 116.7 cm was recorded at AWD ×150 kg N ha
−1 during 90 DAT (
Table 5).
Similar results were reported by [
61,
62] in that nitrogen fertilization has a tendency to increase plant height as nitrogen is involved in cell division and cell elongation of plants. These results are in agreement with [
63,
64], who reported an increase of plant height under AWD water management and 90 kg N ha
−1 nitrogen level. However, Zheng et al. [
65] reported contradicting results from China, showing that the final plant height was significantly higher under flooding irrigation than of that under water-saving irrigation treatments during both years of experiments.
Number of tillers as influenced by water management, nitrogen fertilizer levels, and their interactions are given in
Table 5. Water management affected the number of tillers significantly (
p < 0.05) in all growth stages of rice. The results clearly show that from 14 to 56 DAT, there was an increase in tiller number among the treatments. Starting at 70 DAT there was a decrease in number of tillers. However, the AWD method produced more tillers than CF.
The highest number of tillers per hill (34.4) was observed in AWD compared to CF (12.8) at 56 DAT. This shows an increase of 261%. Nitrogen levels that were highly significantly affected the number of tillers from 42 DAT to harvest. The number of tillers increased from 21 to 56 DAT and thereafter started to decline.
In the present study, the highest number of tillers per hill (29.4) was observed in plants treated with 120 and 150 kg N ha−1 at 56 and 70 DAT, respectively.
Interaction of water management and nitrogen levels significantly affected the number of tillers at 70, 90, and at harvest stages.
The highest number of tillers per hill (43.3) was observed in plants that received the interaction of alternate wetting and drying and 150 kg N ha−1 (AWD × 150).
A lesser number of tillers was recorded in treatments that received CF×ABC, followed by CF × 0. Plants under AWD resulted in profuse tillering, which facilitated plants for better utilization of light, soil nutrients, and water.
Better performance of the AWD treated treatments may be due to the combined effect of single young transplanted seedling and alternate wetting and drying processes that create good aeration in the soil more frequently than the continuous flooding treatments.
Alternate wetting and drying water management improves the environment of the root system, such that the root system has enough oxygen and water during tiller development. [
66,
67] reported that transplanting young seedlings has advantages versus older ones (traditional method). The advantages lie in a higher tolerance to transplanting stresses in younger seedling than aged ones.
However, not all of these tillers developed to maturity (productive tillers); several degenerated and became dormant when young, and several died later, depending on environmental and nutritional conditions [
67] as shown in
Table 6.
The advantage of AWD method in enhancing the numbers of tillers was also reported earlier by [
16,
68,
69].
3.2. Effect of Water Management and Nitrogen Levels on Flag Leaf Area and Chlorophyll Content
In this study, water management did not affect chlorophyll content (CC) (
Table 7); however AWD improved CC by 1.3% compared to CF, although the treatments were not statistically different (
p > 0.05).
This indicates that both water management treatments had no effect on CC. Conversely, nitrogen levels affected CC which was highly significantly (p < 0.05), with the highest chlorophyll content (45.2) recorded at 120 kg N ha−1, followed by 150 kg N ha−1 (44.7), which were statistically at par.
The four nitrogen level treatments exhibited a statistical difference over the control (30.4) and absolute control (27.6), which recorded a low CC.
The observed significant increase in leaf chlorophyll content due to the application of 120 and 150 kg N ha−1 compared to application of 60 and 90 kg N ha−1 and other treatments might have been caused by enhanced availability of N. Application of 60, 90, 120, and 150 kg N ha−1 improved chlorophyll content by 29.3%, 29%, 32.7%, and 32%, respectively, compared to control. The interaction had no statistical difference (p > 0.05).
AWD improved flag leaf area by 9.8% compared to CF (
Table 7); however, the two treatments were not statistically different (
p ≥ 0.05). Nitrogen levels influenced the flag leaf area as highly significantly (
p < 0.05). Application of 90 kg N ha
−1 improved flag leaf area by 42.9%, followed by 150 kg Nha
−1 (which increased FLA by 42.3%, compared to the absolute control (20.7 cm
2)) and control (0 kg N ha
−1) (23.7 cm
2), which recorded the lowest values of flag leaf area.
Application of 60, 90, 120, and 150 kg N ha−1 improved flag leaf area by 33.4%, 42.9%, 34.2%, and 42.3%, respectively, compared to control. Treatment interaction had no significant effect.
These results are in agreement with [
70,
71], who commented that nitrogen is one of the most important nutrients essential for the growth of crops and is a major component of chlorophyll and protein, which are closely associated with leaf color, crop growth status, and yield.
3.3. Tillers Characteristics as Influenced by Water Management and Nitrogen Fertilizer
Total tillers and number of productive tillers were affected by nitrogen levels significantly (
p < 0.05). The highest number of productive tillers was recorded at 90 kg N ha
−1 (33.3), although was not different from other nitrogen levels except absolute control (11) and control (14.7) as shown in (
Table 8).
Total tillers were significantly affected (p < 0.05) by the interaction of water and nitrogen, whereas most tillers (40) were reported under AWD ×150, and fewest tillers (13.8) were under ABC. The percent of productive tillers and number of non-productive tillers plants were not affected by any treatments.
Our results are consistent with findings of previous studies which show that AWD has an ability to increase productive tillers and reduce redundant growth by altering leaf angles, improving root health, shoot growth, and leaf area index [
72,
73,
74]. It was also reported that AWD improves effective tiller percentage and translocation of carbohydrates to grain, reduces spikelet sterility, and increases grain weight [
72,
75].
3.4. Effect of Water Management, Nitrogen Levels and Their Interaction on Yield Characteristics of Rice
Panicle weight and panicle length; treatment interaction had a significant impact on panicle weight (p < 0.05). Under the interaction panicle, weight increased with increasing nitrogen levels at AWD, while at CF, the panicle weight decreased with increasing nitrogen levels.
Panicle length was affected by water and nitrogen levels significantly (p < 0.05). AWD had higher panicle length (22.6 cm) compared to CF (21.5 cm) and the difference was significant (p < 0.05).
Panicle length increased with increasing nitrogen levels, ranging from 19.7 to 23.9 cm, with the lowest value being recorded from absolute control and the highest from 150 kg N ha−1.
It has been reported in other studies that AWD reduces spikelet sterility and increases grain weight [
72]. AWD and nitrogen also enhance [no s] the grain-filling rate due to enhanced activity of enzymes involved in grain filling and ultimately increases the grain yield [
72].
Grain Harvest Index and 1000 Grains Weight.
Nitrogen levels affected grain harvest index significantly, and the range was 0.45 to 0.53. Water management and interaction had no significant effect (p > 0.05) on the grain harvest index.
Water management and nitrogen levels had a significant effect on the 1000-g weight.
The weights ranged from 24.6 to 30.8 as shown in
Table 9. This is contrary to the findings of Yakubu [
64], who reported that 1000- grain weight was not significantly (
p > 0.05) influenced by N fertilizer and water management, as well as their interaction. However, these results conform to those of Yakubu [
64] under interaction, in which there was no significant difference.
Straw yield; water management, nitrogen levels, and the interactions had a significant effect on straw yield. Alternate wetting and drying (AWD) had higher straw yield (70.2 g) compared to CF (65 g), and the difference was significant (p < 0.05).
Nitrogen levels had a significant impact on straw yield (p < 0.01), the highest amount of straw being recorded at 120 kg N ha−1 (96.6 g) and the lowest at absolute control (22.3 g), showing the beneficial effects of nitrogen fertilizer on crop performance.
Straw yield decreased with an increase in nitrogen application at 150 kg N ha
−1 (85.9 g). The straw yield in the AWD interaction increased with an increase in nitrogen levels (22.9 to 102.2 g), while for CF, it decreased with increasing nitrogen levels (21.7 to 97.7 g) (
Table 9). This shows that under AWD water management practice nitrogen fertilizer keeps on raising plant production while under CF this does not increase beyond 60 kg N ha
−1.
Zheng et al. [
65] reported an increase of up to 5.3% dry matter yield under AWD compared to traditional flooding irrigation. Another study [
76] reported that nitrogen fertilizer enhances more leaf area, which leads to higher photo assimilates and thereby results in more dry matter accumulation.
Grain yield; water management had a significant effect on rice grain yield as described in
Table 9. Rice yield increased by 13.3% under AWD with 79.9 g. compared with 70.5 g of CF.
Our results are consistent with the findings of Carrijo et al. [
37] and Norton et al. [
73], who reported that AWD has the potential to increase yield because safe and moderate AWD maintains soil water potential ≥−20 kPa, which ensures soil moisture for optimal growth.
Other studies have postulated that more yield under AWD might be attributed to better grain-filling and increased root proliferation to take up more water and nutrients [
74,
77].
This is in agreement with [
65], who reported up to 13% yield increase under water-saving irrigation treatments compared to flooding irrigation. Ref. [
67] also reported up to 42% increase in grain yield under AWD.
Similarly, nitrogen levels had a highly significant impact on grain yield (
p < 0.05) at almost every nitrogen level (
Table 9). Yield increased with an increase in nitrogen levels, but further increases in fertilizer amount only up to 60 kg N ha
−1 showed no significant effects on yield; thus, the yield followed the order 120 > 60 > 90 > 150 > 0 > ABC.
This results is not in agreement with [
78], who found a significant increase in yield at 120 kg N ha
−1, and there was a decrease in yield due to an increase in nitrogen at 180 kg N ha
−1. Similar results have also been observed in previous studies [
79,
80,
81], revealing that an excessive N application rate has no contribution to the achievement of high grain yield in rice.
The percentage yield increase; the percentage yield increases due to interaction of water management and nitrogen levels ranged from 315.3 to 516.2, the highest percentage being recorded with AWD × 150, while the lowest was with CF × 150 treatments.
Eliya [
47] and Rajbhandari [
82] reported a similar trend in rice grain yield following increasing rates of N application and associated this with an increase in chlorophyll content of the leaves, which led to a higher photosynthetic rate, and ultimately, many photosynthates becoming available during grain-filling.
This indicates the necessity of applying nitrogenous fertilizer in order to supplement the low amount of N available in the soil for obtaining increased rice yield.
3.5. Irrigation Water Use, Water Saving, and Number of Irrigations
The irrigated water requirement varies depending on water irrigation and nitrogen level treatments as presented in
Table 10.
Water use was significantly (
p < 0.05) influenced by water management, N fertilizer levels, and their interaction (
Table 10). Water use ranged from 35.8 to 82.3 L pot
−1. A higher amount of water use (82.3 L) was reported under AWD × 150, and this may be due to good vigor of plants observed at this treatment, which had a direct relation with a high yield recorded (118.2 g).
Lowest water use (36 L) was recorded at CF × 0, this may be due to low evapotranspiration since the plants were not healthy with a yellow color as an indicator of low nitrogen.
Studies have reported less water use under AWD, such as that [
83] reported 18–44% less water used under different AWD treatments as compared with CF treatment. According to Carrijo et al. [
32], AWD can reduce the water demand by 23.4% compared to CF. Djaman [
42] reported that the AWD irrigation management at 30 kPa resulted in increasing rice water use and reducing the irrigation applications by 27.3%, in comparison with continuous flooding.
Water saving ranged from −2% to 34.3%, in which AWD × 150 recorded the highest water saving (34.3%), followed by AWD × 90 and AWD × 60 (11.2% and 10.2%, respectively). Less water saving (−2%) was recorded under water management treatments in which AWD used more than 1.2 L pot−1 compared to CF.
Continuous flooding was much less efficient at saving water relative to AWD, as there are greater water losses from CF system due to evaporative losses. The pots used in the study did not allow water loss through seepage or percolation. This was also reported by Bouman [
7] that under field studies, CF has water losses through seepage and percolation, puddling, and evaporative losses. These results are in agreement with Carrijo et al. [
32], who reported water saving of 23–33%. Sato and Uphoff [
68], under SRI management in Eastern Indonesia, reported water saving up to 40%. Similarly, [
84] reported that water applied in the field can be reduced by about 40–70% without a significant yield loss compared with the traditional practice of continuous shallow submergence.
Keisuke et al. [
85] also reported the reduction of irrigation water requirement for non-flooded rice by 20–50% compared to flooded rice, with the difference being strongly dependent on soil type, rainfall, and water management practices. Kahimba et al. [
16] reported that SRI demonstrated water saving of up to 63.72%, and [
85] also reported the reduction of irrigation water requirement for non-flooded rice by 20–50% compared to flooded rice. Ref. [
77] reported that the reduction in water use under SRI practice ranged between 26–31%. Sujono et al. [
67] reported irrigated water reduction from 1.7% to 17.4%.
There was a significant effect (p < 0.05) of treatments interactions on the number of irrigations. Number of irrigations ranged from 17 to 32, in which a high number of irrigations was recorded under the following treatments, AWD ×120 (32) and CF× 90 (32), and the lowest number was recorded under AWD × ABC, AWD × 0, CF× ABC, and CF× 0 (17, 18, 19, and 19, respectively).
The number of irrigations increased with increasing nitrogen levels except beyond 120 kg ha
−1, in which there was no increase in the number of irrigations as shown in
Table 10. The absolute control and control with both water management recorded fewer numbers of irrigations, but this did not result in high water productivity, as yields were also low. The findings of Ishfaq et al. [
72] illustrate similar results.
3.5.1. Equivalent Amount of Water Used to Produce 1 kg of Rice
The water requirement for crop production can also be estimated on the basis of the water footprint concept, e.g., [
86], whereby the amount of water used to produce 1 kg of rice is calculated.
An equivalent amount of water used to produce 1 kg of rice ranged from 659.6 to 1810.7 L kg−1, with the low amount being recorded under AWD × 60 and higher amount recorded under CF× ABC, indicating that AWD saved 87.1 L over CF.
Studies have reported various equivalent amounts of water used to produce 1 kg of rice under field conditions such as [
86,
87], in that it takes about 2500–5000 L of water to produce 1 kg of rice, and that the contribution of paddy rice to the total water footprint of crop production is estimated at 13% [
86].
Kahimba et al. [
16] reported the equivalent amount of water used to produce 1 kg of rice in the Mkindo site ranged from 2116 to 7347.5 Lt Kg
−1. Another study reported an average of 2500 L of water is used, ranging from 800 liters to more than 5000 L to produce one kg of rice [
7,
10].
3.5.2. Water Productivity
Water productivity ranged from 0.6 to 1.5 kg cm
−3 and was significantly affected by nitrogen levels (
p < 0.05) as described in (
Table 10).
Water management under AWD improved water productivity by 8.3% over CF. Water productivity was highest (1.5 kg/m3) in the AWD × 60 and AWD × 150 treatments and lowest (0.6 kg m−3) in CF × ABC, AWD × ABC, and AWD × 0.
Yakubu et al. [
64] and Thakur et al. [
88] reported the superiority of AWD on improving water productivity over CF. Kahimba et al. [
16], who conducted the study at Mkindo site and reported the water productivity ranging from 0.14 to 0.47 kg m
−3, and the highest was reported in the AWD irrigation regime. Hussain et al. [
89] reported the maximum values of water productivity for AWD, which was 40.9% more than CF.
4. Conclusions
Based on results, it can be concluded that nitrogen was a limiting factor for rice productivity. wetting and drying improved yield significantly (p < 0.05) by 13.3%. ranged from 21.8 to 118.2 g pot−1 in which AWD ×150 recorded higher grains yield (118.2 g), followed by AWD × 120 (108.6 g), and lowest yield was recorded under absolute control (21.8 g).
Grains yield increased with increasing nitrogen levels, although there was no significant response beyond 120 kg N ha−1. Application of 60 kg N ha−1 may be the optimum dose with AWD water saving. This indicates that continuous flooding irrigation is not an obligation in rice production, and farmers can implement AWD and 60 kg N/ha or AWD and 90 kg N/ha to reduce water use and increase water productivity while harvesting greater yields.
Nitrogen levels significantly affected water productivity, water use, and the number of irrigations. Nitrogen levels (p < 0.05) also had a significant effect on plant height, number of tillers, flag leaf area, chlorophyll content, total tillers, number of productive tillers, panicle weight, panicle length, 1000-g weight, straw yield, grain yield, and grain harvest index.
Alternate wetting and drying (AWD) improved water productivity (WP) and water saving. WP ranged from 0.6 to 1.5 kg m−3, and water saving ranged from −2% to 34.3%. Water management under AWD improved water productivity by 8.3% over CF.


