
The Response of Nutrient Uptake, Photosynthesis and Yield of Tomato to Biochar Addition under Reduced Nitrogen Application


Abstract
:1. Introduction
2. Materials and Methods
2.1. Experimental Site and Setup
2.2. Measurements
2.2.1. N and P Uptake of Tomato Plants
2.2.2. Tomato Leaf Gas Exchange Parameters
2.2.3. Tomato Leaf Photosynthetic Pigment
2.2.4. Tomato Yield
2.2.5. Statistical Analysis
3. Results
3.1. The N and P Uptake of Tomato Plants
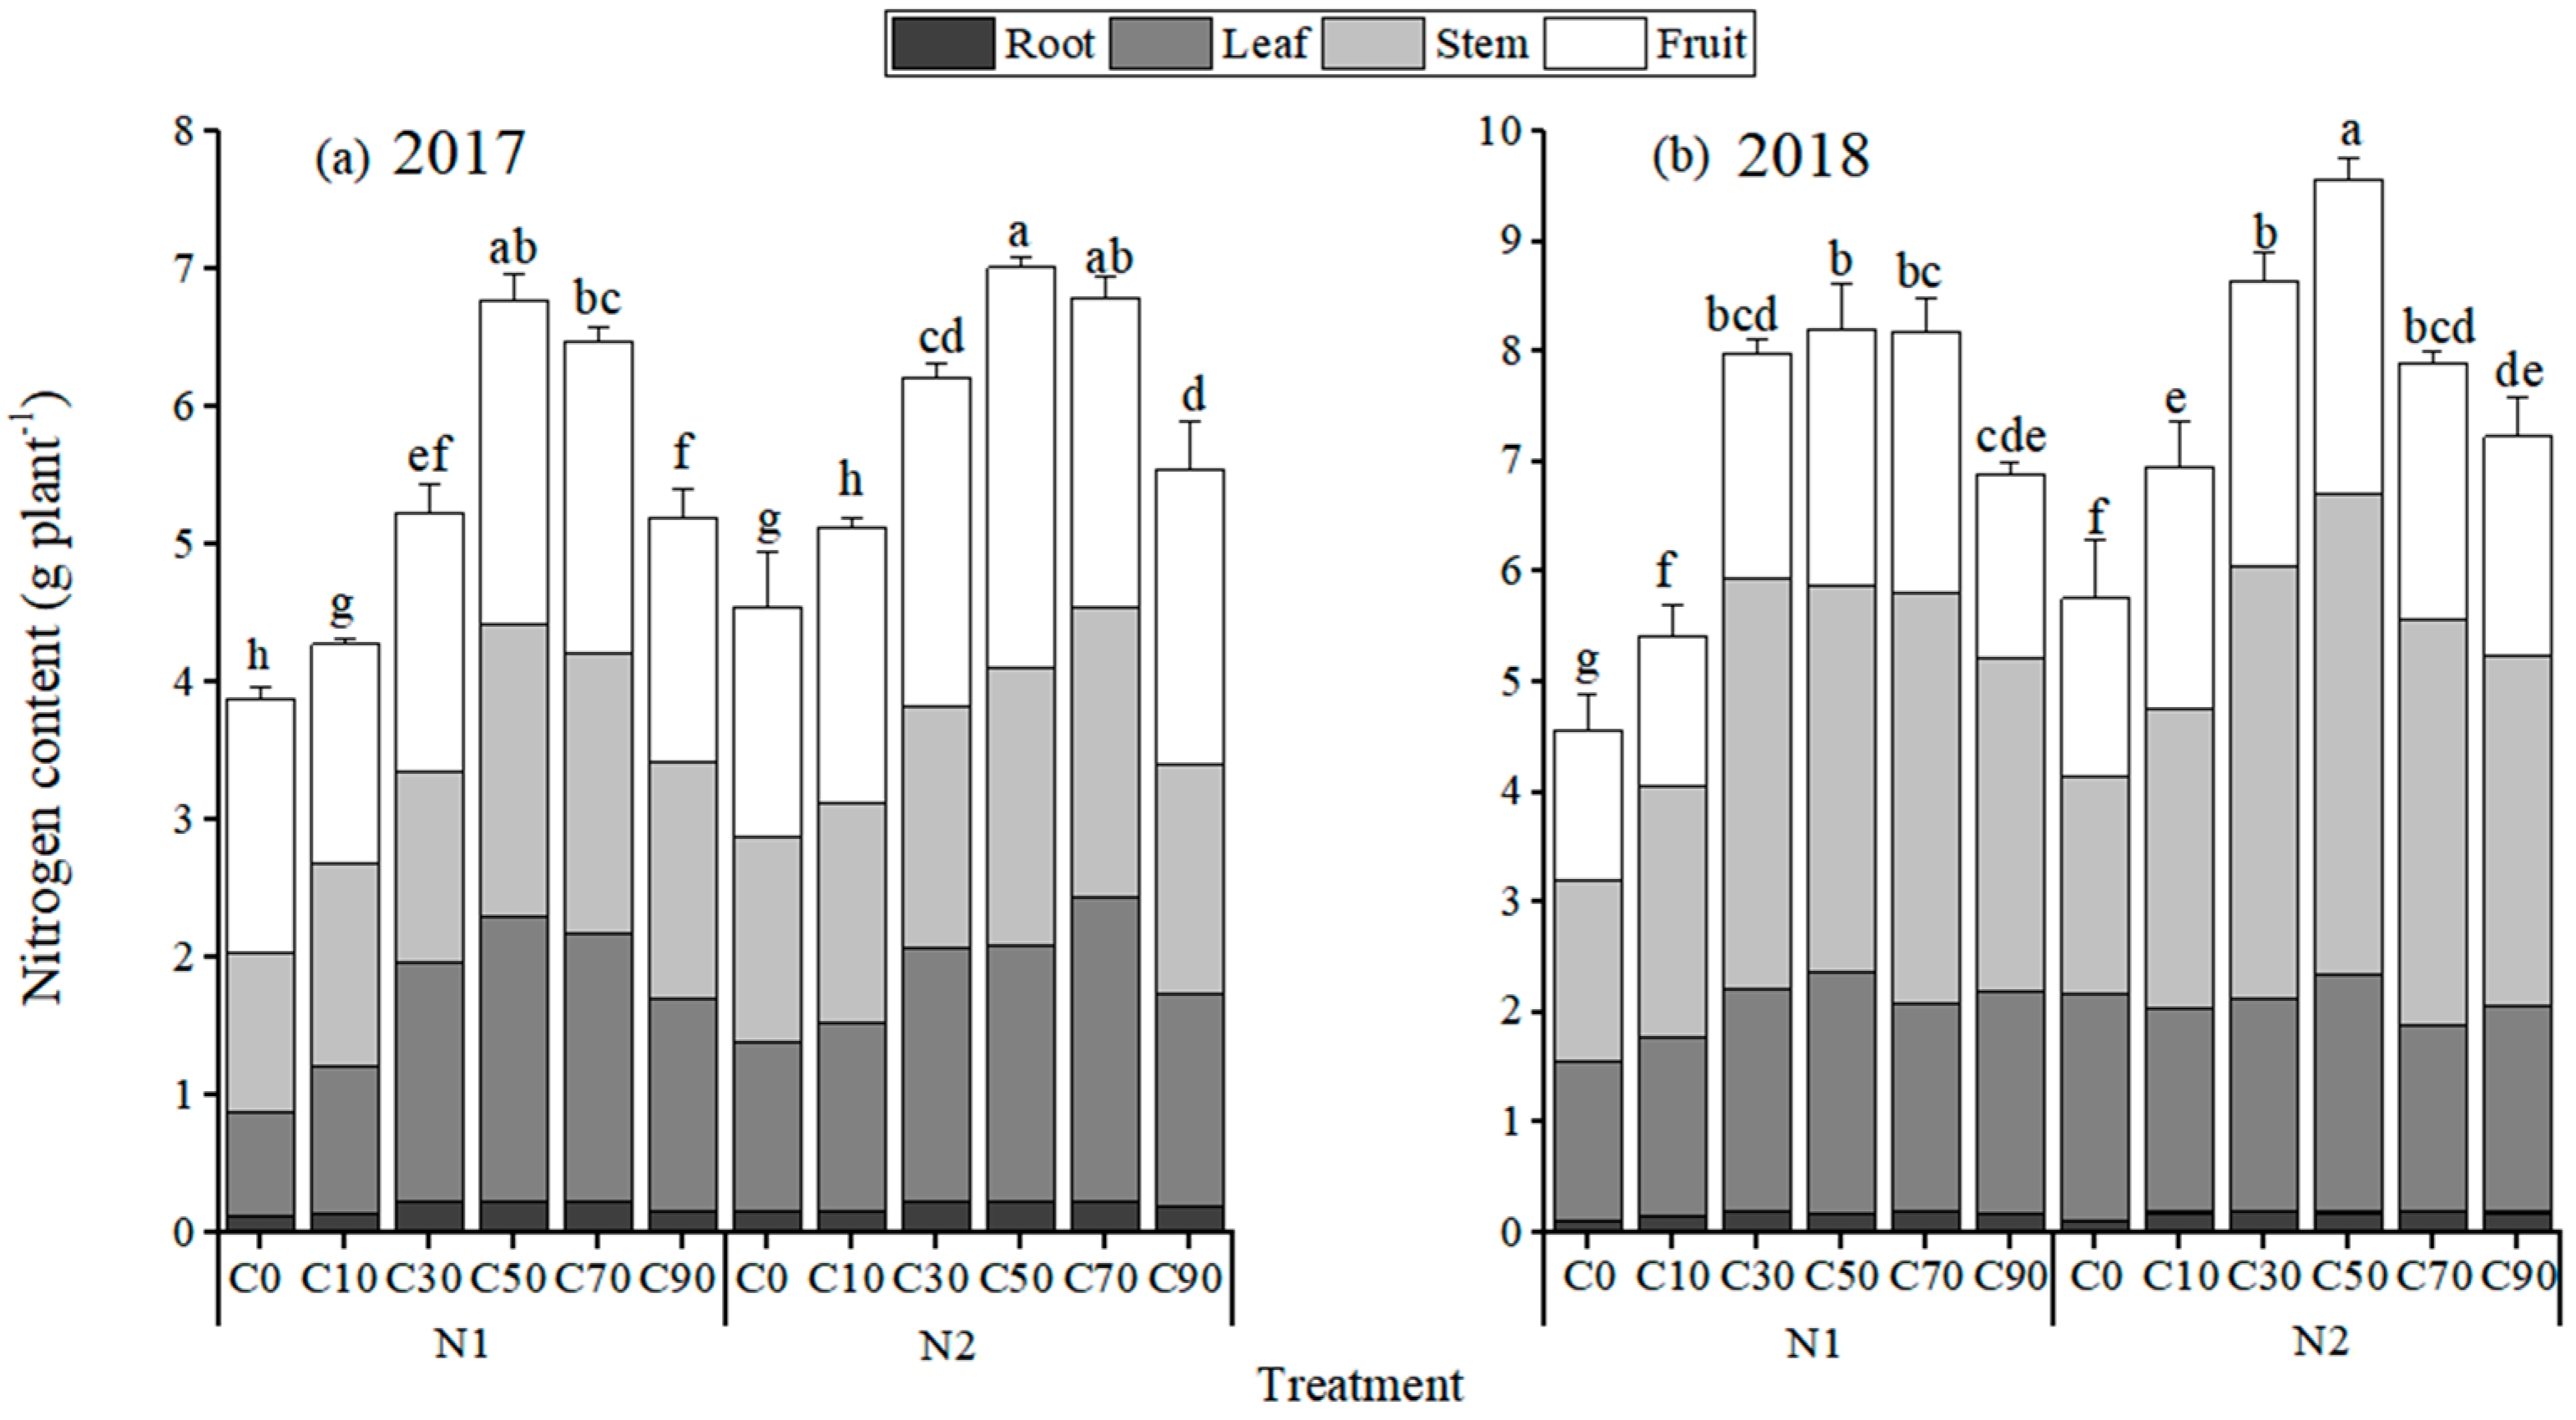
3.1.1. N Uptake
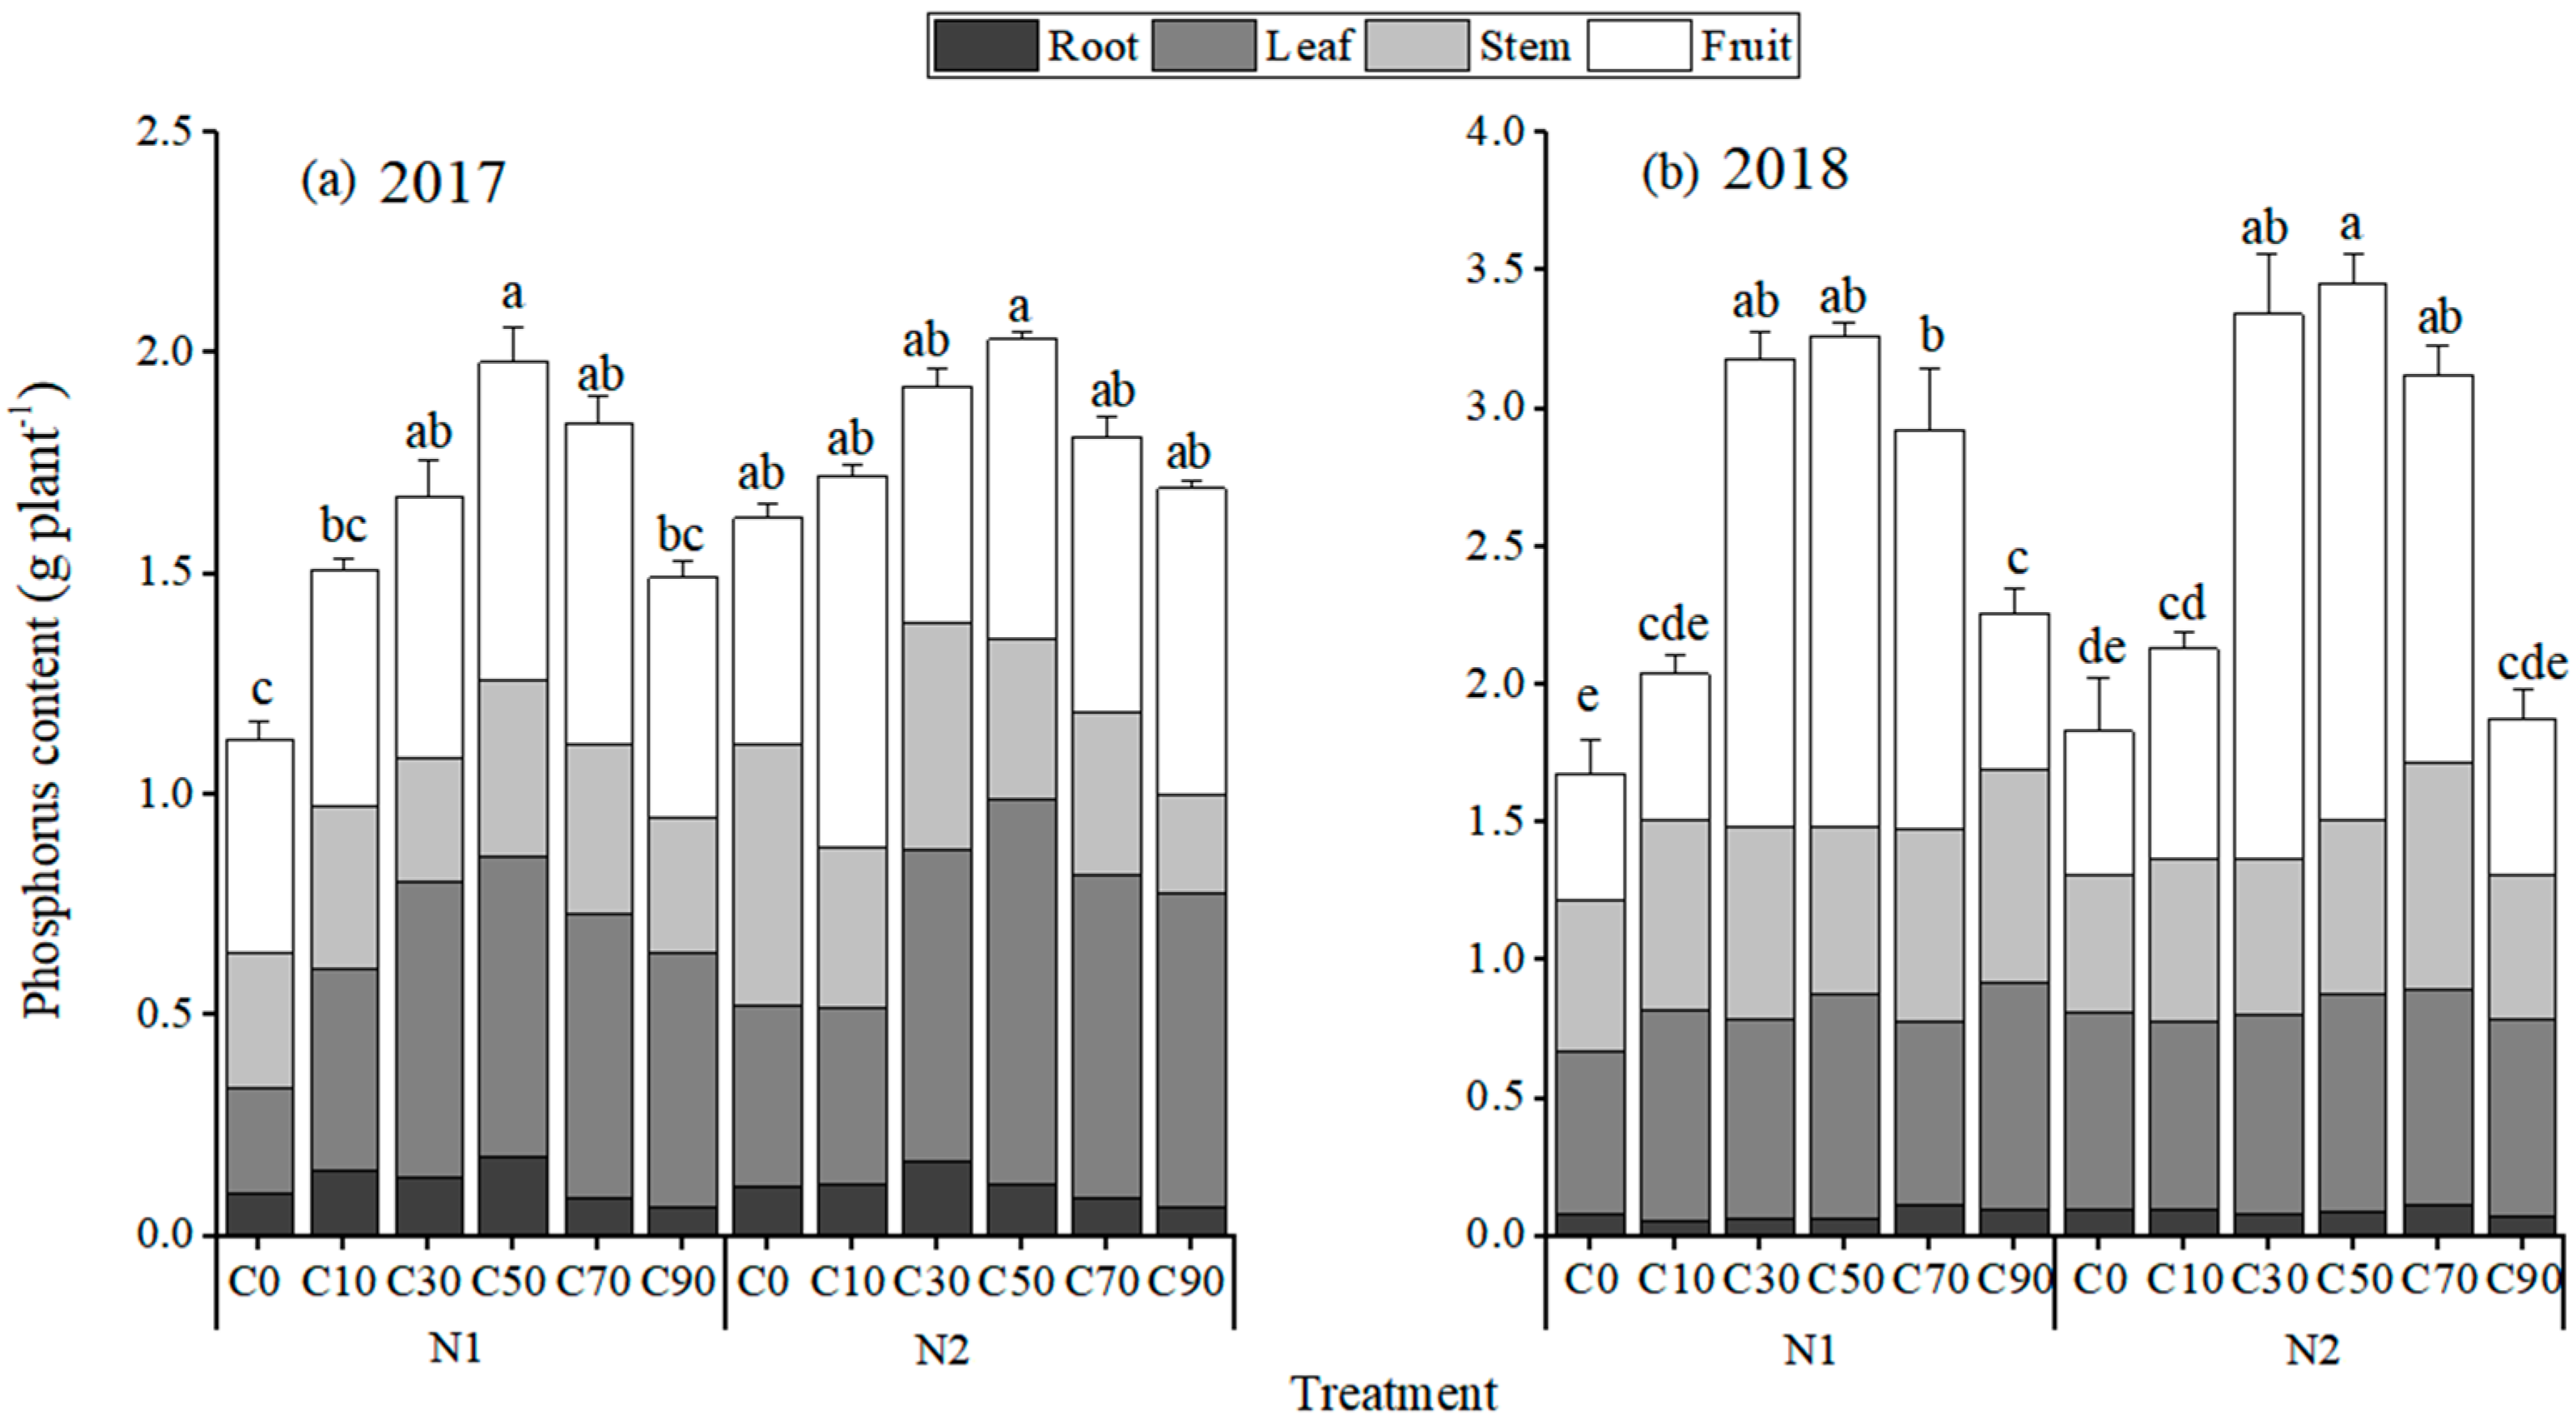
3.1.2. P Uptake
3.2. Gas Exchange Parameters of Tomato Leaves
3.3. Photosynthetic Pigments in Tomato Leaves
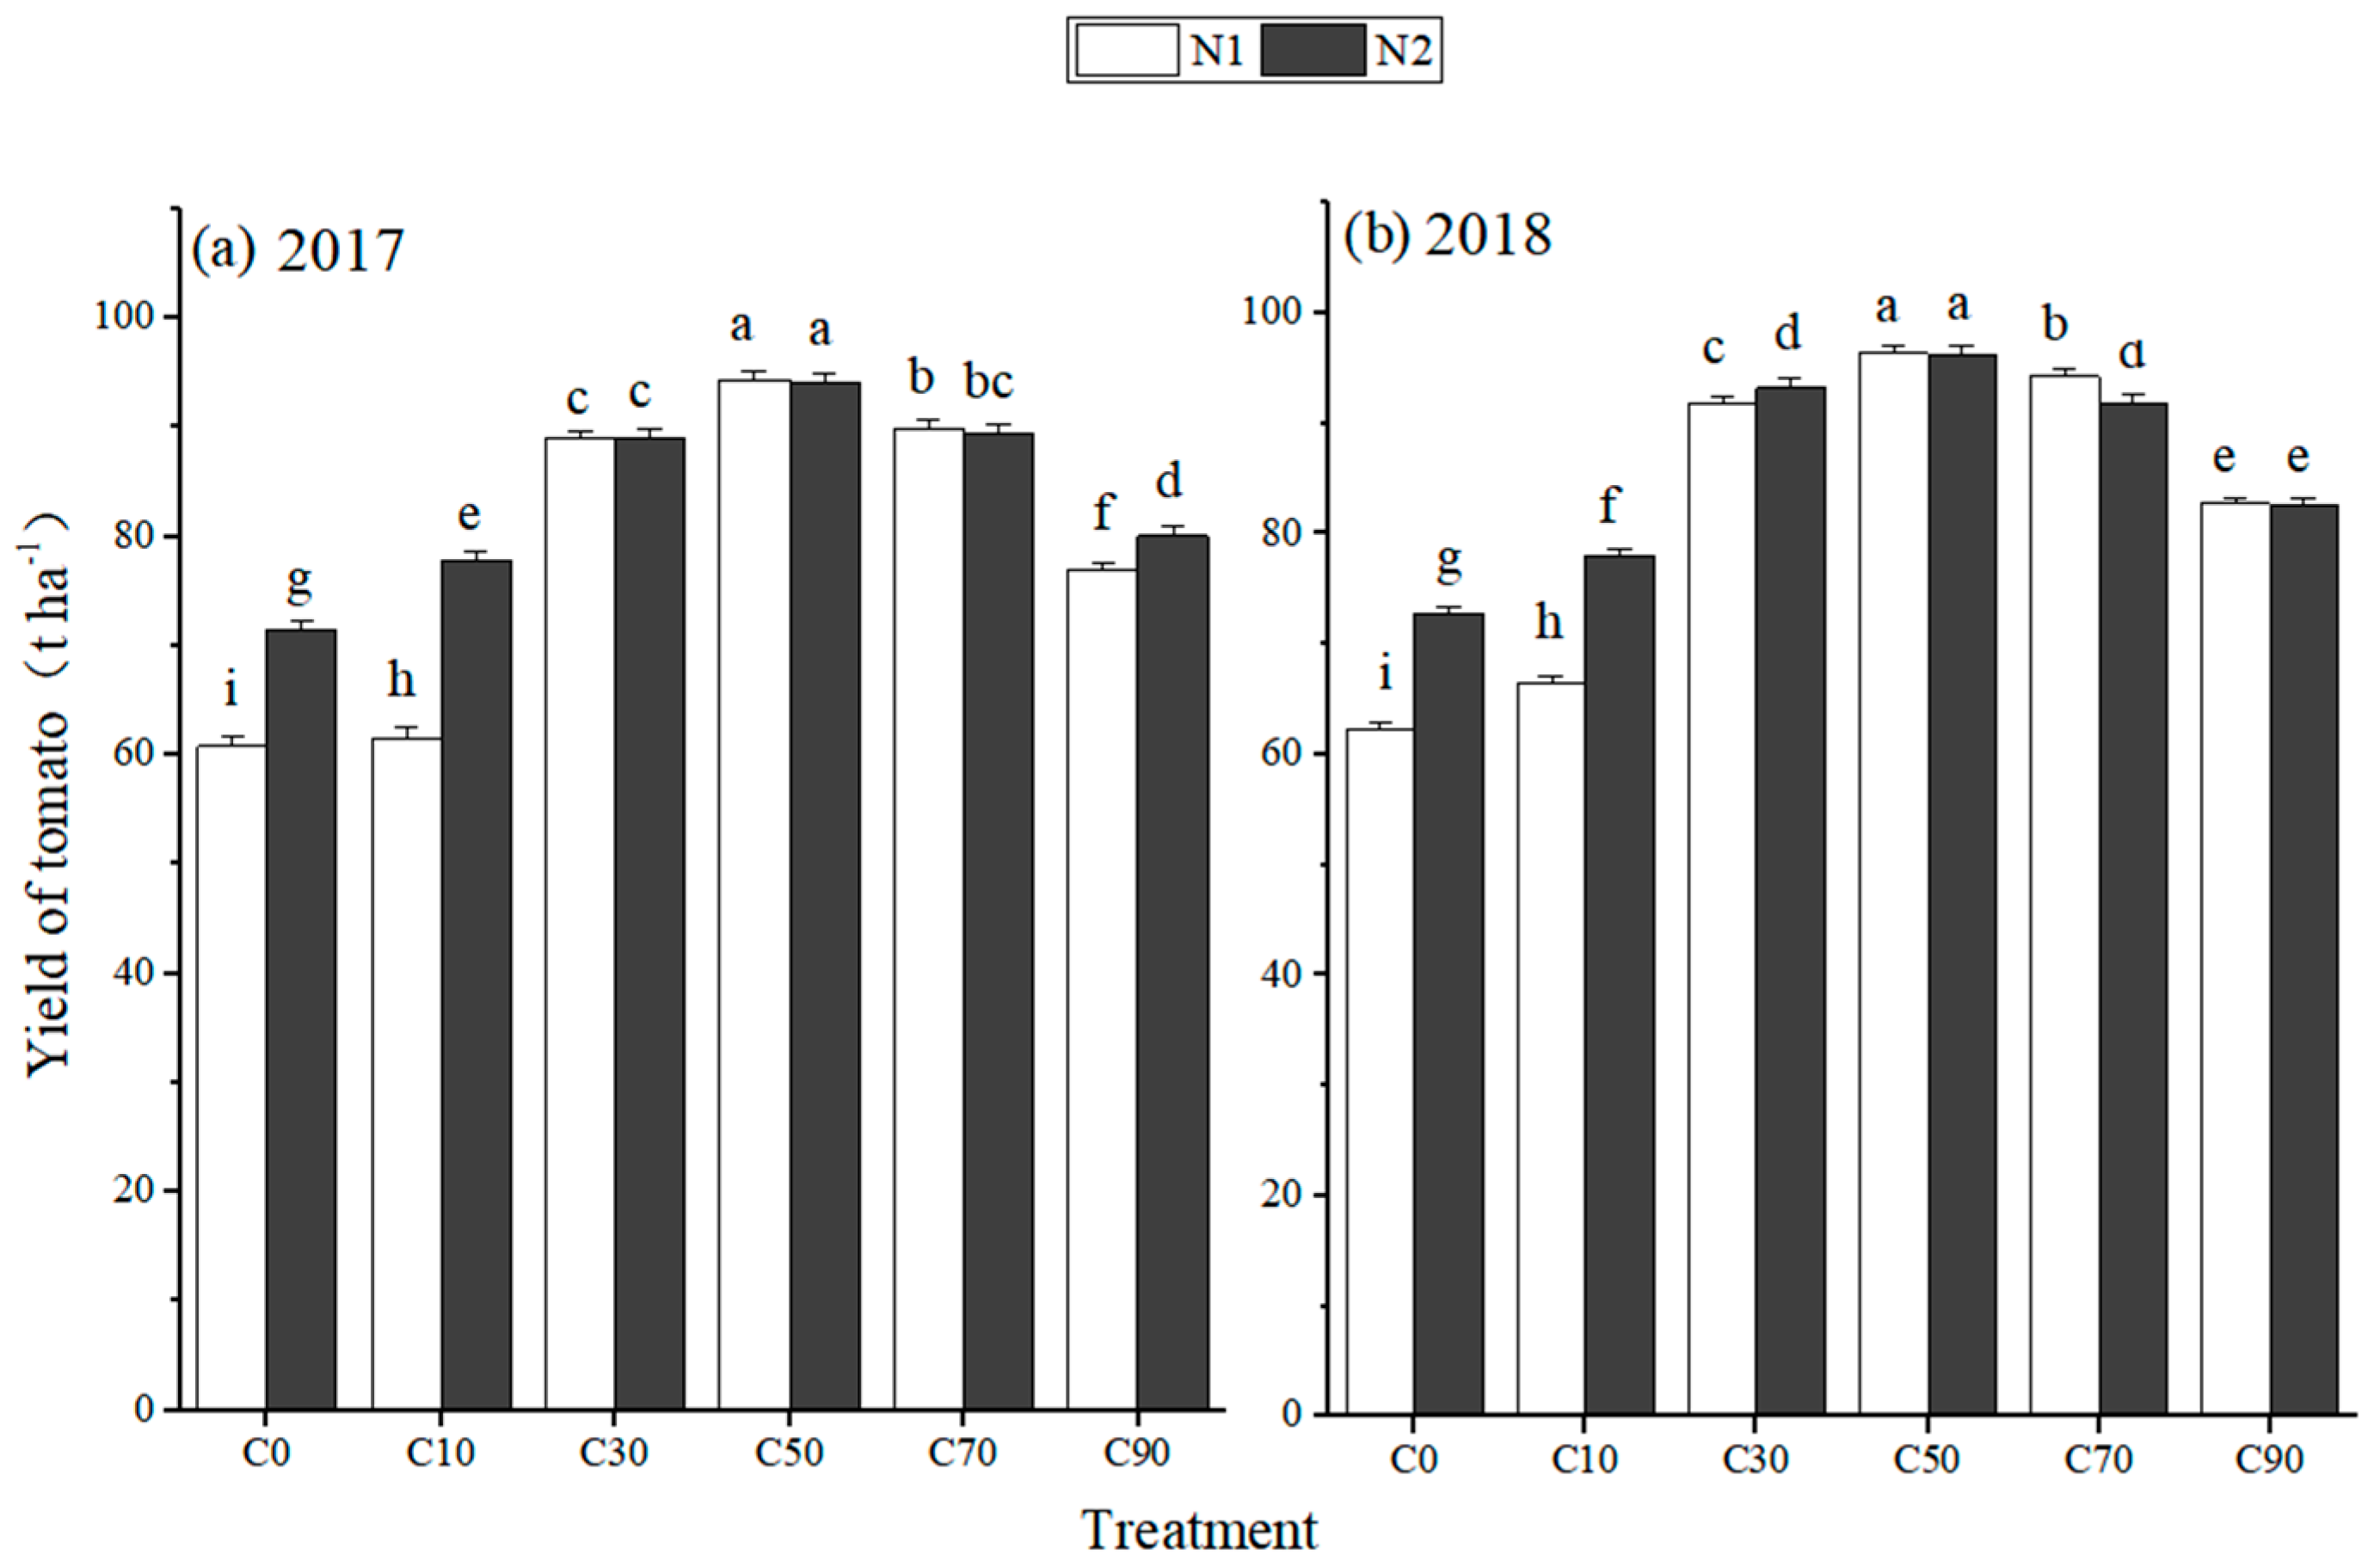
3.4. Tomato Yield
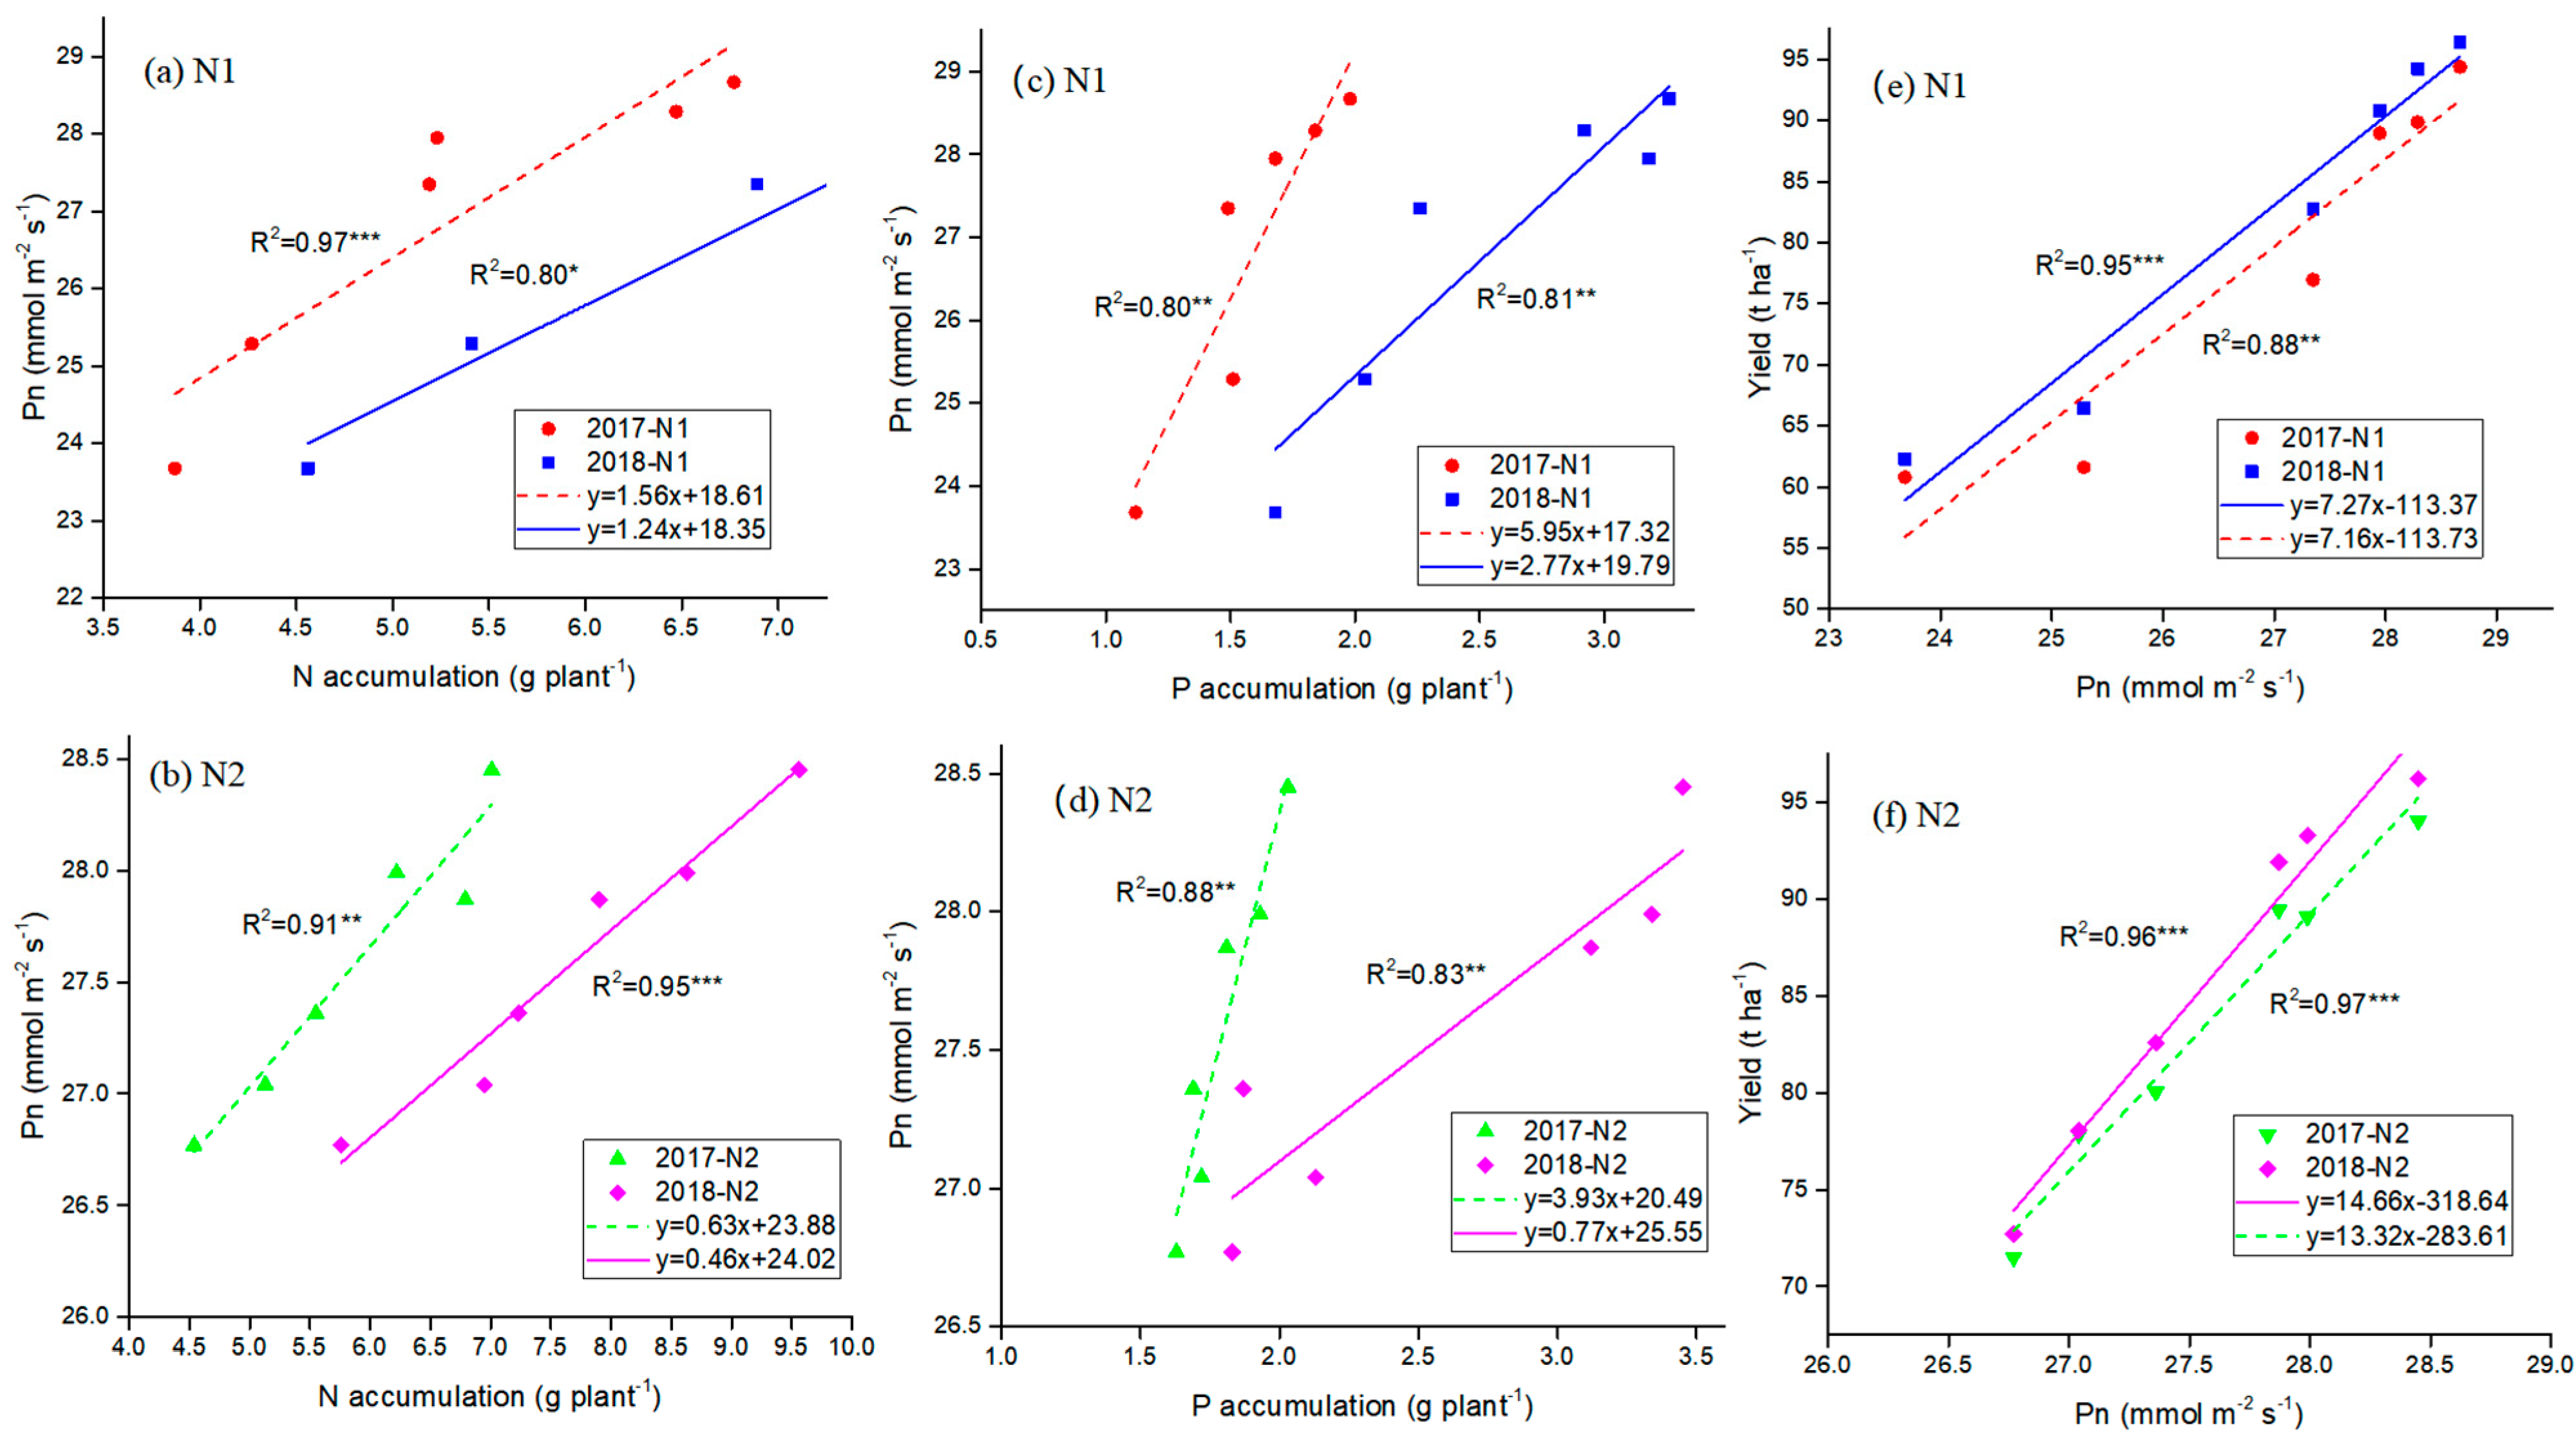
3.5. The Relationship between Nutrient Uptake, Pn and Tomato Yield
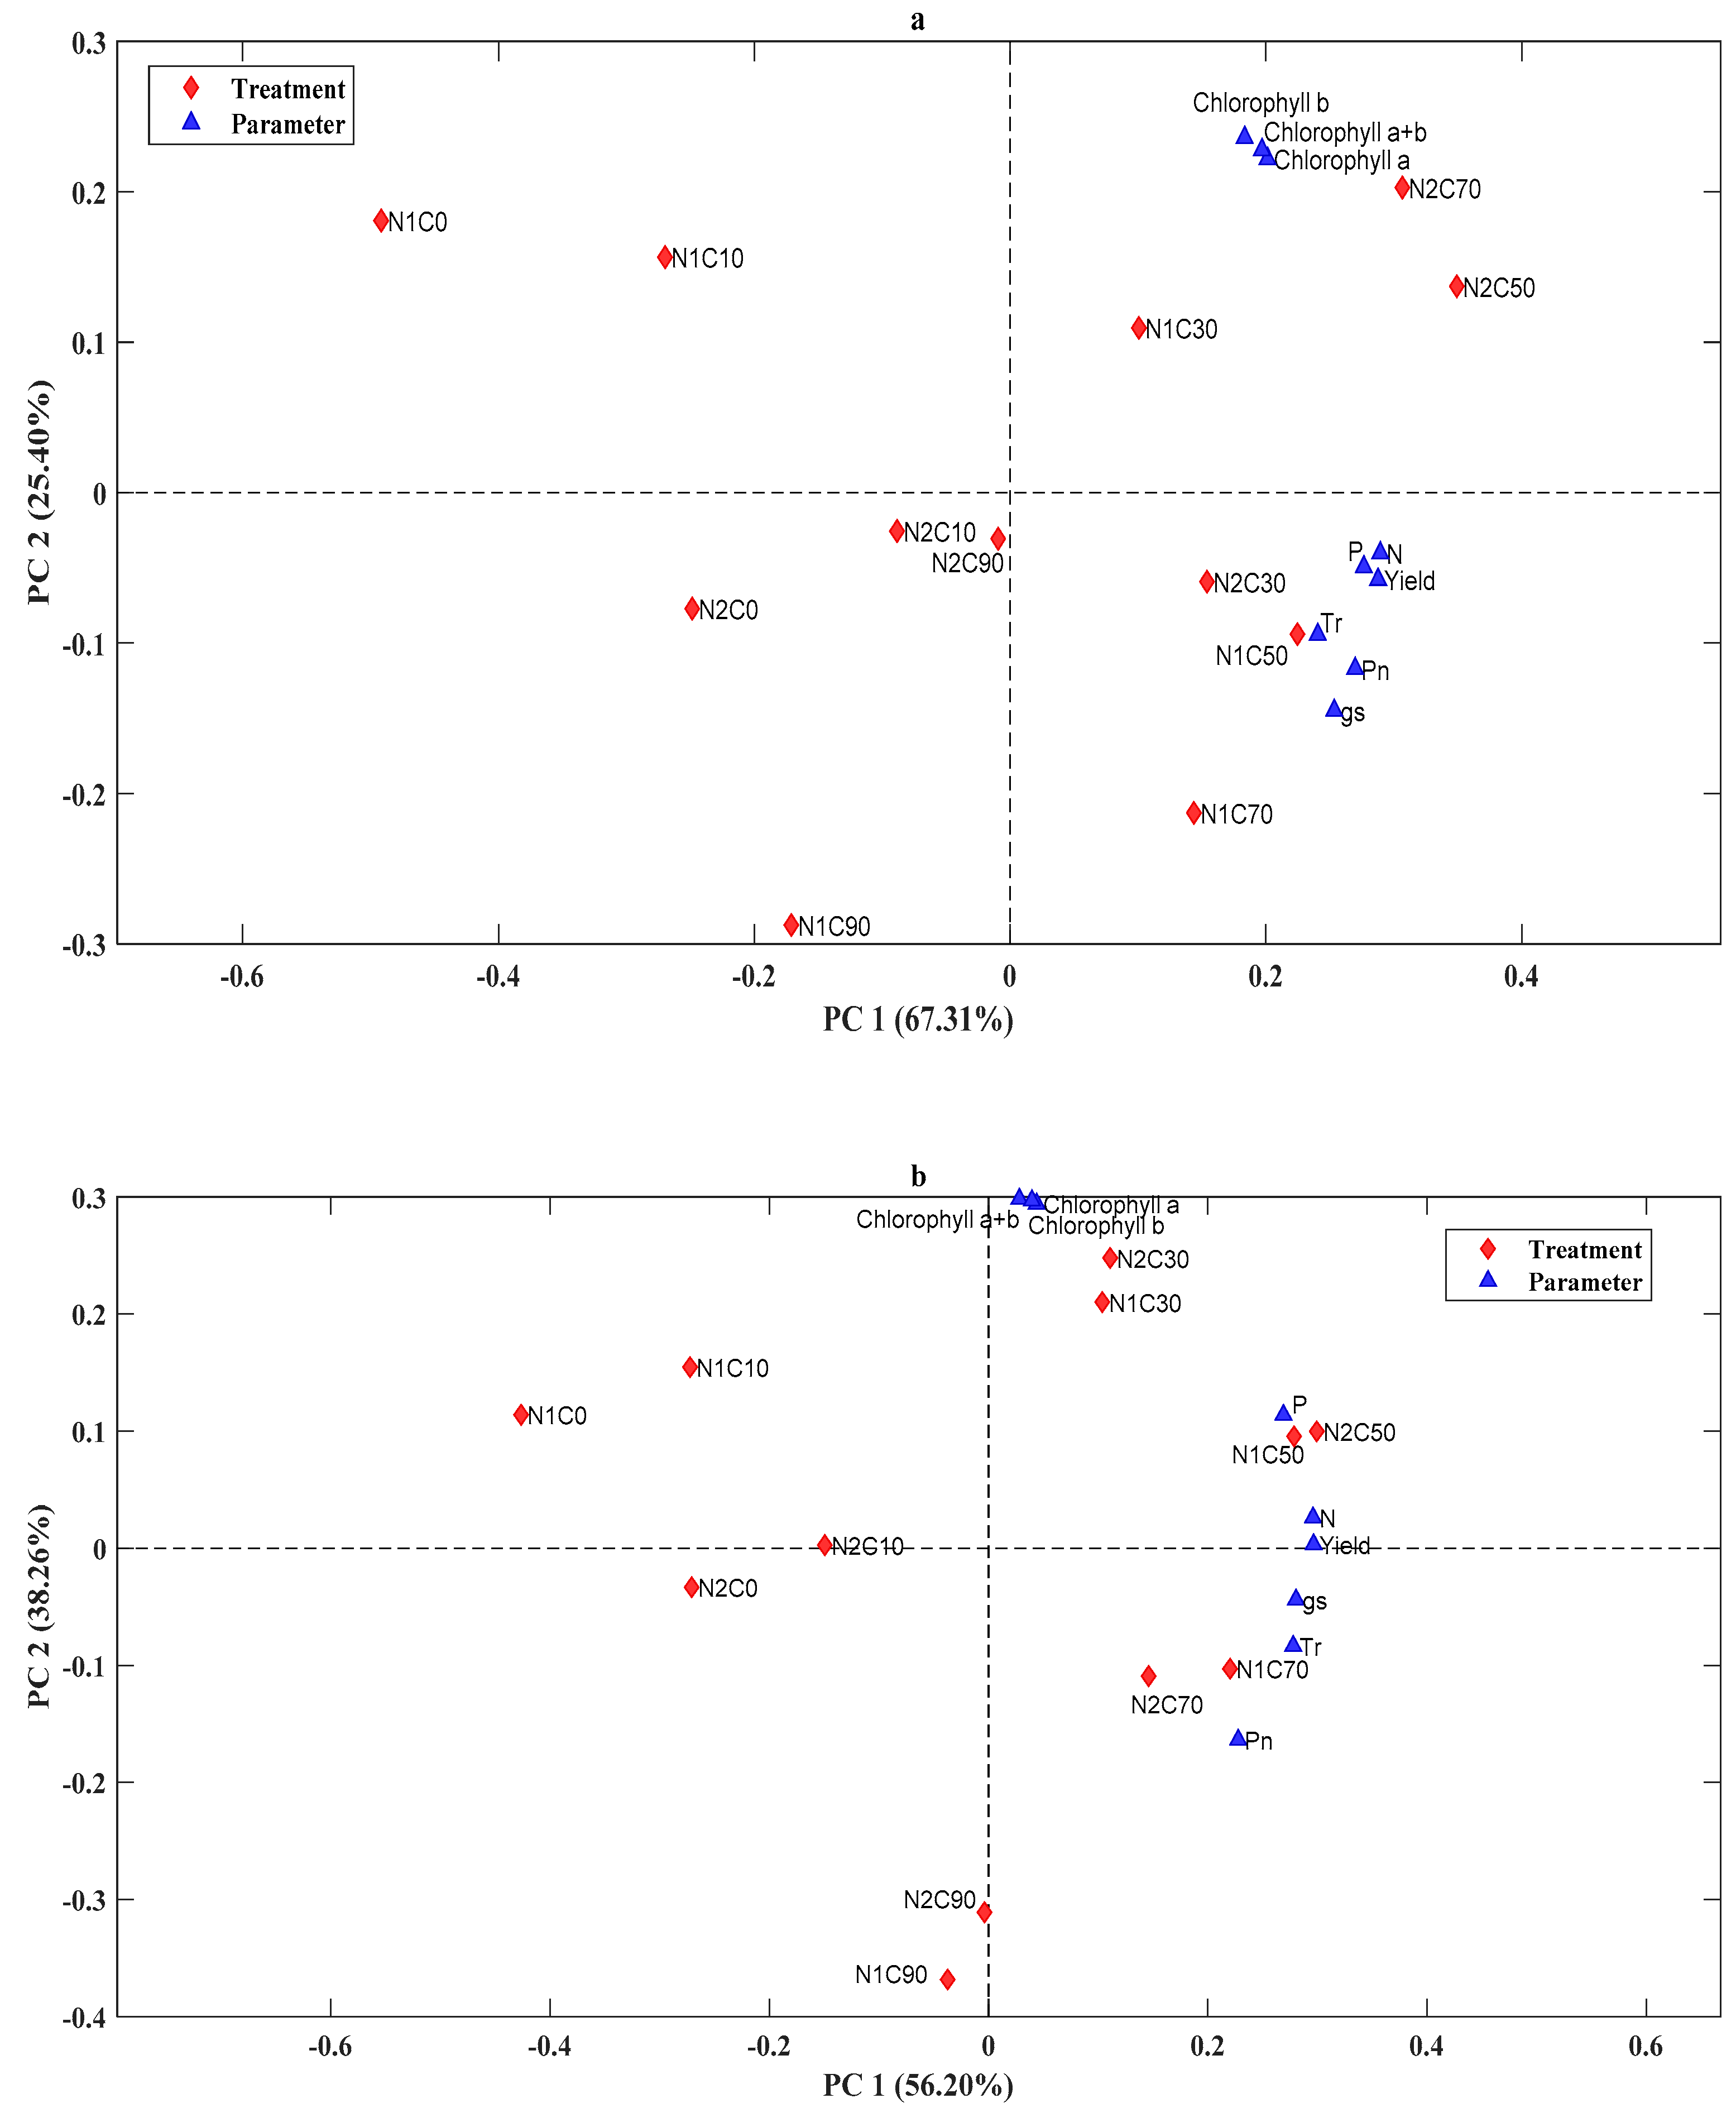
3.6. PCA Analysis for Nutrient Uptake, Photosynthetic Traits and Tomato Yield
4. Discussion
4.1. Effect of Biochar on Nutrients Uptake (N and P) of Tomato Plants
4.2. Effect of Biochar on Chlorophyll Content and Gas Exchange Parameters of Tomato
4.3. Effect of Biochar on Tomato Yield
5. Conclusions
Author Contributions
Funding
Data Availability Statement
Acknowledgments
Conflicts of Interest
References
- Liu, H.; Li, H.; Ning, H.; Zhang, X.; Li, S.; Pang, J.; Wang, G.; Sun, J. Optimizing irrigation frequency and amount to balance yield, fruit quality and water use efficiency of greenhouse tomato. Agric. Water Manag. 2019, 226, 105787. [Google Scholar] [CrossRef]
- Nicola, S.; Tibaldi, G.; Fontana, E.; Crops, A.-V.; Plants, A. Tomato production systems and their application to the tropics. Proc. IS Tomato Trop. Acta Hortic. 2009, 821, 27–33. [Google Scholar] [CrossRef]
- Han, P.; Bayram, Y.; Shaltiel-Harpaz, L.; Sohrabi, F.; Saji, A.; Esenali, U.T.; Jalilov, A.; Ali, A.; Shashank, P.R.; Ismoilov, K. Tuta absoluta continues to disperse in Asia: Damage, ongoing management and future challenges. J. Pest Sci. 2019, 92, 1317–1327. [Google Scholar] [CrossRef]
- He, Z.; Li, M.; Cai, Z.; Zhao, R.; Hong, T.; Yang, Z.; Zhang, Z. Optimal irrigation and fertilizer amounts based on multi-level fuzzy comprehensive evaluation of yield, growth and fruit quality on cherry tomato. Agric. Water Manag. 2021, 243, 106360. [Google Scholar] [CrossRef]
- Fanwoua, J.; Vercambre, G.; Buck-Sorlin, G.; Dieleman, J.A.; de Visser, P.; Génard, M. Supplemental LED lighting affects the dynamics of tomato fruit growth and composition. Sci. Hortic. 2019, 256, 108571. [Google Scholar] [CrossRef]
- Guo, L.; Bornø, M.L.; Niu, W.; Liu, F. Biochar amendment improves shoot biomass of tomato seedlings and sustains water relations and leaf gas exchange rates under different irrigation and nitrogen regimes. Agric. Water Manag. 2021, 245, 106580. [Google Scholar] [CrossRef]
- Ghorbani, M.; Amirahmadi, E.; Zamanian, K. In-situ biochar production in paddies: Direct involvement of farmers in greenhouse gases reduction policies besides increasing nutrients availability and rice production. Land Degrad. Dev. 2021. [Google Scholar] [CrossRef]
- Kwoczynski, Z.; Čmelík, J. Characterization of biomass wastes and its possibility of agriculture utilization due to biochar production by torrefaction process. J. Clean. Prod. 2021, 280, 124302. [Google Scholar] [CrossRef]
- Zheng, Y.; Wang, B.; Wester, A.E.; Chen, J.; He, F.; Chen, H.; Gao, B. Reclaiming phosphorus from secondary treated municipal wastewater with engineered biochar. Chem. Eng. J. 2019, 362, 460–468. [Google Scholar] [CrossRef]
- Wang, Q.; Wang, B.; Lee, X.; Lehmann, J.; Gao, B. Sorption and desorption of Pb (II) to biochar as affected by oxidation and pH. Sci. Total Environ. 2018, 634, 188–194. [Google Scholar] [CrossRef] [PubMed] [Green Version]
- Zhibin, L.; Liu, Q.; Liu, G.; Cowie, A.L.; Bei, Q.; Liu, B.; Wang, X.; Ma, J.; Zhu, J.; Xie, Z. Effects of different biochars on Pinus elliottii growth, N use efficiency, soil N2O and CH4 emissions and C storage in a subtropical area of China. Pedosphere 2017, 27, 248–261. [Google Scholar]
- Farhangi-Abriz, S.; Torabian, S.; Qin, R.; Noulas, C.; Lu, Y.; Gao, S. Biochar effects on yield of cereal and legume crops using meta-analysis. Sci. Total Environ. 2021, 775, 145869. [Google Scholar] [CrossRef]
- Huang, H.; Reddy, N.G.; Huang, X.; Chen, P.; Wang, P.; Zhang, Y.; Huang, Y.; Lin, P.; Garg, A. Effects of pyrolysis temperature, feedstock type and compaction on water retention of biochar amended soil. Sci. Rep. 2021, 11, 1–19. [Google Scholar]
- Alling, V.; Hale, S.E.; Martinsen, V.; Mulder, J.; Smebye, A.; Breedveld, G.D.; Cornelissen, G. The role of biochar in retaining nutrients in amended tropical soils. J. Plant Nutr. Soil Sci. 2014, 177, 671–680. [Google Scholar] [CrossRef]
- Angst, T.E.; Sohi, S.P. Establishing release dynamics for plant nutrients from biochar. GCB Bioenergy 2013, 5, 221–226. [Google Scholar] [CrossRef]
- Oladele, S.; Adeyemo, A.; Awodun, M. Influence of rice husk biochar and inorganic fertilizer on soil nutrients availability and rain-fed rice yield in two contrasting soils. Geoderma 2019, 336, 1–11. [Google Scholar] [CrossRef]
- Zheng, H.; Wang, Z.; Deng, X.; Herbert, S.; Xing, B. Impacts of adding biochar on nitrogen retention and bioavailability in agricultural soil. Geoderma 2013, 206, 32–39. [Google Scholar] [CrossRef]
- Ali, I.; Ullah, S.; He, L.; Zhao, Q.; Iqbal, A.; Wei, S.; Shah, T.; Ali, N.; Bo, Y.; Adnan, M. Combined application of biochar and nitrogen fertilizer improves rice yield, microbial activity and N-metabolism in a pot experiment. PeerJ 2020, 8, e10311. [Google Scholar] [CrossRef] [PubMed]
- Rizwan, M.; Ali, S.; Abbas, T.; Adrees, M.; Zia-ur-Rehman, M.; Ibrahim, M.; Abbas, F.; Qayyum, M.F.; Nawaz, R. Residual effects of biochar on growth, photosynthesis and cadmium uptake in rice (Oryza sativa L.) under Cd stress with different water conditions. J. Environ. Manag. 2018, 206, 676–683. [Google Scholar] [CrossRef]
- Qian, Z.; Kong, L.-J.; Shan, Y.-Z.; Yao, X.-D.; Zhang, H.-J.; Xie, F.-T.; Xue, A. Effect of biochar on grain yield and leaf photosynthetic physiology of soybean cultivars with different phosphorus efficiencies. J. Integr. Agric. 2019, 18, 2242–2254. [Google Scholar]
- Abideen, Z.; Koyro, H.-W.; Huchzermeyer, B.; Bilquees, G.; Khan, M.A. Impact of a biochar or a biochar-compost mixture on water relation, nutrient uptake and photosynthesis of Phragmites karka. Pedosphere 2020, 30, 466–477. [Google Scholar] [CrossRef]
- Bruun, E.W.; Petersen, C.T.; Hansen, E.; Holm, J.K.; Hauggaard-Nielsen, H. Biochar amendment to coarse sandy subsoil improves root growth and increases water retention. Soil Use Manag. 2014, 30, 109–118. [Google Scholar] [CrossRef]
- Nemeskéri, E.; Molnár, K.; Helyes, L. Relationships of spectral traits with yield and nutritional quality of snap beans (Phaseolus vulgaris L.) in dry seasons. Arch. Agron. Soil Sci. 2018, 64, 1222–1239. [Google Scholar] [CrossRef]
- Nemeskéri, E.; Neményi, A.; Bőcs, A.; Pék, Z.; Helyes, L. Physiological factors and their relationship with the productivity of processing tomato under different water supplies. Water 2019, 11, 586. [Google Scholar] [CrossRef] [Green Version]
- Lévesque, V.; Jeanne, T.; Dorais, M.; Ziadi, N.; Hogue, R.; Antoun, H. Biochars improve tomato and sweet pepper performance and shift bacterial composition in a peat-based growing medium. Appl. Soil Ecol. 2020, 153, 103579. [Google Scholar] [CrossRef]
- Graber, E.R.; Harel, Y.M.; Kolton, M.; Cytryn, E.; Silber, A.; David, D.R.; Tsechansky, L.; Borenshtein, M.; Elad, Y. Biochar impact on development and productivity of pepper and tomato grown in fertigated soilless media. Plant Soil 2010, 337, 481–496. [Google Scholar] [CrossRef]
- Massa, D.; Bonetti, A.; Cacini, S.; Faraloni, C.; Prisa, D.; Tuccio, L.; Petruccelli, R. Soilless tomato grown under nutritional stress increases green biomass but not yield or quality in presence of biochar as growing medium. Hortic. Environ. Biotechnol. 2019, 60, 871–881. [Google Scholar] [CrossRef]
- Vaccari, F.; Maienza, A.; Miglietta, F.; Baronti, S.; Di Lonardo, S.; Giagnoni, L.; Lagomarsino, A.; Pozzi, A.; Pusceddu, E.; Ranieri, R. Biochar stimulates plant growth but not fruit yield of processing tomato in a fertile soil. Agric. Ecosyst. Environ. 2015, 207, 163–170. [Google Scholar] [CrossRef]
- Bénard, C.; Gautier, H.; Bourgaud, F.; Grasselly, D.; Navez, B.; Caris-Veyrat, C.; Weiss, M.; Génard, M. Effects of low nitrogen supply on tomato (Solanum lycopersicum) fruit yield and quality with special emphasis on sugars, acids, ascorbate, carotenoids, and phenolic compounds. J. Agric. Food Chem. 2009, 57, 4112–4123. [Google Scholar] [CrossRef]
- Elia, A.; Conversa, G. Agronomic and physiological responses of a tomato crop to nitrogen input. Eur. J. Agron. 2012, 40, 64–74. [Google Scholar] [CrossRef]
- Hernández, V.; Hellín, P.; Fenoll, J.; Flores, P. Impact of nitrogen supply limitation on tomato fruit composition. Sci. Hortic. 2020, 264, 109173. [Google Scholar] [CrossRef]
- Peat, W. Relationships between photosynthesis and light intensity in the tomato. Ann. Bot. 1970, 34, 319–328. [Google Scholar] [CrossRef]
- Nogués, S.; Cotxarrera, L.; Alegre, L.; Trillas, M.I. Limitations to photosynthesis in tomato leaves induced by Fusarium wilt. New Phytol. 2002, 154, 461–470. [Google Scholar] [CrossRef]
- Nunes-Nesi, A.; Carrari, F.; Gibon, Y.; Sulpice, R.; Lytovchenko, A.; Fisahn, J.; Graham, J.; Ratcliffe, R.G.; Sweetlove, L.J.; Fernie, A.R. Deficiency of mitochondrial fumarase activity in tomato plants impairs photosynthesis via an effect on stomatal function. Plant J. 2007, 50, 1093–1106. [Google Scholar] [CrossRef] [PubMed]
- Du, Y.-D.; Zhang, Q.; Cui, B.-J.; Sun, J.; Wang, Z.; Ma, L.-H.; Niu, W.-Q. Aerated irrigation improves tomato yield and nitrogen use efficiency while reducing nitrogen application rate. Agric. Water Manag. 2020, 235, 106152. [Google Scholar] [CrossRef]
- Guo, L.; Yu, H.; Niu, W.; Kharbach, M. Biochar Promotes Nitrogen Transformation and Tomato Yield by Regulating Nitrogen-Related Microorganisms in Tomato Cultivation Soil. Agronomy 2021, 11, 381. [Google Scholar] [CrossRef]
- Dayong, T.; Xuandong, W.; Qin, X. The Mensuration of Eight Kinds Mineral Matters Contents of Partial Plants in Tarim Basin. Chin. Agric. Sci. Bull. 2006, 4, 137–140. [Google Scholar]
- Thwe, A.A.; Vercambre, G.; Gautier, H.; Gay, F.; Phattaralerphong, J.; Kasemsap, P. Response of photosynthesis and chlorophyll fluorescence to acute ozone stress in tomato (Solanum lycopersicum Mill.). Photosynthetica 2014, 52, 105–116. [Google Scholar] [CrossRef]
- Gitelson, A.A.; Zur, Y.; Chivkunova, O.B.; Merzlyak, M.N. Assessing carotenoid content in plant leaves with reflectance spectroscopy. Photochem. Photobiol. 2002, 75, 272–281. [Google Scholar] [CrossRef]
- Zhang, Y.; Wang, J.; Feng, Y. The effects of biochar addition on soil physicochemical properties: A review. Catena 2021, 202, 105284. [Google Scholar] [CrossRef]
- Mukherjee, S.; Mavi, M.S.; Singh, J.; Singh, B.P. Rice-residue biochar influences phosphorus availability in soil with contrasting P status. Arch. Agron. Soil Sci. 2020, 66, 778–791. [Google Scholar] [CrossRef]
- El-Naggar, A.; El-Naggar, A.H.; Shaheen, S.M.; Sarkar, B.; Chang, S.X.; Tsang, D.C.; Rinklebe, J.; Ok, Y.S. Biochar composition-dependent impacts on soil nutrient release, carbon mineralization, and potential environmental risk: A review. J. Environ. Manag. 2019, 241, 458–467. [Google Scholar] [CrossRef]
- Han, S.-H.; Kim, D.-H.; Kim, G.N.; Byun, J.-K. Changes of leaf characteristics, pigment content and photosynthesis of Forsythia saxatilis under two different light intensities. J. Korean Soc. For. Sci. 2011, 100, 609–615. [Google Scholar]
- Van Roekel, R.; Purcell, L. Understanding and increasing soybean yields. In Proceedings of the Integrated Crop Management Conference, Ames, IA, USA, 1 December 2016. [Google Scholar]
- Rehman, M.Z.-u.; Rizwan, M.; Ali, S.; Fatima, N.; Yousaf, B.; Naeem, A.; Sabir, M.; Ahmad, H.R.; Ok, Y.S. Contrasting effects of biochar, compost and farm manure on alleviation of nickel toxicity in maize (Zea mays L.) in relation to plant growth, photosynthesis and metal uptake. Ecotoxicol. Environ. Saf. 2016, 133, 218–225. [Google Scholar] [CrossRef] [PubMed]
- Wang, S.; Zheng, J.; Wang, Y.; Yang, Q.; Chen, T.; Chen, Y.; Chi, D.; Xia, G.; Siddique, K.H.; Wang, T. Photosynthesis, Chlorophyll Fluorescence, and Yield of Peanut in Response to Biochar Application. Front. Plant Sci. 2021, 12, 1000. [Google Scholar]
- He, Y.; Yao, Y.; Ji, Y.; Deng, J.; Zhou, G.; Liu, R.; Shao, J.; Zhou, L.; Li, N.; Zhou, X. Biochar amendment boosts photosynthesis and biomass in C3 but not C4 plants: A global synthesis. GCB Bioenergy 2020, 12, 605–617. [Google Scholar] [CrossRef]
- Mauromicale, G.; Ierna, A.; Marchese, M. Chlorophyll fluorescence and chlorophyll content in field-grown potato as affected by nitrogen supply, genotype, and plant age. Photosynthetica 2006, 44, 76–82. [Google Scholar] [CrossRef]
- Laghari, M.; Mirjat, M.S.; Hu, Z.; Fazal, S.; Xiao, B.; Hu, M.; Chen, Z.; Guo, D. Effects of biochar application rate on sandy desert soil properties and sorghum growth. Catena 2015, 135, 313–320. [Google Scholar] [CrossRef]
- Asai, H.; Samson, B.K.; Stephan, H.M.; Songyikhangsuthor, K.; Homma, K.; Kiyono, Y.; Inoue, Y.; Shiraiwa, T.; Horie, T. Biochar amendment techniques for upland rice production in Northern Laos: 1. Soil physical properties, leaf SPAD and grain yield. Field Crop. Res. 2009, 111, 81–84. [Google Scholar] [CrossRef]
- Xie, X.; Li, B.; Shen, S. Impact of high temperature stress on photosynthetic characteristic and yield of rice (Oryza sativa) at heading. Indian J. Agric. Sci. 2012, 82, 516–522. [Google Scholar]
- Chan, K.Y.; Van Zwieten, L.; Meszaros, I.; Downie, A.; Joseph, S. Agronomic values of greenwaste biochar as a soil amendment. Soil Res. 2007, 45, 629–634. [Google Scholar] [CrossRef]
- Blackwell, P.; Krull, E.; Butler, G.; Herbert, A.; Solaiman, Z. Effect of banded biochar on dryland wheat production and fertiliser use in south-western Australia: An agronomic and economic perspective. Soil Res. 2010, 48, 531–545. [Google Scholar] [CrossRef]
- Zhu, X.; Chen, B.; Zhu, L.; Xing, B. Effects and mechanisms of biochar-microbe interactions in soil improvement and pollution remediation: A review. Environ. Pollut. 2017, 227, 98–115. [Google Scholar] [CrossRef] [PubMed]

| Factors | N Accumulation | P Accumulation | Pn | gs | Tr | Chlorophyll a | Chlorophyll b | Chlorophyll a + b | Yield |
|---|---|---|---|---|---|---|---|---|---|
| N | *** | * | ns | ns | ns | ns | * | ns | *** |
| C | *** | *** | *** | *** | *** | *** | *** | *** | *** |
| Y | *** | *** | *** | *** | *** | ns | *** | ** | *** |
| N × C | *** | ns | *** | *** | ns | ns | ns | ns | *** |
| Y × N | ns | ns | ns | ns | ns | * | * | * | *** |
| Y × C | *** | *** | *** | *** | *** | ns | ns | ns | *** |
| Y × N × C | * | ns | * | ns | * | ns | ns | ns | *** |
| Treatment | Pn (mmol m−2s−1) | Gs (mol m−2s−1) | Tr (mmol m−2s−1) | ||||
|---|---|---|---|---|---|---|---|
| 2017 | 2018 | 2017 | 2018 | 2017 | 2018 | ||
| N1 | C0 | 23.68 f | 25.25 e | 0.26 g | 0.39 e | 9.81 g | 10.16 f |
| C10 | 25.29 e | 27.31 d | 0.30 f | 0.41 de | 10.80 ef | 11.93 e | |
| C30 | 27.95 abcd | 29.96 c | 0.36 abc | 0.49 c | 11.63 d | 13.75 bc | |
| C50 | 28.67 a | 32.77 b | 0.38 ab | 0.62 a | 12.73 c | 14.27 ab | |
| C70 | 28.29 abc | 35.20 a | 0.39 a | 0.57 ab | 13.71 ab | 14.74 a | |
| C90 | 27.35 bcd | 34.18 ab | 0.35 bcd | 0.51 bc | 13.26 abc | 13.31 c | |
| N2 | C0 | 26.77 d | 25.08 e | 0.32 ef | 0.46 cde | 10.46 fg | 11.57 e |
| C10 | 27.04 cd | 26.05 de | 0.34 cde | 0.47 cd | 11.30 de | 12.58 d | |
| C30 | 27.99 abcd | 27.07 d | 0.38 ab | 0.50 bc | 12.50 c | 13.44 c | |
| C50 | 28.45 ab | 33.61 b | 0.36 abc | 0.61 a | 13.25 abc | 14.27 ab | |
| C70 | 27.87 abcd | 34.29 ab | 0.35 bcd | 0.52 bc | 14.07 a | 14.41 a | |
| C90 | 27.36 bcd | 33.74 ab | 0.33 de | 0.52 bc | 13.15 bc | 14.48 a | |
| Mean | 27.23 | 30.38 | 0.34 | 0.51 | 12.22 | 13.24 | |
| Treatment | Chlorophyll a/mg.g | Chlorophyll b/mg.g | Chlorophyll a + b/mg.g | ||||
|---|---|---|---|---|---|---|---|
| 2017 | 2018 | 2017 | 2018 | 2017 | 2018 | ||
| N1 | C0 | 1.69 cde | 1.82 ab | 0.71 cd | 0.63 abcd | 2.40 bcd | 2.46 ab |
| C10 | 1.82 bcd | 1.86 ab | 0.72 cd | 0.66 abc | 2.55 bc | 2.52 ab | |
| C30 | 1.93 abc | 1.92 a | 0.81 abc | 0.67 ab | 2.73 ab | 2.59 a | |
| C50 | 1.81 bcd | 1.86 ab | 0.73 cd | 0.65 abcd | 2.53 bc | 2.50 ab | |
| C70 | 1.68 cde | 1.76 abc | 0.67 d | 0.58 def | 2.34 cd | 2.34 abc | |
| C90 | 1.50 e | 1.52 d | 0.56 e | 0.52 f | 2.06 d | 2.04 d | |
| N2 | C0 | 1.76 cde | 1.72 abc | 0.71 cd | 0.59 cde | 2.47 bc | 2.32 bc |
| C10 | 2.12 a | 1.75 abc | 0.87 a | 0.61 bcd | 2.98 a | 2.36 abc | |
| C30 | 2.08 ab | 1.89 ab | 0.84 ab | 0.69 a | 2.92 a | 2.58 a | |
| C50 | 1.78 cde | 1.87 ab | 0.75 bcd | 0.64 abcd | 2.53 bc | 2.51 ab | |
| C70 | 1.70 cde | 1.70 bcd | 0.71 cd | 0.60 cde | 2.41 bcd | 2.29 bc | |
| C90 | 1.59 de | 1.59 cd | 0.65 de | 0.54 ef | 2.24 cd | 2.13 cd | |
| Mean | 1.79 | 1.77 | 0.73 | 0.61 | 2.51 | 2.39 | |
Publisher’s Note: MDPI stays neutral with regard to jurisdictional claims in published maps and institutional affiliations. |
© 2021 by the authors. Licensee MDPI, Basel, Switzerland. This article is an open access article distributed under the terms and conditions of the Creative Commons Attribution (CC BY) license (https://creativecommons.org/licenses/by/4.0/).
Share and Cite
Guo, L.; Yu, H.; Kharbach, M.; Wang, J. The Response of Nutrient Uptake, Photosynthesis and Yield of Tomato to Biochar Addition under Reduced Nitrogen Application. Agronomy 2021, 11, 1598. https://doi.org/10.3390/agronomy11081598
Guo L, Yu H, Kharbach M, Wang J. The Response of Nutrient Uptake, Photosynthesis and Yield of Tomato to Biochar Addition under Reduced Nitrogen Application. Agronomy. 2021; 11(8):1598. https://doi.org/10.3390/agronomy11081598
Chicago/Turabian StyleGuo, Lili, Huiwen Yu, Mourad Kharbach, and Jingwei Wang. 2021. "The Response of Nutrient Uptake, Photosynthesis and Yield of Tomato to Biochar Addition under Reduced Nitrogen Application" Agronomy 11, no. 8: 1598. https://doi.org/10.3390/agronomy11081598
APA StyleGuo, L., Yu, H., Kharbach, M., & Wang, J. (2021). The Response of Nutrient Uptake, Photosynthesis and Yield of Tomato to Biochar Addition under Reduced Nitrogen Application. Agronomy, 11(8), 1598. https://doi.org/10.3390/agronomy11081598