Article

Toxic Elements in Soil and Rice in Ecuador

1
iCRETUS, Departamento de Edafoloxía e Química Agrícola, Facultade de Bioloxía, Campus Sur, Universidade de Santiago de Compostela, 15782 Santiago de Compostela, Spain
2
Departamento de Ciencias de la Tierra y la Construcción, Universidad de las Fuerzas Armadas ESPE, Av. General Rumiñahui s/n, P.O. Box 171-5-231B, Sangolquí 171103, Ecuador
3
Departamento de Ciencia de los Alimentos y Biotecnología, Escuela Politécnica Nacional, Quito 170517, Ecuador
4
Faculdade de Ciências e Tecnologia, Campus de Gambelas, Universidade do Algarve, CERIS, 8005-139 Faro, Portugal
*
Author to whom correspondence should be addressed.
Agronomy 2021, 11(8), 1594; https://doi.org/10.3390/agronomy11081594
Submission received: 13 July 2021 / Revised: 6 August 2021 / Accepted: 9 August 2021 / Published: 11 August 2021

Abstract

:
The concentration of trace toxic metals (Cr, Zn, As, Pb, Cd, Cu, and Ni) in soil and rice plants, including the stems, leaves, and grain, from the main rice-producing provinces in Ecuador, was determined. Additionally, the soils were analyzed to determine their properties, composition, total content, bioavailable fraction, and geochemical fractions of toxic elements. Approximately 30% of soil samples in the case of Cr and Cu and 10% of samples in the case of Ni exceeded the legal thresholds for Ecuador. Moreover, for Cr and Cu, approximately 4% and 13% of samples, respectively, exceeded the threshold value of 100 mg kg−1 proposed for these two elements in several international regulations. Concentrations of As, Pb, and Cd in the soils were below the threshold values established both by Ecuadorian laws and by other countries. The concentrations of metals in rice plants did not correlate linearly with the total metal concentrations in the soil, nor with their bioavailability. However, the bioconcentration factors for As, Cd, Cu, Ni, and Zn could be predicted from bioavailability by a power law with exponents ranging from −0.724 to −1.625, which is typical of accumulator plants, where trace metal homeostasis plays an important role.

1. Introduction

Rice (Oryza sativa L.) is a staple in the diet of over 50% of the world’s population [1] and a major source of calories and protein for humans [2]. Latin America is the second most important region after Asia in terms of rice consumption, with an average of 80 g/person/day consumed. Ecuador is one of the countries with the highest rate of rice consumption in South America, with a per capita consumption of 123 g/day [3].
On the other hand, the quality of agricultural land has experienced a marked decline in past decades, leading to decreased crop productivity and food quality [4]. The indiscriminate application of pesticides and fertilizers containing trace elements such as Cd, Pb, Cu, and Hg, along with the use of low-quality irrigation water, results in a generalized decline in the quality of agricultural systems [5,6,7].
One of the main problems associated with such a decline is the enrichment of toxic elements, which generally leads to their increased bioavailability and incorporation into foodstuffs. Toxic metals are absorbed by plants through the root cortical tissues due to their similarity with some essential micronutrients, such as zinc [8]. Specifically, for arsenic, there are two major mechanisms for As absorption through the rice plant roots. The first pathway is through a phosphate transporter, since arsenates are analogous to phosphates, and the second one is through aquaporin channels, which incorporate arsenites (analogous to silicic acid) and undissociated methylated arsenic species (dimethylarsinic acid [DMA] and monomethylarsonic acid [MMA]) [9]. These metals can accumulate in edible portions of the plants [8] and enter the food chain, subsequently accumulating in different tissues such as liver, muscle, and bone, therefore posing a mid- to long-term threat to human health [10].
Metal(oids) are among the pollutants currently categorized as the highest-risk pollutants present in foodstuffs [10]. Studies evidence excessive amounts of metal(oids) such as Cd, Pb, Cr and As in agricultural soils in the USA, China, and Spain [11,12,13]. In some cases, this pollution has negatively impacted the population’s health and quality of life. In Japan, for instance, cadmium pollution in rice paddies led to dozens of deaths due to a degenerative bone disease known as itai-itai [14]. Likewise, in Bangladesh, a country affected by a high intake of As through drinking water and rice, an estimated 33 to 75 people are at risk of arsenic poisoning [15].
In Ecuador, several locations with abnormally high concentrations of As have been identified [16,17]) in association with intense hydrothermal activity in volcanic regions [16,18,19] and, occasionally, in areas with mining activity [20]. However, the available information about the content of As and toxic metals in rice crop areas in Ecuador is scarce. With the available data, Nunes and Otero [21] have concluded that rice constitutes a more important source of arsenic than tap water and that the estimated daily intake (EDI) of arsenic for infants living in urban areas of Ecuador is around four times that of European infants. Pozo et al. [22] studied the total content of toxic metals (Cu, Zn, Pb, and Hg) in the soils and Pb in the rice shoots from rice paddies within the Guayas river basin and obtained mean concentrations of 48.8 mg kg−1 for Cu; 33.9 mg kg−1 for Zn; 0.15 mg kg−1 for Cd; and 4.35 mg kg−1 for Pb, while Hg concentrations were below the detection limit. Lead concentrations ranged between 3.30 and 4.40 mg kg−1 in roots, 2.01–2.60 mg kg−1 in stems, and 1.80–2.00 mg kg−1 in the leaves of rice plants.
This paper studies the content of As and toxic metals in the three main rice-producing provinces in Ecuador (Guayas, Los Ríos, and El Oro) located in the coastal area, as well as in the Orellana province, located in the Eastern part of the country. The objectives of this study were: (1) to determine total concentrations of the main toxic elements (Cr, Zn, Cd, Cu, Pb, As, and Zn), their geochemical forms, and their bioavailable fraction in soils of the main rice-producing areas in Ecuador; (2) to determine the contents of these elements in rice plants, including grain, leaves, and stems, and their bioaccumulation factor.

2. Materials and Methods

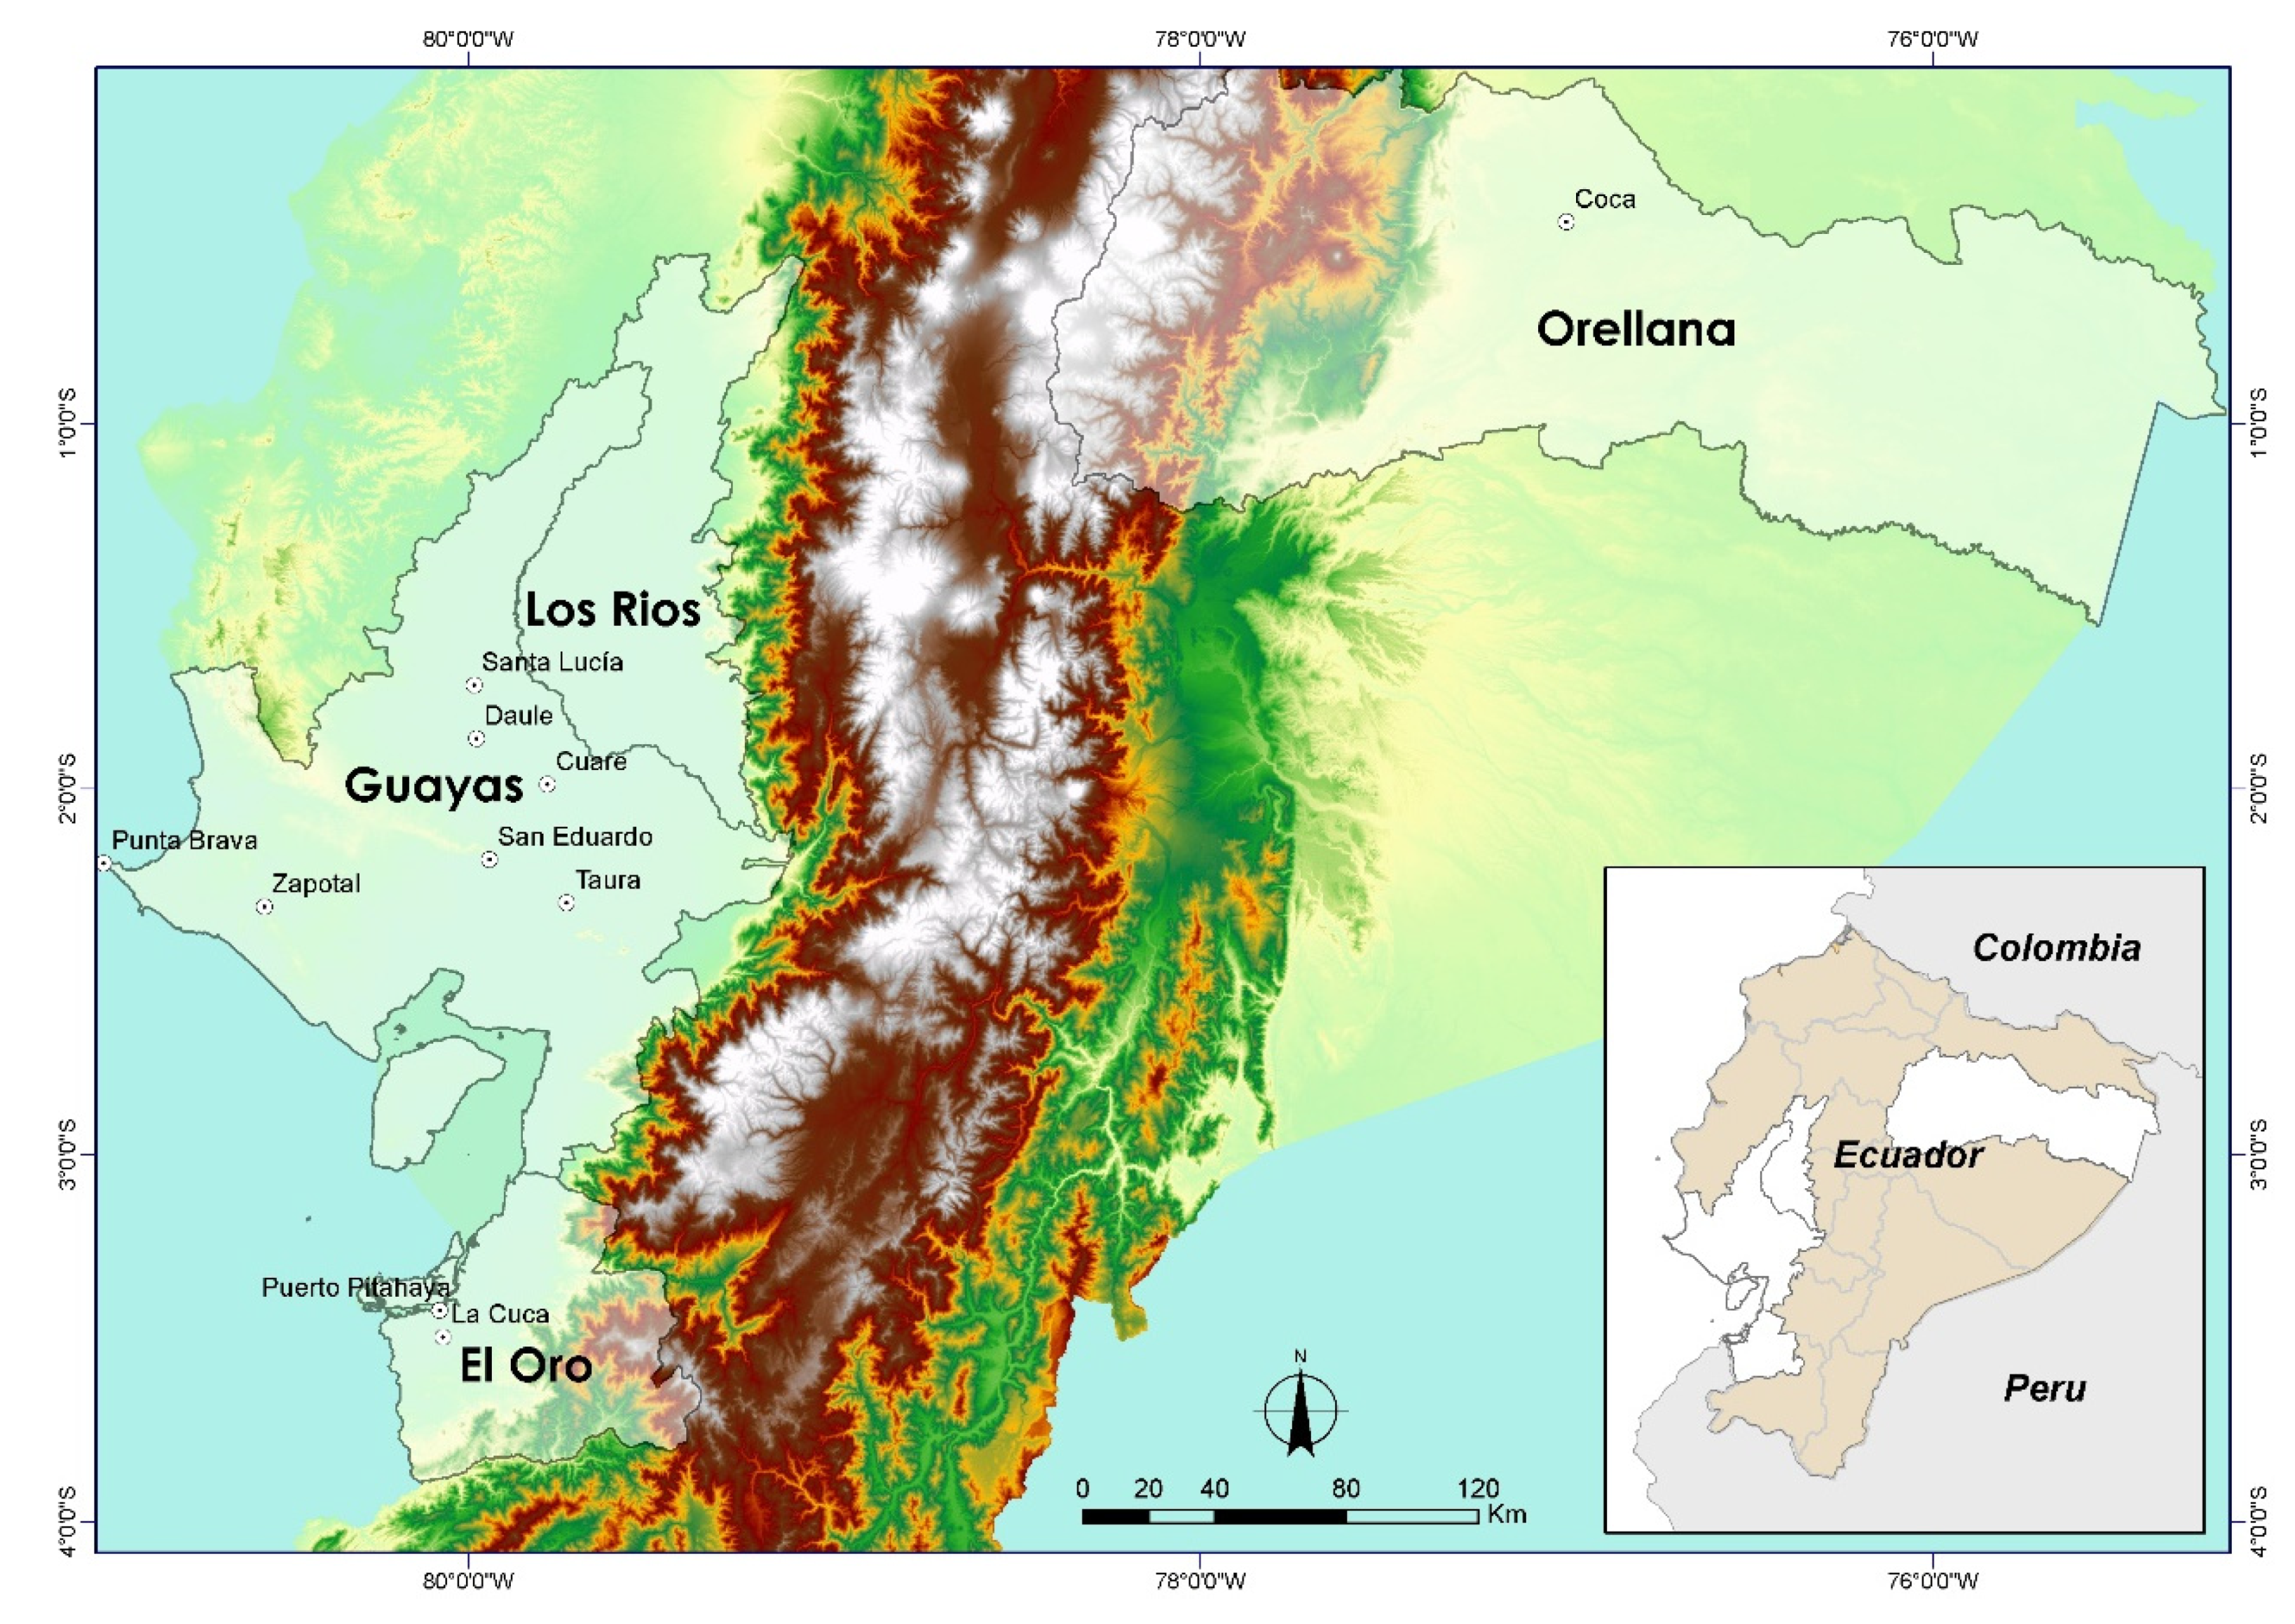
2.1. Sampling and Sample Preparation

Sampling was conducted in the main rice-producing provinces of Guayas, Los Ríos, El Oro, and Orellana (Figure 1).
A total of 102 soil samples (0–20 cm) were collected, along with rice plant samples (31 grain, leaf, and stem samples). The soil and plant samples were pooled by mixing five subsamples from each crop area. For soil samples, approximately 500 g from each subsample were mixed and homogenized in a plastic container, and approximately 200 g were taken from the mix. For plant samples, approximately 100 g were taken from each subsample and mixed in a plastic bag. Once in the laboratory, soil samples were dried and sieved through a 2 mm mesh for subsequent analysis. Plant samples were rinsed with distilled water 3 to 5 times. Dehusked rice grains (field rice grain) and the remaining parts of the plant were stored in plastic bags until analysis.

2.2. Physicochemical Characteristics and Soil Texture

The pH and redox potential (Eh) were determined in situ using portable electrodes (HANNA instruments INC, Woonsocket, RI, USA.). The Eh values were corrected by adding the potential of the reference electrode (+244 mV). Soil texture was estimated using the pipette method [23]. Total organic carbon (TOC) in the soil samples was determined using a Leco100 S-C 144DR analyzer (LECO Corporation, St. Joseph, MI, USA).

2.3. Total Metal(oids) Content in Soils

The total concentrations of As and metal(oids) were determined using 0.5 g of the sample subjected to acid digestion (9 mL HNO3 14.4 M: 3 mL 12 M HCl, Merck, Darmstadt, Germany) in a microwave digestion system for 25 min. The concentrations of As and metal(oids) were determined by ICP-MS (Agilent Technologies, Palo Alto, CA, USA). The method used to extract metal(oids) from the soil was validated using standards (SRM 2709a, SMR2710a, and SRM2711a by NIST, Gaithersburg, MD, USA), with a mean percentage of recovery > 90%.

2.4. Metal Bioavailability in Soils

The concentration of the bioavailable fraction was determined by the Mehlich 3 method (1984): 2 g of the soil sample previously sieved through a mesh size < 2 mm were added to 20 mL of extracting solution (0.015N NH4F, 0.001N EDTA, 0.25N NH4NO3, 0.2N HOAc, and 0.013N HNO3); the mixture was shaken for 5 min at 200 rpm and subsequently filtered through a Whatman filter No. 42. The concentrations of As and metals were determined by ICP-MS (Agilent Technologies, Palo Alto, CA, USA).
The bioavailability ratio was calculated by the division of the bioavailable concentration by the total concentration in the soil.

2.5. Sequential Extraction of Metal(oids)

Fractioning was performed on 2 g of the soil sample using the method described elsewhere [23], by which the following fractions were separated:
F1: exchangeable and soluble fraction, extracted using 30 mL of a 1M MgCl2 solution, adjusting pH to 7, and shaking for 30 min. It was then centrifuged at 10,000 rpm and at 4 °C; the supernatant was filtered through a 0.45 µm filter, and the residue was rinsed twice with ultrapure (MillQ) water before proceeding to the next extraction step. The centrifugation and filtration process was common to all the subsequent extractions.
F2: carbonate-associated fraction, extracted using 30 mL of a 1M NaOAc/HOAc solution at pH 5 adjusted with acetic acid, and shaken for five hours.
F3: fraction associated with amorphous or very low-crystallinity (ferrihydrite-type) Fe oxyhydroxides, extracted using 30 mL of a 0.04 M hydroxylamine + 25% (v/v) acetic acid solution at 30 °C and shaken for six hours.
F4: fraction associated with low-crystallinity Fe oxyhydroxides (lepidochrocite-type), extracted using 30 mL of a 0.04 M hydroxylamine + 25% (v/v) acetic acid solution heated to 96 °C for six hours.
F5: fraction associated with crystalline forms of iron oxyhydroxides (goethite-type), extracted by adding 20 mL of 0.25 M sodium citrate + 0.11 M sodium bicarbonate and 3 g of sodium dithionite solution to each sample, which was kept at 75 °C for 30 min.
F6: fraction associated with the pyritic fraction, extracted using 10 mL of concentrated nitric acid and shaking for two hours. Pretreatment was previously performed to remove metals and Fe associated with silicates. Pretreatment consisted of an attack with 30 mL of 10M HF for 16 h with continuous shaking at 200 rpm, followed by the addition of 5 g of boric acid to neutralize the remaining HF, shaking for 8 h, and then centrifuging at 10,000 rpm at 4 °C. The supernatant was discarded. The residue was then subjected to attack with 15 mL of concentrated H2SO4 for 2 h with continuous shaking. The supernatant was discarded, and the residue was rinsed twice with deoxygenated ultrapure water (miliQ).

2.6. Total Metal Content in Rice Plants and Grain

Prior to extraction, samples were first rinsed with high-pressure water and then rinsed three to five times with distilled water. Samples were then dried at 65 °C for 48 h, ground, and stored in a polyethylene bag at room temperature until analysis.
The content was determined using 0.5–1.0 gr of plant samples, which were digested by adding a mix of HNO3 and H2O2 Suprapur (Merck), according to Meharg and Rahman [24]: 5 mL 65% HNO3, 1mL 33% H2O2, and 5 mL Milli-Q water (w/v) and leaving them to rest overnight. Tubes were then placed in a heating plate (Perkin Elmer SPB 48–50) at 95 °C for 3 h. The extract was filtered by 0.45 μm. The total metal content was determined by ICP-MS (Agilent Technologies, Palo Alto, CA, USA).
In parallel, concentrations in the certified reference material were determined with a percentage of recovery of 91 ± 6% (n = 3) for As, Cu, Hg, Mo, Zn, Hg, and Se.
The bioconcentration factor (BCF) was calculated by the division of the measured concentrations in the plant (independently for grain, leaf, and stem), in mg/kg, by the bioavailable concentration (Mehlich), or by the total metal concentration, in mg/kg.

2.7. Statistical Analysis

Statistical and graphic analyses were performed using the statistical software R. Analysis of variance analysis (ANOVA) and the Tukey test were performed to identify significant differences between means in the different individual provinces, and between the Orellana province and the coastal provinces (remaining), at a significance level of 0.05. The Levene test was used to test homoscedasticity. The Pearson’s correlation coefficient was used to quantify the linear relationship between soil parameters and between bioconcentration factors.

3. Results and Discussion

3.1. Soil Composition and Properties

Soils from rice paddies in the coastal provinces had a clayey texture, with a mean value of 49 ± 16% clay, followed by the silt (24 ± 13%) and sand fractions (28 ± 20%). Conversely, the predominant texture in the Orellana province was sandy loam, with a predominant sandy fraction (67 ± 18%), followed by silt (17 ± 8%) and clay (17 ± 14%). The TOC content was lower in the coastal provinces (1.9 ± 0.6%) than in the Orellana province (4.4 ± 1.4%) (Table 1). The mean pH was 6.3 ± 0.6 (Table 1), ranging from 3.6 to 7.4. Nevertheless, extremely acidic values appeared only occasionally in samples from the coastal provinces (pH = 3.6). The Eh ranged between 92 and 485 mV, with most samples showing suboxic conditions (200–350 mV) and only a few samples showing anoxic conditions (Eh < 100 mV). The total content of Fe was 4.2 ± 1% in the coastal provinces, while values were lower (2.7 ± 0.7%) in the Orellana province. Fe was mainly found as Fe-goethite (F5 fraction = 46%) and Fe-lepidochrocite (fraction F4 = 41%) (Figure 2A).

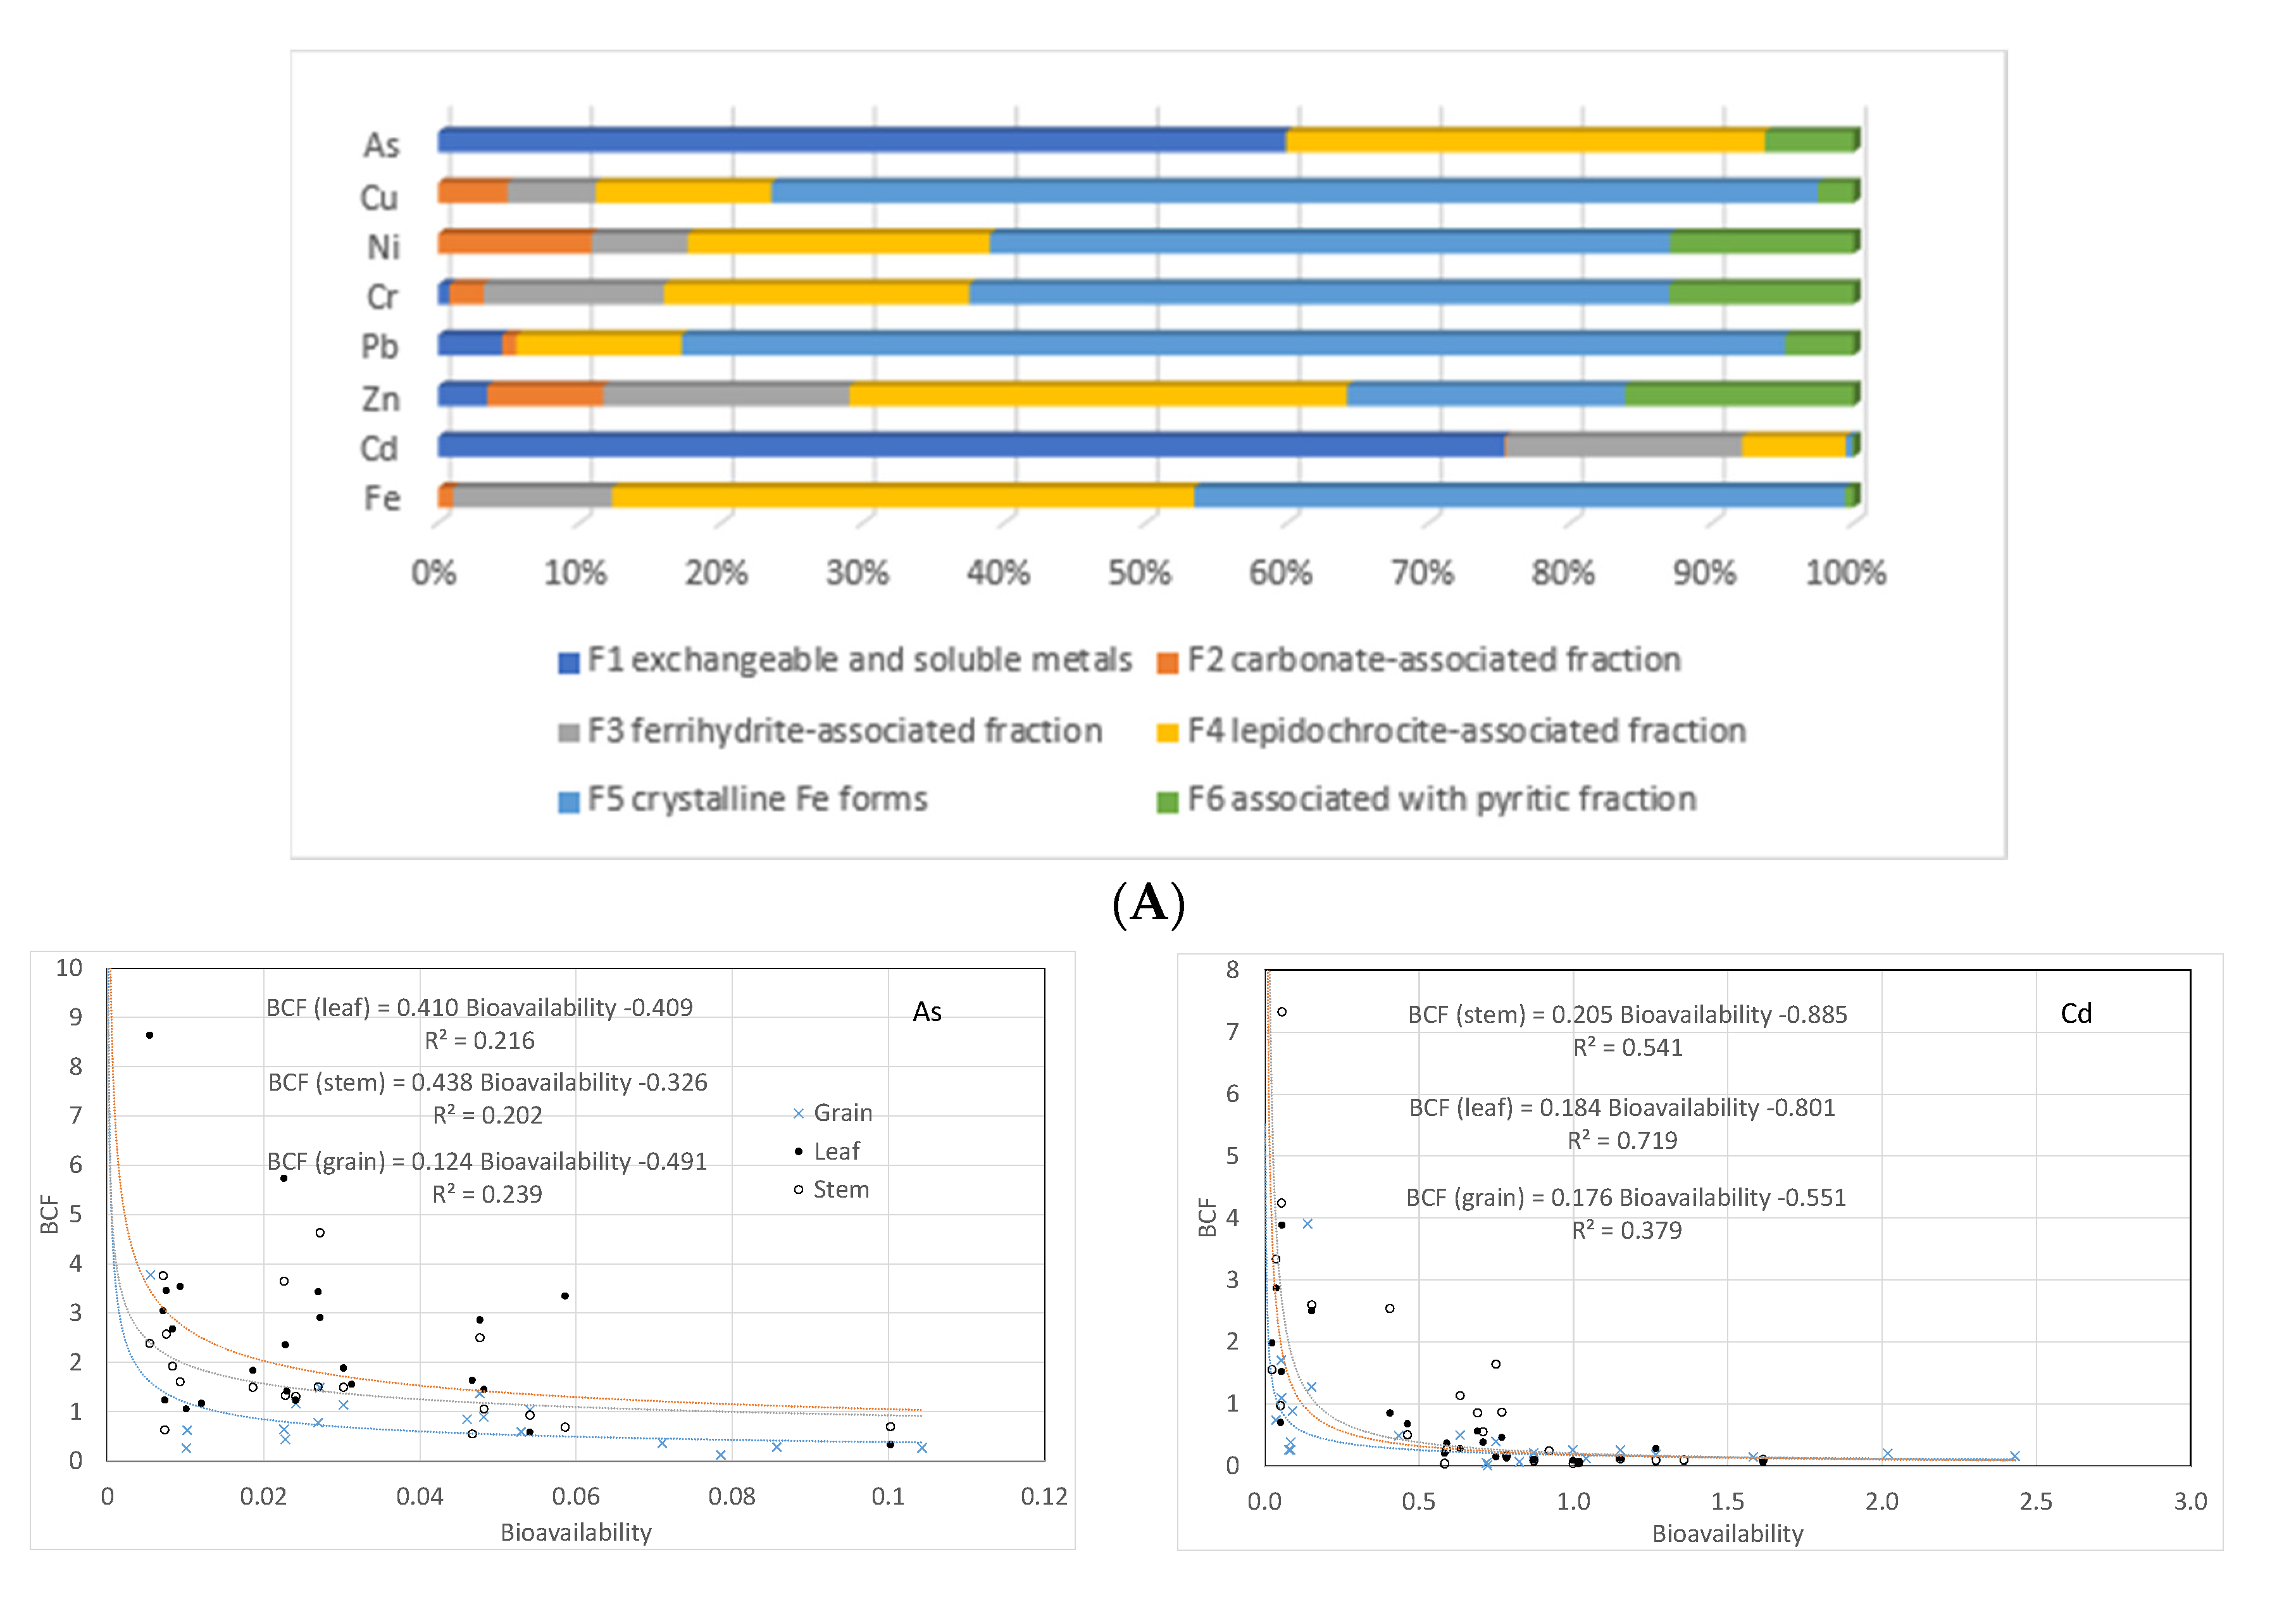
3.2. Total and Partitioning of Toxic Elements

The total concentrations of metals were: Zn (88.3 ± 26.0 mg kg−1) > Cr (53.0 ± 23.5 mg kg−1) > Cu (57.2 ± 30.1 mg kg−1) > Ni (29.5 ± 14.30 mg kg−1) > Pb (12.4 ± 8.2 mg kg−1) > As (4.56 ± 3.25 mg kg−1) > Cd (0.27 ± 0.14 mg kg−1) (Table 2). By area, metal concentrations in soils from the coastal provinces were significantly higher than in those from the Orellana province (p < 0.05), except for Cd, which did not show significant differences. The found differences allow the study of metal uptake by plants under varying concentrations in the soil.
Cd and As were mainly associated with the exchangeable and soluble fraction (F1: 75% and 60%; Figure 2A), while metals such as Pb (78%), Cr (49%), Ni (48%), and Cu (74%) were associated with crystalline forms of iron oxyhydroxides (F5) (Figure 2). Cadmium is the element with the highest bioavailable fraction, reaching values up to 59% of the total Cd concentration (Table 2), unlike the rest of the metals, which showed low percentages of bioavailability, between 0.2% and 17%. In general, concentrations of most of the studied metal(oids) in soils were below the thresholds set up by Ecuadorian laws [25], except for a few samples from agricultural areas in the Los Ríos and Guayas provinces, where Cr, Cu, and Ni showed abnormally high values, as did As in the El Oro province (Table 2).
However, threshold values vary widely among countries and, therefore, the concentrations obtained in soils generally remained below these values, with few exceptions. Approximately 30% of samples in the case of Cr and Cu and 10% of samples in the case of Ni exceeded the legal thresholds for Ecuador (65 mg kg−1, 63 mg kg−1, and 50 mg kg−1, respectively). Moreover, for Cr and Cu, approximately 4% and 13% of samples, respectively, exceeded the threshold value of 100 mg kg−1 proposed for these two elements in several regulations [26,27]. For the total As content, virtually all samples were below the legal threshold for Ecuador (12 mg kg−1). Concentrations of Pb and Cd in the soils were below the threshold values established both by Ecuadorian laws and by other countries.
The highly significant correlations found between the contents of toxic elements and the total Fe content—but not with Fe oxides—Table S2, as well as the correlations among toxic elements, seem to suggest that their origin is associated with the geological substrate, thus ruling out the possibility of an anthropic source. This idea is also supported by the low concentrations found for most of them.
These results also show the fundamental role played by Fe content in the mobility and bioavailability of toxic elements in soils [28,29,30], preventing their uptake by and translocation to the plants, as has been observed in previous studies on metals such as cadmium [31].
Bioavailability and toxicity not only depend on the total concentrations of metals but also on the distribution of each element among chemical fractions [27,32]. As previously mentioned, the total concentrations of elements such as Cr, Cu, and Ni exceeded the established threshold values for agricultural soils in some samples. However, the concentrations of these elements in the most labile fractions, particularly F1 and F2 [13,32] were extremely low, representing less than 5% of the total content, except for Cd and As, the two elements that usually accumulate in rice grain and are potentially harmful to human health [33,34,35]. The percentages of Cd and As in fraction F1 were 75% for Cd and 60% for As; however, concentrations of these two elements in soils were very low and, therefore, they do not seem to pose a threat to human health. This hypothesis is supported by the low Cd and As concentrations present in field rice grain, whose values were below the allowable limits.
On the other hand, toxic elements such as Cr, Zn, Pb, Cu, and Ni were mainly associated with fractions F4 and F5, which, together with fraction F3, are considered potentially available fractions [13]. Nevertheless, the Eh–pH conditions in the majority of rice paddy soils from Ecuador guarantee the stability of crystalline forms of Fe oxyhydroxides (goethite) [29]. Moreover, this idea is consistent with the presence of Fe-goethite in strongly reduced environments, even methanogenic ones such as some organic marine sediments [23,36]. Therefore, the metallic fraction adsorbed to crystalline Fe oxyhydroxides can be considered non-assimilable by rice plants.
As for fraction F6 (pyritic fraction), the environmental conditions in rice fields make metallic sulfides unlikely to form, mainly due to the low concentration of sulfide ions in flooding water [29]. Thus, the metallic concentration associated with this fraction should be considered as part of the metal associated either with refractory organic matter that has not been removed by the previous treatment with H2SO4 or with other recalcitrant minerals present in the soils.

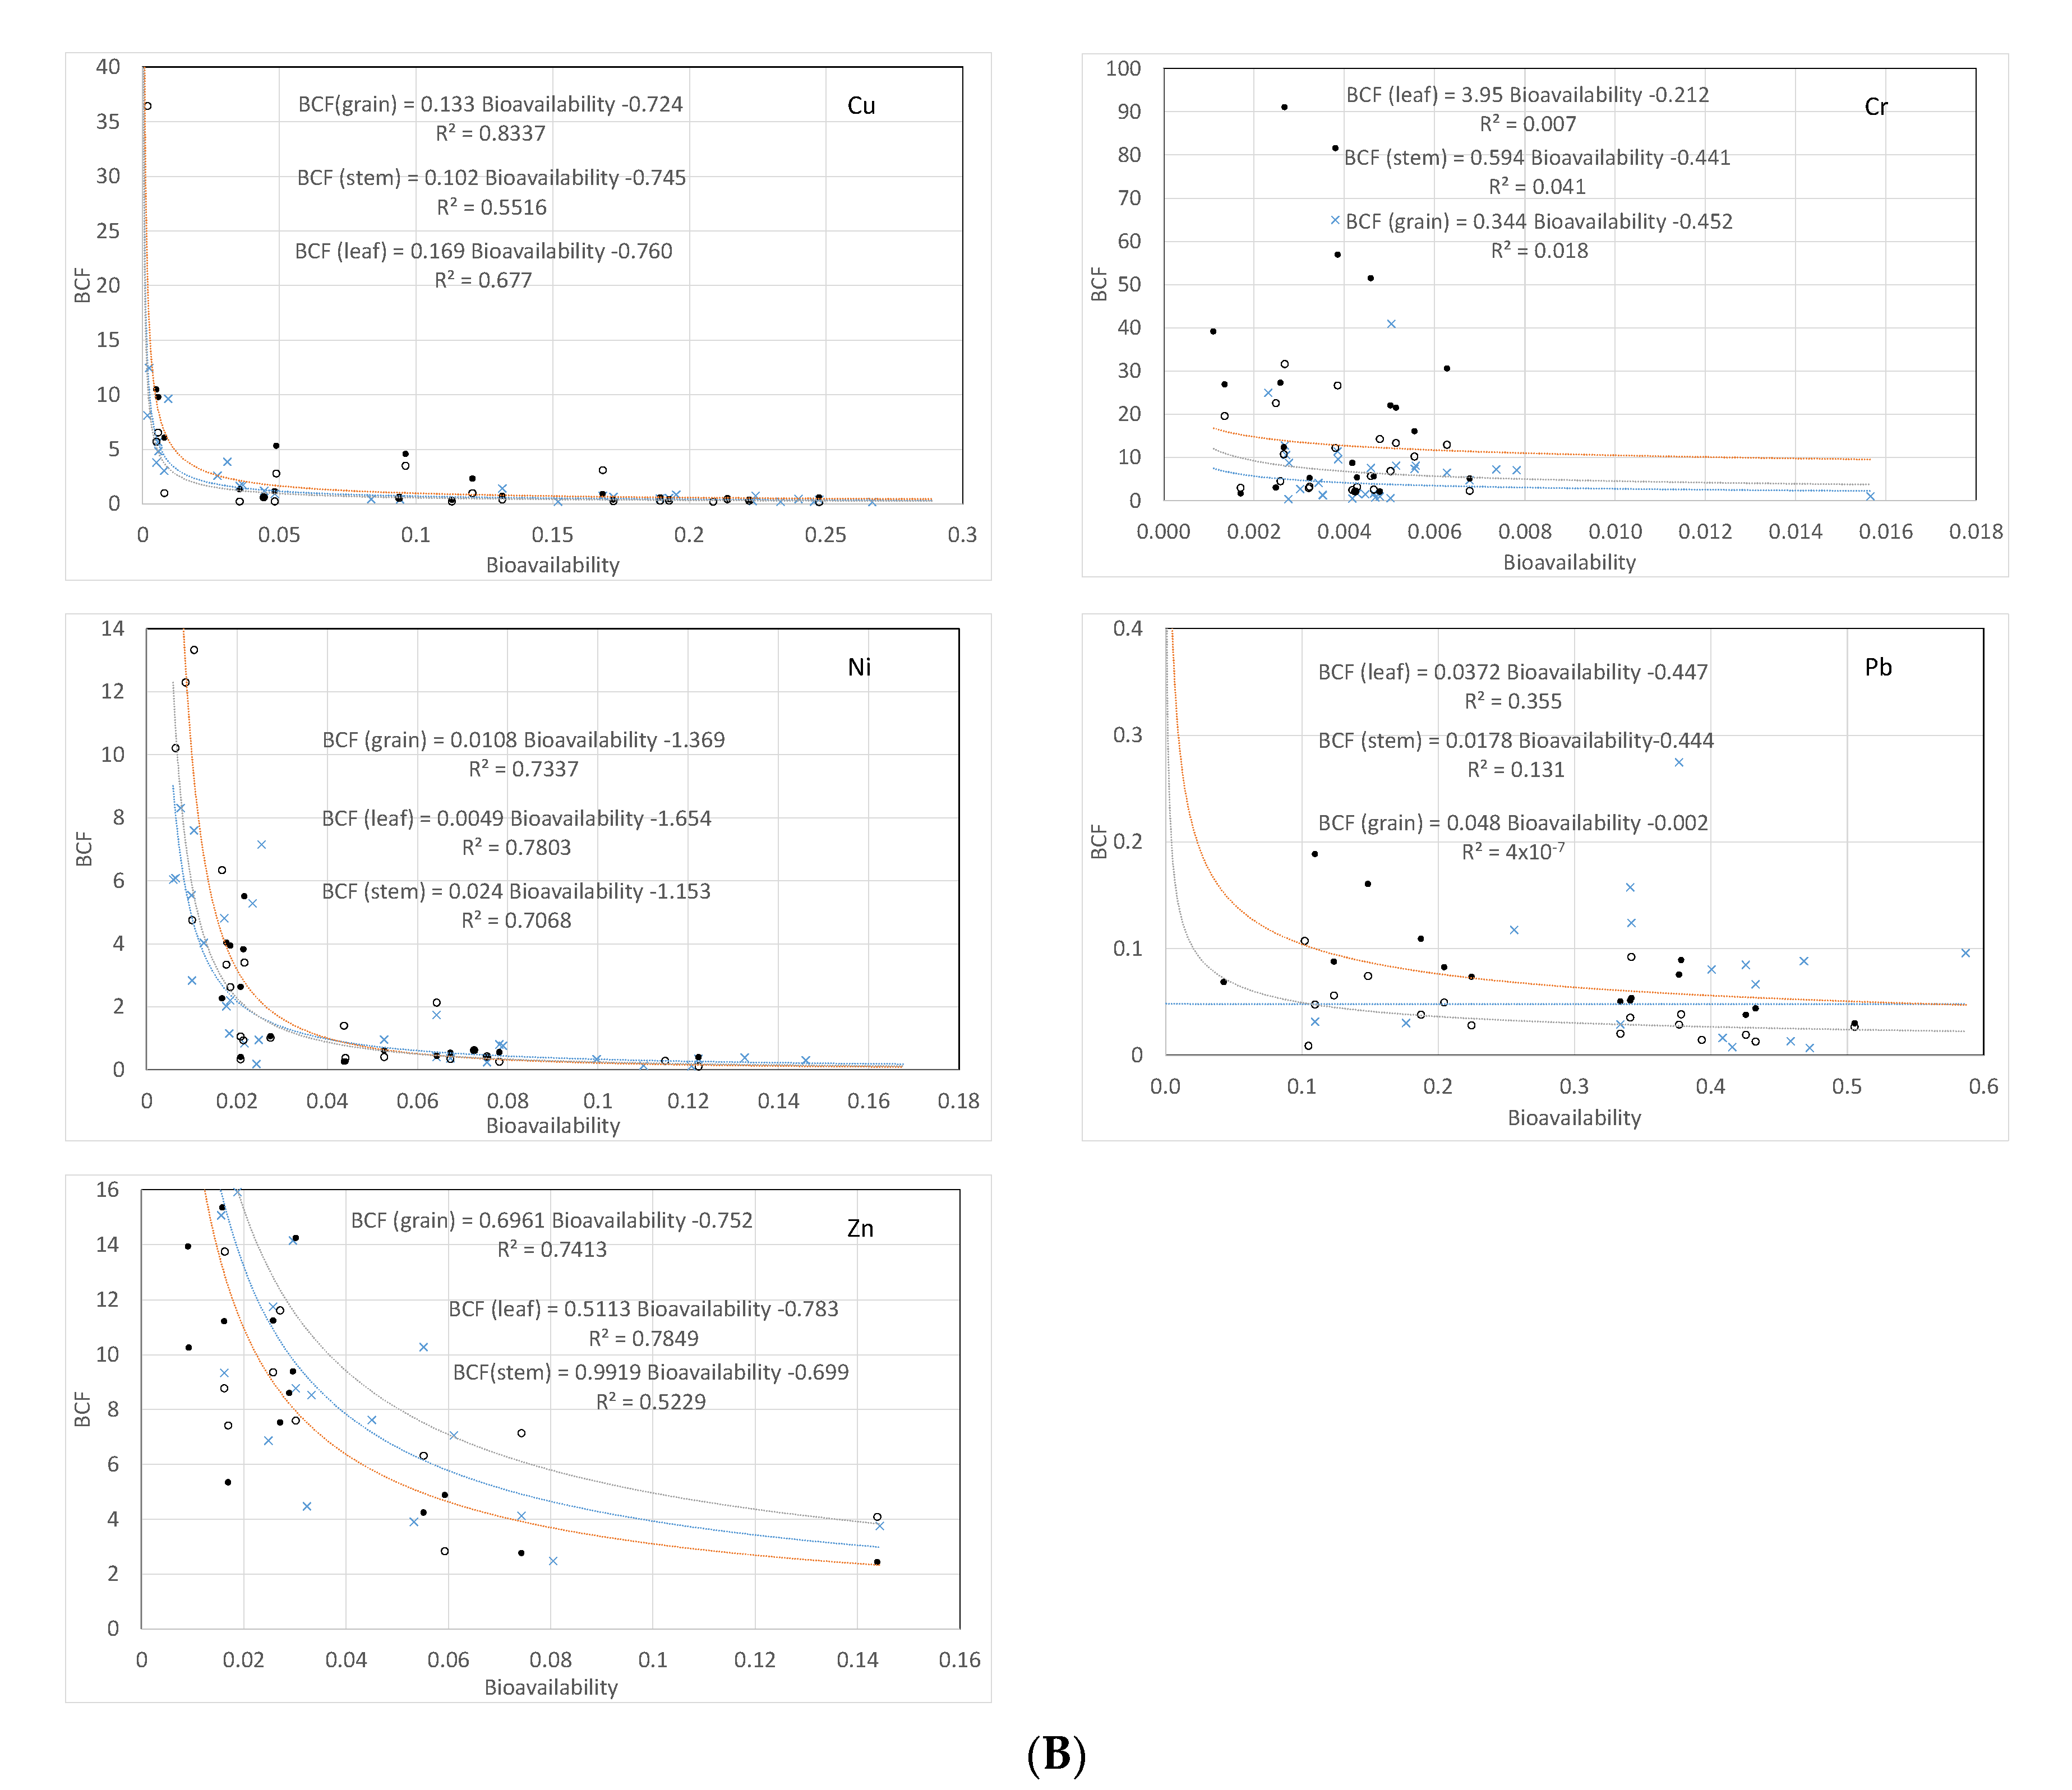
3.3. Toxic Elements Uptake by Rice Plants

The mean concentrations of metals in field rice grain samples from Ecuador did not exceed the legal threshold values [37], except in the case of Cr, whose mean values in field rice exceeded the 1 mg kg−1 threshold, probably due to the high concentrations determined in soils. However, the dominant species in reducing conditions (i.e., flooding conditions) is Cr(III), which is less mobile and less toxic than Cr(VI) [38]. Moreover, few samples showed values of Pb, Cd, or As above the legal threshold for these elements, established at 0.2 mg kg−1 (Table S3). The concentrations of the metals in rice plants were not statistically different in the plant parts (ANOVA test, Tukey post-hoc, p > 0.05) (Table 3), showing an equal translocation coefficient to the upper parts of the plant (though for the grain, our values are only representative of the endosperm). No clear distinction between provinces was found for rice ionome (Table S1). Our results show the presence of abnormally high values of metal(oids) in rice in very specific areas of each province, but high toxic metal contents cannot be associated with a specific province (see also Otero et al. [27]).
Chaney [39] introduced a general division of the metals into four groups according to their uptake by plants and potential exposure to humans, which we use to support the discussion. The division assumes that, in highly acidic soils, where possible phytotoxicity from Cu, Zn, and Ni is high, plant uptake of Zn, Cd, Ni, Mn, and Co increases; the absorption of Mo and Se is strongest in alkaline soils; and plants do not uptake Pb and Cr to any substantial degree at any pH level. The groups are then: Group I, including Ag, Cr, Sn, Ni, Y, and Zr, are not taken up to any extent by plants—due to their low solubility in soil and, consequently, negligible uptake and translocation by plants; Group II, including As, Hg, and Pb, are absorbed by plant roots, but are not readily translocated to edible tissues, they are strongly adsorbed by soil colloids, being less bioavailable; Group III, including B, Cu, Mn, Mo, Ni, and Zn, are readily taken up by plants, they are phytotoxic at concentrations that pose little risk to human health; Group IV, including Cd, Co, Mo, and Se, are absorbed by plant roots, and can bioaccumulate up to plant tissue concentrations that are not generally phytotoxic.
Under the reduced conditions found in paddy soils, the soil microbes can reduce arsenate to more soluble and bioavailable arsenite increasing metal and As bioavailability [40]. In addition, pH also plays a fundamental role in modulating metal uptake by rice, through the pH-dependent expression of the metal transporter genes, being the range of pH found in this study (6.0 to 7.0), coincident with that where uptake by rice plants is expected to be highest [41]. This may justify why the concentrations of metals in rice plants were not linearly correlated with the total metal concentrations in the soil, nor with their bioavailability (see details in Supplementary Material). However, the bioconcentration factors for the metals in groups III and IV may be predicted from bioavailability by a power function with exponents ranging from −0.724 to −1.625 (r2 > 0.5, p < 0.05) (Figure 2B). For arsenic, the power relationship was statistically weaker (r2 ≈ 0.2, p < 0.05), with exponents of the function close to −0.400. No relationship was found for Pb and Cr. These results agree well with the expected differential uptake of metals by rice plants, as discussed above. Power relationships between BCF and bioavailability are known for a long time for “accumulator” type plants [42], including for rice [43]. The detected non-linear relationship is hence the result of the combined effect of a non-proportional increase in bioavailability with an increasing total concentration in the soil solution and of the selective uptake by the plant. Transporter proteins in the plasma membrane of plant root cells and the tonoplasm are recognized to help sustain physicochemical concentrations and stress responses to trace metals, significantly contributing to the plant’s trace metal homeostasis [44,45].
Of the studied metals, only Cr and Pb showed proportionality between bioavailability and total concentrations in the soil, though with very low proportionality constants (0.06, R = 0.47, and 0.003, R = 0.94, for Pb and Cr, respectively; p < 0.05). In this case, plant uptake showed little relation with metal availability, as would be expected. For the remaining metals, the non-linear relationship between bioconcentration and bioavailability is probably due to processes taking place at the plant and soil–plant interface, resulting in non-proportional uptake, as expected for “accumulator” plants. One of such processes is the presence of an iron plaque on the root surfaces due to the oxic conditions in the rhizosphere [46], which favor the accumulation of Fe oxyhydroxides in the rhizosphere. Several metal(loid)s have been found to be associated with iron plaque deposits, namely Cu and Ni [47], Zn [48], and As [49]; while for Pb and Cd the iron plaque does not seem to be a barrier to uptake and translocation [50,51]. The possible relationship between iron plaque and Cr uptake and distribution in rice is still unclear [52].
The mean total content of arsenic (As) in soils was 4.6 ± 3.2 mg kg−1 (range: 0.61–17.1 mg kg−1). The total concentration of arsenic was highest in soils from the Los Ríos province (6.8 ± 4.8 mg kg−1), followed by Guayas (4.5 ± 2.4 mg kg−1) and El Oro (3.3 ± 1.1 mg kg−1). The lowest concentration corresponded to soils from the Orellana province (1.07 ± 0.44 mg kg−1) (Table 2). The bioavailable concentration reached values of 0.131 ± 0.095 mg kg−1 (3% of As) in the coastal provinces, while in Orellana, it represented 1% of As (0.012 ± 0.003 mg kg−1) (Table 2). As for sequential extraction, fraction 1 showed the highest values in the Orellana province (0.314 ± 0.088 mg kg−1; 85%), while fraction F4 represented 100% (0.463 mg kg−1) in the coastal provinces (Figure 2). The high values of As in fraction F1, which corresponds to the most mobile and labile fraction, contrasts with the low concentration obtained for the bioavailable fraction. There is no clear explanation for this apparent contradiction beyond the fact that the sequential extraction method has been designed to extract metallic cations rather than oxyanions. In any case, the bioavailable fraction showed a very high correlation with bioavailable phosphorous (R = 0.93, p < 0.05), which may be due to the fact that phosphate ions are analogue to As (V), hence desorbing it from clay particles [53]. Because of their chemical similarity, As(V) competes with phosphate for root uptake, and plants uptake and mobilize As(V) through the phosphate transport channels [54]. The As concentrations were 0.12 ± 0.06 mg kg−1 in rice plants (Table 3). Arsenic concentration in the grain correlated negatively with Fe but did not correlate with Mn (R = −0.62 and 0.02, p < 0.05, respectively), indicating that the iron hydr(oxides) seemed to dominate as an As uptake limiting factor in rice roots, due to sorbing and co-precipitating arsenic ions, namely at the plaque. Manganese oxide is a powerful oxidant that can rapidly convert As(III) to As(V) over the pH range found in paddy soils. Under aerobic conditions, the latter adsorbs strongly on most soil minerals, including Fe (hydr)oxides. The observed lack of correlation may, in this case, be due to the found negative relationship between bioavailable iron and manganese (R = −0.44, p < 0.05). In any case, the hydrogeochemical settings at the studied rice paddies are such that arsenic bioavailability is low, resulting in equally low concentrations in rice plants, including in the grain (Table 3).
The BCF for arsenic in the rice plant was equal to 0.04 ± 0.05 (there is hyperaccumulation if BCF > 1), ranging between <0.01 and 0.02. This range is similar to those found by other authors for a wide range of geographic locations and rice varieties [55,56] (Table 4), indicating that the geochemical conditions in paddy soils and rice varieties in Ecuador have a variability similar to that of global agroenvironments. If the BCF is calculated using the bioavailable fraction (Melich) instead of total As, rice becomes a hyperaccumulator with ratios similar to those reported elsewhere when concentrations in the soil are low (0.49 < BCF < 4.53) [55,56] This observation is compatible with the power relationship described above between uptake and bioavailable metal in the soil solution, where the latter is much higher at lower bioavailability ratios.
The mean total concentration of Pb in Ecuadorian soils was 12.4 ± 8.2 mg kg−1 (range: 2.4–34.0 mg kg−1) (Table 2). By province, the highest lead concentrations were in the Los Ríos province (17.8 ± 9.3 mg kg−1), while the lowest were found in the Orellana province (4.3 ± 2.0 mg kg−1), with significant differences among Pb total concentrations of the different provinces.
The bioavailable fraction accounted for up to 13% of the total concentration (1.66 ± 1.23 mg kg−1) (Table 2), and sequential extraction in the most labile fractions (F1 and F2) reached 2% for coastal provinces (F1: 0.013 ± 0.043, 1%; F2: 0.013 ± 0.043, 1%) and 29% for the Orellana province (F1: 0.0168 ± 0.031, 29%; F2: <D.L.) The highest percentage was determined in the fraction associated with crystalline forms of iron oxyhydroxides (F5), with values of 0.847 ± 0.069 mg kg−1 (80%) for the coastal provinces and 0.369 ± 0.068 mg kg−1 (64%) for the Orellana province (Figure 2).
The Pb concentration in rice grain was 0.085 ± 0.153 mg kg−1, while Pb concentrations did not significantly differ among provinces (F(2, 33) = 1.3, p = 0.28) (Table S3).
In rice plants, most of the absorbed Pb remains in the roots, which makes this organ the first barrier for the Pb translocation to the above-ground plant parts [63]. In a lab experiment with spiked soil to 800 mg Pb/kg soil (dw), Liu et al. [64] found average Pb concentration ratios of roots to stems to leaves of 60:5:1 at heading and 19.4:2.9:1 at ripening for several rice varieties. As indicated above, in our case, no significant differences were found for Pb concentrations between the stem, leaf, and grain, which may be due to more effective retention of Pb at the root when the concentration in the soil is low. The BCF for Pb was 0.02 ± 0.02 (range: < 0.01–0.10) in agreement with low uptake of Pb by rice plants and high environmental variability. Again, the BCF values are within the range found elsewhere (Table 4).
The mean total concentration of chrome was 53.0 ± 23.5 mg kg−1, ranging from 10.4 to 120.8 mg kg−1 (Table 2). Cr concentrations differed significantly among the different Ecuadorian provinces (F(2,88) = 19.5, p < 0.05), being highest in the Guayas province (59.7 ± 14.3 mg kg−1) and lowest in the Orellana province (14.5 ± 4.4 mg kg−1) (Figure 2). The bioavailable Cr fraction was 0.24 ± 0.14 mg kg−1, corresponding to 0.5% of the total content. The low concentrations of bioavailable Cr were consistent with those obtained for the geochemically more mobile fractions (F1 and F2) (Figure 2).
The majority of Cr (Coast: 1.003 ± 1.209 mg kg−1, 50%; Orellana: 2.100 ± 0.300 mg kg−1, 48%) was found in association with crystalline Fe oxyhydroxides (Fraction F5) and with low-crystallinity Fe oxyhydroxides (coast: 0.516 ± 0.794 mg kg−1, 26%; Orellana: 0.600 ± 0.450 mg kg−1, 14%) (Fraction F4) (Figure 2).
Cr concentrations in field rice grain (1.31 ± 1.59 mg kg−1) (Table 3) were similar between provinces (F(1,28) = 0.6, p = 0.45) (Table S3). Abnormally high values were found for Cr (range: 0.10–7.89 mg kg−1), with mean Cr values exceeding the threshold value, established at 1 mg kg−1 [37].
The uptake and translocation of Cr is modulated by the soil pH, organic matter content, and chelating agents, among others [54]. In plant systems, Cr(III) uptake occurs through passive mechanisms, and Cr(VI) through active processes, typically through phosphate or sulfate transporters due to Cr(V) structural similarity to phosphate and sulfate [65]. The translocation of Cr from soil to plant and between plant organs is low when compared with the other metals [66,67]. The BCF calculated for Cr was low (0.05 ± 0.07; min < 0.01; max = 0.31) (Table 4); however, if computed from the bioavailable fraction, the BCF becomes very high (4.52 ± 4.93, min = 0.46; max = 22.0). The reason for this may be that the mobile Cr(VI) competes with the uptake of some essential nutrients such as K, Fe, Mn, Mg, Ca, and P due to their ionic resemblance [68], a phenomenon which is best quantified by the bioavailable fraction.
The total content of nickel in soils was 29.5 ± 14.3 mg kg−1 (range: 7.4–64.0 mg kg−1) (Table 2). Nickel concentrations in soils from the different provinces studied showed significant differences (F(2, 88) = 11.6, p < 0.05), with the highest values in the Guayas province (31.6 ± 13.3 mg kg−1) and the lowest in the Orellana province (8.5 ± 1.9 mg kg−1).
The bioavailable fraction was low, representing less than 5% of the total nickel content (1.58 ± 1.15 mg kg−1), consistently with the low concentrations obtained for the labile fractions from sequential extraction (F1 < D.L.; F2: 0.252 ± 0.215 mg kg−1). Most of the nickel present in the coastal provinces was found in association with crystalline Fe oxyhydroxides (1.218 ± 0.199; 56%), while in the Orellana province, it was associated with lepidochrocite (1.000 ± 0.087 mg kg−1; 35%) (Figure 2).
Nickel concentrations in grain were 1.401 ± 1.046 mg kg−1 and similar among provinces (Table S3).
Transporter-like natural resistance-associated macrophage proteins are involved in the transport of several trace metals, including Ni, Zn, Cd, and Cu, across rice cell membranes of roots and shoots [44]. For Ni, the translocation factor from root to the upper parts of the plant is low, resulting in lower concentrations in the latter which are one order of magnitude below those in the root [62]. The later authors found that the uptake and bioaccumulation in the rice grain of Ni are related by a power function with the available fraction of the metal (see Table 4). This observation coincides with our power function relationship discussed above. BCF computed with Ni is 0.06 ± 0.05, and 0.54 ± 0.44 when calculated with the bioavailable fraction. Both lay on the low side of published values (Table 4).
The total concentration of zinc in soils from Ecuador was 88.3 ± 26.0 mg kg−1, ranging from 39.2 to 159.6 mg kg−1 (Table 2). In comparing zinc concentrations in soils from the different Ecuadorian provinces, significant differences were observed (F(2, 88) = 17.7, p < 0.05), with the highest concentrations in the Los Ríos province (110.6 ± 26.3 mg kg−1) and the lowest ones in the Orellana province (60.8 ± 17.1 mg kg−1) (Table 2).
The mean concentration of bioavailable zinc was 2.08 ± 1.45 mg kg−1, representing less than 5% of the total content (Table 2). The results from sequential extraction showed that the majority of Zn was associated with Fe oxyhydroxides, particularly to fraction F4, which showed values of 0.948 ± 0.181 mg kg−1 (46%) for coastal provinces and 7.750 ± 0.527 mg kg−1 (32%) for the Orellana province, while a lower proportion was associated with the most labile fractions: F1 (Coast: 0.023 ± 0.047 mg kg−1, 1%; Orellana: 1.050 ± 0.687 mg kg−1, 4%) and F2 (Coast: 0.223 ± 0.236 mg kg−1, 11%; Orellana: 1.800 ± 0.450 mg kg−1, 7%) (Figure 2).
Zn content in field rice grain was 23.71 ± 7.73 mg kg−1, however, Zn concentrations were similar among the different provinces (non-normal distribution) (F(1, 29) = 0.14, p = 0.71) (Table S3).
Zinc is an essential micronutrient with numerous cellular functions in plants, being uptaken from soils in the form of Zn2+ and Zn-DMA at the root surface and translocated to the upper parts of the plant through a set of molecular transporters [69]. At low Zn concentrations in soils, the translocation factor between roots and shoots is therefore close to one [70]. The BCF for zinc was 0.30 ± 0.19 (min < 0.09; max = 1.18), when the total zinc is considered, which is consistent with values found elsewhere (Table 4). If the bioavailable fraction is taken, the BCF is that of a hyperaccumulator (12.78 ± 11.59).
The mean total concentration of cadmium was 0.27 ± 0.14 mg kg−1 (range: 0.05–0.69 mg kg−1) (Table 2). Significant differences in concentration were found among provinces (F(3, 97) = 4.0, p < 0.05). Cadmium content was highest in the Los Ríos province (0.34 ± 0.14 mg kg−1) and lowest in the Guayas province (0.23 ± 0.14 mg kg−1)) (Table 2).
The bioavailable fraction of Cd reached very high percentages in relation to total content, accounting for 50% in the coastal provinces (0.13 ± 0.09 mg kg−1) and 78% (0.25 ± 0.18 mg kg−1) in the Orellana province. These values were consistent with those obtained by sequential extraction both in the coastal provinces and in Orellana, where Cd was mostly present in the exchangeable and soluble fraction F1 (82% and 73%, respectively; Figure 2), while the concentration of Cd adsorbed to Fe oxyhydroxides was very low (24%).
Cd contents in rice grain were 0.093 ± 0.215 mg kg−1 and showed significant differences between the provinces of El Oro (0.379 ± 0.418 mg kg−1) and Guayas (0.047 ± 0.138 mg kg−1), as well as between the provinces of El Oro and Los Ríos (0.045 ± 0.071 mg kg−1) (F(2, 33) = 6.9, p < 0.05). No field rice samples from the Orellana province were analyzed (Table S3).
Cadmium is primarily absorbed from the paddy soil by rice root cells and is translocated to other areas of the rice. Xylem plays a major role in the transfer of Cd from root cells to shoot cells in the Cd absorption process, and the phloem pathway is used in the translocation of Cd to the rice grains [45,71] Translocation factors for Cd in rice lay between 0.09–2.4 [70]. The BCF calculated for total metal and the bioavailable fraction were similar, given the high percentage of the latter (0.20 ± 0.30, and 0.23 ± 0.22, respectively). Published values for BCF can vary by several orders of magnitude (Table 4), in agreement with the hypothesis of the plant’s trace metal homeostasis [72].
The mean total concentration of copper was 57.2 ± 30.1 mg kg−1 (range: 25.0–16.0 mg kg−1) (Table 2). Copper concentration in the soils of the different provinces showed significant differences (F(1, 49) = 0.55, p = 0.55). The highest copper content corresponded to the Los Ríos province (86.1 ± 40.6 mg kg−1), while the lowest one corresponded to Orellana (29.2 ± 7.8 mg kg−1) (Table 2).
The highest bioavailable concentration was found in Guayas (7.10 ± 4.44 mg kg−1), corresponding to 14%, and the lowest one was found in El Oro (3.04 ± 0.56 mg kg−1) (Table 2).
Fractions F1 and F2 obtained by sequential extraction showed low concentrations (F1 < D.L. and F2: 0.186 ± 0.139 mg kg−1), corresponding to less than 5% of the total copper content. Most of the copper was associated with fraction F5 (crystalline forms of iron oxyhydroxides), which reached a percentage of 91% (9.500 ± 2.587 mg kg−1) in the Orellana province and 53% (1.125 ± 0.347 mg kg−1) in the coastal provinces (Figure 2).
Cu contents in grain were 3.63 ± 1.70 mg kg−1, with the concentrations being similar among the different provinces (F(1, 29) = 0.47, p = 0.5).
Due to the uncertainty of the spatial distribution of Cu molecular species at the root–soil interface, the process of Cu absorption from the soil at the root surface is still largely unknown. [73]. The translocation factor from root to shoot was found elsewhere to be between 0.26 and 0.50 [70], and from shoot to grain between 1.1 and 2.5 [74]. It is thought that the Cu(II) absorbed at the root interface is complexed by C/N ligands, therefore limiting translocation from the root to the upper parts of the plant [73]. The BCF calculated for total metal (0.59 ± 0.55) is within the range found elsewhere (Table 4), though on a high extreme. The variance is high, which reflects the variability in the studied soils.
On the other hand, a highly significant correlation was found between total Fe content and most toxic elements (Table S2); however, Fe oxyhydroxides either did not significantly correlate or correlated negatively (Table 3), while toxic elements showed highly significant positive correlations in most cases (Table S2).

4. Conclusions

The concentrations of metals in the soils were below the legal thresholds established by Ecuador and by other countries, except for a few samples that showed abnormally high values of Cr, Cu, and Ni.
Metals such as Cd showed high bioavailability in soils, while others such as As and Cd, associated with labile, exchangeable, and soluble fractions, do not constitute a risk for crops due to their concentrations in soils. Metals such as Pb, Cr, Ni, and Cu were found in association with residual crystalline forms of iron oxyhydroxides.
The mean concentrations of metals in field rice grain from Ecuador did not exceed the threshold values established by national and international laws, except for mean Cr values in rice from Ecuador. It is worth noting that in reduced environments, the predominant species is Cr(III), which is the least mobile and least toxic Cr species.
This study investigated the distribution of metal(oids) content in field rice grain by province and found that As and Cd concentrations found in the El Oro province were significantly higher than in the other provinces.
The concentrations of metals in rice plants were not linearly correlated with total metal concentrations in the soil, nor with their bioavailability. However, the bioconcentration factors for As, Cd, Cu, Ni, and Zn may be predicted from bioavailability by a power function with exponents ranging from −0.724 to −1.625, typical of accumulator plants, where trace metal homeostasis plays an important role. The bioaccumulation factors were highly variable but within the range found in other places in the world.

Supplementary Materials

The following are available online at https://www.mdpi.com/article/10.3390/agronomy11081594/s1, Table S1. Total metal concentrations in rice plant, leaves and stems, from different areas of Ecuador; Table S2. Pearson’s correlation matrix for Fe oxyhydroxides; Table S3. Total metal concentrations in field rice grain samples from the different provinces of Ecuador; Statistical results.

Author Contributions

O.A. and J.R. handled the sampling program and processing of the samples; L.M.N. and X.L.O. were responsible for the data analysis. All authors took part in the discussion of the result. All authors have read and agreed to the published version of the manuscript.

Funding

This study is part of a research project funded by the Universidad de las Fuerzas Armadas-ESPE through Project 2015-PIC-017. The third author was supported by project eGROUNDWATER—Citizen science and ICT-based enhanced information systems for groundwater. 2020–2024. European Union Horizon 2020.

Institutional Review Board Statement

Not applicable.

Informed Consent Statement

Not applicable.

Data Availability Statement

The data presented in this study is available on request from the corresponding author.

Conflicts of Interest

The authors declare no conflict of interest.

References

  1. Kögel-Knabner, I.; Amelung, W.; Cao, Z.; Fiedler, S.; Frenzel, P.; Jahn, R.; Kalbitz, K.; Kölbl, A.; Schloter, M. Biogeochemistry of paddy soils. Geoderma 2010, 157, 1–14. [Google Scholar] [CrossRef]
  2. Cheajesadagul, P.; Shiowatana, J.; Siripinyanond, A.; Szpunar, J. Chapter 24—Rice. In Food Protected Designation of Origin; de la Guardia, M., Gonzálvez, A.B.T.-C.A.C., Eds.; Elsevier: Amsterdam, The Netherlands, 2013; pp. 623–655. [Google Scholar]
  3. FAOSTAT. Faostat: Food Balance Sheets; Food and Agriculture Organization of the United Nations: Rome, Italy, 2018; Available online: https://faostat.fao.org/beta/en/#data/FBS (accessed on 1 January 2021).
  4. FAO. Soil Pollution: A Hidden Reality—Main Report; Food and Agriculture Organization of the United Nations: Rome, Italy; Global Soil Partnership Food and Agriculture Organization: Rome, Italy, 2018. [Google Scholar]
  5. Tian, K.; Huang, B.; Xing, Z.; Hu, W. Geochemical baseline establishment and ecological risk evaluation of heavy metals in greenhouse soils from Dongtai. China. Ecol. Indic. 2017, 72, 510–520. [Google Scholar] [CrossRef]
  6. Chen, Y.; Huang, B.; Hu, W.; Weindorf, D.C.; Liu, X.; Niedermann, S. Assessing the risks of trace elements in environmental materials under selected greenhouse vegetable production systems of China. Sci. Total Environ. 2014, 470–471, 1140–1150. [Google Scholar] [CrossRef]
  7. Kwon, J.C.; Nejad, Z.D.; Jung, M.C. Arsenic and heavy metals in paddy soil and polished rice contaminated by mining activities in Korea. CATENA 2017, 148, 92–100. [Google Scholar] [CrossRef]
  8. Sarwar, N.; Imran, M.; Shaheen, M.R.; Ishaque, W.; Kamran, M.A.; Matloob, A.; Rehim, A.; Hussain, S. Phytoremediation strategies for soils contaminated with heavy metals: Modifications and future perspectives. Chemosphere 2017, 171, 710–721. [Google Scholar] [CrossRef]
  9. Syu, C.; Huang, C.; Jiang, P.; Lee, C.; Lee, D. Arsenic accumulation and speciation in rice grains influenced by arsenic phytotoxicity and rice genotypes grown in arsenic-elevated paddy soils. J. Hazard. Mater. 2015, 286, 179–186. [Google Scholar] [CrossRef] [PubMed]
  10. Naseri, M.; Vazirzadeh, A.; Kazemi, R.; Zaheri, F. Concentration of some heavy metals in rice types available in Shiraz market and human health risk assessment. Food Chem. 2015, 175, 243–248. [Google Scholar] [CrossRef] [PubMed]
  11. Raber, G.; Stock, N.; Hanel, P.; Murko, M.; Navratilova, J.; Francesconi, K.A. An improved HPLC–ICPMS method for determining inorganic arsenic in food: Application to rice, wheat and tuna fish. Food Chem. 2012, 134, 524–532. [Google Scholar] [CrossRef]
  12. Signes-Pastor, A.J.; Carey, M.; Carbonell-Barrachina, A.A.; Moreno-Jiménez, E.; Green, A.J.; Meharg, A.A. Geographical variation in inorganic arsenic in paddy field samples and commercial rice from the Iberian Peninsula. Food Chem. 2016, 202, 356–363. [Google Scholar] [CrossRef] [Green Version]
  13. Zhang, J.; Li, H.; Zhou, Y.; Dou, L.; Cai, L.; Mo, L.; You, J. Bioavailability and soil-to-crop transfer of heavy metals in farmland soils: A case study in the Pearl River Delta, South China. Environ. Pollut. 2018, 235, 710–719. [Google Scholar] [CrossRef]
  14. Inaba, T.; Kobayashi, E.; Suwazono, Y.; Uetani, M.; Oishi, M.; Nakagawa, H.; Nogawa, K. Estimation of cumulative cadmium intake causing Itai–itai disease. Tox. Lett. 2005, 159, 192–201. [Google Scholar] [CrossRef]
  15. Rahman, M.A.; Rahman, I.M.M.; Hasegawa, H. Cooking: Effects on Dietary Exposure to Arsenic from Rice and Vegetables. In Encyclopedia of Environmental Health; Nriagu, J.O., Ed.; Elsevier: Burlington, VT, USA, 2011; pp. 248–255. [Google Scholar]
  16. Bundschuh, J.; Litter, M.I.; Parvez, F.; Román-Ross, G.; Nicolli, H.B.; Jean, J.; Liu, C.; López, D.; Armienta, M.A.; Guilherme, L.R.G.; et al. One century of arsenic exposure in Latin America: A review of history and occurrence from 14 countries. Sci. Total Environ. 2012, 429, 2–35. [Google Scholar] [CrossRef]
  17. Bundschuh, J.; Nath, B.; Bhattacharya, P.; Liu, C.; Armienta, M.A.; Moreno López, M.V.; Lopez, D.L.; Jean, J.; Cornejo, L.; Lauer Macedo, L.F.; et al. Arsenic in the human food chain: The Latin American perspective. Sci. Total Environ. 2012, 429, 92–106. [Google Scholar] [CrossRef]
  18. Cumbal, L.; Vallejo, P.; Rodriguez, B.; Lopez, D. Arsenic in geothermal sources at the north-central Andean region of Ecuador: Concentrations and mechanisms of mobility. Environ. Earth Sci. 2010, 61, 299–310. [Google Scholar] [CrossRef]
  19. De la Torre, E.; Guevara, A.; Muñoz, G.; Criollo, E. Estudio de Aguas Superficiales y Sedimentos de la Cuenca de Los Ríos Sucus; Unpublished Report for the Ecuadorian Congress; Tambo y Papallacta: Quito, Ecuador, 2004. [Google Scholar]
  20. Appleton, J.D.; Williams, T.M.; Orbea, H.; Carrasco, M. Fluvial Contamination Associated with Artisanal Gold Mining in the Ponce Enríquez, Portovelo-Zaruma and Nambija Areas, Ecuador. Water Air Soil Pollut. 2001, 131, 19–39. [Google Scholar] [CrossRef]
  21. Nunes, L.M.; Otero, X. Quantification of health risks in Ecuadorian population due to dietary ingestion of arsenic in rice. Environ. Sci. Pollut. Res. Int. 2017, 24, 27457–27468. [Google Scholar] [CrossRef] [PubMed]
  22. Pozo, W.; Sanfeliu, T.; Carrera, G. Metales pesados en humedales de arroz en la cuenca baja del río Guayas. MASKANA 2011, 2, 17–30. [Google Scholar] [CrossRef]
  23. Otero, X.L.; Ferreira, T.O.; Huerta-Díaz, M.A.; Partiti, C.S.M.; Souza, V.; Vidal-Torrado, P.; Macías, F. Geochemistry of iron and manganese in soils and sediments of a mangrove system, Island of Pai Matos (Cananeia—SP, Brazil). Geoderma 2009, 148, 318–335. [Google Scholar] [CrossRef]
  24. Meharg, A.A.; Rahman, M.M. Arsenic Contamination of Bangladesh Paddy Field Soils:  Implications for Rice Contribution to Arsenic Consumption. Environ. Sci. Technol. 2003, 37, 229–234. [Google Scholar] [CrossRef]
  25. TULSMA. Texto Unificado de Legislación Secundaria: Libro VI. De la Calidad Ambiental. Anexo I. Norma de Calidad Ambiental y Descarga de Efluentes: Recurso Agua, Criterios de Remediación Para Suelos Agrícolas. Criterios Generales Para la Descarga de Efluentes; Presidencia de la República: Quito, Ecuador, 2015. [Google Scholar]
  26. Ewers, U. Standards, guidelines and legislative regulatory concerning metals and their compounds. In Metals and Their Compounds in the Environment; Merian, E., Ed.; VCH Publishers: Weinheim, Germany, 1991; pp. 707–711. [Google Scholar]
  27. Kabata-Pendias, A. Agricultural Problems Related to Excessive Trace Metal Contents of Soils. In Heavy Metals: Problems and Solutions; Förstner, U., Salomons, W., Mader, P., Eds.; Springer: Berlin/Heidelberg, Germany, 1995; pp. 3–18. [Google Scholar]
  28. Yamaguchi, N.; Ohkura, T.; Takahashi, Y.; Maejima, Y.; Arao, T. Arsenic Distribution and Speciation near Rice Roots Influenced by Iron Plaques and Redox Conditions of the Soil Matrix. Environ. Sci. Technol. 2014, 48, 1549–1556. [Google Scholar] [CrossRef]
  29. Otero, X.L.; Tierra, W.; Atiaga, O.; Guanoluisa, D.; Nunes, L.M.; Ferreira, T.O.; Ruales, J. Arsenic in rice agrosystems (water, soil and rice plants) in Guayas and Los Ríos provinces. Ecuador. Sci. Total Environ. 2016, 573, 778–787. [Google Scholar] [CrossRef] [Green Version]
  30. Yu, H.; Li, F.; Liu, C.; Huang, W.; Liu, T.; Yu, W. Chapter Five—Iron Redox Cycling Coupled to Transformation and Immobilization of Heavy Metals: Implications for Paddy Rice Safety in the Red Soil of South China. Adv. Agron. 2016, 137, 279–317. [Google Scholar]
  31. Du, J.; Yan, C.; Li, Z. Formation of iron plaque on mangrove Kandalar, Obovata (S.L.) root surfaces and its role in cadmium uptake and translocation. Mar. Pollut. Bull. 2013, 74, 105–109. [Google Scholar] [CrossRef] [PubMed]
  32. Zhao, K.; Liu, X.; Zhang, W.; Xu, J.; Wang, F. Spatial dependence and bioavailability of metal fractions in paddy fields on metal concentrations in rice grain at a regional scale. J. Soils Sediments 2011, 11, 1165. [Google Scholar] [CrossRef]
  33. Li, H.; Luo, N.; Li, Y.W.; Cai, Q.Y.; Li, H.Y.; Mo, C.H.; Wong, M.H. Cadmium in rice: Transport mechanisms, influencing factors, and minimizing measures. Environ. Poll. 2017, 224, 622–630. [Google Scholar] [CrossRef]
  34. Suriyagoda, L.D.B.; Dittert, K.; Lambers, H. Mechanism of arsenic uptake, translocation and plant resistance to accumulate arsenic in rice grains. Agric. Ecosyst. Environ. 2018, 253, 23–37. [Google Scholar] [CrossRef]
  35. Gu, J.; Zhou, H.; Tang, H.; Yang, W.; Zeng, M.; Liu, Z.; Peng, P.; Liao, B. Cadmium and arsenic accumulation during the rice growth period under in situ remediation. Ecotoxicol. Environ. Saf. 2019, 171, 451–459. [Google Scholar] [CrossRef]
  36. Van der Zee, C.; Slomp, C.P.; Rancourt, D.G.; de Lange, G.J.; Van Raaphorst, W. A Mössbauer spectroscopic study of the iron redox transition in eastern Mediterranean sediments. Geochim. Cosmochim. Acta 2004, 69, 441–453. [Google Scholar] [CrossRef]
  37. EU. Maximum Levels for Certain Contaminants in Food; European Commission Regulation (EC) No 1881/2006 of 19 December 2006; EU: Brussels, Belgium, 2006. [Google Scholar]
  38. Xu, B.; Wang, F.; Zhang, Q.; Lan, Q.; Liu, C.; Guo, X.; Cai, Q.; Chen, Y.; Wang, G.; Ding, J. Influence of iron plaque on the uptake and accumulation of chromium by rice (Oryza sativa L.) seedlings: Insights from hydroponic and soil cultivation. Ecotoxicol. Environ. Saf. 2018, 162, 51–58. [Google Scholar] [CrossRef]
  39. Chaney, R.L. Health risks associated with toxic metals in municipal sludge. In Sludge—Health Risks of Land Application; Bitton, G., Damron, B.L., Edds, G.T., Davidson, J.M., Eds.; Ann Arbor Science Publications: Ann Arbor, MI, USA, 1980; pp. 59–83. [Google Scholar]
  40. USEPA. Framework for Metals Risk Assessment; US Environmental Protection Agency: Washington, DC, USA, 2007.
  41. Zhang, Q.; Chen, H.; Xu, C.; Zhu, H.; Zhu, Q. Heavy metal uptake in rice is regulated by pH-dependent iron plaque formation and the expression of the metal transporter genes. Environ. Exp. Bot. 2019, 162, 392–398. [Google Scholar] [CrossRef]
  42. Baker, A.J.M. Accumulators and Excluders—Strategies in the Response of Plants to Heavy Metals. J. Plant Nutr. 1981, 3, 643–654. [Google Scholar] [CrossRef]
  43. Du, F.; Yang, Z.; Liu, P.; Wang, L. Accumulation, translocation, and assessment of heavy metals in the soil-rice systems near a mine-impacted region. Environ. Sci. Pollut. Res. 2018, 25, 32221–32230. [Google Scholar] [CrossRef]
  44. Gupta, D.K.; Chatterjee, S.; Datta, S.; Veer, V.; Walther, C. Role of phosphate fertilizers in heavy metal uptake and detoxification of toxic metals. Chemosphere 2014, 8, 134–144. [Google Scholar] [CrossRef]
  45. Ali, W.; Mao, K.; Zhang, H.; Junaid, M.X.N.; Rasool, A.; Feng, X.; Yang, Z. Comprehensive review of the basic chemical behaviours, sources, processes, and endpoints of trace element contamination in paddy soil-rice systems in rice-growing countries. J. Hazard. Mater. 2020, 397, 122720. [Google Scholar] [CrossRef]
  46. Gilbert, B.; Frenzel, P. Rice roots and CH4 oxidation: The activity of bacteria, their distribution and the microenvironment. Soil Biol. Biochem. 1998, 30, 1903–1916. [Google Scholar] [CrossRef]
  47. Taylor, G.J.; Crowder, A.A. Uptake and accumulation of copper, nickel, and iron by Typha latifolia grown in solution culture. Can. J. Bot. 1983, 61, 1825–1830. [Google Scholar] [CrossRef]
  48. Zhang, X.; Zhang, F.; Mao, D. Effect of iron plaque outside roots on nutrient uptake by rice (Oryza sativa L.). Zinc uptake by Fe-deficient rice. Plant Sci. 1998, 202, 33–39. [Google Scholar]
  49. Liu, Y.; Zhou, T.; Crowley, D.; Li, L.; Liu, D.; Zheng, J.; Yu, X.; Pan, G.; Hussain, Q.; Zhang, X.; et al. Decline in topsoil microbial quotient, fungal abundance and C utilization efficiency of rice paddies under heavy metal pollution across South China. PLoS ONE 2012, 7, e38858. [Google Scholar] [CrossRef] [PubMed] [Green Version]
  50. Ye, Z.; Baker, A.J.M.; Wong, M.; Willis, A.J. Zinc, lead and cadmium accumulation and tolerance in Typha latifolia as affected by iron plaque on the root surface. Aquat Bot. 1998, 61, 55–67. [Google Scholar] [CrossRef]
  51. Liu, H.J.; Zhang, J.L.; Zhang, F.S. Role of iron plaque in Cd uptake by and translocation within rice (Oryza sativa L.) seedlings grown in solution culture. Environ. Exp. Bot. 2007, 59, 314–320. [Google Scholar] [CrossRef]
  52. Hu, Y.; Huang, Y.Z.; Liu, Y.X. Influence of iron plaque on chromium accumulation and translocation in three rice (Oryza sativa L.) cultivars grown in solution culture. Chem. Ecol. 2014, 30, 29–38. [Google Scholar] [CrossRef]
  53. Cao, X.; Ma, L.Q.; Shiralipour, A. Effects of compost and phosphate amendments on arsenic mobility in soils and arsenic uptake by the hyperaccumulator, Pteris vittata L. Environ. Pollut. 2003, 126, 157–167. [Google Scholar] [CrossRef]
  54. Peralta-Videa, J.R.; Lopez, M.L.; Narayan, M.; Saupe, G.; Gardea-Torresdey, J. The biochemistry of environmental heavy metal uptake by plants: Implications for the food chain. Int. J. Biochem. Cell Biol. 2009, 41, 1665–1677. [Google Scholar] [CrossRef] [PubMed]
  55. Sharma, S.; Kaur, I.; Nagpal, A.K. Assessment of arsenic content in soil, rice grains and groundwater and associated health risks in human population from Ropar wetland, India, and its vicinity. Environ. Sci. Pollut. Res. 2017, 24, 18836–18848. [Google Scholar] [CrossRef]
  56. Samal, A.C.; Bhattacharya, P.; Biswas, P.; Maity, J.P.; Bundschuh, J.; Santra, S.C. Variety-specific arsenic accumulation in 44 different rice cultivars (O. sativa L.) and human health risks due to co-exposure of arsenic-contaminated rice and drinking water. J. Hazard. Mater. 2021, 407, 124804. [Google Scholar] [CrossRef]
  57. Singh, J.; Upadhyay, S.K.; Pathak, R.K.; Gupta, V. Accumulation of heavy metals in soil and paddy crop (Oryza sativa), irrigated with water of Ramgarh Lake, Gorakhpur, UP, India. Toxicol. Environ. Chem. 2011, 93, 462–473. [Google Scholar] [CrossRef]
  58. Tariq, S.R.; Rashid, N. Multivariate analysis of metal levels in paddy soil, rice plants, and rice grains: A case study from Shakargarh, Pakistan. J. Chem. 2013, 2013, 539251. [Google Scholar] [CrossRef]
  59. Luo, C.; Yang, R.; Wang, Y.; Li, J.; Zhang, G.; Li, X. Influence of agricultural practice on trace metals in soils and vegetation in the water conservation area along the East River (Dongjiang River), South China. Sci. Total Environ. 2012, 431, 26–32. [Google Scholar] [CrossRef] [PubMed]
  60. Cao, H.; Chen, J.; Zhang, J.; Zhang, H.; Qiao, L.; Men, Y. Heavy metals in rice and garden vegetables and their potential health risks to inhabitants in the vicinity of an industrial zone in Jiangsu, China. J. Environ. Sci. 2010, 22, 1792–1799. [Google Scholar] [CrossRef]
  61. Xie, W.J.; Che, L.; Zhou, G.Y.; Yang, L.N.; Hu, M.Y. The bioconcentration ability of heavy metal research for 50 kinds of rice under the same test conditions. Environ. Monit. Assess. 2016, 188, 675. [Google Scholar] [CrossRef] [Green Version]
  62. Hseu, Z.Y.; Lai, Y.J. Nickel accumulation in paddy rice on serpentine soils containing high geogenic nickel contents in Taiwan. Environ. Geochem. Health 2017, 39, 1325–1334. [Google Scholar] [CrossRef] [PubMed]
  63. Blaylock, M.J.; Huang, J.W. Phytoextraction of metals. In Phytoremediation of Toxic Metals: Using Plants to Clean Up the Environment; Raskin, I., Ensley, B.D., Eds.; John Wiley: New York, NY, USA, 2000; pp. 53–71. [Google Scholar]
  64. Liu, J.; Li, K.; Xu, J.; Zhang, Z.; Ma, T.; Lu, X.; Yang, J.; Zhu, Q. Lead toxicity, uptake, and translocation in different rice cultivars. Plant Sci. 2003, 165, 793–802. [Google Scholar] [CrossRef]
  65. de Oliveira, L.M.; Gress, J.; De, J.; Rathinasabapathi, B.; Marchi, G.; Chen, Y.; Ma, L.Q. Sulfate and chromate increased each other’s uptake and translocation in As-hyperaccumulator Pteris vittata. Chemosphere 2016, 147, 36–43. [Google Scholar] [CrossRef] [PubMed] [Green Version]
  66. Shukla, O.P.; Dubey, S.; Rai, U.N. Preferential Accumulation of Cadmium and Chromium: Toxicity in Bacopa monnieri L. under Mixed Metal Treatments. Bull. Environ. Contam. Toxicol. 2007, 78, 252–257. [Google Scholar] [CrossRef] [PubMed]
  67. Tang, L.; Deng, S.; Tan, D.; Long, J.; Lei, M. Heavy metal distribution, translocation, and human health risk assessment in the soil-rice system around Dongting Lake area, China. Environ. Sci. Pollut. Res. 2019, 26, 17655–17665. [Google Scholar] [CrossRef] [PubMed]
  68. Gardea-Torresdey, J.L.; Peralta-Videa, J.R.; Montes, M.; De La Rosa, G.; Corral-Diaz, B. Bioaccumulation of cadmium, chromium and copper by Convolvulus arvensis L.: Impact on plant growth and uptake of nutritional elements. Bioresour. Technol. 2004, 92, 229–235. [Google Scholar] [CrossRef] [PubMed]
  69. Ishimaru, Y.; Bashir, K.; Nishizawa, N.K. Zn uptake and translocation in rice plants. Rice 2011, 4, 21–27. [Google Scholar] [CrossRef] [Green Version]
  70. Safarzadeh, S.; Ronaghi, A.; Karimian, N. Effect of cadmium toxicity on micronutrient concentration, uptake and partitioning in seven rice cultivars. Arch. Agron. Soil Sci. 2013, 59, 231–245. [Google Scholar] [CrossRef]
  71. Khanam, R.; Kumar, A.; Nayak, A.K.; Shahid, M.; Tripathi, R.; Vijayakumar, S.; Bhaduri, D.; Kumar, U.; Mohanty, S.; Panneerselvam, P.; et al. Metal(loid)s (As, Hg, Se, Pb and Cd) in paddy soil: Bioavailability and potential risk to human health. Sci. Total Environ. 2020, 699, 134330. [Google Scholar] [CrossRef]
  72. Uraguchi, S.; Fujiwara, T. Cadmium transport and tolerance in rice: Perspectives for reducing grain cadmium accumulation. Rice 2012, 5, 1–8. [Google Scholar] [CrossRef] [Green Version]
  73. Cui, J.L.; Zhao, Y.P.; Lu, Y.J.; Chan, T.S.; Zhang, L.L.; Tsang, D.C.W.; Li, X.D. Distribution and speciation of copper in rice (Oryza sativa L.) from mining-impacted paddy soil: Implications for copper uptake mechanisms. Environ. Int. 2019, 126, 717–726. [Google Scholar] [CrossRef] [PubMed]
  74. Satpathy, D.; Reddy, M.V.; Dhal, S.P. Risk assessment of heavy metals contamination in paddy soil, plants, and grains (Oryza sativa L.) at the east coast of India. Biomed Res. Int. 2014, 2014, 545473. [Google Scholar] [CrossRef] [PubMed] [Green Version]
Figure 1. Location of the provinces of Ecuador where the sampling was carried out.
Agronomy 11 01594 g001
Figure 2. (A) Metal fraction diagram. (B) Relationship between bioconcentration in rice plants and bioavailability for the selected metals.
Agronomy 11 01594 g002aAgronomy 11 01594 g002b
Table 1. Soil properties: pH and Eh, and composition: total organic carbon [TOC], texture, total Fe [TFe]. (Minimum and maximum values are shown between parentheses).
SamplepHEhTOCClaySiltSandTFe
mV%
Ecuador
Coastal provinces6.4 ± 0.6226 ± 931.9 ± 0.649 ± 1624 ± 1328 ± 204.2 ± 1.0
range3.6∓7.492∓4850.7∓3.223∓883∓530.9∓642.4∓7.1
n53556123232383
Orellana province5.9 ± 0.1n.a.4.4 ± 1.417 ± 1417 ± 867 ± 182.7 ± 0.7
range5.8∓6.0 2.1∓6.16∓376∓2546∓891.8∓3.6
n8 86668
Ecuador6.3 ± 0.6226 ± 932.2 ± 1.142 ± 2022 ± 1235 ± 244.1 ± 1.1
range3.6∓7.492∓4850.7∓6.16∓883∓530.9∓891.8∓7.1
n61556929292991
Table 2. Total and bioavailable (Mehlich) metal concentrations (mg kg−1) in soil samples from rice paddies from the different provinces of Ecuador (mean ± SD). n.a.: not analyzed.
ProvinceCrZnPbCdCuAsNi
TablesTotal
Guayas
(n = 62)
59.7 ± 14.384.3 ± 21.212.0 ± 7.70.23 ± 0.1451.1 ± 19.14.45 ± 2.4231.6 ± 13.3
Los Ríos
(n = 21)
47.7 ± 32.9110.6 ± 26.317.8 ± 9.30.34 ± 0.1486.1 ± 40.66.78 ± 4.8531.1 ± 13.6
El Oro
(n = 10)
n.a.n.a.9.7 ± 2.80.30 ± 0.10n.a.3.30 ± 1.07n.a.
Coastal provinces
(n = 93)
56.7 ± 21.190.9 ± 25.213.1 ± 8.10.26 ± 0.1460.0 ± 30.14.86 ± 3.2131.5 ± 13.3
Orellana
(n = 8)
14.5 ± 4.460.8 ± 17.14.3 ± 2.00.32 ± 0.1429.2 ± 6.81.07 ± 0.448.5 ± 1.9
Ecuador
(n = 102)
53.0 ± 23.588.3 ± 26.012.4 ± 8.20.27 ± 0.1457.2 ± 30.14.56 ± 3.2529.5 ± 14.30
Bioavailable
Guayas0.25 ± 0.082.21 ± 1.552.06 ± 1.190.14 ± 0.097.10 ± 4.440.15 ± 0.101.93 ± 1.08
(n = 62)0.4%3%17%61%14%3%6%
Los Ríos0.17 ± 0.081.60 ± 1.000.69 ± 0.730.08 ± 0.075.27 ± 6.210.06 ± 0.050.65 ± 0.75
(n = 21)0.4%2%4%24%6%1%2%
El Oro0.77 ± 0.122.01 ± 0.401.55 ± 0.860.24 ± 0.063.04 ± 0.560.20 ± 0.032.33 ± 0.55
(n = 3)n.an.a16%80%n.a6%n.a
Coastal provinces0.25 ± 0.132.05 ± 1.421.70 ± 1.230.13 ± 0.096.50 ± 4.950.131 ± 0.0951.62 ± 1.14
(n = 86)0.4%2%13%50%11%3%5%
Orellana0.03 ± 0.013.02 ± 2.230.61 ± 0.300.25 ± 0.183.15 ± 1.300.012 ± 0.0030.21 ± 0.04
(n = 3)0.2%5%14%78%11%1%3%
Ecuador0.24 ± 0.142.08 ± 1.451.66 ± 1.230.13 ± 0.106.38 ± 4.900.127 ± 0.1001.58 ± 1.15
(n = 89)0.5%2%13%48%11%3%5%
Table 3. Concentration of metals and metalloids rice parts and whole.
MetalGrainLeafStemWhole
AverageSt. devNAverageSt. devNAverageSt. devNAverageSt. devN
As0.080.03140.150.0980.130.0690.120.0631
Cd0.070.17140.020.0280.030.0590.040.1231
Co0.170.26140.780.8580.610.5990.450.6031
Cr0.500.50141.981.9981.120.8091.061.2531
Cu3.761.30144.231.6683.984.4393.952.5831
Ni0.920.58140.770.3780.860.9090.870.6331
Pb0.190.20140.120.0580.070.0490.140.1431
Zn24.087.301418.788.72833.5519.02925.4613.0331
Table 4. Bioconcentration factors (BCF) for the studied metal(oids). Average ± standard deviation (sample size).
BCF on Melich.As *Cd *Cr *Cu *Ni *Pb *Zn *
Stem1.6 ± 1.3 (8)0.27 ± 0.57 (9)5.3 ± 4.4 (8)0.61 ± 0.94 (9)0.56 ± 0.61 (9)0.03 ± 0.02 (9)18.7 ± 16.8 (9)
Leaf1.7 ± 1.1 (8)0.13 ± 0.07 (8)8.0 ± 6.6 (8)0.58 ± 0.18 (8)0.49 ± 0.12 (8)0.05 ± 0.02 (8)9.2 ± 5.7 (8)
Grain0.76 ± 0.44 (11)0.18 ± 0.10 (11)2.21 ± 2.35 (13)0.55 ± 0.34 (13)0.54 ± 0.45 (13)0.08 ± 0.08 (13)10.5 ± 8.3 (13)
Plant1.31 ± 1.00
(min = 0.12; max = 4.64)
0.20 ± 0.30
(min = 0.05; max = 1.64)
4.52 ± 4.93
(min = 0.46; max = 22.0)
0.59 ± 0.55
(min = 0.17; max = 3.10)
0.54 ± 0.44
(min = 0.12; max = 2.14)
0.06 ± 0.06
(min = 0.01; max = 0.27)
12.78 ± 11.59
(min = 2.44; max = 55.8)
BCF on total
Stem0.04 ± 0.030.31 ± 0.320.04 ± 0.030.09 ± 0.110.05 ± 0.040.01 ± 0.010.37 ± 0.27
Leaf0.05 ± 0.060.09 ± 0.120.09 ± 0.090.12 ± 0.110.07 ± 0.070.02 ± 0.010.23 ± 0.09
Grain0.03 ± 0.030.18 ± 0.120.06 ± 0.040.07 ± 0.050.05 ± 0.040.03 ± 0.010.29 ± 0.15
Plant0.04 ± 0.04
(min ≤ 0.01; max = 0.20)
0.23 ± 0.22
(min = 0.01; max = 1.23)
0.05 ± 0.07
(min < 0.01; max = 0.31)
0.09 ± 0.09
(min = 0.10; max = 0.52)
0.06 ± 0.05
(min < 0.01; max = 0.26)
0.02 ± 0.02
(min < 0.01; max = 0.10)
0.30 ± 0.19
(min < 0.09; max = 1.18)
Singh et al. [57]0.0110.012-0.002-0.028-
Tariq and Rashid [58]-0.0240.185-0.5390.043-
Luo et al. [59]-0.0010.0590.0120.0040.001-
Cao et al. [60]-----0.002
Du et al. [43]7.26 ± 4.865.35 ± 3.890.285 ± 0.1560.457 ± 0.1790.234 ± 0.1340.516 ± 0.3080.504 ± 0.162
Xie et al. [61]0.056 ± 0.00460.459 ± 0.0100.015 ± 0.00050.090 ± 0.0057-0.012 ± 0.0004-
Li et al. [33]0.0420.1710.6880.287-0.0290.107
Hseu et al. [62]–on bioavailable fraction Ni-grain = 2.92 × Ni-soil 0.08 **
Published BCF in grain—based on total concentration, unless stated otherwise. *: Non-significant differences between means of concentrations in different parts of the plant (ANOVA test, p > 0.05); **: polished rice.
Publisher’s Note: MDPI stays neutral with regard to jurisdictional claims in published maps and institutional affiliations.

