Article

Functional Analysis of A Soybean Ferredoxin-NADP Reductase (FNR) Gene in Response to Soybean Mosaic Virus

1
National Center for Soybean Improvement, National Key Laboratory for Crop Genetics and Germplasm Enhancement, Nanjing Agricultural University, Nanjing 210095, China
2
Subtropical Horticulture Research Institute, Jeju National University, Jeju 63243, Korea
*
Authors to whom correspondence should be addressed.
These two authors contributed equally to the work.
Agronomy 2021, 11(8), 1592; https://doi.org/10.3390/agronomy11081592
Submission received: 12 July 2021 / Revised: 28 July 2021 / Accepted: 2 August 2021 / Published: 11 August 2021
(This article belongs to the Special Issue Legumes Cultivars and Their Genetic Improvements)

Abstract

:
The Ferredoxin-NADP reductase (FNR) gene plays a significant role in NADPH production, carbon assimilation, antioxidation, and cross-talking between chloroplasts and mitochondria in plants. This study aims to know the functional response of the soybean FNR gene (GmFNR) during a soybean mosaic virus (SMV) infection. For this purpose, we developed the bean pod mottle virus (BPMV)-based gene construct (BPMV-GmFNR) and used it to silence the GmFNR gene in resistant and susceptible lines. The results showed that GmFNR expression decreased to 50% in the susceptible line, compared to 40% in the resistant line. The silencing of GmFNR reduces the photosynthetic capacity and CAT activity of both lines compared to their respective controls. In addition, the H2O2 content increased significantly in the susceptible line, whereas the resistant line did not exhibit any change. Further, an SMV infection in the silencing plants of the susceptible line resulted in serious morphological changes and increased the SMV NIa-protease transcript accumulation compared to its control plants. However, the same impact was not observed in the resistant line. The yeast two-hybrid system, BIFC assay, and quantitative real-time polymerase chain reaction (qRT-PCR) analyses revealed that the GmFNR was interacting with EF1A and coincided with the increased SMV accumulation. The results obtained in this study improve the understanding of the soybean FNR gene response during SMV infection and provide a novel insight into the SMV resistance mechanism.

Graphical Abstract

1. Introduction

Soybean mosaic disease, incited by soybean mosaic virus, is a serious virus disease of soybean. Typical disease symptoms ranged from no apparent symptoms to serious mottling and malformed leaves. Mottling exists in soybean leaves with light green and dark patches. It is not easy to control the SMV once infection occurs. SMV severely affects the pod setting, size of the seed, decreases the seed’s oil content, and root nodulation. Crop losses due to soybean disease may reach 80% in an outbreak or epidemic [1,2]. The evolution of new SMV strains led to severe soybean mosaic disease prevalence in several countries, including China, becoming a major threat for soybean production [3]. The utilization of soybean cultivars resistant to SMV is a potential, robust, and eco-friendly sustainable method to control the disease [4,5]. Though many SMV-resistant soybean cultivars have been identified [6], thus far, no cultivar has exhibited a broad spectrum of resistance to all the SMV strains. There is still limited information on the mechanisms of soybean resistance to SMV, vital for developing suitable control methods. The analysis of the genome sequence of soybean [7] helps us to understand the genome composition, gene position, gene structure, and function. This knowledge will help us to explore both genome and proteome data and allow investigators to discover and isolate candidate genes based on the trait of interest. In this context, the research’s foremost objective is to validate and functionally study the disease resistance candidate gene’s involvement with predicted roles in soybean–SMV interactions to develop novel strategies for SMV control.
In the recent past, different methods that include transgene overexpression or RNA interference (RNAi) have been used to validate the candidate gene’s function in many crops. However, these methods have certain limitations, require more time, and are laborious. Therefore, the virus-induced gene silencing (VIGS) system extensively used for the over-expression and downregulation of genes in various crops, including soybean. Thus far, many VIGS systems, including bean pod mottle virus (BPMV), tobacco rattle virus (TRV), apple latent spherical virus (ALSV), and soybean yellow common mosaic virus (SYCMV), used for the functional analysis of candidate genes in soybean [8,9,10,11]. The BPMV VIGS system is successfully applied to describe the candidate genes function for different traits, including SMV resistance in soybean [12,13]. Ferredoxin-NADP reductase (FNR) is one of the central enzymes in the photosynthetic electron transport chain (PETC). It plays a vital role in the final electron transference NADP+ generating NADPH. It also involves carbon assimilation, antioxidation, and cross-talking among chloroplasts and mitochondria [14]. The NADPH produced through the involvement of FNR is vital to support the activity of antioxidative systems and played a significant role in the protection of chloroplast redox state. The decreasing activity of FNR during viral infection might inhibit the energetic machinery of the plant defense system. Earlier, in our research group, the FNR protein corresponding to Glyma.02g047600 differential expression was documented by a comprehensive proteomics study using SMV resistance and susceptible lines [15]. Our previous report is considered as the base for this additional research. In the present study, we aimed to study the function of the soybean FNR gene in response to SMV infection by VIGS and provide a novel insight into the SMV resistance mechanism.

2. Materials and Methods

2.1. Plant Genetic Materials and SMV Isolate

Resistant and susceptible near isogenic lines (NILs) (hereafter referred to as resistant and susceptible lines) derived from Qihuang-1 and NN1138-2 were used in this study. For SMV strain SC3, Qihuang-1 is resistant, whereas NN1138-2 is susceptible. The development of NILs was detailed previously by Zheng [16]. Briefly, NILs are developed using the heterogeneous inbred family method targeting the RSC3Q gene region on chromosome 13. Formal identification of the plant materials has been performed through genotyping and phenotyping (resistant and susceptible reaction SMV strain SC3) [16]. The seeds of the genotypes and a single SMV isolate belonging to strain SC3 were provided by the National Center for Soybean Improvement (NCSI), Nanjing Agricultural University, and Nanjing, China. The virus isolate was cultured and kept up distinctly on NN1138-2 plants via successive inoculations at the aphid-free condition. We performed the inoculum preparation, inoculation, management of plants, and pathotype identities according to the previous method [3].

2.2. Cloning and Sequence Analysis

Primer Premier 5.0 software (Premier Biosoft International, Palo Alto, CA, USA) used to design the gene-specific primers (Table 1) based on the 5′-untranslated regions (UTR) and 3′-UTR of the FNR protein corresponding to the gene model Glyma.02g047600 (hereafter referred to as GmFNR) in Williams 82 soybean reference genome GlymaWm 82.a2.v1 (https://soybase.org, 2 August 2021). The full-length coding sequences (CDS) of the gene were amplified using cDNA from resistant and susceptible lines. Then, purified PCR products were ligated with pMD19-T vector (Takara) overnight at 4 °C following the user guidelines. The ligated product was transformed into DH5α competent cells and plated into LB agar medium having 100 μg/mL ampicillin, 50 mg/mL X-gal, and 50 mg/mL IPTG and grown overnight at 37 °C. The positive clones were confirmed via PCR analysis and then sequenced at Invitrogen Biotechnology Co., Ltd. (Shanghai, China). The Fgenesh online program (www.softberry.com/, 2 August 2021) was used to predict open reading frames (ORFs). The amino acid sequences were used for confirming the motifs in comparison to the National Centre for Biotechnology Information (NCBI) reference protein database using BLASTP (https://blast.ncbi.nlm.nih.gov/Blast.cgi, 2 August 2021). Alignment of nucleotide and amino acid sequences was conducted using Clustal Omega (https://www.ebi.ac.uk/Tools/msa/clustalo, 2 August 2021) with default parameters. To know the evolutionary relationships, full-length sequences of FNR genes containing the same domain were retrieved from the NCBI database. The phylogenetic analysis of these genes was conducted using MEGA 5.1.

2.3. RNA Isolation and qRT-PCR Analysis

Resistant and susceptible lines were grown in a plant growth chamber at 25 °C with a 16-h light/8-h dark photoperiod. Plants were inoculated with SMV-SC3 when the primary leaves completely expanded. Infected leaves were collected from resistant and susceptible lines at 0, 2, 4, 6, 8, 10, 12, and 24 h post-inoculation (hpi) for three replications, frozen and stored at −80 °C until use. Total RNA was isolated using Trizol reagent using a total RNA isolation kit (Tiangen, Beijing, China). RNA was converted into cDNA via HiScript ®II QRT Super Mix (Vazyme Biotech, Nanjing, China), following the user guidelines. Quantitative real-time polymerase chain reaction (qRT-PCR) analysis was conducted using a Light-Cycler 480 (Roche Diagnostics, Indianapolis, IN, USA). The target gene sequence was obtained from Williams 82 soybean reference genome GlymaWm 82.a2.v1 (https://soybase.org), and a set of primer pairs were designed using Primer Premier 5.0 software (PREMIER Biosoft, Palo Alto, CA, USA). The house keeping gene tubulin was used as a reference gene. The primers were tested to generate a single peak in the melting curve using Light-Cycler 480 and considered a reference gene for analysis to measure the fold changes in gene expression. The fold changes were measured using the 2−ΔΔC (t) method. The primers for qRT-PCR analysis are listed in Table 1. For qRT-PCR analysis, the mixture of 10 μL final volume contained 5 μL of 2 × SYBR Green PCR Master Mix (TaKaRa), 0.4 μL of each primer, 1 μL of a template (10 × diluted cDNA from samples), and 3.2 μL of ddH2O. The thermal conditions are as follows: 95 °C for 5 min, followed by 40 cycles of 95 °C for 10 s and 55 °C for 15 s, then 72 °C for 15 s. All reactions were performed three times in 96-well reaction plates, and three independent replications were conducted.

2.4. Construction of VIGS Plasmids

The recombinant BPMV vectors pGG7R1 and pGG7R2 were obtained from the National Center for Soybean Improvement, Nanjing Agricultural University, China, and used in this study. To generate the VIGS vector, 204 bp cDNA fragment conserves to GmFNR was amplified from NN1138-2 using the primers pairs listed in Table 1. Next, the PCR fragment was successfully introduced into the pGG7R2 vector by digesting with restriction enzymes (BamHI and MscI). To confirm the reliability of the sequence, the product was transformed to DH5α competent cells and plasmids were isolated, then sequenced at Invitrogen Biotechnology Co. Ltd. (Shanghai, China). Blast analysis of the resulting sequences was conducted to verify that the amplified fragment denoted the target gene.

2.5. Synthesis of In Vitro Transcripts and Inoculation of Plants

The pGG7R2-GmFNR vector constructs, having the silencing fragment of the GmFNR, were linearized with the restriction enzymes SalI and NotI, whereas pGG7R1 was linearized with SalI alone. Briefly, the capped RNA transcripts were made through incubating 30 µL of linearized plasmids in 50 µL of reaction mixture having 10 × Buffer, T7 RNA polymerase, rGTP, rATP, rCTP, rUTP, m7G5′cap, RNase inhibitor, and ddH2O. Further, the mixture was incubated at 37 °C for 2 h. The transcript products of pGG7R1 and pGG7R2-GmFNR were combined with a ratio of 1:1, and infectious transcripts (BPMV-GmFNR) were generated. Then, infectious transcripts were inoculated to the primary leaves of NN1138-2, and plants inoculated with BPMV empty vector (BPMV-EV) were used as a control. All the plants were maintained in a growth chamber at 25 °C with a 16-h light/8-h dark photoperiod. When plants exhibited BPMV symptoms, the leaves were collected and used for further studies.

2.6. Silencing of GmFNRs in Soybean Plants

To silence the GmFNR, the BPMV-GmFNR transcripts obtained from NN1138−2 were used to inoculate in the primary leaves of resistant and susceptible lines along with control (BPMV-EV). When the first trifoliate leaves emerged with BPMV symptoms, the expression pattern of GmFNR was studied in silencing plants using qRT-PCR analysis using the primers listed in Table 1. Further, the leaves were collected and frozen in liquid nitrogen immediately and stored at −80 °C to measure the chlorophyll and H2O2 contents and CAT activity.

2.7. Determination of Chlorophyll

The procedure of Costache et al. [17] was followed to determine the chlorophyll content at 10 dpi. Fresh leaves were collected and weighed about 0.5 g, then 80% acetone was added and ground into homogenate. The extraction ratio was 1:10. After the mixture was placed in the dark for about 10 min, the supernatants were used to detect the absorbance. The wavelengths were 645, 663, and 470 nm. Equations used for calculation are as follows:
Chl a = 12.72 × OD663 − 2.59 × OD645,
Chl b = 20.88 × OD645 − 4.68 × OD663,
Total Chl = 20.29 × OD645 + 8.02 × OD663,
Car = 1000 × OD470 − 3.27 × Chl a − 104 × Chl b/229.
MINI-PAM (Walz, Germany) was used to measure the chlorophyll fluorescence and photosynthetic parameters (Fv/Fm).

2.8. H2O2 Content and CAT Activity

H2O2 content was tested at 10 dpi using the test kit (Nanjing Jiancheng Bioengineering Institute, Nanjing, China). The experimental theory is that H2O2 can react with molybdic acid and generate a yellowish complex. Sample tissues were weighed, and phosphate buffer was added at the ratio of weight (g):volume (mL) = 1:9. The mix was grinded on ice to prepare the 10% tissue homogenate, then centrifuged at 10,000 rpm for 10 min. Supernatant was collected for the next step. Reagent I (37 °C preheat) and Reagent II were mixed with the supernatant and the absorbance was measured at 405nm. Water and the standard H2O2 (163 mmol/L) were used as blank control and standard control, respectively. CAT activity was measured at 10 dpi using the test kit (Nanjing Jiancheng Bioengineering Institute, Nanjing, China) following the user guidelines. The reaction of catalase (CAT) resolving H2O2 can be stopped by adding ammonium molybdate. The rest of the H2O2 reacted with ammonium molybdate and generated a yellowish complex. In this experiment, leaf samples were weighed, and phosphate buffer was added at the ratio of weight (g):volume (mL) = 1:9. The mix was grinded on ice to prepare the 10% tissue homogenate, then centrifuged at 2500 rpm for 10 min and the supernatant was collected. The supernatant was mixed with Reagent I and Reagent II (37 °C preheat), then incubated at 37 °C for 60 s. Next, Reagent III and Reagent IV were added. Finally, the mixture was measured at the absorbance 450 nm, and water was used as blank control.
Equations used for calculations are as follows:
H2O2 content = (Sample OD − blank OD)/(Standard OD − blank OD) × standard concentration,
CAT activity = (Sample OD − blank OD) × 271 × 1/(60 × sample quality) × dilution multiple.

2.9. Detection of SMV Accumulation

After confirming the GmFNR silencing, plants were inoculated with SMV and leaves were collected at 0, 4, 7, 10, and 14 dpi from three independent plants and used to detect the SMV. The SMV accumulation was detected using qRT-PCR analysis using SMV NIa-protease gene-specific primers. Double-antibody sandwich-ELISA (DAS-ELISA) assay test kits ACD Inc. (cat #V094-R1, Beijing, China) were used according to the user guidelines. To confirm the reproducibility of DAS-ELISA, samples were obtained from all the plants in each group for analysis. Each sample’s readings were averaged and converted to multiples of the negative controls (mock-inoculated plants). Samples with a relative ratio higher than 2.0 were taken as positive for SMV.

2.10. Yeast-Two-Hybrid Assay

We used DUAL membrane kit 3 (DUAL systems BioTech, Zurich, Switzerland) to screen the soybean cDNA library. For bait vector construction, the full-length sequence of the GmFNR was cloned with yeast vector pBT3-STE, and the resulted bait vector (FNR-pBT3-STE) with cDNA library co-transformed into the yeast strain NMY51 according to the user guidelines. The mixture was then spread onto agar plates with synthetic media having Leu, Trp, His, and Ade (SD-Leu-Trp-His-Ade) with lack of dextrose incubated at 30 °C for 4 days. Further potential positive hits were selected. Then, plasmids were isolated using EZNA® Yeast DNA Kit (Omega Bio-Tek, Norcross, GA, USA) and then sequenced at Invitrogen Biotechnology Co. Ltd. (Shanghai, China). The resulting sequences were analyzed and confirmed in NCBI (https://www.ncbi.nlm.nih.gov, 2 August 2021) and classified using DAVID Bioinformatics Resources 6.8 (https://david.ncifcrf.gov, 2 August 2021). The plasmids of candidate interacted genes were co-transformed with FNR-pBT3-STE again and inoculated on SD-Leu-Trp-His-Ade plates. Further, the colonies were picked and incubated and then dropped on the SD-Leu-Trp-His-Ade plates with α-x-gal at a final concentration of 4 mg/mL to know the interaction affinity.

2.11. Bimolecular Fluorescence Complementation (BiFC) Assay
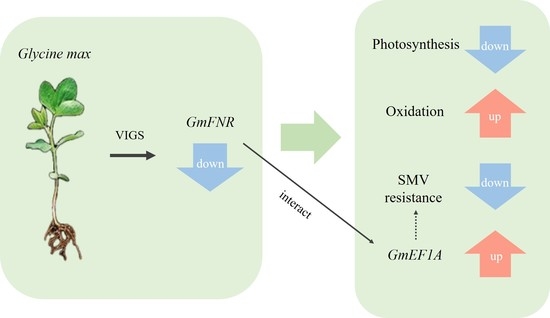
The procedures to introduce expression vectors into Agrobacterium tumefaciens strain EHA105 and to infiltrate transformed Agrobacterium tumefaciens cells into 5-week-old Nicotiana benthamiana leaves were performed according to the earlier described method [18]. The entire length of FNR and candidate interacted genes were used to clone with pSITE-n/cEYFP vectors, and constructs were inserted to two halves of YFP N-/C-terminal, respectively. Then, it was transformed to Agrobacterium Tumefaciens strain EHA105. The EHA105 contained the two halves that were mixed and co-infiltrated into N. benthamiana leaves. After two days of co-infiltration, leaves from three individual transformed plants were examined for fluorescence using a confocal microscope (Zeiss, LSM780). The experiment and analysis were conducted three times for all constructs and to obtain comparable results.

3. Results

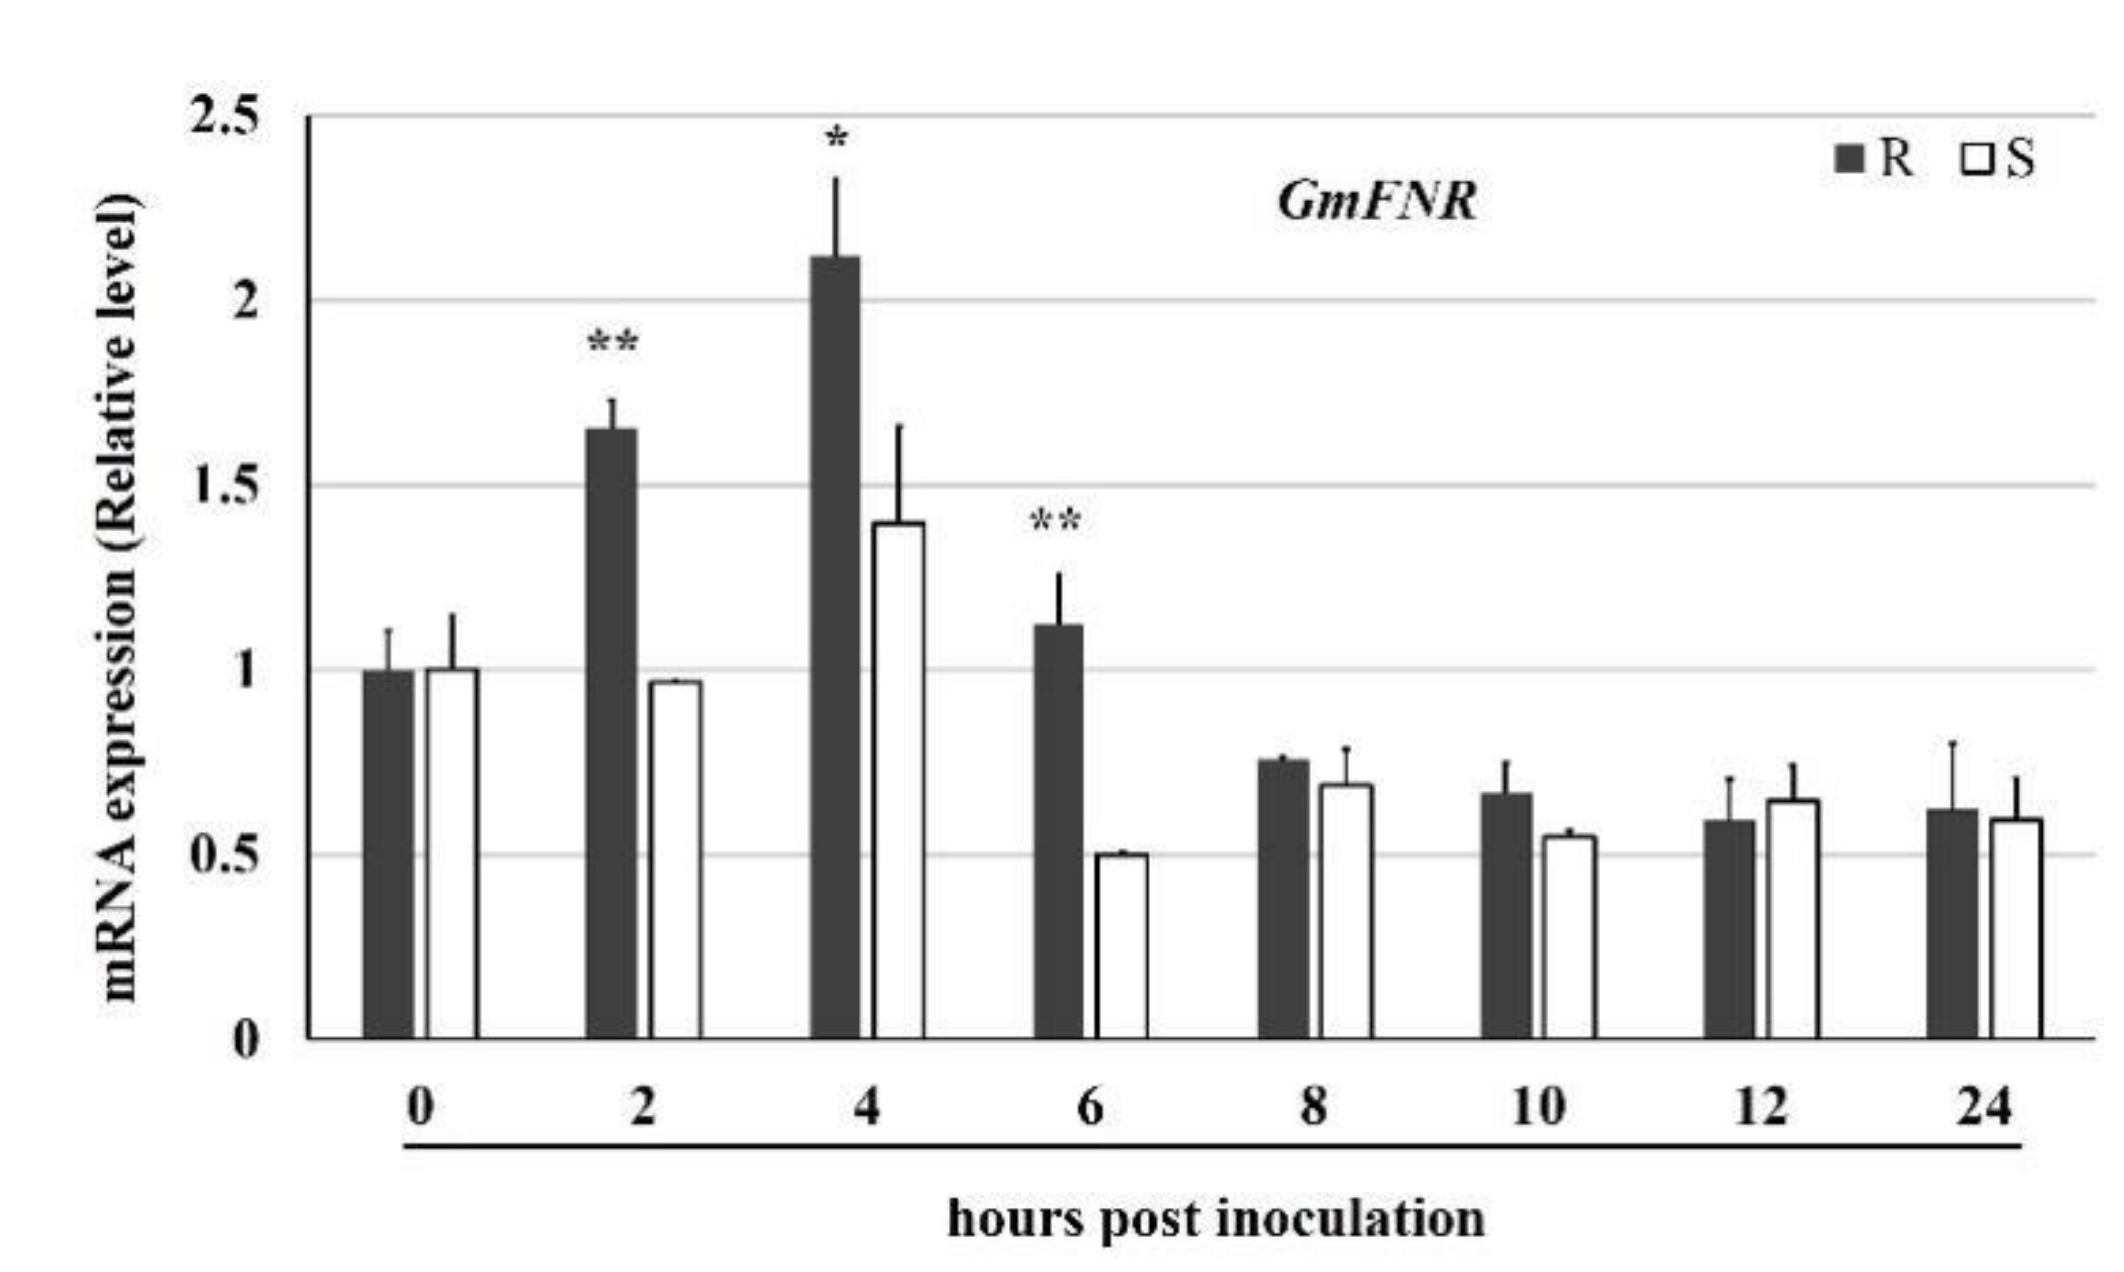
3.1. Sequence and Expression Analyses

The soybean FNR gene (GmFNR) coding sequences were amplified in resistant and susceptible lines using gene-specific primers. Sequencing analysis showed that the resistant and susceptible lines coding and amino acid sequences have a close identity, and the sequence has a homology of 99%. The evolutionary relationships between GmFNR and other plant FNR genes revealed that the GmFNR has a high homology with Leguminosae plants, such as Arachis hypogaea, Cajanus cajan, and Abrus precatorius (Figure S1). Further, we investigated the GmFNR expression following the SMV infection using qRT-PCR analysis. It revealed that the GmFNR expression varied between resistant and susceptible lines. The expression level of GmFNR was higher in the resistant line than in the susceptible line. GmFNR was upregulated in the resistant line after SMV infection at 2 h post-inoculation (hpi) and reached maximum expression at 4 hpi compared to the control. From 6 to 24 hpi, the expression was decreased steadily in the resistant line. In contrast, GmFNR expression was downregulated in the susceptible line at all the time points than the control. The expression pattern of GmFNR in the resistant and susceptible lines was presented in Figure 1.

3.2. Silencing of GmFNR in Resistant and Susceptible Lines

A 204 bp length fragment of GmFNR was inserted into modified pGG7R2, and infectious transcripts (BPMV-GmFNR) generated by the mixed transcript products pGG7R1 and pGG7R2-GmFNR. The primary leaves of the resistant and susceptible lines were infected by BPMV-GmFNR and a control (BPMV-EV). After infection, the resistant and susceptible lines expressed similar phenotypes. When the first trifoliate leaves emerged with BPMV symptoms, we analyzed the GmFNR expression. It revealed that the GmFNR expression was reduced to 50% in the susceptible line, and 40% in the resistant line compared to their respective controls. The silencing of GmFNR causes obvious chlorosis but did not cause any serious morphological changes in resistant and susceptible lines. Figure 2 shows the BPMV symptom expression and the downregulation of the GmFNR gene in resistant and susceptible lines.

3.3. Photosynthetic Capacity, ROS Production, and CAT Activity

The photosynthetic pigment concentration and parameters Fv/Fm were measured in the control and the silencing plants of the resistant and the susceptible lines at 10 dpi, and the results are presented in Figure 3. In both the resistant and the susceptible lines, the contents of chlorophyll a and chlorophyll b in the silencing plants were significantly less than in the control. However, no significant difference was found in the chlorophyll a/b and carotenoid contents. Further, the Fv/Fm was found to be decreased significantly in the silencing plants compared to the control in both types of lines. Taken together, we conclude that the silencing of GmFNR causes significant changes in the photosynthetic capacity of the resistant and susceptible lines. Next, we determined the H2O2 content and CAT activity in the control and the silencing plants of the resistant and the susceptible lines at 10 dpi. The results showed that the H2O2 content was increased significantly in the silencing plants of the susceptible line, whereas no change was observed in the resistant line compared to their respective controls. On the other hand, the CAT activity was found to be decreased significantly in both the resistant and the susceptible lines of the silencing plants compared to the in control. The H2O2 content and CAT activity of the control and the silencing plants of the resistant and the susceptible lines are presented in Figure 4.

3.4. Silencing Plants Response to SMV Infection

Phenotyping investigation was conducted in the silencing and the control plants of the resistant and the susceptible lines after SMV infection. The results showed that the silencing plants of the susceptible line developed mosaic, chlorotic, and wrinkled symptoms that were more severe than the control plants. In contrast, the phenotype of the silencing plants of the resistant lines were not clearly distinguishable from the control plants. We also evaluated the accumulation of SMV in inoculated and upper leaves at 0, 4, 7, 10, and 14 dpi using qRT-PCR and DAS-ELISA analyses. It revealed that the SMV NIa-protease transcript accumulation increased in the silencing plants of the resistant and the susceptible lines compared with their respective controls (Figure 5). However, the SMV NIa-protease transcript accumulation in the susceptible line was much higher than in the resistant line and a very low level of SMV NIa-protease transcripts were detected in the resistant line. Similar results were obtained in the DAS-ELISA analysis.

3.5. Proteins Interacting with GmFNR

A total of 71 proteins interacting with GmFNR (Table S1 and Figure S2) were identified. These proteins were annotated into the following three independent functional terms: biological processes (BP), molecular function (MF), and cellular components (CC). In biological processes, 13 categories, mostly related to photosynthesis, protein maturation by iron-sulfur cluster transfer, the generation of precursor metabolites and energy, and protein maturation. In molecular function, the 10 categories of molecular function are mainly related to oxidoreductase activity, metal ion binding, cation binding, 2 iron, 2 sulfur cluster binding, and metal iron-sulfur cluster binding. Eventually, the cellular component, 13 categories, mainly proteins, are found to be the oxidoreductase complex, the membrane protein complex, and photosystem II.

3.6. The Interaction between GmFNR and EF1A

Among the 71 proteins interacting with GmFNR, EF1A is the important one involved in virus replication. The BIFC assay was used to prove the interaction between GmFNR and EF1A. The GmFNR protein was tagged with a yellow fluorescent protein (YFP) C-terminal, and the EF1A protein was tagged with YFP N-terminal, then co-transfected into Agrobacteria EHA105 and infiltrated tobacco leaves. At the co-transformed tobacco leaves, a yellow fluorescent was observed in the plasma membrane, indicating that GmFNR interacts with EF1A (Figure 6). Further, we detected the gene expression of EF1A in silencing plants using qRT-PCR analysis. It revealed that EF1A was expressed highly in the silencing plants compared to the control (Figure 7) and coincided with the increase in SMV accumulation in the silencing plants.

4. Discussion

Virus infection causes many physiological, biochemical, and gene transcript changes in plants. Notably, it induces alterations in the photosynthetic apparatus in chloroplasts. These alterations could protect the development of mechanisms related to the plant’s defense or aid the virus susceptibility or lead to knock out the gene expression. In plants, the chloroplast is a key player in the cross-talk among photosynthesis, pathogen infection, and plant defense. Many photosynthesis-related genes were reported as increasingly expressed [19,20,21]. The reason might be these genes involved in the production of reducing power and metabolic intermediates.
Zhao et al. [22] reported that the chloroplast enzyme rubisco mediates the plant defense and is also involved in the antiviral defense. In this research, after SMV infection, the FNR expression was higher in resistance lines than susceptible lines during 2–6 hpi. This might be because FNR was recruited faster in resistance lines to produce reduction power. On the other hand, some reports show that chloroplast could protect viruses as shelters to avoid plant defense. Viruses could replicate and transform in chloroplast using the host resources, such as EF1A [23]. During the virus infection, photosynthesis-related genes were inhibited. The reason may be that the defense mediated by photosynthesis-related components were suppressed by the virus.
FNR is involved in NADPH production, carbon assimilation, antioxidation, and cross-talking among chloroplasts and mitochondria. Moreover, GAPDH is a key enzyme of the Calvin cycle involved in virus replication and movement [24]. The activity of this enzyme is inhibited by FNR [25]. The decreasing activity of FNR during viral infection might be a strategy to inhibit the energetic machinery of the plant defense system [26]. The chloroplast components interacting with the virus are involved in symptoms, replication, cell-to-cell movement, long-distance movement, and host defense [27]. The silencing of chloroplast-related genes alters the virus accumulation [28,29,30]. FNR was reported to be co-purified with host–virus complexes such as rice yellow mottle virus (RYMV) [31] and cereal yellow dwarf virus (CYDV) [32], suggesting the participation of the virus physiology process. However, little was reported about the FNR role during SMV infection in soybean.
Formerly, comprehensive proteomics analysis conducted from our research group found that the FNR protein corresponding to the Glyma.02g047600 (GmFNR) gene showed differential expression during SMV infection in resistance and susceptible lines [15]. Further, to understand this gene’s response during SMV infection, in the present study, we have silenced the GmFNR gene in resistant and susceptible lines and seen the different degrees of silencing efficiency in resistant and susceptible lines. The GmFNR expression level was decreased to 50% in the susceptible line and 40% in the resistant line when inoculated with the BPMV-GmFNR gene construct compared with the empty vector control (BPMV-EV). On different soybean genotypes, the efficiency of BPMV infection varies [33]. These results agree with the reports of Zhang et al. [12], who described that VIGS systems did not completely silence the target gene and that the degree of silencing could be related to the targeted region and experimental conditions. Foyer and Shigeoka [34] reported that the photosynthetic capacity decrease is associated with an increased ROS production. In the present study, the photosynthetic parameters (Chlorophyll content and Fv/Fm) were significantly reduced in the silencing plants. In contrast, the ROS production (H2O2 content) was increased or did not changed, confirming an inter-relationship between photosynthesis and ROS production. The decreased CAT activity in silencing plants compared to the control suggests that the silencing of GmFNR likely disturbs the antioxidant activity in plants and weakens the antioxidant defense system.
We have investigated the phenotypic changes and SMV Nia protease transcripts accumulation in both type of silencing plants after SMV infection. The SMV Nia-protease transcript accumulation in the susceptible line was much higher than the resistant line. The SMV Nia-protease transcripts level until the 14th day indicated clearly that the accumulation of virus had happened inside the cell, but some unknown mechanism had restricted the virus multiplication in the resistant line. Thus, the SMV level is very low in the resistant line and also did not influence the phenotype. At the same time, the multiplication and accumulation of the virus in the silencing plants of the susceptible line was high compared to the resistant line and that the unknown mechanism was absent in the susceptible line causes serious changes in the phenotype. It is also possible that some tissue-specific host tolerance mechanism in the resistant line is operating inside the plant, resulting in this inhibition of virus multiplication. The silencing of GmFNR may fade the plant defense mechanism in the susceptible line than the resistant line. We understood this fact by considering the phenotype and SMV accumulation level in the resistant line; also, we assume that that GmFNR may do not have a decisive role in SMV resistance.
Previously, several reports discussed the interplay between the FNR and different pathogens [28,29]. However, the exact mechanism and relationship between them are still unclear. We performed the yeast two-hybrid system and BIFC assay to know the relationship between FNR and SMV accumulation. As a result, 71 proteins interacting with GmFNR were identified. Among them, EF1A is the vital protein associated with virus replication. EF1A is an essential factor of the translation process. It catalyzes the GTP-dependent binding of aminoacyl-tRNA to the acceptor site on the 80S ribosome concomitant with the hydrolysis of GTP [35]. A virus replication complex (VRC) is formed in plant cells, associated with vesicles and targeting chloroplast envelope for replication and assembly [36,37]. Many reports confirmed the relationship between EF1A and VRC [38], and EF1A might be one of the VRC components [39]. Recently, Luan et al. [40] detailed the involvement of EF1A in SMV replication. In the present study, we confirmed that EF1A interacts with FNR using the Y2H and the BIFC assay. Additionally, the EF1A expression was upregulated in the FNR silencing plants, consistent with SMV NIa-protease transcripts accumulation. Taken together, we concluded that GmFNR was interacting with EF1A and coinciding with the increased SMV accumulation.

5. Conclusions

In the present study, we developed the BPMV-based gene construct (BPMV-GmFNR) and detailed the function of GmFNR gene in response to SMV in resistant and susceptible lines. Moreover, we also identified the proteins interacting with GmFNR. Collectively, the results obtained in this study could be helpful to understand the soybean FNR gene response during SMV infection and provide a novel insight into the SMV resistance mechanism.

Supplementary Materials

The following are available online at https://www.mdpi.com/article/10.3390/agronomy11081592/s1, Figure S1: Phylogenetic tree of GmFNR and other plants’ FNR genes, Figure S2: Gene ontology classification of proteins interacted with GmFNR, Table S1: 71 proteins interacting with GmFNR.

Author Contributions

Conceptualization, H.Z., L.W. and Y.S.; methodology, Y.S., L.W. and N.M.; data curation, J.Y. and Y.Y. (Yuan Yuan); writing—original draft preparation, Y.S.; writing—review and editing, A.K., Y.S. and Y.Y. (Yunhua Yang); supervision, H.Z., L.W. and A.K. All authors have read and agreed to the published version of the manuscript.

Funding

National Key R&D Program of China (2017YFD0101500), Jiangsu Collaborative Innovation Center for Modern Crop Production (JCIC-MCP), the Fundamental Research Funds for the Central Universities (KYT201801) and Program for Changjiang Scholars and Innovative Research Team in University (PCSIRT_17R55), and the National Soybean Industrial Technology System of China (CARS-004).

Data Availability Statement

All data presented in this study are provided either in the manuscript or additional files.

Conflicts of Interest

The authors declare that they have no conflict of interest.

References

  1. Hill, J. Soybean mosaic. In Compendium of Soybean Diseases, 4th ed.; Hartman, G.L., Sinclair, J.B., Rupe, J.C., Eds.; American Phytopathological Society: St. Paul, MN, USA, 2007; pp. 70–71. [Google Scholar]
  2. Liao, L.; Chen, P.; Buss, G.R.; Yang, Q.; Tolin, S.A. Inheritance and allelism of resistance to soybean mosaic virus in Zao18 soybean from China. J. Hered. 2002, 93, 447–452. [Google Scholar] [CrossRef] [PubMed] [Green Version]
  3. Li, K.; Yang, Q.H.; Zhi, H.J.; Gai, J.Y. Identification and distribution of soybean mosaic virus strains in southern China. Plant Dis. 2010, 94, 351–357. [Google Scholar] [CrossRef] [PubMed] [Green Version]
  4. Karthikeyan, A.; Li, K.; Jiang, H.; Ren, R.; Li, C.; Zhi, H.; Chen, S.; Gai, J. Inheritance, fine-mapping, and candidate gene analyses of resistance to soybean mosaic virus strain SC5 in soybean. Mol. Genet. Genom. 2017, 292, 811–822. [Google Scholar] [CrossRef] [PubMed]
  5. Karthikeyan, A.; Li, K.; Li, C.; Yin, J.; Li, N.; Yang, Y.; Song, Y.; Ren, R.; Zhi, H.; Gai, J. Fine-mapping and identifying candidate genes conferring resistance to Soybean mosaic virus strain SC20 in soybean. Theor. Appl. Genet. 2018, 131, 461–476. [Google Scholar] [CrossRef]
  6. Gao, L.; Sun, S.; Li, K.; Wang, L.; Hou, W.; Wu, C.; Zhi, H.; Han, T. Spatio-temporal characterisation of changes in the resistance of widely grown soybean cultivars to Soybean mosaic virus across a century of breeding in China. Crop Pasture Sci. 2018, 69, 395–405. [Google Scholar] [CrossRef]
  7. Schmutz, J.; Cannon, S.B.; Schlueter, J.; Ma, J.; Mitros, T.; Nelson, W.; Hyten, D.; Song, Q.; Thelen, J.; Cheng, J.; et al. Genome sequence of the palaeopolyploid soybean. Nature 2010, 463, 178–183. [Google Scholar] [CrossRef] [Green Version]
  8. Yamagishi, N.; Yoshikawa, N. Virus-induced gene silencing in soybean seeds and the emergence stage of soybean plants with Apple latent spherical virus vectors. Plant Mol. Biol. 2009, 71, 15–24. [Google Scholar] [CrossRef]
  9. Zhang, C.; Whitham, S.A.; Hill, J.H. Virus-induced gene silencing in soybean and common bean. Methods Mol Biol. 2013, 975, 149–156. [Google Scholar]
  10. Kim, K.H.; Lim, S.; Kang, Y.J.; Yoon, M.Y.; Nam, M.; Jun, T.H.; Seo, M.J.; Baek, S.B.; Lee, J.H.; Moon, J.K.; et al. Optimization of a Virus-Induced Gene Silencing System with Soybean yellow common mosaic virus for Gene Function Studies in Soybeans. Plant Pathol. 2016, 32, 112–122. [Google Scholar] [CrossRef]
  11. Zhao, F.; Lim, S.; Igori, D.; Yoo, R.H.; Kwon, S.Y.; Moon, J.S. Development of tobacco ringspot virus-based vectors for foreign gene expression and virus-induced gene silencing in a variety of plants. Virology 2016, 492, 166–178. [Google Scholar] [CrossRef]
  12. Zhang, C.; Grosic, S.; Whitham, S.A.; Hill, J.H. The requirement of multiple defense genes in soybean Rsv1-mediated extreme resistance to soybean mosaic virus. Mol. Plant Microbe Interact. 2012, 25, 1307–1313. [Google Scholar] [CrossRef]
  13. Luan, H.; Niu, H.; Luo, J.; Zhi, H. Soybean Cytochrome b5 Is a Restriction Factor for Soybean Mosaic Virus. Viruses 2019, 11, 546. [Google Scholar] [CrossRef] [Green Version]
  14. Kozuleva, M.; Goss, T.; Twachtmann, M.; Rudi, K.; Trapka, J.; Selinski, J.; Ivanov, B.; Garapati, P.; Steinhoff, H.-J.; Hase, T.; et al. Ferredoxin: NADP (H) oxidoreductase abundance and location influences redox poise and stress tolerance. Plant. Physiol. 2016, 172, 1480–1493. [Google Scholar] [CrossRef] [Green Version]
  15. Ma, N. Cellular Ultrastructure Analysis and Proteomics Study in Soybean Infected by Soybean Mosaic Virus; Nanjing Agriculture University: Nanjing, China, 2013. [Google Scholar]
  16. Zheng, G. Fine Mapping, Expression Analysis and Breeding Application of Resistance Genes to Soybean Mosaic Virus in Qihuang No.1; Nanjing Agriculture University: Nanjing, China, 2012. [Google Scholar]
  17. Costache, M.A.; Campeanu, G.; Neata, G. Studies concerning the extraction of chlorophyll and total carotenoids from vegetables. Rom. Biotechnol. Lett. 2012, 17, 7702–7708. [Google Scholar]
  18. Waadt, R.; Kudla, J.; Waadt, R.; Kudla, J. In planta visualization of protein interactions using bimolecular fluorescence complementation (BiFC). In Cold Spring Harbor Protocols 2008; Cold Spring Harbor Laboratory: Huntington, NY, USA, 2008. [Google Scholar] [CrossRef]
  19. Larson, R.L.; Wintermantel, W.M.; Hill, A.; Fortis, L.; Nunez, A. Proteome changes in sugar beet in response to Beet necrotic yellow vein virus. Physiol. Mol. Plant Pathol. 2008, 72, 62–72. [Google Scholar] [CrossRef]
  20. Wu, L.; Han, Z.; Wang, S.; Wang, X.; Sun, A.; Zu, X.; Chen, Y. Comparative proteomic analysis of the plant–virus interaction in resistant and susceptible ecotypes of maize infected with sugarcane mosaic virus. J. Proteom. 2013, 89, 124–140. [Google Scholar] [CrossRef]
  21. Li, K.; Xu, C.; Zhang, J. Proteome profile of maize (Zea Mays, L.) leaf tissue at the flowering stage after long-term adjustment to rice black-streaked dwarf virus infection. Gene 2011, 485, 106–113. [Google Scholar] [CrossRef]
  22. Zhao, J.; Liu, Q.; Zhang, H.; Jia, Q.; Hong, Y.; Liu, Y. The rubisco small subunit is involved in tobamovirus movement and Tm-22-mediated extreme resistance. Plant. Physiol. 2013, 161, 374–383. [Google Scholar] [CrossRef] [Green Version]
  23. Dube, A.; Bisaillon, M.; Perreault, J.P. Identification of proteins from Prunus persica that interact with peach latent mosaic viroid. J. Virol. 2009, 83, 12057–12067. [Google Scholar] [CrossRef] [Green Version]
  24. Kaido, M.; Abe, K.; Mine, A.; Hyodo, K.; Taniguchi, T.; Taniguchi, H.; Mise, K.; Okuno, T. GAPDH-A recruits a plant virus movement protein to cortical virus replication complexes to facilitate viral cell-to-cell movement. PLoS Pathog 2014, 10, e1004505. [Google Scholar] [CrossRef] [Green Version]
  25. Mekhalfi, M.; Puppo, C.; Avilan, L.; Lebrun, R.; Mansuelle, P.; Maberly, S.C.; Gontero, B. Glyceraldehyde-3-phosphate dehydrogenase is regulated by ferredoxin-NADP reductase in the diatom A sterionella Formosa. New Phytol. 2014, 203, 414–423. [Google Scholar] [CrossRef] [Green Version]
  26. Souza, P.F.; Garcia-Ruiz, H.; Carvalho, F.E. What proteomics can reveal about the plant–virus interactions? Photosynthesis-related proteins on the spotlight. Theor. Exp. Plant Physiol. 2019, 31, 227–248. [Google Scholar] [CrossRef]
  27. Zhao, J.; Zhang, X.; Hong, Y.; Liu, Y. Chloroplast in plant-virus interaction. Front. Microbiol. 2016, 7, 1565. [Google Scholar] [CrossRef] [Green Version]
  28. Abbink, T.E.; Peart, J.R.; Mos, T.N.; Baulcombe, D.C.; Bol, J.F.; Linthorst, H.J. Silencing of a gene encoding a protein component of the oxygen-evolving complex of photosystem II enhances virus replication in plants. Virology 2002, 295, 307–319. [Google Scholar] [CrossRef] [Green Version]
  29. Kong, L.; Wu, J.; Lu, L.; Xu, Y.; Zhou, X. Interaction between Rice stripe virus disease-specific protein and host PsbP enhances virus symptoms. Mol. Plant 2014, 7, 691–708. [Google Scholar] [CrossRef] [Green Version]
  30. Geng, C.; Yan, Z.Y.; Cheng, D.J.; Liu, J.; Tian, Y.-P.; Zhu, C.X.; Wang, H.-Y.; Li, X.-D. Tobacco vein banding mosaic virus 6K2 protein hijacks NbPsbO1 for virus replication. Sci. Rep. 2017, 7, 1–16. [Google Scholar] [CrossRef] [PubMed]
  31. Brizard, J.P.; Carapito, C.; Delalande, F.; Van Dorsselaer, A.; Brugidou, C. Proteome analysis of plant-virus interactome: Comprehensive data for virus multiplication inside their hosts. Mol. Cell. Proteom. 2006, 5, 2279–2297. [Google Scholar] [CrossRef] [Green Version]
  32. Cilia, M.; Peter, K.A.; Bereman, M.S.; Howe, K.; Fish, T.; Smith, D.; Gildow, F.; MacCoss, M.J.; Thannhauser, T.W.; Gray, S.M. Discovery and targeted LC-MS/MS of purified polerovirus reveals differences in the virus-host interactome associated with altered aphid transmission. PLoS ONE 2012, 7, e48177. [Google Scholar] [CrossRef]
  33. Giesler, L.J.; Ghabrial, S.A.; Hunt, T.E.; Hill, J.H. Bean pod mottle virus: A threat to US soybean production. Plant Dis. 2002, 86, 1280–1289. [Google Scholar] [CrossRef] [Green Version]
  34. Foyer, C.H.; Shigeoka, S. Understanding oxidative stress and antioxidant functions to enhance photosynthesis. Plant Physiol. 2011, 155, 93–100. [Google Scholar] [CrossRef] [Green Version]
  35. Kidou, S.; Ejiri, S. Isolation, characterization and mRNA expression of four cDNAs encoding translation elongation factor 1A from rice (Oryza sativa L.). Plant Mol. Biol. 1998, 36, 137–148. [Google Scholar] [CrossRef] [PubMed]
  36. Prod’Homme, D.; Jakubiec, A.; Tournier, V.; Drugeon, G.; Jupin, I. Targeting of the turnip yellow mosaic virus 66K replication protein to the chloroplast envelope is mediated by the 140K protein. J. Virol. 2003, 77, 9124–9135. [Google Scholar] [CrossRef] [PubMed] [Green Version]
  37. Torrance, L.; Cowan, G.H.; Gillespie, T.; Ziegler, A.; Lacomme, C. Barley stripe mosaic virus-encoded proteins triple-gene block 2 and γb localize to chloroplasts in virus-infected monocot and dicot plants, revealing hitherto-unknown roles in virus replication. J. Gen. Virol. 2006, 87, 2403–2411. [Google Scholar] [CrossRef] [PubMed]
  38. Thivierge, K.; Cotton, S.; Dufresne, P.J.; Mathieu, I.; Beauchemin, C.; Ide, C.; Fortin, M.G.; Laliberté, J.-F. Eukaryotic elongation factor 1A interacts with Turnip mosaic virus RNA-dependent RNA polymerase and VPg-Pro in virus-induced vesicles. Virology 2008, 377, 216–225. [Google Scholar] [CrossRef]
  39. Yamaji, Y.; Kobayashi, T.; Hamada, K.; Sakurai, K.; Yoshii, A.; Suzuki, M.; Namba, S.; Hibi, T. In vivo interaction between Tobacco mosaic virus RNA-dependent RNA polymerase and host translation elongation factor 1A. Virology 2006, 347, 100–108. [Google Scholar] [CrossRef] [Green Version]
  40. Luan, H.; Shine, M.; Cui, X.; Chen, X.; Ma, N.; Kachroo, P.; Zhi, H.; Kachroo, A. The potyviral P3 protein targets eukaryotic elongation factor 1A to promote the unfolded protein response and viral pathogenesis. Plant Physiol. 2016, 172, 221–234. [Google Scholar] [CrossRef] [Green Version]
Figure 1. The expression profile of GmFNR in resistant (R) and susceptible (S) lines after soybean mosaic virus infection at 0–24 h post inoculation (hpi). Y-axes indicate the ratios of relative fold expression levels between samples infected with soybean mosaic virus. “*” and “**” indicate the statistical significance at p < 0.05 and p < 0.01, t-test. Error bars indicate SD (n = 3).
Agronomy 11 01592 g001
Figure 2. Silencing of GmFNR in resistant (R) and susceptible (S) lines. (A) Symptoms of BPMV in R and S lines, (B) Relative expression of control (BPMV-EV) and silencing (BPMV-GmFNR) plants in R and S lines. “**” indicates the statistical significance at p < 0.01, t-test.
Agronomy 11 01592 g002
Figure 3. Photo pigments concentration and Fv/Fm in control (BPMV-EV) and silencing (BPMV-GmFNR) plants of resistant (R) and susceptible (S) lines at 10 days post inoculation (dpi). (A) Photo pigments concentration of resistant lines. (B) Fv/Fm in resistant lines. (C) Photo pigments concentration of susceptible lines. (D) Fv/Fm in susceptible lines. Chl a, Chlorophyll a; Chl b, Chlorophyll b; Car, carotenoid; Chl a/b, Chlorophyll a/b; Chl total, total Chlorophyll. “*” indicates the statistical significance at p < 0.05; “**”, p < 0.01; “***”, p < 0.001, t-test.
Agronomy 11 01592 g003
Figure 4. The CAT activity (A) and H2O2 content (B) of control (BPMV-EV) and silencing (BPMV-GmFNR) plants of resistant (R) and susceptible (S) lines at 10 days post inoculation (dpi). “**” and “***” indicate the statistical significance at p < 0.01 and p < 0.001, t-test.
Agronomy 11 01592 g004
Figure 5. Soybean mosaic virus (SMV) accumulation in control (BPMV-EV) and silencing (BPMV-GmFNR) plants of resistant (R) and susceptible (S) lines. (A) qRT-PCR analysis of SMV NIa protease transcripts (B) DAS-ELISA analysis of SMV NIa protease. Samples were collected at 0, 4, 7, 10, and 14 days post inoculation (dpi). Statistical significance “*” and “**” indicate p < 0.05 and p < 0.01, t-test.
Agronomy 11 01592 g005
Figure 6. Bimolecular fluorescence complementation (BIFC)-interaction of GmFNR and GmEF1A. The C-terminal half and the N-terminal half of YFP were fused to GmFNR and GmEF1A. GmEF1A-nYFP and GmFNR-cYFP were co-transformed into Nicotiana Benthamiana leaves, with nYFP † cYFP as control. YFP fluorescence was detected using a confocal microscope after infection for 2 d. Bars indicate 20 μm.
Agronomy 11 01592 g006
Figure 7. GmEF1A expression of control (BPMV-EV) and silencing (BPMV-GmFNR) plants. Bars indicate SD (n = 3).
Agronomy 11 01592 g007
Table 1. Primer sequences used in this study.
GenesForward PrimersReverse PrimersTm (℃)PCR Size (bp)
GmFNRaCTGGATCC CAAGAGAAAAGTCCTGTATGGCCA TGACACCATAATGTCAT58.0204
GmFNRbATGGCTGCTGCGGTTAATAGACTTCGACATTCCATTG53.01086
GmEF1AbATGGGTAAGGAAAAGACTCACATCACTTCTTCTTGGCAGCGGC58.01341
GmFNRcCCCAAGACCCCTTACATTGTCAATACCATCTGGAATT54.0154
GmEF1AcAGCGTGGTTTTGTTGCATCCCACAGCAAAACGACCAAGGG60.0317
TubulincGGAGTTCACAGAGGCAGAGCACTTACGCATCACATAGCA60.0189
a” Primers used for GmFNR silencing, “b” Primers used for full-length clone, and “c” primers used for qRT-PCR analysis.
Publisher’s Note: MDPI stays neutral with regard to jurisdictional claims in published maps and institutional affiliations.

