Article

Nitrogen Fractions in Soil Fertilized with Waste Organic Materials

by
Jadwiga Wierzbowska
1,
Stanisław Sienkiewicz
1,* and
Dariusz Załuski
2
1
Department of Agricultural and Environmental Chemistry, University of Warmia and Mazury, 10 719 Olsztyn, Poland
2
Department of Genetics, Plant Breeding and Bioresource Engineering, University of Warmia and Mazury, 10 719 Olsztyn, Poland
*
Author to whom correspondence should be addressed.
Agronomy 2021, 11(8), 1474; https://doi.org/10.3390/agronomy11081474
Submission received: 31 May 2021 / Revised: 16 July 2021 / Accepted: 20 July 2021 / Published: 25 July 2021

Abstract

:
The aim of the study was to determine the effect of sewage sludge and composts produced from sewage sludge and municipal waste on the content of various forms of nitrogen in soil. The field experiment was carried out in 2004–2015. It included three crop rotations of the following plants: potato, spring barley, winter oilseed rape and winter wheat. The experiment consisted of the following treatments: control (without fertilization), NPK, manure (FYM), compost from municipal sewage sludge and straw (CSSS), composted sewage sludge (CSS), dried and granulated sewage sludge (DGSS), “Dano” compost produced from unsorted municipal waste (CUMW) and compost from municipal green waste (CMGW). Manure, composts and sewage sludge were applied once (10 t ha−1 of d.m.) or twice (5 t ha−1 of d.m.) in a crop rotation. It was significantly shown that the highest N-total content was in the soil fertilized with CUMW (compost produced from unsorted municipal waste). The soil fertilized with manure (FYM) contained the highest quantity of N-min. The prevalent pool of nitrogen (82.65–86.52%) consisted of N compounds not undergoing acid hydrolysis, and their smallest share was determined in the soil fertilized with NPK alone.

1. Introduction

As well as being the major nutrient for all living organisms, nitrogen (N) plays a key role in the regulation of the composition, structure and functions of ecosystems [1,2]. In soil, this element mostly occurs in organic bonds, which differ in decomposability depending on their structure [3]. N-organic content in soil is important to the nutrition of plants and soil fertility as it influences the activity of microorganisms and availability of nutrients [4]. The easily hydrolysable N compounds, composing the so-called active N pool, participate in the rapid cycling of this element in soil [5]. The soil content of N is largely dependent on agrotechnology, mainly fertilization [6,7]. The N-total content of the topmost soil horizon under cultivated farmland ranges from 0.6 to 5 g kg−1, although it can reach as much as 25 g kg−1 in peat soils [8]. The N-total content is one of the parameters describing soil fertility in agricultural ecosystems [9]. The amount of this element in soil depends on several factors, for example soil use [10]. Thus far, numerous studies have been performed by many researchers, all failing to resolve unambiguously the question how agriculture, especially crop plantations, affects changes in the content of organic nitrogen in soils [9,10,11].
There is a constant growth in amounts of municipal, industrial and agricultural waste which could be used to improve the quality of soils or as a source of nutrients for plants. Converting such waste to fertilizers might at least partly reduce the demand for mineral fertilizers, enabling economic and environmental benefits [12,13,14,15]. Being able to recycle organic waste, containing carbon and minerals absorbed by plants which should then be re-directed to plant production, is one of the steps towards global sustainable development [14,16,17]. The amount of sewage sludge produced increases every year [18] and its content of organic matter and nutrients suggests that this waste material could be used for soil fertilization [19]. Sewage sludge may serve as a substrate for accumulating organic matter in soil, although its contribution to the formation of stable C and N fractions has not been thoroughly established. Sewage sludge and composts produced from various substrates added to the soil lead to a higher soil organic matter content and higher microbial activity and are nutrient sources for plants and can partially substitute mineral N [20,21,22,23]. However, excessive fertilization of soil with sewage sludge may result in overaccumulation of some potentially toxic elements, phytotoxicity and a threat to groundwater being polluted with nitrates or dissolved organic matter [24,25]. Nitrogen in organic fertilizers, e.g., in composts from sewage sludge, is mostly present in the organic form, while its mineral forms make up from a few to slightly over 20% of the total nitrogen content [26].
The aim of this study was to determine the effect of sewage sludge and composts made from sewage sludge as well as municipal waste applied once or twice in a crop rotation cycle on the content of different forms of nitrogen in soil.

2. Material and Methods

A field experiment was conducted in Bałcyny (53°35′49″ N 19°51′20″ E) in 2004–2015. It was set up on lessive soil underlain with glacial loam till [27]. The field experiment was carried out in 2004–2015. It included 3 crop rotations of the following plants: potato, spring barley, winter oilseed rape and winter wheat. Before the experiment, the soil content of soil organic carbon (SOC) was 7.63 g kg−1, N-total 640 mg kg−1 while the soil content of available P, K (Egner–Riehm method) and Mg (Schachtschabel method) was 45.10, 132.30 and 48.30 mg kg−1, respectively (28). The soil was slightly acidic in reaction (pH in extract of 1 mol KCl dm−3 was 5.70) and its hydrolytic acidity was 27.70 mmol(+) kg−1.
During the twelve years of the experiment, the soil was enriched with 30 t d.m.∙ha−1 of tested organic materials, that is 10 t d.m.∙ha−1 in each crop rotation cycle. All experimental treatments (except the control) were fertilized with N, P and K in the following amounts—industrial potato: N-150, P-28, K-166; spring barley: N-90, P-26, K-100; winter oilseed rape: N-120, P-42, K-134; winter wheat: N-90; P-26; K-100 kg ha−1. In the years when manure and the other organic materials were applied, depending on their N content, every dose of this element was supplemented to 150 kg N ha−1.
The experiment consisted of the following objects: control—without fertilization (C), NPK; manure (FYM), compost from municipal sewage sludge and straw (CSSS), composed sewage sludge, (CSS), dried and granulated sewage sludge (DGSS), “Dano” compost produced from unsorted municipal waste (CUMW) and compost from municipal green waste (CMGW). Manure, composts and sewage sludge were applied in each crop rotation cycle once before potato cultivating (10 t ha−1 of d.m.) or twice before potato and rape cultivating (5 t ha−1 of d.m.) in a crop rotation.
Main characteristics of the organic materials applied to soil in the experiment as well as doses of C-org. and N-total are given in Table 1. The content of dry matter in organic materials was determined with the oven drying method [28], while that of organic carbon was assayed after roasting a sample in a muffle furnace at 520 °C [29]. Having digested the organic materials in concentrated sulfuric(VI) acid, the content of N-total was determined according to the Kjeldahl method on a KjelFlex K-360 apparatus [30]. Soil pH was determined by potentiometry in solution of 1 mol KCl dm−3 [31], while the content of organic carbon was assayed on a Vario Max Cube CN Elementar analyzer. The tested organic materials applied to fertilize soil differed in content of heavy metals (Table 1). Compared to manure (FYM), compost made from urban green waste (CUGW) contained less copper (Cu) and zinc (Zn) (by 7 and 40%, respectively), and all composts and sewage sludge were less abundant in manganese (Mn). Composts and sewage sludge, however, contained higher amounts of the remaining heavy metals than manure. However, these were not amounts that would pose a risk of soil contamination.
Soil samples from the top horizon (0–20 cm) were collected after the third crop rotation cycle ended, i.e., after the harvest of winter wheat in 2015. Nitrogen fractions were separated sequentially [32], using solutions of 1% K2SO4 (to extract mineral forms of nitrogen) and 0.25 mol H2SO4 dm−3 and 2.5 mol H2SO4 dm−3 (3-h hot hydrolysis to separate organic nitrogen bonds readily and hardly hydrolyzed). This procedure led to the separation of the following forms (fractions) of soil nitrogen:
  • N-NH4—ammonium form of mineral nitrogen, after extraction with 1% K2SO4 determined with the direct Nesslerization method [33];
  • N-NO3—nitrate forms after extraction with 1% K2SO4 determined with the phenol-di-sulfate method [29];
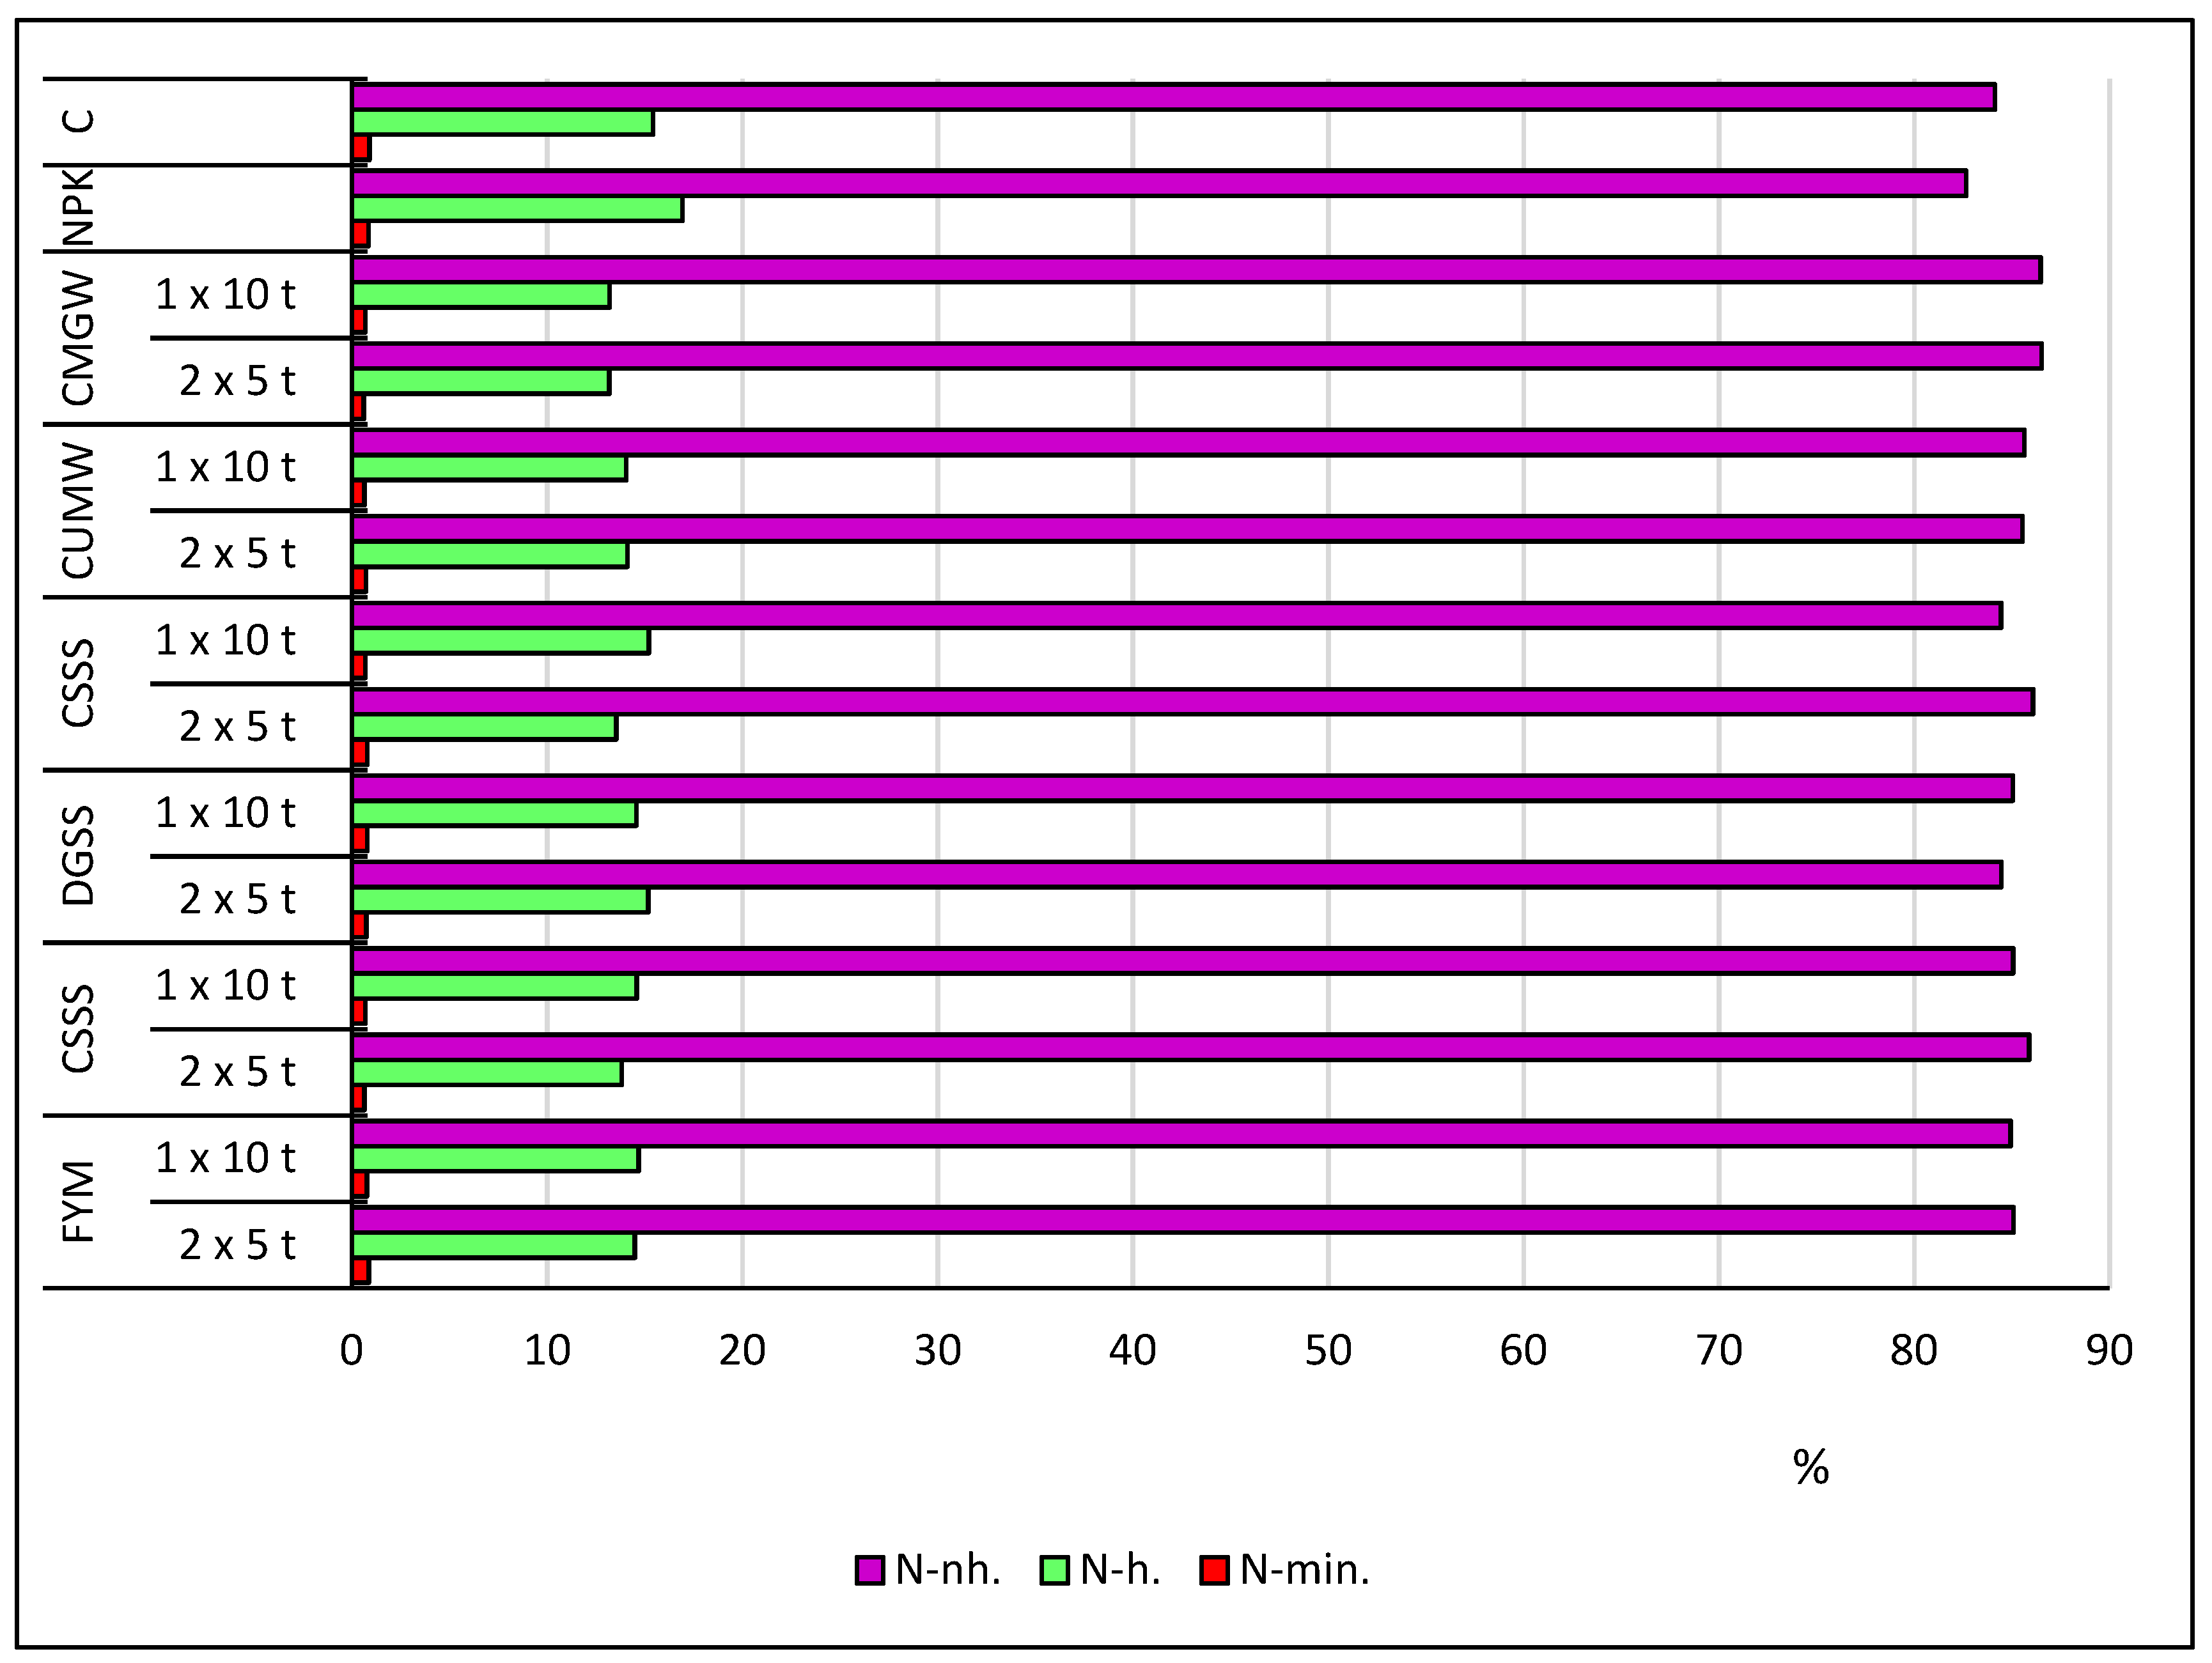
  • N-min.—nitrogen in mineral compounds: N-min. = N-NH4 + N-NO3;
  • N-eh—easily hydrolysable organic nitrogen, after hot hydrolysis in 0.25 mol H2SO4⋅dm−3;
  • N-hh—hardly hydrolysable nitrogen, after hot hydrolysis in 2.5 mol H2SO4·dm−3 and mineralization of the solution;
  • N-nh—non-hydrolysable organic nitrogen, remaining in soil material after extraction with 1% K2SO4 and two-step acid hydrolysis.
Two-step acid hydrolysis and soil mineralization to determine N-total were carried out on a BÜCHI Speed Digester K-439. Mineral forms of nitrogen (N-NH4 and N-NO3) were determined on a Shimadzu UV 1201V spectrophotometer, while the content of N-total and easily and hardly hydrolysable compounds were determined with the Kjeldahl distillation method on a KjelFlex K-360.
The results of all chemical analyses were processed statistically with the help of Statistica 13.3®. The Bonferroni test at the level of α = 0.05 was performed to verify the significance of differences.

3. Results and Discussion

The N-total content in soil before the experiment was 640 mg kg−1. After 12 years of the trials, significantly the lowest N-total content (634 mg N kg−1) was found in control soil (Figure 1 and Table 2). The total content of this element in soil fertilized only with mineral fertilizers was 720 mg N kg−1. The soil enriched with 30 t d.m. ha−1 of waste organic matter had the N-total content higher by 22–32% than that in the control soil and by 8–17% than in the NPK treated soil. Significantly, the highest amount of this form of nitrogen (832 mg N kg−1) was in soil fertilized with CUMW (Figure 1 and Table 3). The smallest increase in the content of N-total occurred in soil fertilized with CMGW (797 mg N kg−1). On average for the entire experiment, the frequency of organic matter application to soil (1 × 10 or 2 × 5 t d.m. ha−1 in a crop rotation cycle) did not have a significant effect on the N-total content. However, a significantly higher N-total content was found in soil fertilized with FYM or CSSS or DGSS when these materials were applied once per crop rotation (1 × 10 t d.m. ha−1) and with CSS and CMGW when these composts were supplied twice per crop rotation cycle (2 × 5 t d.m ha−1).
Fertilization with composts made from biowaste increased the N-total content in soil but had no effect on the net mineralization of N-organic [34,35]). The N-total content in soil tended to increase as the dose of a compost was increased. Long-term studies have demonstrated that mineral fertilization with a dose above 90 kg N ha−1 may result in the accumulation of N-total in soil [11]. On the other hand, Omara et al. [36] maintain that fertilization with cattle manure has a similar effect on the N-total content in soil as mineral fertilization does. According to Mazur and Mazur [37], it is both fertilization and type of soil that affect the soil content of total nitrogen. These researchers claim that long-term fertilization with organic and mineral substances repeated annually contributed to an increase in the soil content of N-total by 27.3% in luvisols and by as much as 48.4% in brown soils.
The content of N-NH4 ranged from 2.60 to 3.34 mg N kg−1 of soil (Figure 2). Significantly less of this form of N was determined in soil fertilized once in a crop rotation with a dose of 10 t d.m. ha−1 CUMW, whereas the maximum (highest percent increase or value) was detected in soil treated with mineral fertilizers (NPK) alone (Table 2). The frequency of fertilizer application (1 × 10 or 2 × 5 t d.m. ha−1) significantly differentiated the content of N-NH4 in soil (Table 3). There was more N-NH4 in the soil fertilized twice in a crop rotation with 5 t d.m. ha−1 of CSS or CUMW each time than in the soil supplied once in a crop rotation with 10 t d.m. ha−1 of these fertilizers. A higher soil content of this nitrogen form was obtained when a dose of 10 t d.m. ha−1 of manure or of the remaining organic materials was applied once in a crop rotation cycle.
The content of N-NO3 varied from 2.22 to 4.12 mg N kg−1 of soil (Figure 2). The content of N-NO3 varied from 2.22 to 4.12 mg N kg−1 of soil (Figure 2). Significantly the lowest content of this nitrogen form was in the soil fertilized twice in a crop rotation with 5 t d.m. ha−1 of CMGW. It was by 29% less than in the control soil and by 21% less than in the soil fertilized with NPK. Whereas the highest amount of this nitrogen form was determined in the soil fertilized twice in a crop rotation with a dose of 5 t d.m. ha−1 of FYM (Table 2). When comparing waste materials used as soil fertilizers (Table 3), it was found that significantly the least N-NO3 (2.28 mg N kg−1) was present in the soil fertilized with CMGW, and the most in the soil fertilized with manure (about 60% more than in the soil fertilized with CMGW). Significantly more of this nitrogen form was detected in the soil fertilized with organic materials applied in a split dose twice in a crop rotation cycle.
The content of N-min. in soil ranged from 4.90 to 6.94 mg N kg−1 (Figure 2). The most mineral nitrogen was found in the soil fertilized with FYM twice during a crop rotation cycle, with 5 t d.m. ha−1 each time (this soil contained by 20% more of mineral nitrogen than the control soil or the soil with exclusive NPK fertilization). The least content of N-min. was detected in the soil fertilized twice in a crop rotation with 5 t d.m. ha−1 CMGW each time, where the amount of this nitrogen form was by 17% lower than in the control soil and by 20% lower than in the NPK fertilized soil (Table 2). Organic materials added to soil had a significant effect on the soil content of mineral nitrogen (Table 3). Significantly, the least N-min. was in the soil fertilized with CMGW (5.05 mg kg−1 on average), while its highest content was in the soil treated with manure (6.66 mg kg−1 on average).
Significantly, the least easily hydrolysable nitrogen was determined in the control soil and in the soil fertilized twice in a crop rotation with 5 t d.m. ha−1 of manure each time: an average 78.9 and 80.4 mg kg−1, respectively (Table 2 and Figure 2). The highest content of this nitrogen form was detected in the soil fertilized once in a crop rotation with 10 t d.m. ha−1 DGSS (106 mg kg−1). Organic substances used to fertilize soil significantly differentiated the content of this form of nitrogen. Significantly the highest amount of easily hydrolysable nitrogen (105 mg kg−1 on average) was found in the soil treated with DGSS. Higher amounts of easily hydrolysable nitrogen were determined in the soil where organic materials were applied once in a crop rotation in a dose of 10 t d.m. ha−1.
Significantly, the lowest content of hardly hydrolysable nitrogen (8.82 mg kg−1) was determined in the soil fertilized twice in a crop rotation with 5 t d.m ha−1 of CMGW each time. This content was twice as low as in the control soil and as much as 3.5-fold lower than in the soil fertilized only with NPK (Figure 2 and Table 2). The highest content of this nitrogen form (36.12 mg kg−1) was in the soil fertilized twice in a crop rotation with 5 t d.m. ha−1 of manure each time. Comparison of the long-term application of waste organic materials on the content of hardly hydrolysable N compounds in soil showed that significantly the highest (31.22 mg kg−1 on average) amounts of this nitrogen form were in the soil fertilized with manure, while the lowest content of such nitrogen (10.15 mg kg−1 on average) accumulated in the soil treated with CMGW (Figure 2 and Table 3). The soil under the other objects fertilized with organic substances contained from 17.50 to 19.95 mg kg−1 of hardly hydrolysable nitrogen.
Significantly, the lowest N bound in non-hydrolysable compounds (533 mg kg−1) was in the control soil (Figure 2 and Table 2). Meanwhile, fertilization of soil with organic waste materials resulted in an increase in the content of N bound in non-hydrolysable compounds by 25.7–35.5% in comparison with the control and by 12.6–21.2% relative to the object fertilized only with NPK. It was demonstrated that most N in non-hydrolysable compounds (712 mg kg−1 on average) was in the soil fertilized with CUMW, whereas the lowest concentration of this nitrogen form was in the soil fertilized with FYM or with CMGW (691 and 689 mg kg−1, respectively)—Figure 2 and Table 3. Significantly more of this N form was in the soil fertilized with organic materials twice in a crop rotation, with a dose of 5 t d.m. ha−1 each time, than in the soil fertilized with 10 t d.m. ha−1 once during a crop rotation.
Mineralization of N-organic is an important indicator that helps to determine the annual amount of sewage sludge which can be used for agricultural purposes [38]. In the research cited above, total mineralization increased at a higher dose of sewage sludge, but net mineralization decreased, most probably due to losses caused by denitrification. Because of the slow release of N from some organic fertilizers, their effect on the growth of plant in the year they are applied is found to be small [12]. Another possible development is the immobilization of N, leading to the enrichment of the nitrogen pool in soil, which consequently enhances the long-term effect of organic fertilizers. The short-term availability of nitrogen from organic fertilizers depends on the content of N-total and N-NH4, the C:N ratio and on the stability of organic substances. Composting diminishes the content of mineral nitrogen and improves the stability of organic substances. In contrast, anaerobic fermentation increased the content of NH4-N and stability of organic matter, while a narrower C:N ratio means that the product of anaerobic fermentation has a high content of N directly available to plants [39]. When organic fertilizers are applied over a long time, the effectiveness of using the nitrogen they contain, expressed as an equivalent of mineral fertilizers, is 40–70% [12]. Excessive organic fertilization can lead to an insufficient amount of nitrogen and the accumulation of phosphorus and/or potassium in soil, which may be hazardous to the environment [40,41]. The content of N-min. in soil tends to increase as the doses of mineral nitrogen fertilizers increase and the risk of nitrogen leaching from soil is higher. Organic fertilization helps to maintain the biogenic balance of soil, improve its physicochemical properties and reduce the soil leaching of N-min. Most N-organic in soil is present in biological forms, mostly polypeptides, amino acids, amino sugars and their residual forms [42]. The main source of nitrogen for plants are organic fractions of N (amino sugars and amino acids) as well as easily hydrolysable NH4–N [4,43,44]. Decomposition of organic nitrogen compounds leads to their mineralization and release of the N forms taken up by plants (NH4+ and NO3).
Organic fertilizers are a valuable source of nitrogen for plants, and the rate of mineralization of organic nitrogen compounds depends on the type of fertilizer [45]. Organic fertilization greatly improved the content of total, mineral and organic nitrogen in the soil profile [46], e.g., manure and slurry contributed to a rise in the content of N-total and hydrolysable nitrogen in 6 M HCl more than mineral fertilizers did. In the studies by Gonet and Dębska [47], the application of slurry and NPK raised the concentrations of soluble compounds of nitrogen in the topmost layer of soil, whereas their content in the soil’s deeper horizons did not depend on the type of fertilization. Mazur and Mazur [37] demonstrated that an annual application of organic and mineral fertilizers was more effective than exclusive mineral fertilization in inducing an increase in the soil content of hydrolysable nitrogen by 48.4% in luvisols and by 51.3% in brown soils. Combined organic and mineral fertilization leads to a larger increase in the soil content of N-total as well as N-hydrolysable and N-non-hydrolysable than the application of mineral fertilizers alone [48]. The application of fertilizers and organic waste resulted in an increased content of easily hydrolysable nitrogen in comparison to its amount in unfertilized soil [49]. Combined application of mineral fertilizers, clinoptilolite zeolite and compost produced from plant waste raised the soil content of N-total, including N-hydrolysable, N-organic, exchangeable N-NH4 and N-NO3, more than mineral fertilizers did [15]. Rathi et al. [50] showed that fertilization with NPK+FYM raised the soil content of N bound in the following fractions: N-hydrolysable, hydrolysable ammoniacal nitrogen, N-inorganic, N-hexosoamine, N-hydroamine, N-amino-acid, unidentified N-hydrolysable and N-nonhydrolyzable, which in turn raised the soil content of N-total.
Soil tillage treatments cause changes in the content and quality of the active organic fraction of nitrogen and N supply in soil, and these modifications should be taken into consideration when optimizing nitrogen fertilization [51,52]. The content of phytoavailable N fractions largely depended on the land use, whereas the content of the stable N fraction was mainly determined by the type of soil [53].
Organic-mineral bonds on reactive surfaces (silicates, pedogenic oxides and organic substances extracted with alkali) are the major factors that enable the hydrolysis of large amounts of N-organic, including peptides [54]. In soil located in the temperate climate zone, about a third of the applied N is immobilized and retained in organic forms at the end of a plant growing season [4]. A considerable portion of newly immobilized N is unavailable to microorganisms and plants, same as N contained in native soil humus. Stabilization processes, most probably including polymerization of amino compounds and polyphenols, lead to the inclusion of N into humic substances while simultaneously decreasing its availability. According to Cao et al. [55], microorganisms decomposing post-harvest residues use C-org. as a source of energy and need N to build their organisms, which means that N becomes immobilized in biomass. Nitrogen can also be incorporated in soil organic matter through the binding of an NH4+ ion by clay minerals, condensation of NH3 with phenolic rings or quinone rings and through the nitrosation of phenolic groups. Biotic and abiotic immobilization of N largely depends on properties of soil and plant residues. If a large proportion of C-org. appears in labile organic compounds, biotic immobilization of N may play an important role. In turn, a large content of phenolic compounds originating from lignin or other organic substances which are difficult to decompose favor the abiotic immobilization of nitrogen. In soil fertilized with organic waste, some of the non-hydrolysable N compounds accumulated in it can derive from hardly decomposable compounds present in biological waste submitted to anaerobic fermentation [13].
After the harvest of winter wheat, the share of bound N in the determined fractions only slightly depended on the type of fertilization (Figure 3). Nitrogen in the form of mineral compounds represented just 0.63 to 0.91% of the total content of this element in soil. Between 13.18 to 16.93% of nitrogen was bound in (easily + hardly) hydrolysable compounds. The highest percentage of hydrolysable nitrogen was determined in the soil fertilized only with mineral fertilizers, while the smallest share was determined in the soil fertilized with CMGW. The dominant share of nitrogen (82.65–86.52%) consisted of compounds resistant to acid hydrolysis. The least of this form of nitrogen was found in the soil from the NPK variant, while its highest percentage was in the soil enriched with CMGW.
According to Mazur and Mazur [37], the structure of N compounds in soil depends on both the type of applied fertilization and the type of soil. The share of hydrolysable N compounds determined in their experiment was 59.7% in luvisols and 63.3% in brown soils. An increase in the content of organic nitrogen forms and ammoniacal nitrogen depended mainly on the application of organic fertilizers, especially manure [46]. The dominant hydrolysable nitrogen compound was amino acid nitrogen (77%), while amino sugar nitrogen made up only 5.6%. The content of hydrolysable nitrogen and its share in N-total decreased with the depth into the soil profile. As a result of the application of compost, the percentages of non-hydrolysable and amino sugar nitrogen increased, while those of hydrolysable N-NH4 and nitrogen in unidentified compounds decreased [35]. Fertilization with compost, however, did not have any influence on the share of amino acid nitrogen in the total content of nitrogen in soil. The highest concentration and percentage of N-organic was in the clay fraction (CLA), which indicates that this soil fraction deserves special attention as an important pool of N-organic.
The prevalence of biotic or abiotic immobilization of N originating from post-harvest residues depends on the C:N ratio and N availability in soil [55]. Moreover, the availability of nitrogen is also affected by the soil pH. Mechanisms of nitrogen immobilization determine the fate of immobilized nitrogen and are fundamental to the management of nitrogen availability and nitrogen losses through binding nitrogen from a fertilizer with decomposing post-harvest residues. The course and efficiency of mineralization of organic nitrogen compounds are largely shaped by the soil moisture content, temperature, reaction and type, the soil content of organic carbon and the form of the applied nitrogen fertilizer [56]. One of the sources of nitrogen for plants is the organic nitrogen mineralized during the plant growing season [57].
The content of C-org. in soil did not have a significant (p = 0.09) effect on the content of N-min. (Figure 4). However, concentrations of hydrolysable N, non-hydrolysable N and total N were significantly correlated with the content of C-org. (r = 0.35, r = 0.67 and r = 0.67, respectively).
The content of N-min. in soil was negatively correlated (r2 = −0.49; p = 0.003) with pH of soil measured in 1 mol KCl dm−3 (Figure 5). The soil content of N-nonhydrolyzable and N-total increased as the soil pH increased (r = 0.36; p = 0.02 and r = 0.35; p = 0.02, respectively). The soil content of N-hydrolysable only slightly depended on the soil pH (r = −0.10; p = 0.52). The organic substances added to soil in a dose of 30 t ha−1 over a period of 12 years increased the soil content of N-total by 22–23% compared to the control soil and by 8–17% relative to the soil fertilized with mineral substances.

4. Conclusions

The organic substances tested in this experiment: manure (FYM), compost from municipal sewage sludge and straw (CSSS), composted sewage sludge (CSS), dried and granulated sewage sludge (DGSS), “Dano” compost from unsorted municipal waste (CUMW) and compost from green waste (CMGW), applied every two years (5 t ha−1 d.m.) or every four years (10 t ha−1 d.m.) produced different effects on the content of total nitrogen and nitrogen fractions in soil. On average, the highest total nitrogen content was found in the CUMW fertilized soil, and the frequency of applying organic materials to the soil did not affect the content of this element in the soil. It was found that the soil fertilized with manure contained the highest N-min., while the same soil contained the least easily hydrolysable nitrogen in relation to the soil fertilized with the other organic materials (especially twice fertilized in a crop rotation). This finding may indicate that organic compounds contained in manure, which readily underwent mineralization, enriched the soil pool of mineral nitrogen, while the others remained in fractions less easily mineralized. This hypothesis is corroborated by the distinctly highest content of hardly hydrolysable N in soil fertilized with manure every two years. Relatively much of this N form was determined in soil fertilized with NPK, and significantly the lowest content of this N fraction was found in soil fertilized twice in a crop rotation cycle with a dose of 5 t d.m. ha−1 CMGW. This may suggest that organic compounds found in CMGW proved to undergo mineralization more easily and left less nitrogen in soil in the form that was difficult to hydrolyze. Fertilization of soil with waste organic matter yielded a very positive effect such as an increase in the content of N bound in non-hydrolysable compounds (by 25.7–35.3% more than in the control and by 12.6–21.2% more than in the variant fertilized only with NPK). This suggests that soil needs to be enriched with organic materials in order to renew the soil stock of organic matter which undergoes mineralization. The N-min. content in soil corresponded to merely 0.63–0.91% of the total content of this element in soil. The prevalent pool of nitrogen (82.65–86.52%) consisted of N compounds not undergoing acid hydrolysis, and their smallest share was determined in the soil fertilized with NPK alone. In conclusion, incorporation of organic matter in soils used for farming ought to be the responsibility of every farmer.

Author Contributions

Conceptualization, J.W. and S.S.; methodology, J.W. and S.S.; software D.Z., validation, S.S., J.W. and D.Z., formal analysis, J.W., S.S. and D.Z., investigation, J.W. and S.S.; resources, S.S. and J.W., data curation J.W., S.S. and D.Z., writing—original draft preparation, J.W. and S.S.; writing—review and editing, S.S. and J.W., visualization, J.W., S.S. and D.Z.; project administration, J.W. and S.S.; funding acquisition, S.S. and J.W. All authors have read and agreed to the published version of the manuscript.

Funding

The results presented in this paper were obtained as a part of a part of a comprehensive study financed by the University of Warmia and Mazury in Olsztyn, Faculty of Agriculture and Forestry, Department of Agricultural and Environmental Chemistry (grant No. 30.610.003-110). The project was financially supported by the Minister of Science and Higher Education in the range of the program entitled “Regional Initiative of Excellence” for the years 2019–2022, Project No. 010/RID/2018/19, amount of founding 12,000,000 PLN.

Data Availability Statement

The results of these studies are also included in other articles:
  • Wierzbowska, J., Kovačik, P., Sienkiewicz, S. Krzebietke S. Bowszys T. 2018. Determination of heavy metals and their availability to plants in soil fertilized with different waste substances. Environ Monit Assess 190, 567. https://doi.org/10.1007/s10661-018-6941-7.
  • Wierzbowska, J., Sienkiewicz, S., Krzebietke, S. Bowszys T. 2016. Heavy Metals in Water Percolating Through Soil Fertilized with Biodegradable Waste Materials. Water Air Soil Pollut 227, 456 (2016). https://doi.org/10.1007/s11270-016-3147-x.
  • Wierzbowska, J., Sienkiewicz, S., Sternik, P., & Bowszys, T. 2016. Content of macroelements in leachate from soils fertilized with organic materials. Fresenius Environmental Bulletin, 25, 6132–6138.
  • Bowszys, T., Wierzbowska, J., Sternik, P., Busse, M. K. 2015. Effect of the application of sewage sludge compost on the content and leaching of zinc and copper from soils under agricultural use. Journal of Ecological Engineering, 16(1), 1-7. https://doi.org/10.12911/22998993/580.

Conflicts of Interest

The authors declare no conflict of interest.

References

  1. Leip, A.; Marchi, G.; Koeble, R.; Kempen, M.; Britz, W.; Li, C. Linking an economic model for European agriculture with a mechanistic model to estimate nitrogen and carbon losses from arable soils in Europe. Biogeosciences 2008, 5, 73–94. [Google Scholar] [CrossRef] [Green Version]
  2. Fang, Y.T.; Yoh, M.; Mo, J.M.; Gundersen, P.; Zhou, G.Y. Response of nitrogen leaching to nitrogen deposition in disturbed and mature forests of Southern China. Pedosphere 2009, 19, 111–120. [Google Scholar] [CrossRef]
  3. Murphy, O.V.; Macdonald, A.J.; Stockdale, K.W.T.; Goulding, K.W.T.; Fortune, S.; Gaunt, J.L.; Poulton, P.R.; Wakefield, J.A.; Webster, C.P.; Wilmf, R.W.S. Soluble organic nitrogen in agricultural soils. Biol. Fertil. Soils 2000, 30, 374–387. [Google Scholar] [CrossRef]
  4. Kelley, K.R.; Stevenson, F.J. Forms and nature of organic N in soil. Fertil. Res. 1995, 42, 1–11. [Google Scholar] [CrossRef]
  5. Deng, S.P.; Moore, J.M.; Tabatabai, M.A. Characterization of active nitrogen pools in soils under different cropping systems. Biol. Fertil. Soils 2000, 32, 302–309. [Google Scholar] [CrossRef]
  6. Fang, Y.T.; Gundersen, P.; Mo, J.M.; Zhu, W.X. Input and output of dissolved organic and inorganic nitrogen in subtropical forests of South China under high air pollution. Biogeosciences 2008, 5, 339–352. [Google Scholar] [CrossRef] [Green Version]
  7. Zhang, J.; Blackmer, A.M.; Blackmer, T.M. Differences in physiological age affect diagnosis of nitrogen deficiencies in cornfields. Pedosphere 2008, 18, 45–553. [Google Scholar] [CrossRef]
  8. Bremner, J.M.; Mulvaney, C.S. Nitrogen-Total. In Methods of Soil Analysis. Part 2. Chemical and Microbiological Properties; Page, A.L., Miller, R.H., Keeney, D.R., Eds.; American Society of Agronomy, Soil Science Society of America: Madison, WI, USA, 1982; pp. 595–624. [Google Scholar]
  9. Wang, Y.; Zhang, X.; Huang, C. Spatial variability of soil total nitrogen and soil total phosphorus under different land uses in a small watershed on the Loess Plateau, China. Geoderma 2009, 150, 141–149. [Google Scholar] [CrossRef]
  10. Xu, G.; Li, Z.; Li, P. Fractal features of soil particle-size distribution and total soil nitrogen distribution in a typical watershed in the source area of the middle Dan River, China. Catena 2013, 101, 17–23. [Google Scholar] [CrossRef]
  11. Aula, L.; Macnack, N.; Omara, P.; Mullock, J.; Raun, W. Effect of fertilizer nitrogen (N) on soil organic carbon, total N, and soil pH in long-term continuous winter wheat (Triticum aestivum L.). Commun. Soil Sci. Plant Anal. 2016, 47, 863–874. [Google Scholar] [CrossRef]
  12. Gutser, R.; Ebertseder, T.H.; Weber, A.; Schraml, M.; Schmidhalter, U. Short-term and residual availability of nitrogen after long-term application of organic fertilizers on arable land. J. Plant Nutr. Soil Sci. 2005, 168, 439–446. [Google Scholar] [CrossRef]
  13. Pan, W.L.; Port, L.E.; Xiao, Y.; Bary, A.I.; Cogger, C.G. Soil Carbon and Nitrogen Fraction Accumulation with Long-Term Biosolids Applications. Soil Sci. Soc. Am. J. 2017, 81, 1381–1388. [Google Scholar] [CrossRef] [Green Version]
  14. Omar, L.; Ahmed, O.H.; Jalloh, M.B.; Nik Muhamad, A.M. Soil Nitrogen Fractions, Nitrogen Use Efficiency and Yield of Zea mays L. Grown on a Tropical Acid Soil Treated with Composts and Clinoptilolite Zeolite. Appl. Sci. 2020, 10, 4139. [Google Scholar] [CrossRef]
  15. Yang, L.; Bai, J.; Liu, J.; Zeng, N.; Cao, W. Green Manuring Effect on Changes of Soil Nitrogen Fractions, Maize Growth, and Nutrient Uptake. Agronomy 2018, 8, 261. [Google Scholar] [CrossRef] [Green Version]
  16. Elsalam, H.E.A.; El-Sharnouby, M.E.; Mohamed, A.E.; Raafat, B.M.; El-Gamal, E.H. Effect of Sewage Sludge Compost Usage on Corn and Faba Bean Growth, Carbon and Nitrogen Forms in Plants and Soil. Agronomy 2021, 11, 628. [Google Scholar] [CrossRef]
  17. Rodrigues Prates, A.; Renée Coscione, A.; Carvalho Minhoto Teixeira Filho, M.; Gasparoti Miranda, B.; Arf, O.; Hamilton Abreu-Junior, C.; Carvalho Oliveira, F.; Moreira, A.; Shintate Galindo, F.; Márcia Pereira Sartori, M. Composted Sewage Sludge Enhances Soybean Production and Agronomic Performance in Naturally Infertile Soils (Cerrado Region, Brazil). Agronomy 2020, 10, 1677. [Google Scholar] [CrossRef]
  18. Statistics Poland. Environment 2019. Available online: https://stat.gov.pl/en/topics/environment-energy/environment/environment-2019,1,11.html# (accessed on 1 May 2021). (In Polish)
  19. Roiga, N.; Sierra, J.; Martíc, E.; Nadalb, M.; Schuhmachera, M.; Domingob, J.L. Long-term amendment of Spanish soils with sewage sludge: Effects on soil functioning. Agric. Ecosyst. Environ. 2012, 158, 41–48. [Google Scholar] [CrossRef]
  20. Poulsen, P.H.B.; Magid, J.; Luxhøi, J.; de Neergaard, A. Effects of fertilization with urban and agricultural organic wastes in a field trial–Waste imprint on soil microbial activity. Soil Biol. Biochem. 2013, 57, 794–802. [Google Scholar] [CrossRef]
  21. Börjesson, G.; Kätterer, T. Soil fertility effects of repeated application of sewage sludge in two 30-year-old field experiments. Nutr. Cycl. Agroecosyst. 2018, 112, 369–385. [Google Scholar] [CrossRef] [Green Version]
  22. Kurzemann, F.R.; Plieger, U.; Probst, M.; Spiegel, H.; Sandén, T.; Ros, M.; Insam, H. Long-Term Fertilization Affects Soil Microbiota, Improves Yield and Benefits Soil. Agronomy 2020, 10, 1664. [Google Scholar] [CrossRef]
  23. Schröder, C.; Häfner, F.; Larsen, O.C.; Krause, A. Urban Organic Waste for Urban Farming: Growing Lettuce Using Vermicompost and Thermophilic Compost. Agronomy 2021, 11, 1175. [Google Scholar] [CrossRef]
  24. Sądej, W.; Bowszys, T.; Namiotko, A. Leaching of nitrogen forms from soil fertilized with sewage sludge. Ecol. Chem Eng. A 2009, 16, 1001–1008. [Google Scholar]
  25. Wierzbowska, J.; Sienkiewicz, S.; Sternik, P.; Bowszys, T. Content of macroelements in leachate from soils fertilised with organic materials. Fresen. Environ. Bull. 2016, 25, 6132–6138. [Google Scholar]
  26. Krzywy-Gawrońska, E. Changes in the content of total, nitrate and ammonium nitrogen in mass of composted municipal sewage sludge and potato pulp during decomposition process. Zesz. Probl. Post Nauk. Rol. 2006, 513, 243–249. (In Polish) [Google Scholar]
  27. Iuss Working Group Wrb. World Reference Base for Soil Resources 2014. International Soil Classification System for Naming Soils and Creating Legends for Soil Maps; World Soil Resources Reports 106; Iuss Working Group Wrb: Rome, Italy, 2015; p. 188. [Google Scholar]
  28. PN-EN 15934:2013-02E. Sewage Sludge, Treated Bio-Waste, Soil and Waste–Determination of Dry Matter by Determining the Dry Residue Content or Water Content; The Polish Committee for Standardization: Warsaw, Poland, 2013; p. 22. (In Polish) [Google Scholar]
  29. PN-EN 15936:2013-02E. Sewage Sludge, Treated Bio-Waste, Soil and Waste–Determination of Total Organic Carbon (TOC) after Dry Combustion; The Polish Committee for Standardization: Warsaw, Poland, 2013; p. 28. (In Polish) [Google Scholar]
  30. Ostrowska, A.; Gawliński, S.; Szczubiałka, Z. Methods of Analysis and Evaluation of the Properties of Soils and Plants; The Institute of Environmental Protection: Warsaw, Poland, 1991; p. 334. (In Polish) [Google Scholar]
  31. PN-ISO 10390:1997. Soil Quality–Determination of pH; The Polish Committee for Standardization: Warsaw, Poland, 1997; p. 15. (In Polish) [Google Scholar]
  32. Kalembasa, S. Use Of 15 N and 13 N Isotopes in Soil Science and Agricultural Chemistry Researchs; WNT: Warsaw, Poland, 1995; p. 251. (In Polish) [Google Scholar]
  33. PN-R-04028:1997. Chemical and Agricultural Analysis of Soil. Method of Sampling and Determination of The Content of Nitrate and Ammonium Ions in Mineral Soils; The Polish Committee For Standardization: Warsaw, Poland, 1997; p. 5. (In Polish) [Google Scholar]
  34. Emmerling, C.; Udelhoven, T.; Schneider, R. Long-lasting impact of biowaste-compost application in agriculture on soil-quality parameters in three different crop-rotation systems. J. Plant Nutr. Soil Sci. 2010, 173, 391–398. [Google Scholar] [CrossRef]
  35. Nguyen, T.; Shindo, H. Effects of different levels of compost application on amounts and distribution of organic nitrogen forms in soil particle size fractions subjected mainly to double cropping. Agric. Sci. 2011, 2, 213–219. [Google Scholar] [CrossRef] [Green Version]
  36. Omara, P.; Aula, L.; Raun, W.R. Nitrogen Uptake Efficiency and Total Soil Nitrogen Accumulation in Long-Term Beef Manure and Inorganic Fertilizer Application. Int. J. Agron. 2019, 2019, 9594369. [Google Scholar] [CrossRef]
  37. Mazur, Z.; Mazur, T. Effects of Long-Term Organic and Mineral Fertilizer Applications on Soil Nitrogen Content. Pol. J. Environ. Stud. 2015, 24, 2073–2078. [Google Scholar] [CrossRef]
  38. Hernández, T.; Moralb, R.; Perez-Espinosab, A.; Moreno-Casellesb, J.; Perez-Murciab, M.D.; Garcíaa, C. Nitrogen mineralisation potential in calcareous soils amended with sewage sludge. Bioresour. Technol. 2002, 83, 213–219. [Google Scholar] [CrossRef]
  39. Sienkiewicz, S.; Wierzbowska, J.; Kováčik, P.; Krzebietke, S.J.; Żarczyński, P. Digestate as a source of nutrients in the cultivation of Virginia fanpetals. Fresen. Environ. Bull. 2018, 27, 3970–3976. [Google Scholar]
  40. Geng, Y.; Cao, G.; Wang, L.; Wang, S. Effects of equal chemical fertilizer substitutions with organic manure on yield, dry matter, and nitrogen uptake of spring maize and soil nitrogen distribution. PLoS ONE 2019, 14, e0219512. [Google Scholar] [CrossRef] [Green Version]
  41. Wierzbowska, J.; Sienkiewicz, S.; Zalewska, M.; Żarczyński, P.; Krzebietke, S. Phosphorus fractions in soil fertilised with organic waste. Environ. Monit. Assess. 2020, 192, 1–11. [Google Scholar] [CrossRef] [PubMed]
  42. Olk, D.C. Organic Forms of Soil Nitrogen. In Nitrogen in Agricultural Systems; Book Series: Agronomy Monographs, 49; Schepers, J.S., Raun, W.R., Eds.; John Wiley & Sons, Inc.: Hoboken, NJ, USA, 2008; pp. 57–100. [Google Scholar]
  43. Khan, S.A.; Mulvaney, R.L.; Hoeft, R.G. A simple soil test for detecting sites that are nonresponsive to nitrogen fertilization. Soil Sci. Soc. Am. J. 2001, 65, 1751–1760. [Google Scholar] [CrossRef]
  44. Sharma, R.P.; Verma, T.S. Dynamics of nitrogen fractions with long-term addition of Lantana camara biomass in rice-wheat cropping sequence. J. Ind. Soc. Soil Sci. 2001, 49, 407–412. [Google Scholar]
  45. Chadwick, D.R.; John, F.; Pain, B.; Chambers, B.J.; Williams, J. Plant uptake of nitrogen from the organic nitrogen fraction of animal manures: A laboratory experiment. J. Agric. Sci. 2000, 134, 159–168. [Google Scholar] [CrossRef] [Green Version]
  46. Sądej, W.; Przekwas, K. Fluctuations of nitrogen levels in soil profile under conditions of a long-term fertilization experiment. Plant Soil Environ. 2008, 54, 97–203. [Google Scholar] [CrossRef] [Green Version]
  47. Gonet, S.S.; Debska, B. Dissolved organic carbon and dissolved nitrogen in soil under different fertilization treatments. Plant Soil Environ. 2006, 52, 55–63. [Google Scholar] [CrossRef] [Green Version]
  48. Khandagle, A.; Dwivedi, B.S.; Aher, S.B.; Dwivedi, A.K.; Yashona, D.S.; Mohbe, S.; Panwar, S. Distribution of nitrogen fractions under long term fertilizer and manure application in a vertisol. Biosc. Biotech. Res. Commun. 2019, 12, 186–193. [Google Scholar]
  49. Skowrońska, M. The easily hydrolyzable nitrogen content in the soil under the conditions of organic wastes application. Zesz. Probl. Post Nauk. Rol. 2004, 499, 307–313. (In Polish) [Google Scholar]
  50. Rathi, D.; Devraj; Sharma, M.K. Effect of FYM and Fertilizer Application on Soil Organic Nitrogen Fractions: A Review. Int. Adv. Res. J. Sci. Eng. Technol. 2019, 9, 38–42. [Google Scholar]
  51. Souza, W.J.O.; Melo, W.J. Nitrogen in soil and soil organic matter fractions affected by different corn production systems. Rev. Bras. Ciência Solo 2000, 24, 885–896. (In Portuguese) [Google Scholar] [CrossRef] [Green Version]
  52. Sharifi, M.; Zebarth, B.J.; Burton, D.L.; Grant, C.A.; Bittman, S.; Drury, C.F.; McConkey, B.G.; Ziadi, N. Response of Potentially Mineralizable Soil Nitrogen and Indices of Nitrogen Availability to Tillage System. Soil Sci. Soc. Am. J. 2008, 72, 1124–1131. [Google Scholar] [CrossRef]
  53. Sano, S.; Yanai, J.; Kosaki, T. Evaluation of soil nitrogen status in japanese agricultural lands with reference to land use and soil types. Soil Sci. Plant. Nutr. 2004, 50, 501–510. [Google Scholar] [CrossRef] [Green Version]
  54. Leinweber, P.; Schulten, H.-R. Nonhydrolyzable forms of soil organic nitrogen: Extractability and composition. J. Plant Nutr. Soil Sci. 2000, 163, 433–439. [Google Scholar] [CrossRef]
  55. Cao, Y.; Zhao, F.; Zhang, Z.; Zhu, T.; Xiao, H. Biotic and abiotic nitrogen immobilization in soil incorporated with crop residue. Soil Tillage Res. 2020, 202, 104664. [Google Scholar]
  56. Sapek, B. Nitrogen and phosphorus release from soil organic matter. Water Environ. Rural Areas 2010, 10, 229–256. (In Polish) [Google Scholar]
  57. Bregliani, M.M.; Temminghoff, E.J.M.; van Riemsdijk, W.; Haggi, E.S. Nitrogen Fractions in Arable Soils in Relation to Nitrogen Mineralization and Plant Uptake. Commun. Soil Sci. Plant. Anal. 2006, 37, 1571–1586. [Google Scholar] [CrossRef]
Figure 1. Content of N-total in soil—mean ± SE (a—2 × 5 t ha−1, b—1 × 10 t ha−1).
Agronomy 11 01474 g001
Figure 2. Content of bound N in determined fractions: mean ± SE; N-min.—mineral; N-eh.—easily hydrolysable; N-hh.—hardly hydrolysable; N-nh.—non-hydrolysable (a—2 × 5 t ha1, b—1 × 10 t ha−1).
Agronomy 11 01474 g002
Figure 3. Structure of nitrogen compounds in soil (N-nh.—non-hydrolysable; N-h.—hydrolysable (easily + hardly); N-min.—N-mineral).
Agronomy 11 01474 g003
Figure 4. Content of selected N fractions depending on the soil content of C-org. (n = 42; N-min.—mineral; N-h.—hydrolysable (easily + hardly); N-nh.—non-hydrolysable; N-tot.—total).
Agronomy 11 01474 g004
Figure 5. Content of selected N fractions depending on the soil pH (n = 42; N-min.—N-mineral; N-h.—hydrolysable (easily + hardly); N-nh.—non-hydrolysable; N-tot.—total).
Agronomy 11 01474 g005
Table 1. Content and load of C-org., N-total and N introduced to soil with waste organic materials.
ElementManure
(FYM)
Composted Municipal Sewage Sludge and Straw
(CSSS)
Composted Sewage Sludge
(CSS)
Dried and Granulated Sewage Sludge
(DGSS)
“Dano” Compost Made from Unsorted Municipal Waste (CUMW)Composted Municipal Green Waste
(CMGW)
Content (g kg−1)
d.m.222.4586.8403.1851.4746.4788.8
Content (g kg−1 d.m.)
C-org.76.2108.486.2325.8101.763.3
N-tot.5.806.2811.7716.026.944.50
C/N13.117.27.320.314.614.1
Content (mg kg−1 d.m.)
Cu36.865.5249.0402.0297.034.1
Zn223.02951360.0980.0831.0133.0
Mn334.0210.6300.5228.0273.6326.8
Pb5.5024.920.315.8178.029.1
Cr10.2015.333.2056.9053.719.8
Ni6.6417.736.628.035.215.5
Fe3340.0805011,26015,59016,2005197
Table 2. Statistically significant differences the N content in the determined fractions (one-way-Anova).
ObjectN-NH4N-NO3N-min.N-eh.N-hh.N-nh.N-Total
Cf *cegdefd
NPKaddfbec
FYM1 × 10 t ha−1bccdecca
2 × 5 t ha−1eaagadab
CSSS1 × 10 t ha−1cdeedcdca
2 × 5 t ha−1ffheecab
DGSS1 × 10 t ha−1cbbaefba
2 × 5 t ha−1ecdbdcda
CSS1 × 10 t ha−1edfccddab
2 × 5 t ha−1cbbcfaa
CUMW1 × 10 t ha−1gegddba
2 × 5 t ha−1ecdddba
CMGW1 × 10 t ha−1dfgfggb
2 × 5 t ha−1efgidhca
*—different letters indicate significant differences at the p < 0.05 level; (N-min.—N-mineral; N-eh.—easily hydrolysable; N-hh. hardly hydrolysable; N-nh.—non-hydrolysable; N-tot.—total).
Table 3. Statistically significant differences the N content in the determined fractions (two-way-Anova).
FactorN-NH4N-NO3N-min.N-eh.N-hh.N-nh.N-Total
Waste organic materials
FYMa *aadacc
CSSSceecbbb
DGSSbbbabbb
CSSbccbbbb
CUMWdddcbaa
CMGWcefcccd
Application frequency
1 × 10 t ha−1abnsansbns
2 × 5 t ha−1bansbnsans
Interaction
FYM1 × 10 t ha−1daahaff
2 × 5 t ha−1accfbcbc
CSSS1 × 10 t ha−1ffhfede
2 × 5 t ha−1beedccb
DGSS1 × 10 t ha−1dcdbdec
2 × 5 t ha−1bbbafba
CSS1 × 10 t ha−1bbbcgaa
2 × 5 t ha−1dedfccfd
CUMW1 × 10 t ha−1dcdedbab
2 × 5 t ha−1fehecbb
CMGW1 × 10 t ha−1egidicc
2 × 5 t ha−1cfgghgg
*—different letters indicate significant differences at the p < 0.05 level; (N-min.—N-mineral; N-eh.—easily hydrolysable; N-hh. hardly hydrolysable; N-nh.—non-hydrolysable; N-tot.—total).
Publisher’s Note: MDPI stays neutral with regard to jurisdictional claims in published maps and institutional affiliations.

