
Botrytis cinerea Airborne Conidia and Their Germination Ability Assessed by Immunological Methods in a NW Spain Vineyard

 ,
,  and
and 
Abstract
:1. Introduction
2. Materials and Methods
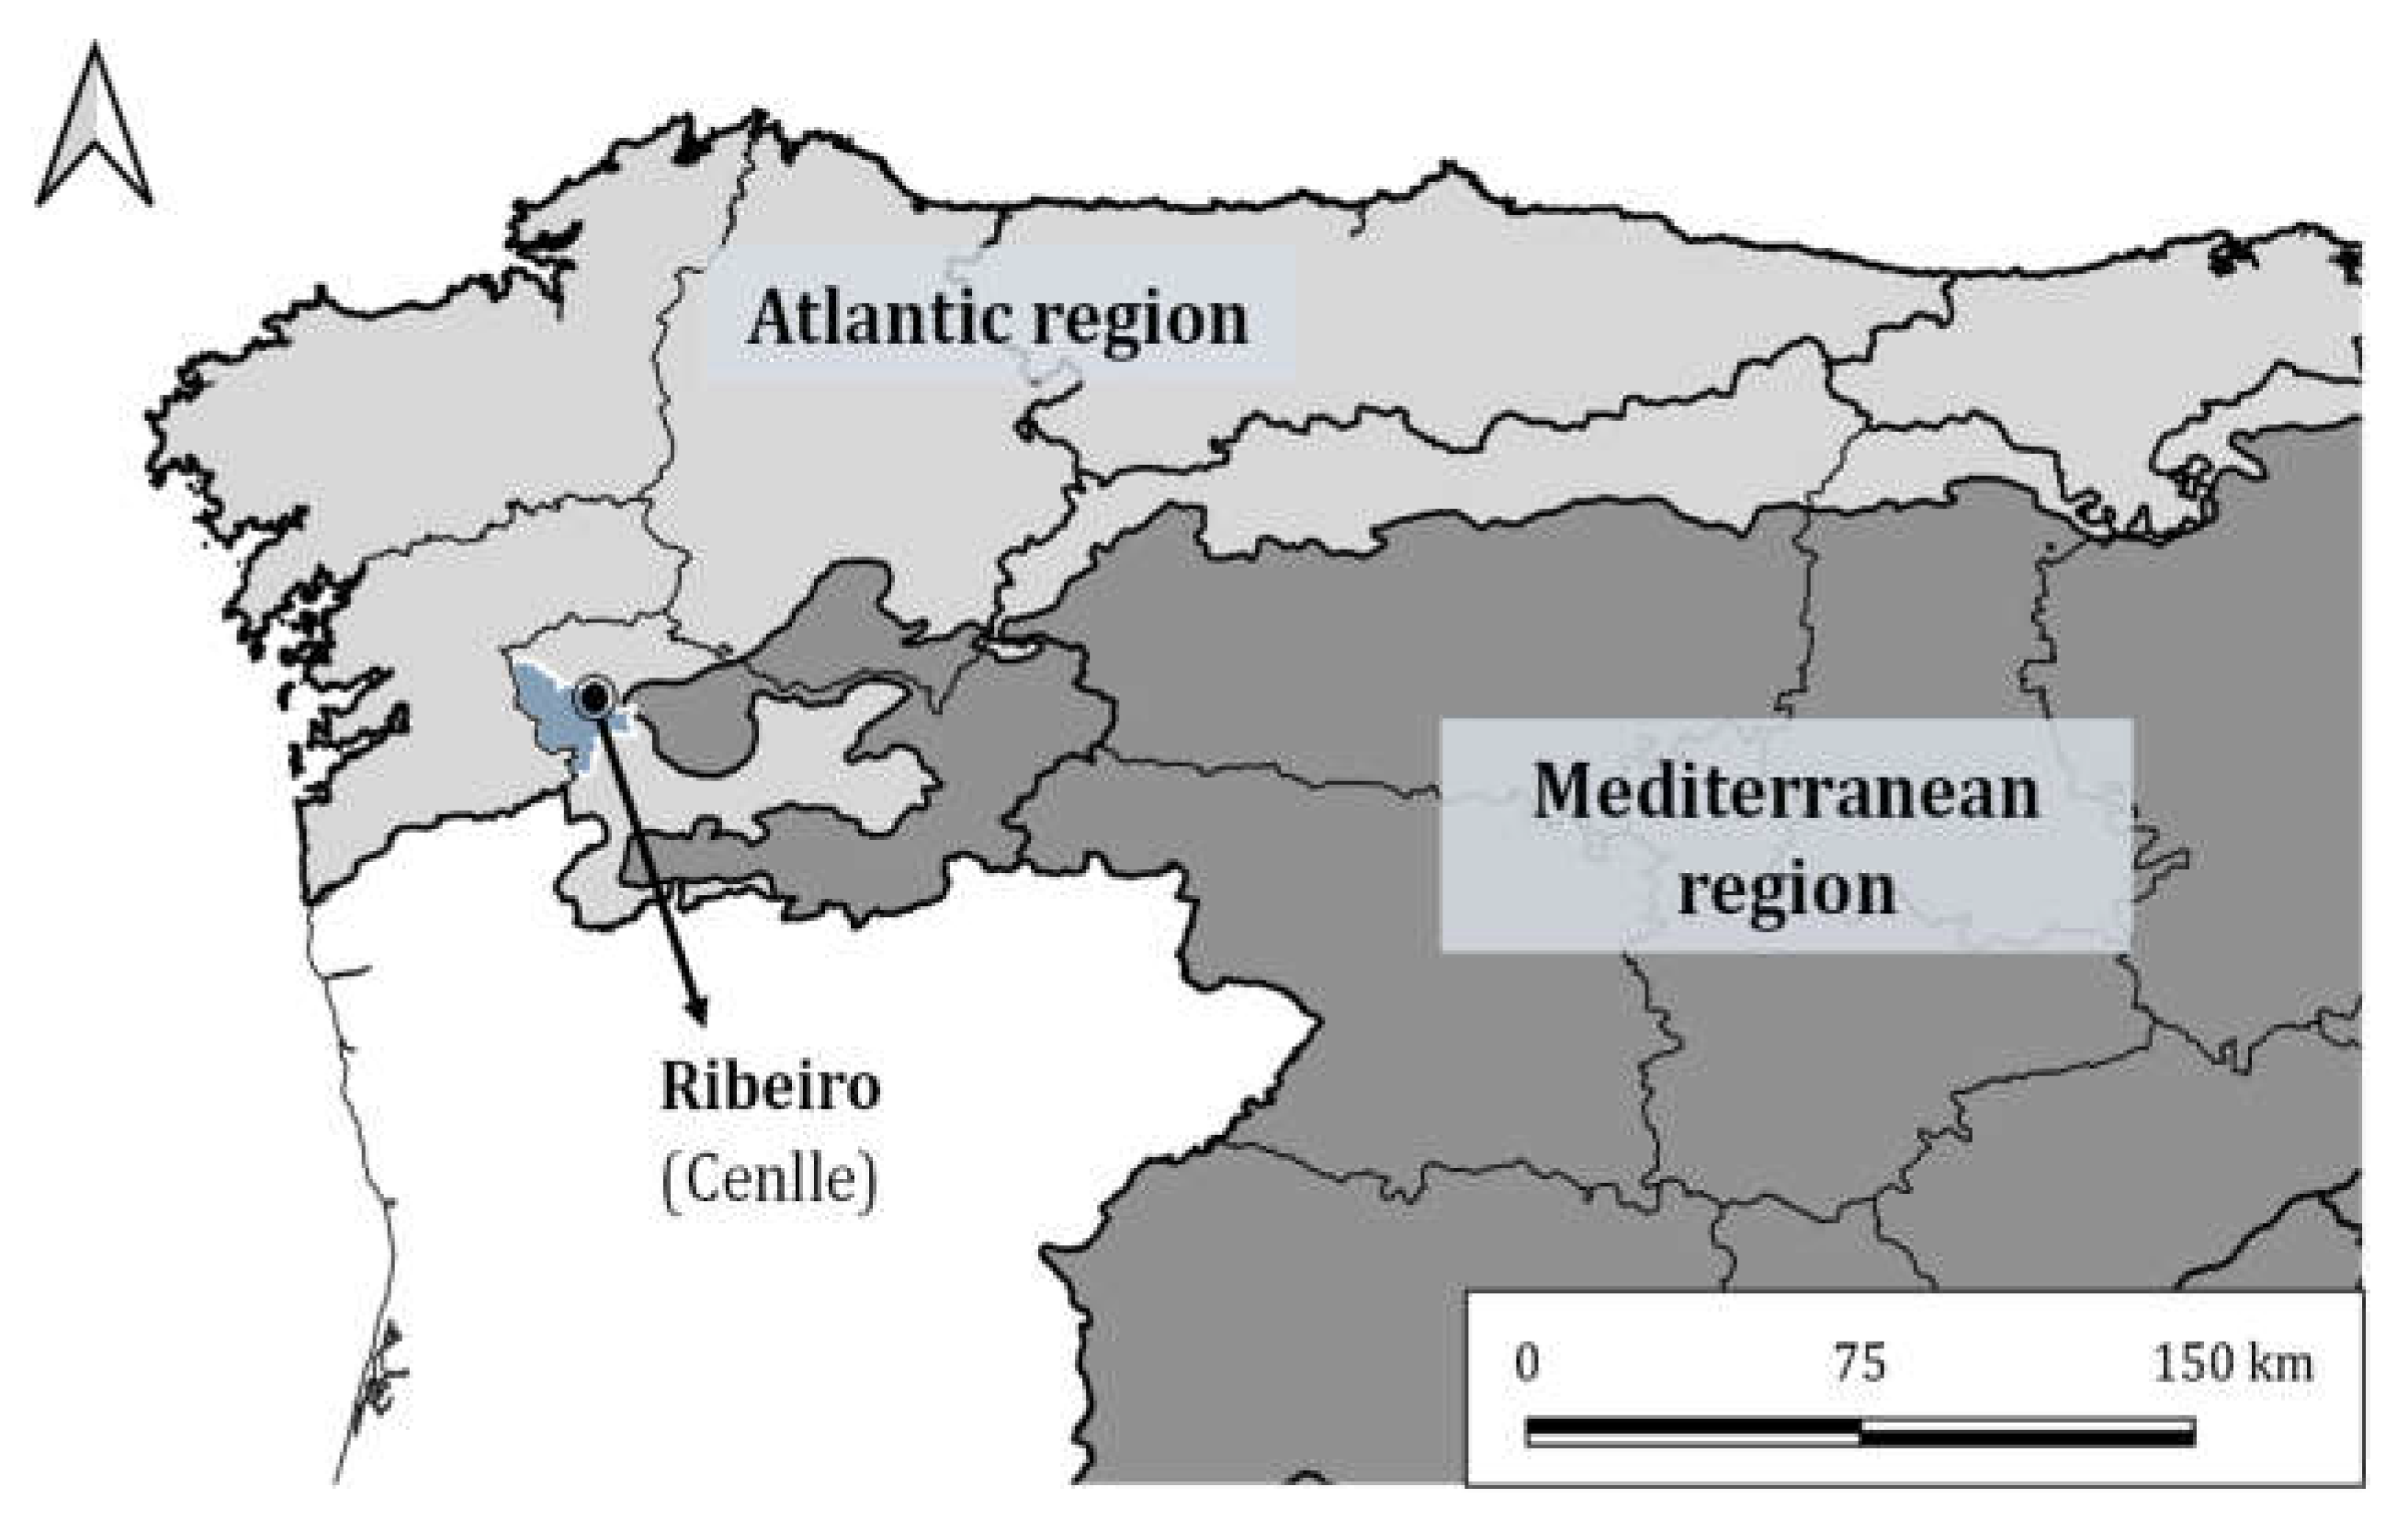
2.1. Study Area Description and Phenological Protocol
2.2. Meteorological Data
2.3. Aerobiological Study
2.4. Immunological Assay
2.4.1. Protein Extraction Protocol
2.4.2. Indirect PTA-ELISA
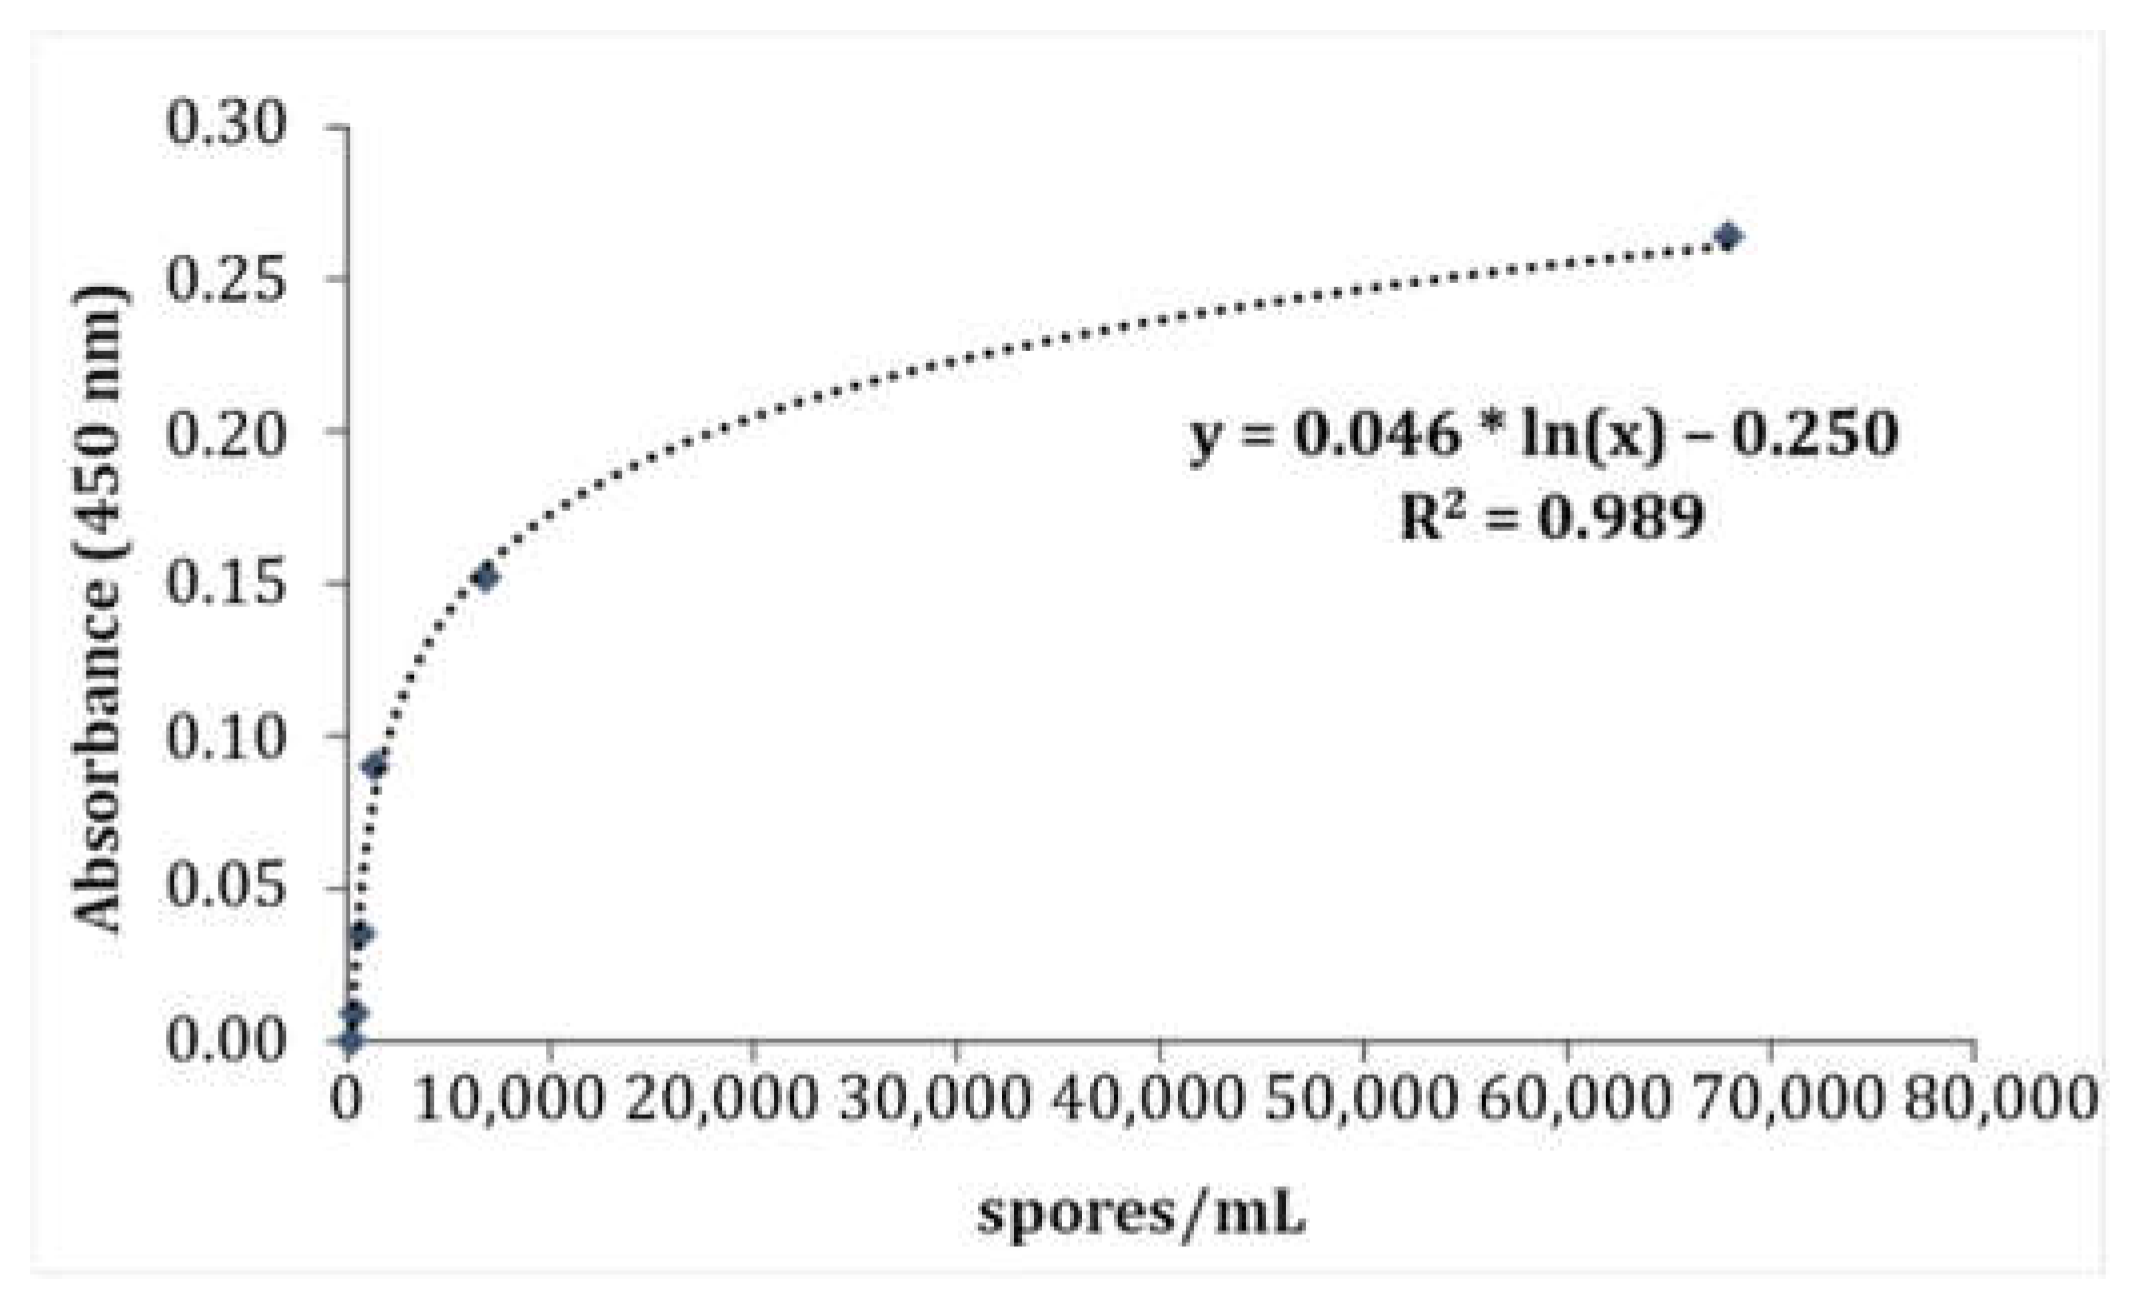
2.4.3. Development of a Standard Curve
2.5. Statistical Analysis
3. Results
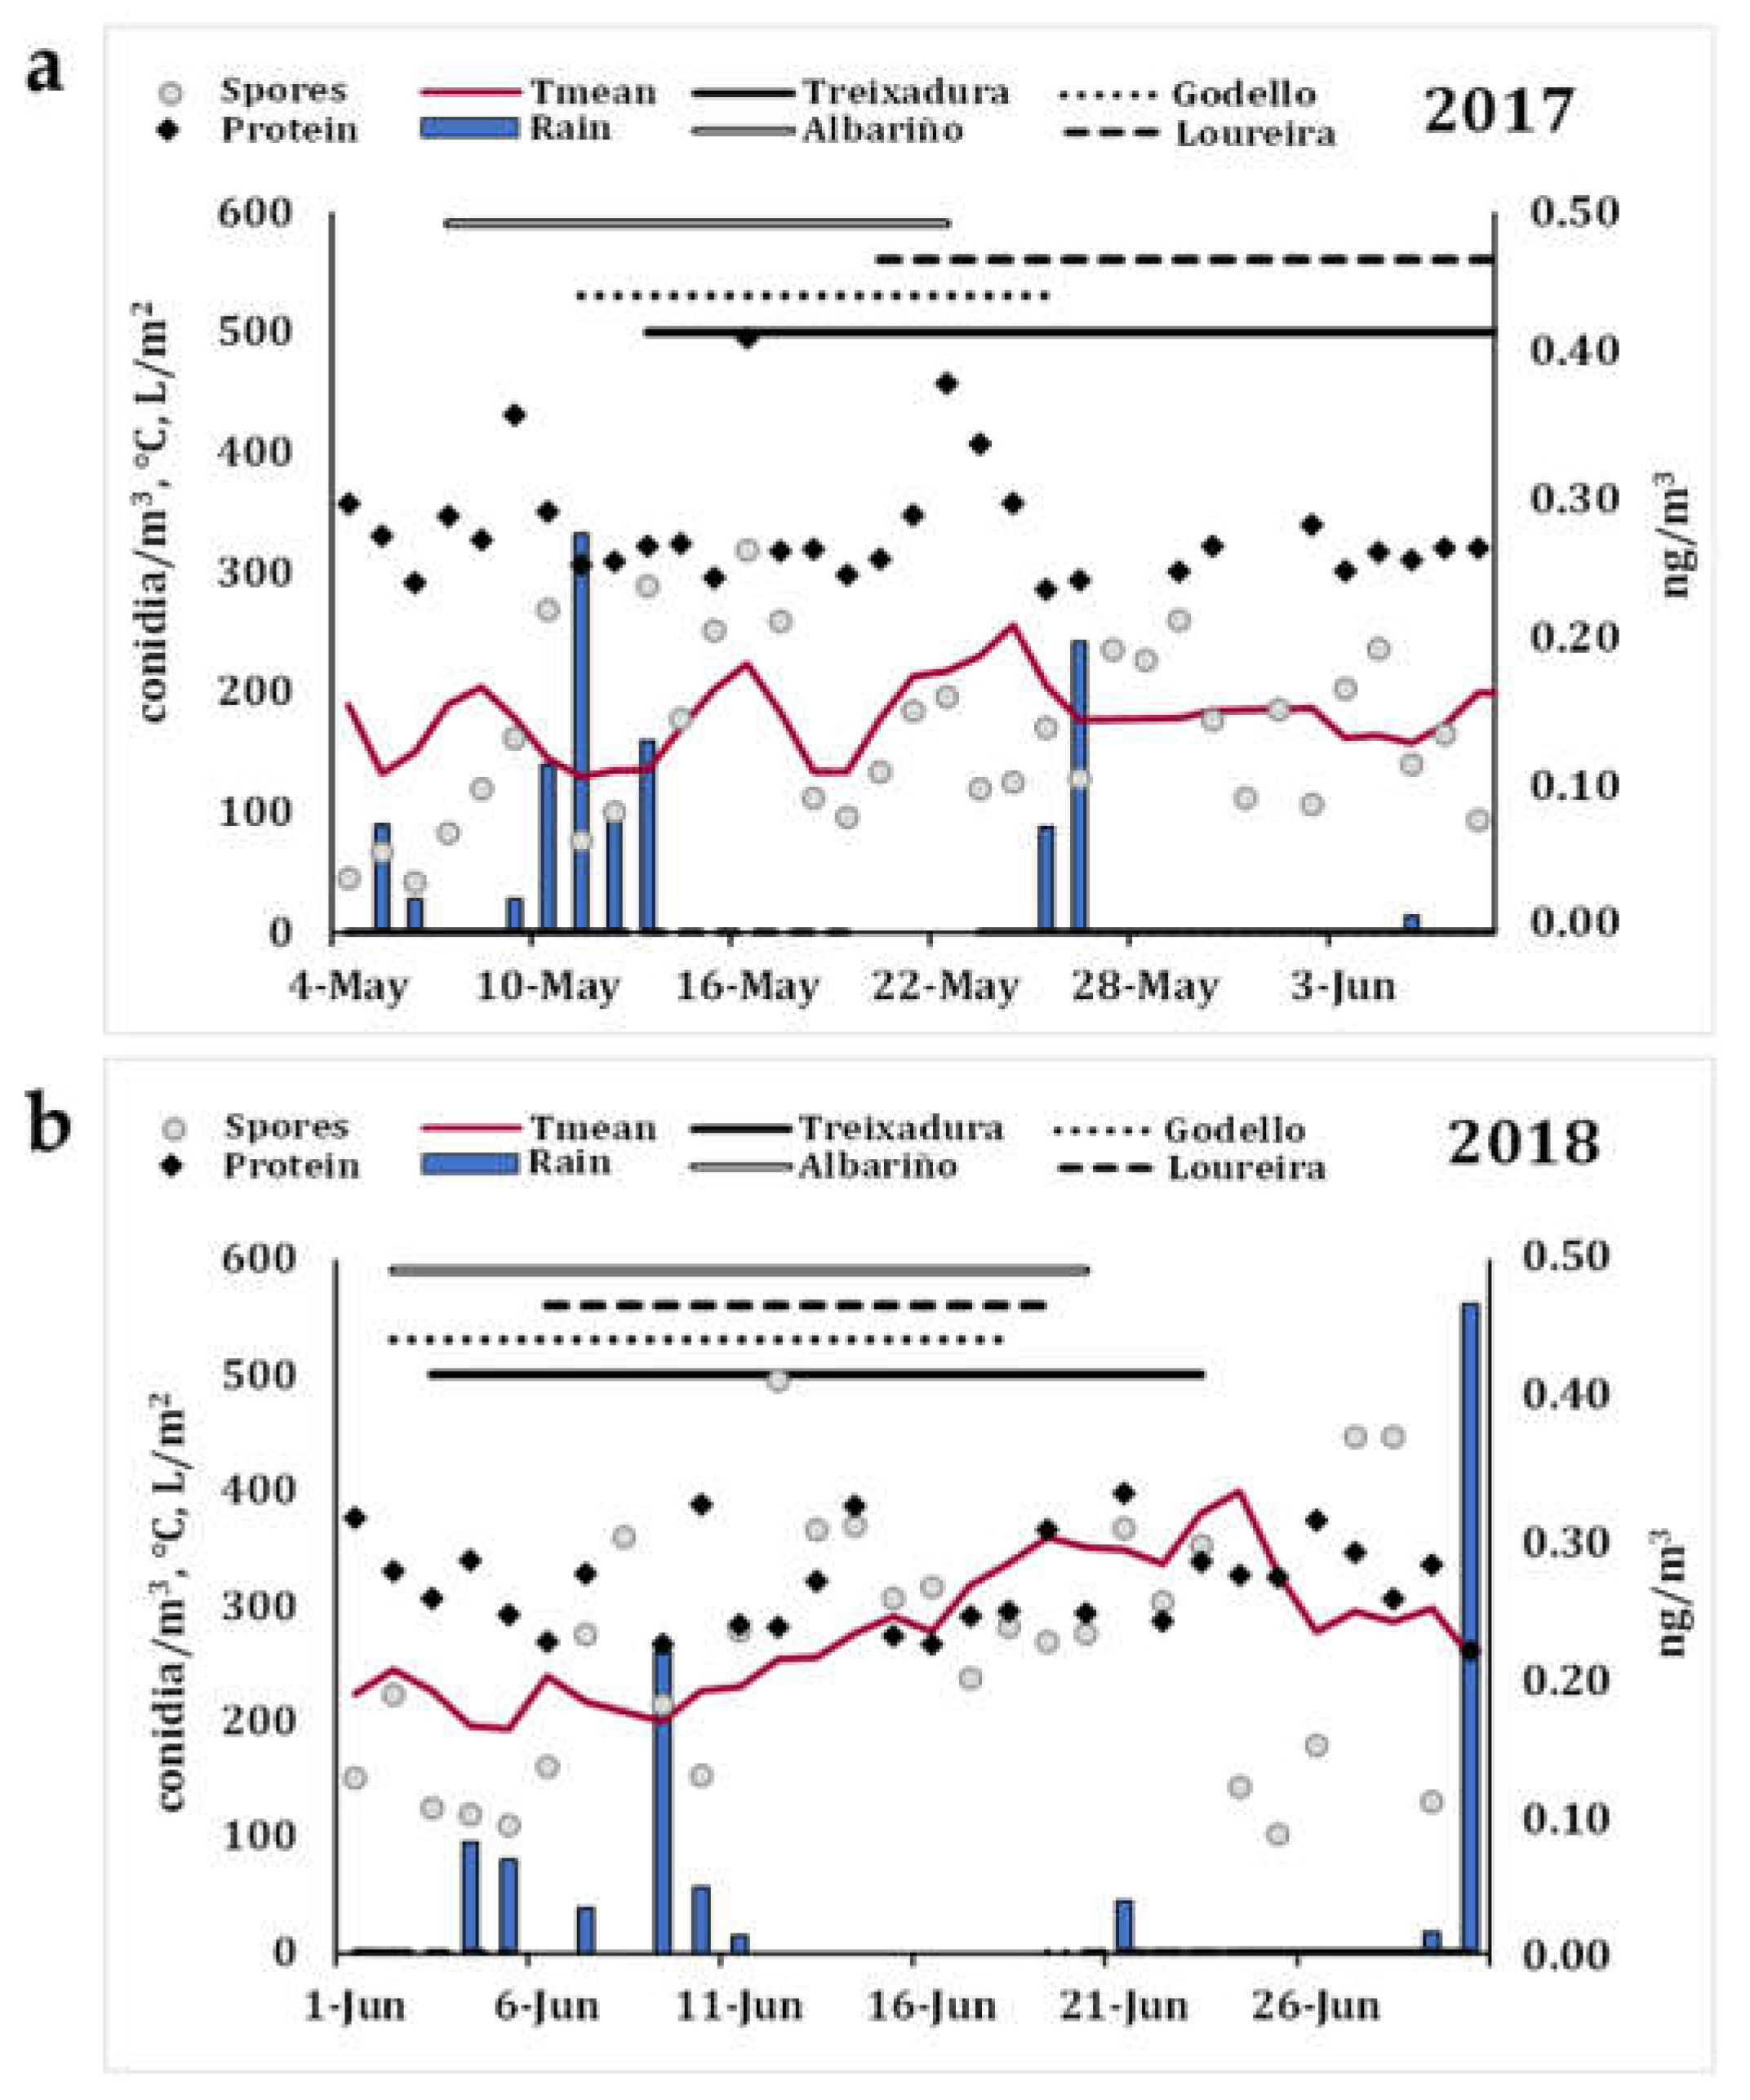
3.1. Immunological Assay Replicability and Aerobiological Study
3.2. Statistical Analysis of the Influence of Meteorological Conditions
4. Discussion
5. Conclusions
Supplementary Materials
Author Contributions
Funding
Institutional Review Board Statement
Informed Consent Statement
Data Availability Statement
Acknowledgments
Conflicts of Interest
References
- Bois, B.; Zito, S.; Calonnec, A. Climate vs. grapevine pests and diseases worldwide: The first results of a global survey. OENO One 2017, 51, 133–139. [Google Scholar] [CrossRef]
- Oliveira, M.; Guerner-Moreira, J.; Mesquita, M.M.; Abreu, I. Important phytopathogenic airborne fungal spores in a rural area: Incidence of Botrytis cinerea and Oidium spp. Ann. Agric. Environ. Med. 2009, 16, 197–204. [Google Scholar] [PubMed]
- Rodríguez-Rajo, F.J.; Jato, V.; Fernández-González, M.; Aira, M.J. The use of aerobiological methods for forecasting Botrytis spore concentrations in a vineyard. Grana 2010, 49, 56–65. [Google Scholar] [CrossRef] [Green Version]
- González-Domínguez, E.; Caffi, T.; Ciliberti, N.; Rossi, V. A Mechanistic Model of Botrytis cinerea on Grapevines That Includes Weather, Vine Growth Stage, and the Main Infection Pathways. PLoS ONE 2015, 10, e0140444. [Google Scholar] [CrossRef] [Green Version]
- Stevens, R.B. Cultural practices in disease control. In Plant Pathology: An Advanced Treatise; Horsfall, J.G., Dimond, A.E., Eds.; Academic Press: Cambridge, MA, USA, 1960; Volume 3, pp. 357–429. [Google Scholar]
- Agrios, G.N. Plant Pathology, 5th ed.; Elsevier-Academic Press: New York, NY, USA, 2005; p. 952. [Google Scholar]
- Keller, M.; Viret, O.; Cole, M. Botrytis cinerea Infection in Grape Flowers: Defense Reaction, Latency and Disease Expression. Phytopathology 2003, 93, 316–322. [Google Scholar] [CrossRef] [PubMed] [Green Version]
- Kretschmer, M.; Kassemeyer, H.; Hahn, M. Age-dependent Grey Mould Susceptibility and Tissue-specific Defence Gene Activation of Grapevine Berry Skins after Infection by Botrytis cinerea. J. Phytopathol. 2007, 155, 258–263. [Google Scholar] [CrossRef]
- Pezet, R.; Pont, V. Infection florale et latence de Botrytis cinerea dans les grappes de Vitis vinifera (var. Gamay). Rev. Suisse Vitic. Arboric. Hortic. 1986, 18, 317–322. [Google Scholar]
- Holz, G.; Coertze, S.; Basson, E.J. Latent infection of Botrytis cinerea in grape pedicels leads to postharvest decay. Phytopathology 1997, 87, S43. [Google Scholar]
- Wolf, T.K.; Baudin, A.B.A.M.; Martínez-Ochoa, N. Effect of floral debris removal from fruit clusters on botrytis bunch rot of Chardonnay grapes. Vitis J. Grapevine Res. 1997, 36, 27–33. [Google Scholar] [CrossRef]
- Fernández-González, M.; Rodríguez-Rajo, F.J.; Jato, V.; Aira, M.J.; Ribeiro, H.; Oliveira, M.; Abreu, I. Forecasting ARIMA models for atmospheric vineyard pathogens in Galicia and Northern Portugal: Botrytis cinerea spores. Ann. Agric. Environ. Med. 2012, 19, 255–262. [Google Scholar]
- González-Fernández, E.; Piña-Rey, A.; Fernández-González, M.; Rodríguez-Rajo, F.J. Effect of environmental conditions and phenology in the dispersal of secondary Erysiphe necator conidia in a vineyard. Vitis J. Grapevine Res. 2019, 58, 49–58. [Google Scholar] [CrossRef]
- Martínez-Bracero, M.; Alcázar, P.; Velasco-Jiménez, M.J.; Galán, C. Fungal spores affecting vineyards in Montilla-Moriles Southern Spain. Eur. J. Plant Pathol. 2019, 153, 1–13. [Google Scholar] [CrossRef]
- Carisse, O.; Savary, S.; Willocquet, L. Spatiotemporal relationships between disease development and airborne inoculum in unmanaged and managed Botrytis leaf blight epidemics. Phytopathology 2008, 98, 38–44. [Google Scholar] [CrossRef] [Green Version]
- González-Fernández, E.; Piña-Rey, A.; Fernández-González, M.; Aira, M.J.; Rodríguez-Rajo, F.J. Identification and evaluation of the main risk periods of Botrytis cinerea infection on grapevine based on phenology, weather conditions and airborne conidia. J. Agric. Sci. 2020, 158, 88–98. [Google Scholar] [CrossRef]
- Meyer, U.M.; Spotts, R.A.; Dewey, F.M. Detection and Quantification of Botrytis cinerea by ELISA in Pear Stems During Cold Storage. Plant Dis. 2000, 84, 1099–1103. [Google Scholar] [CrossRef] [Green Version]
- Dewey, F.M.; Yohalem, D. Detection, quantification and immunolocalisation of Botrytis species. In Botrytis: Biology, Pathology and Control; Elad, Y., Williamson, B., Tudzynski, P., Delen, N., Eds.; Springer: Dordrecht, The Netherlands, 2007; pp. 181–194. [Google Scholar]
- Blanco-Ward, D.; García, J.M.; Jones, G.V. Spatial climate variability and viticulture in the Miño River Valley of Spain. Vitis J. Grapevine Res. 2007, 46, 63–70. [Google Scholar]
- Orriols, I.; Vázquez, I.; Losada, A. Variedades gallegas. Terruños 2006, 16, 11–18. [Google Scholar]
- Casares, J.M. Ficha Técnica. Denomicación de Orixe Ribeiro. Available online: www.mediorural.xunta.gal (accessed on 15 January 2021).
- Meier, U. Growth Stages of Mono and Dicotyledonous Plants—BBCH Monograph, 2nd ed.; Julius Kühn-Institut (JKI); Federal Biological Research Centre for Agriculture and Forestry: Quedlingburg, Germany, 2001; p. 158. [Google Scholar] [CrossRef]
- Vasconcelos, M.C.; Greven, M.; Winefield, C.S.; Trought, M.C.T.; Raw, V. The Flowering Process of Vitis vinifera: A Review. Am. J. Enol. Vitic. 2009, 60, 411–434. [Google Scholar]
- Ministerio para la Transición Ecológica. Gobierno de España. Shapefile of Biogeographic Regions in Spain. Available online: https://www.miteco.gob.es/es/cartografia-y-sig/ide/descargas/biodiversidad/regiones-biogeograficas.aspx (accessed on 18 July 2021).
- MeteoGalicia. Galician Institute for Meteorology and Oceanography, Santiago de Compostela, Spain. Environment, Territory and Infrastructure Department of Galician Regional Government. Available online: http://www.meteogalicia.gal/web/index.action (accessed on 17 July 2021).
- Hirst, J.M. An Automatic Volumetric Spore Trap. Ann. Appl. Biol. 1952, 39, 257–265. [Google Scholar] [CrossRef]
- Galán, C.; Cariñanos, P.; Alcázar, P.; Domínguez, E. Spanish Aerobiology Network (REA): Management and Quality Manual; University of Córdoba Publication Service: Córdoba, Spain, 2007; p. 61. [Google Scholar]
- Miclea, R.V.; Suciu, L.A.; Puia, C.E. In Vitro Studies Regarding the Morphology of Botrytis cinerea Pers. Isolated from Geranium Plants. ProEnvironment 2012, 5, 60–66. [Google Scholar]
- Wang, Y.; Yang, L.; Bai, Q.R. First Report of Botrytis cinerea Causing Gray Mold of Peperomia ferreyrae in Jilin Province, China. Plant Dis. 2017, 101, 250. [Google Scholar] [CrossRef]
- Galán, C.; Ariatti, A.; Bonini, M.; Clot, B.; Crouzy, B.; Dahl, A.; Fernández-González, D.; Frenguelli, G.; Gehrig, R.; Isard, S.; et al. Recommended terminology for aerobiological studies. Aerobiologia 2017, 33, 293–295. [Google Scholar] [CrossRef]
- Nassr, S.; Barakat, R. Effect of Factors on Conidium Germination of Botrytis cinerea in vitro. Int. J. Plant Soil Sci. 2013, 2, 41–54. [Google Scholar] [CrossRef]
- Tipping, M.E.; Bishop, C.M. Probabilistic Principal Component Analysis. J. R. Stat. Soc. Series B Stat. Methodol. 1999, 61, 611–622. Available online: jstor.org/stable/2680726 (accessed on 15 January 2021). [CrossRef]
- IPCC. Intergovernmental Panel on Climate Change. Climate Change 2014: Synthesis Report. Contribution of Working Groups I, II and III to the Fifth Assessment Report of the Intergovernmental Panel on Climate Change; Core Writing Team, Pachauri, R.K., Meyer, L.A., Eds.; IPCC: Geneva, Switzerland, 2014; 151p. [Google Scholar]
- Jones, G.V.; White, M.A.; Cooper, O.R.; Storchmann, K. Climate Change and Global Wine Quality. Clim. Chang. 2005, 73, 319–343. [Google Scholar] [CrossRef]
- Meier, N.; Rutishauser, T.; Pfister, C.; Wanner, H.; Luterbacher, J. Grape Harvest Dates as a proxy for Swiss April to August Temperature Reconstructions back to AD 1480. Geophys. Res. Lett. 2007, 34, L20705. [Google Scholar] [CrossRef] [Green Version]
- Hannah, L.; Roehrdanz, P.R.; Ikegami, M.; Shepard, A.V.; Shaw, M.R.; Tabor, G.; Zhi, L.; Marquet, P.A.; Hijmans, R.J. Climate change, wine, and conservation. Proc. Natl. Acad. Sci. USA 2013, 110, 6907–6912. [Google Scholar] [CrossRef] [Green Version]
- Lamichhane, J.R.; Barzman, M.; Booij, K.; Boonekamp, P.; Desneux, N.; Huber, L.; Kudsk, P.; Langrell, S.R.H.; Ratnadass, A.; Ricci, P.; et al. Robust cropping systems to tackle pests under climate change. A review. Agron. Sustain. Dev. 2015, 35, 443–459. [Google Scholar] [CrossRef]
- Huber, L.; Gillespie, T.J. Modeling Leaf Wetness in Relation to Plant Disease Epidemiology. Ann. Rev. Phytopathol. 1992, 30, 553–577. [Google Scholar] [CrossRef]
- Juroszek, P.; von Tiedemann, A. Potential strategies and future requirements for plant disease management under a changing climate. Plant Pathol. 2011, 60, 100–112. [Google Scholar] [CrossRef]
- Shaw, M.W.; Osborne, T.M. Geographic distribution of plant pathogens in response to climate change. Plant Pathol. 2011, 60, 31–43. [Google Scholar] [CrossRef]
- Elad, Y.; Williamson, B.; Tudzynski, P.; Delen, N. Botrytis spp. and diseases they cause in agricultural systems—An introduction. In Botrytis: Biology, Pathology and Control; Elad, Y., Williamson, B., Tudzynski, P., Delen, N., Eds.; Springer: Dordrecht, The Netherlands, 2007; pp. 1–8. [Google Scholar]
- Holz, G.; Coertze, S.; Williamson, B. The ecology of Botrytis on plant surfaces. In Botrytis: Biology, Pathology and Control; Elad, Y., Williamson, B., Tudzynski, P., Delen, N., Eds.; Springer: Dordrecht, The Netherlands, 2007; pp. 9–27. [Google Scholar]
- Broome, J.C.; English, J.T.; Marois, J.J.; Latorre, B.A.; Avilés, J.C. Development of an infection model for Botrytis bunch rot of grape based on wetness duration and temperature. Phytopathology 1995, 85, 97–102. [Google Scholar] [CrossRef]
- Thomas, C.S.; Marois, J.J.; English, J.T. The effects of wind speed, temperature and relative humidity on development of aerial mycelium and conidia of Botrytis cinerea on grape. Phytopathology 1988, 78, 260–265. [Google Scholar] [CrossRef]
- Ciliberti, N.; Fermaud, M.; Roudet, J.; Rossi, V. Environmental conditions affect Botrytis cinerea infection of mature grape berries more than the strain or transposon genotype. Phytopathology 2015, 105, 1090–1096. [Google Scholar] [CrossRef] [PubMed] [Green Version]
- Magarey, R.D.; Sutton, T.B.; Thayer, C.L. A Simple Generic Infection Model for Foliar Fungal Plant Pathogens. Phytopathology 2005, 95, 92–100. [Google Scholar] [CrossRef] [PubMed] [Green Version]
- Chen, C.H.; Hsieh, T.F. First report of Botrytis cinerea causing gray mold of Jamaica cherry in Taiwan. Plant Pathol. Bull. 2009, 18, 119–123. [Google Scholar]
- Latorre, B.A.; Rioja, M.E. The effect of temperature and relative humidity on conidial germination of Botrytis cinerea. Cienc. Investig. Agrar. 2002, 29, 67–72. [Google Scholar] [CrossRef]
- Allen, P.J. The role of a self-inhibitor in the germination of rust uredospores. Phytopathology 1995, 215, 259–266. [Google Scholar]
- Bacon, C.W.; Sussman, A.S.; Paul, A.G. Identification of a self-inhibitor from spores of Dictyostelium discoideum. J. Bacteriol. 1973, 113, 1060–1063. [Google Scholar] [CrossRef] [Green Version]
- Barrios-Gonzales, J.; Martinez, C.; Aguilera, A.; Raimbault, M. Germination of concentrated suspensions of spores from Aspergillus niger. Biotechnol. Lett. 1989, 11, 551–554. [Google Scholar] [CrossRef]
- Scharrock, K.; Henzell, R.; Parry, F. Self-Inhibition of Germination of Botrytis Cinerea Conidia; Horticulture and Food Research Institute of New Zealand: Hamilton, New Zealand, 2001. [Google Scholar]
- Jeger, M.J. Relating disease progress to cumulative numbers of trapped spores: Apple powdery mildew and scab epidemics in sprayed and unsprayed orchard plots. Plant Pathol. 1984, 33, 517–523. [Google Scholar] [CrossRef]
- Williamson, B.; Duncan, G.H.; Harrison, J.G.; Harding, L.H.; Elad, Y.; Zimand, G. Effect of humidity on infection of rose petals by dry-inoculated conidia of Botrytis cinerea. Mycol. Res. 1995, 99, 1303–1310. [Google Scholar] [CrossRef]
- Elad, Y. Changes in disease epidemics on greenhouse grown crops. Acta Hortic. 2000, 534, 213–220. [Google Scholar] [CrossRef]
- Yunis, H.; Shtienberg, D.; Elad, Y.; Mahrer, Y. Qualitative approach for modelling outbreaks of grey mould epidemics in non-heated cucumber greenhouses. Crop. Prot. 1994, 13, 99–104. [Google Scholar] [CrossRef]
- Eden, M.A.; Hill, R.A.; Beresford, R.; Stewart, A. The influence of inoculum concentration, relative humidity, and temperature on infection of greenhouse tomatoes by Botrytis cinerea. Plant Pathol. 1996, 45, 795–806. [Google Scholar] [CrossRef]
- Elad, Y.; Yunis, H. Effect of Microclimate and Nutrients on Development of Cucumber Gray Mold (Botrytis cinerea). Phytoparasitica 1993, 21, 257–268. [Google Scholar] [CrossRef]


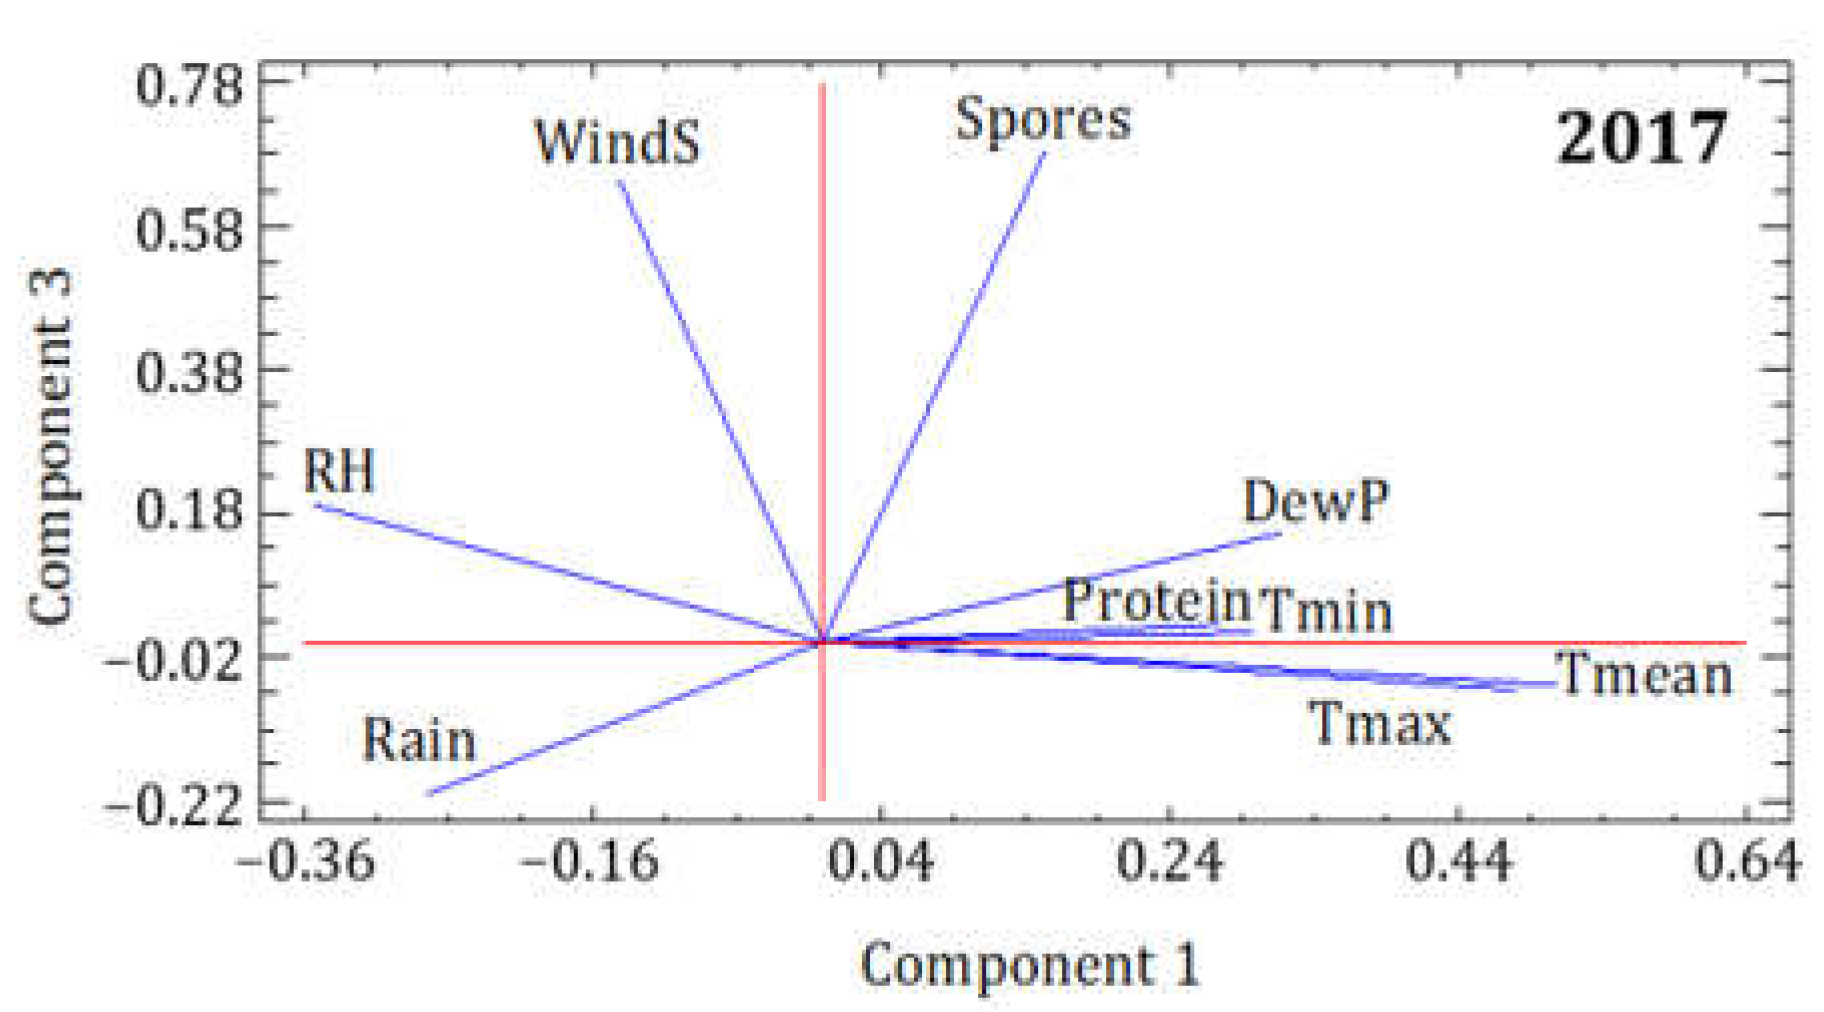
| 2017 | PC1 | PC2 | PC3 |
|---|---|---|---|
| Eigenvalue | 3.707 | 2.191 | 1.198 |
| Variance % | 41.190 | 24.345 | 13.313 |
| Cumulative % | 41.190 | 65.534 | 78.848 |
| Spores | 0.153 | 0.151 | 0.683 |
| Protein | 0.274 | −0.049 | 0.025 |
| Tmean | 0.508 | 0.026 | −0.060 |
| Tmax | 0.480 | −0.144 | −0.066 |
| Tmin | 0.299 | 0.481 | 0.013 |
| RH | −0.355 | 0.451 | 0.192 |
| DewP | 0.318 | 0.476 | 0.153 |
| Rain | −0.276 | 0.464 | −0.210 |
| WindS | −0.143 | −0.275 | 0.648 |
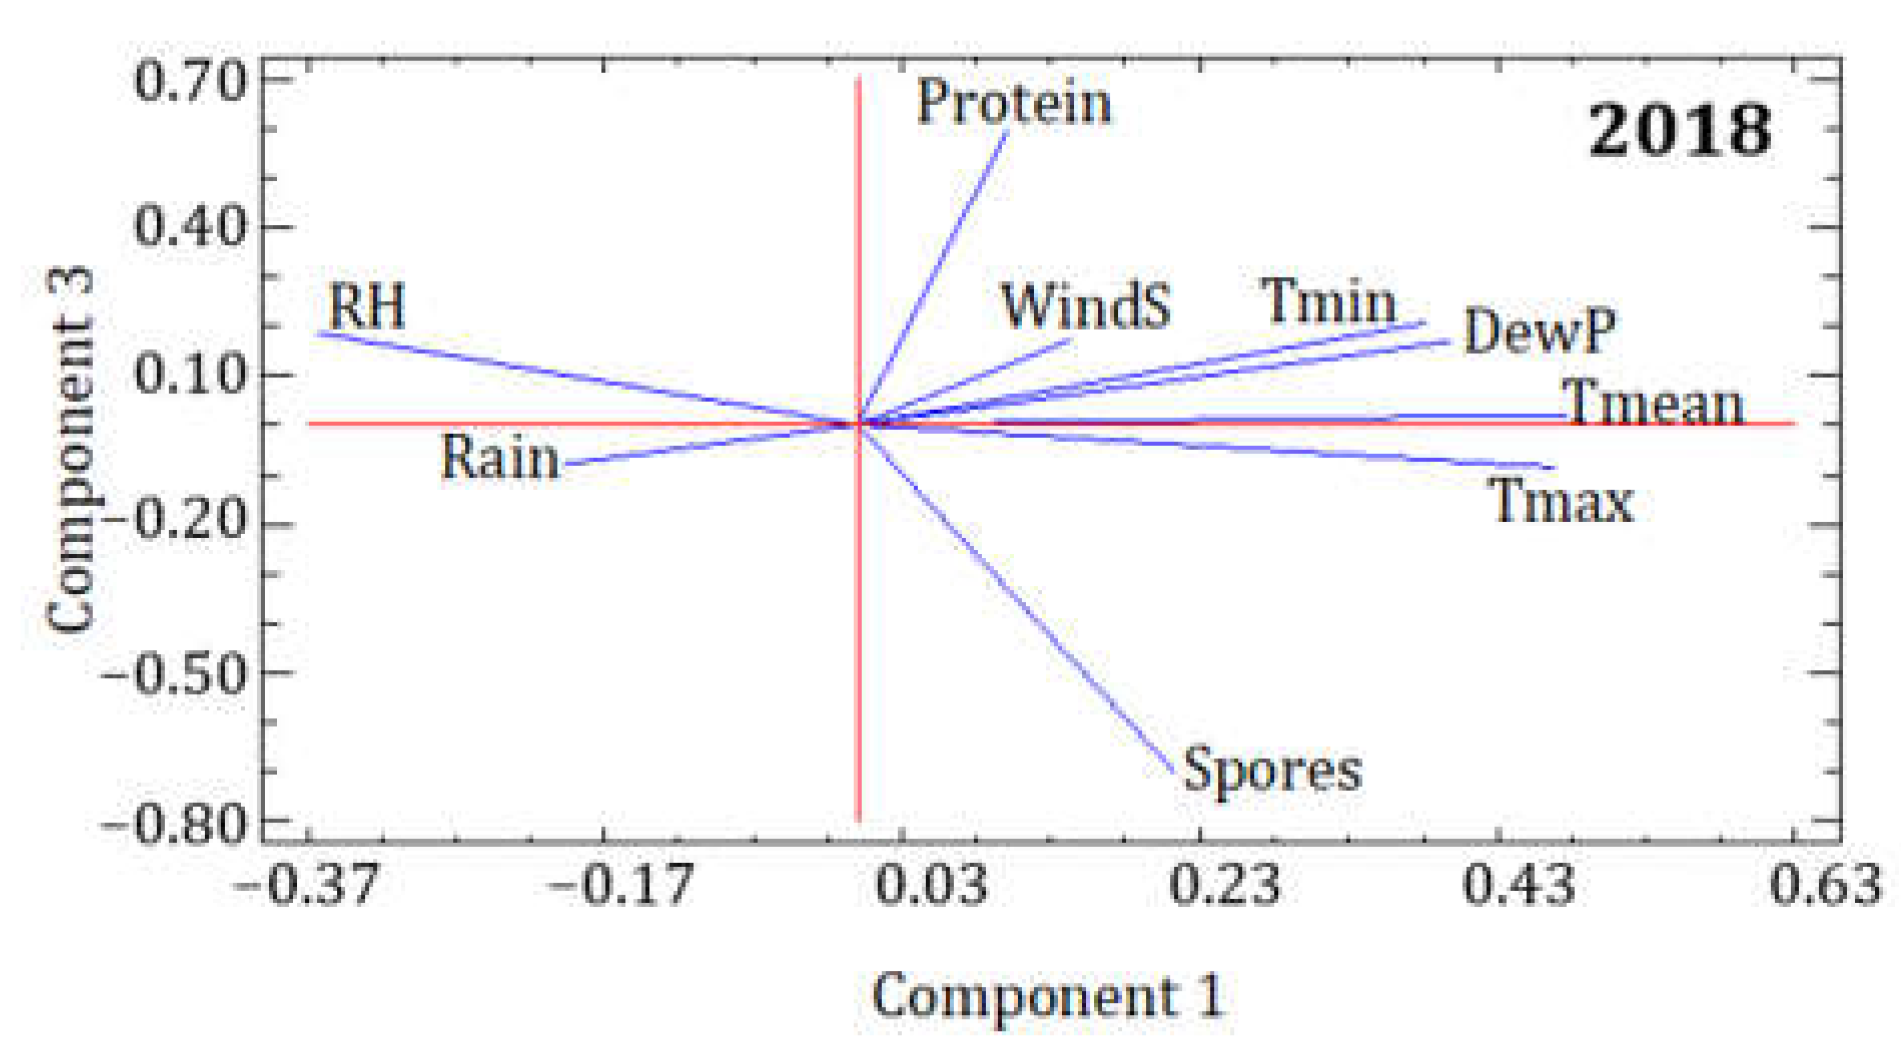
| 2018 | PC1 | PC2 | PC3 |
|---|---|---|---|
| Eigenvalue | 4.236 | 1.743 | 1.105 |
| Variance % | 47.065 | 19.365 | 12.281 |
| Cumulative % | 47.065 | 66.429 | 78.710 |
| Spores | 0.214 | −0.119 | −0.703 |
| Protein | 0.100 | −0.298 | 0.596 |
| Tmean | 0.477 | 0.102 | 0.022 |
| Tmax | 0.468 | 0.010 | −0.084 |
| Tmin | 0.382 | 0.386 | 0.207 |
| RH | −0.364 | 0.360 | 0.187 |
| DewP | 0.400 | 0.377 | 0.171 |
| Rain | −0.197 | 0.506 | −0.080 |
| WindS | 0.144 | −0.457 | 0.172 |
| Variables | Spearman R | Variables | Spearman R |
|---|---|---|---|
| Protein | 0.202 | Relative Humidity | 0.041 |
| Protein—1 | 0.011 | Relative Humidity—1 | 0.075 |
| Protein—2 | −0.424 ** | Relative Humidity—2 | 0.348 ** |
| Protein—3 | −0.232 | Relative Humidity—3 | 0.305 * |
| Protein—4 | −0.137 | Relative Humidity—4 | 0.227 |
| Protein—5 | 0.242 | Relative Humidity—5 | 0.034 |
| Protein—6 | 0.545 *** | Relative Humidity—6 | −0.213 |
| Protein—7 | 0.077 | Relative Humidity—7 | 0.004 |
| Mean Temperature | 0.277 | Dew Point | 0.365 ** |
| Mean Temperature—1 | 0.178 | Dew Point—1 | 0.363 ** |
| Mean Temperature—2 | −0.094 | Dew Point—2 | 0.186 |
| Mean Temperature—3 | −0.205 | Dew Point—3 | 0.036 |
| Mean Temperature—4 | −0.055 | Dew Point—4 | 0.237 |
| Mean Temperature—5 | 0.316 * | Dew Point—5 | 0.447 *** |
| Mean Temperature—6 | 0.584 *** | Dew Point—6 | 0.489 *** |
| Mean Temperature—7 | 0.498 *** | Dew Point—7 | 0.386 ** |
| Max. Temperature | 0.202 | Rainfall | −0.119 |
| Max. Temperature—1 | 0.130 | Rainfall—1 | −0.117 |
| Max. Temperature—2 | −0.190 | Rainfall—2 | 0.149 |
| Max. Temperature—3 | −0.299 * | Rainfall—3 | 0.453 *** |
| Max. Temperature—4 | −0.206 | Rainfall—4 | 0.442 *** |
| Max. Temperature—5 | 0.204 | Rainfall—5 | 0.133 |
| Max. Temperature—6 | 0.526 *** | Rainfall—6 | −0.143 |
| Max. Temperature—7 | 0.407 ** | Rainfall—7 | −0.077 |
| Min. Temperature | 0.199 | Wind Speed | 0.103 |
| Min. Temperature—1 | 0.290 * | Wind Speed—1 | −0.051 |
| Min. Temperature—2 | 0.118 | Wind Speed—2 | 0.024 |
| Min. Temperature—3 | −0.021 | Wind Speed—3 | 0.106 |
| Min. Temperature—4 | 0.351 ** | Wind Speed—4 | −0.029 |
| Min. Temperature—5 | 0.444 *** | Wind Speed—5 | −0.332 * |
| Min. Temperature—6 | 0.511 *** | Wind Speed—6 | −0.480 *** |
| Min. Temperature—7 | 0.319 * | Wind Speed—7 | −0.254 |
| Variables | Spearman R | Variables | Spearman R |
|---|---|---|---|
| Spores | 0.202 ** | Relative Humidity | −0.444 *** |
| Spores—1 | −0.018 | Relative Humidity—1 | −0.325 * |
| Spores—2 | −0.322 * | Relative Humidity—2 | 0.003 |
| Spores—3 | −0.258 | Relative Humidity—3 | 0.239 |
| Spores—4 | −0.315 * | Relative Humidity—4 | 0.171 |
| Spores—5 | −0.230 | Relative Humidity—5 | −0.020 |
| Spores—6 | 0.036 | Relative Humidity—6 | −0.228 |
| Spores—7 | 0.038 | Relative Humidity—7 | −0.018 |
| Mean Temperature | 0.283 * | Dew Point | −0.059 |
| Mean Temperature—1 | 0.229 | Dew Point—1 | −0.161 |
| Mean Temperature—2 | −0.237 | Dew Point—2 | −0.334 ** |
| Mean Temperature—3 | −0.519 *** | Dew Point—3 | −0.502 *** |
| Mean Temperature—4 | −0.407 ** | Dew Point—4 | −0.339 ** |
| Mean Temperature—5 | −0.129 | Dew Point—5 | −0.048 |
| Mean Temperature—6 | 0.186 | Dew Point—6 | 0.102 |
| Mean Temperature—7 | 0.106 | Dew Point—7 | 0.173 |
| Max. Temperature | 0.341 ** | Rainfall | −0.187 |
| Max. Temperature—1 | 0.302 * | Rainfall—1 | −0.177 |
| Max. Temperature—2 | −0.193 | Rainfall—2 | −0.075 |
| Max. Temperature—3 | −0.431 *** | Rainfall—3 | 0.266 |
| Max. Temperature—4 | −0.442 *** | Rainfall—4 | 0.157 |
| Max. Temperature—5 | −0.088 | Rainfall—5 | 0.010 |
| Max. Temperature—6 | 0.205 | Rainfall—6 | −0.325 * |
| Max. Temperature—7 | 0.076 | Rainfall—7 | −0.017 |
| Min. Temperature | 0.038 | Wind Speed | −0.131 |
| Min. Temperature—1 | −0.054 | Wind Speed—1 | −0.108 |
| Min. Temperature—2 | −0.287 * | Wind Speed—2 | −0.022 |
| Min. Temperature—3 | −0.368 ** | Wind Speed—3 | 0.118 |
| Min. Temperature—4 | −0.307 * | Wind Speed—4 | 0.082 |
| Min. Temperature—5 | 0.010 | Wind Speed—5 | 0.080 |
| Min. Temperature—6 | −0.006 | Wind Speed—6 | −0.281 |
| Min. Temperature—7 | 0.121 | Wind Speed—7 | 0.059 |
| R = 0.6712 | R2 = 0.4505 | Adjusted R2 = 0.3973 | F (3,31) = 8.4704 | p < 0.0003 | Std. Error of Estimate: 0.0319 | |
|---|---|---|---|---|---|---|
| N = 35 | Beta | Std. Err. Beta | B | Std. Err. B | t(31) | p-level |
| Intercept | 0.4471 | 0.0458 | 9.7642 | 0.0000 | ||
| RH | −0.3652 | 0.1352 | −1.529 × 10⁻³ | 0.0006 | −2.7006 | 0.0111 |
| DewP −4 | −0.4531 | 0.1407 | −7.130 × 10⁻³ | 0.0022 | −3.2197 | 0.0030 |
| Spores | 0.4231 | 0.1388 | 2.409 × 10⁻⁴ | 0.0001 | 3.0484 | 0.0047 |
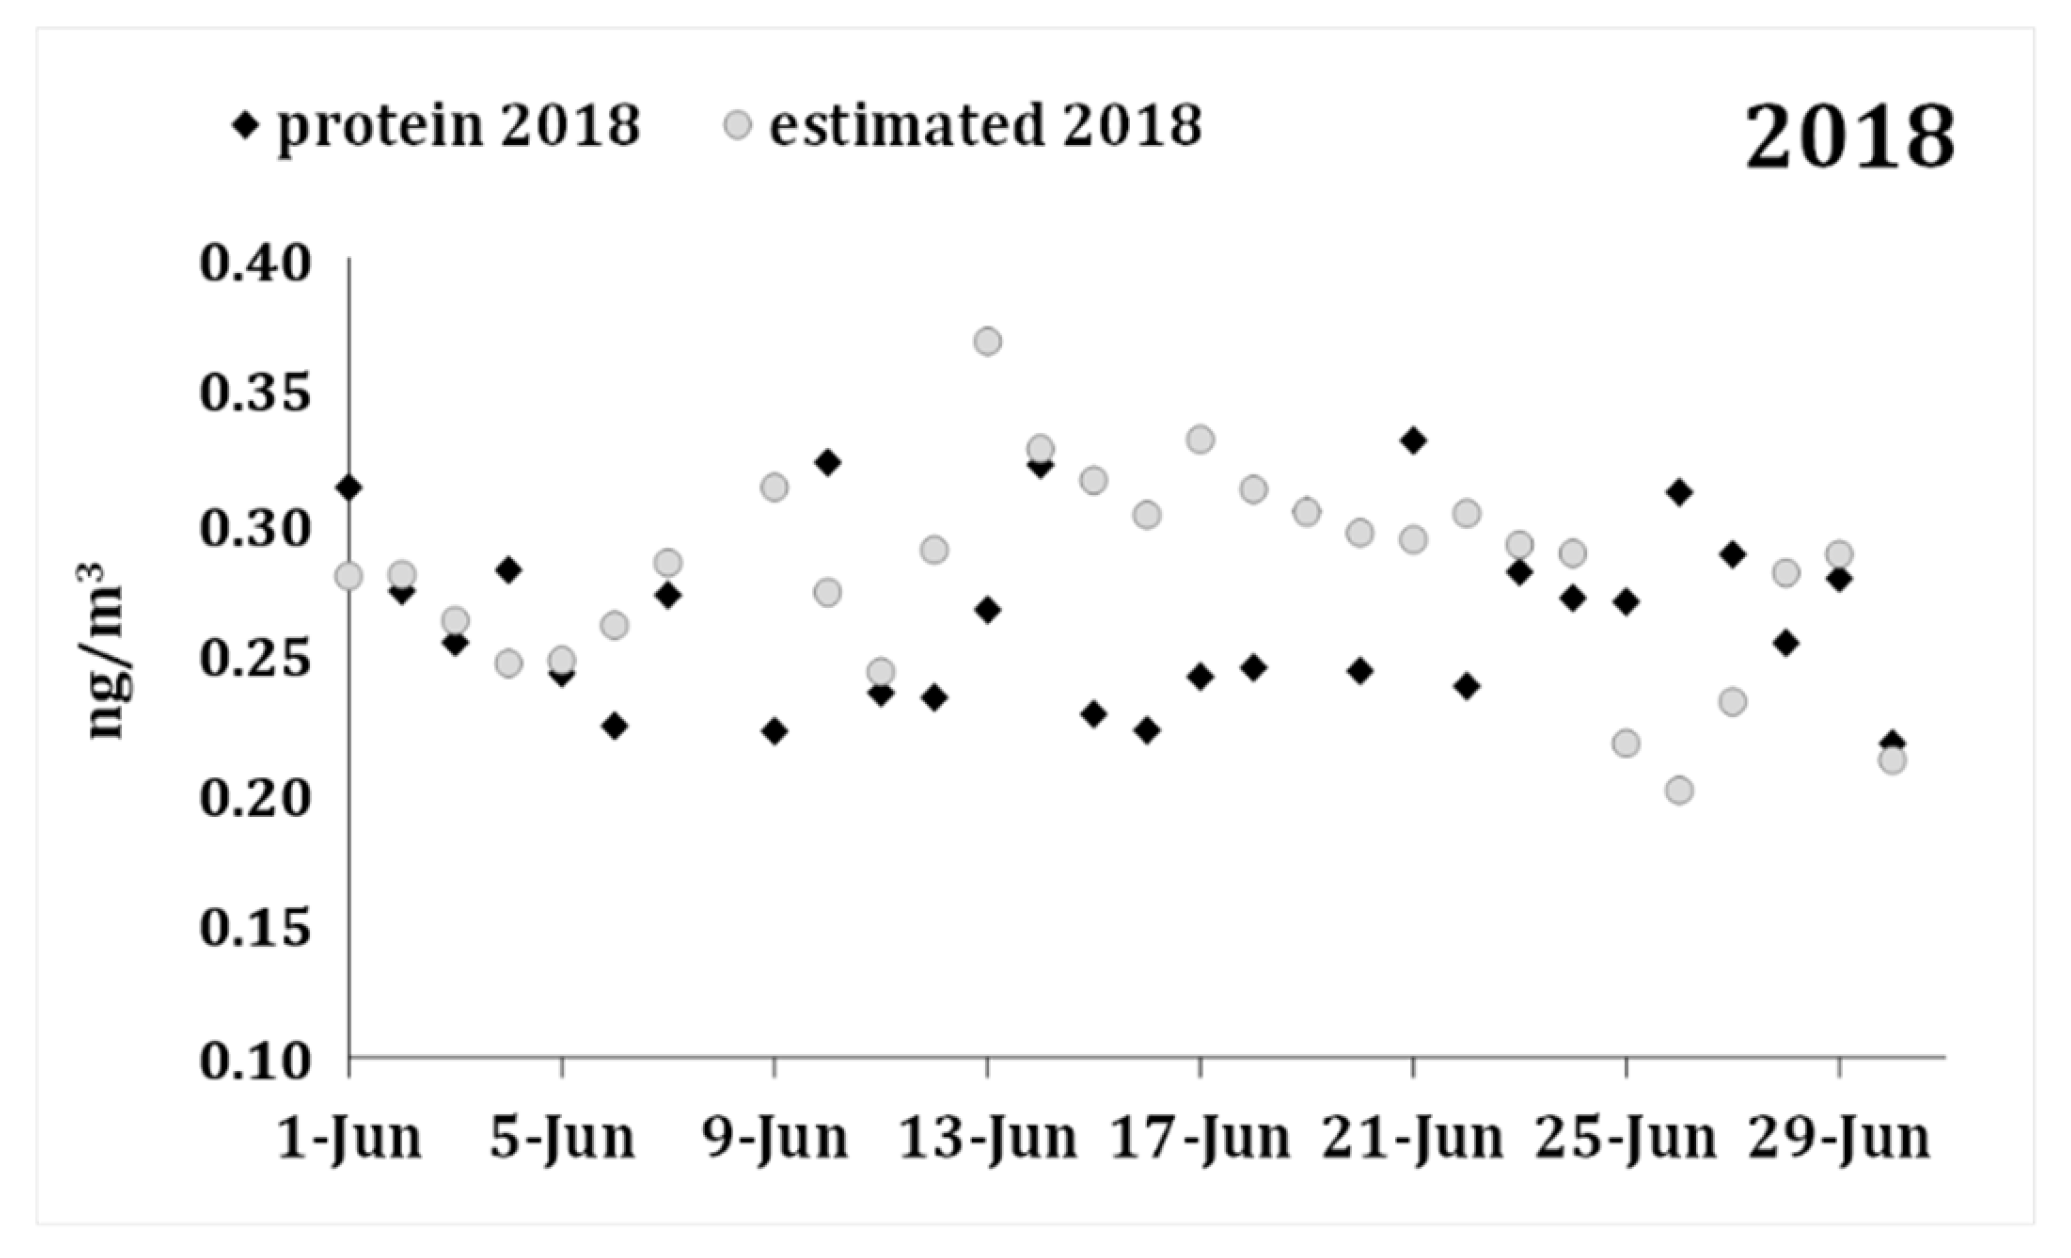
| Variable | Mean | Std. Dv. | N | Diff. | Std. Dv. Diff. | t | df | p |
|---|---|---|---|---|---|---|---|---|
| Protein 2018 | 0.266 | 0.034 | ||||||
| Forecast 2018 | 0.282 | 0.038 | 29 | −0.016 | 0.052 | −1.614 | 28 | 0.118 |
Publisher’s Note: MDPI stays neutral with regard to jurisdictional claims in published maps and institutional affiliations. |
© 2021 by the authors. Licensee MDPI, Basel, Switzerland. This article is an open access article distributed under the terms and conditions of the Creative Commons Attribution (CC BY) license (https://creativecommons.org/licenses/by/4.0/).
Share and Cite
González-Fernández, E.; Kennedy, R.; Osborn, R.; Fernández-González, M.; Rodríguez-Rajo, F.J. Botrytis cinerea Airborne Conidia and Their Germination Ability Assessed by Immunological Methods in a NW Spain Vineyard. Agronomy 2021, 11, 1441. https://doi.org/10.3390/agronomy11071441
González-Fernández E, Kennedy R, Osborn R, Fernández-González M, Rodríguez-Rajo FJ. Botrytis cinerea Airborne Conidia and Their Germination Ability Assessed by Immunological Methods in a NW Spain Vineyard. Agronomy. 2021; 11(7):1441. https://doi.org/10.3390/agronomy11071441
Chicago/Turabian StyleGonzález-Fernández, Estefanía, Roy Kennedy, Rachel Osborn, María Fernández-González, and Francisco Javier Rodríguez-Rajo. 2021. "Botrytis cinerea Airborne Conidia and Their Germination Ability Assessed by Immunological Methods in a NW Spain Vineyard" Agronomy 11, no. 7: 1441. https://doi.org/10.3390/agronomy11071441
APA StyleGonzález-Fernández, E., Kennedy, R., Osborn, R., Fernández-González, M., & Rodríguez-Rajo, F. J. (2021). Botrytis cinerea Airborne Conidia and Their Germination Ability Assessed by Immunological Methods in a NW Spain Vineyard. Agronomy, 11(7), 1441. https://doi.org/10.3390/agronomy11071441