
Changes in the Microbial Community in Soybean Plots Treated with Biochar and Poultry Litter


 , , and
Abstract
:1. Introduction
2. Materials and Methods
2.1. Soil Treatments, Soybean Culture Conditions, and Collection of Soil Samples
2.2. Soil Physicochemical Analyses
2.3. Biochar and Poultry Litter Analysis
2.4. DNA Sample Processing
2.5. Microbial Community Analysis
2.6. Microbial Network Analysis
3. Results
3.1. Soybean Growth and Yield
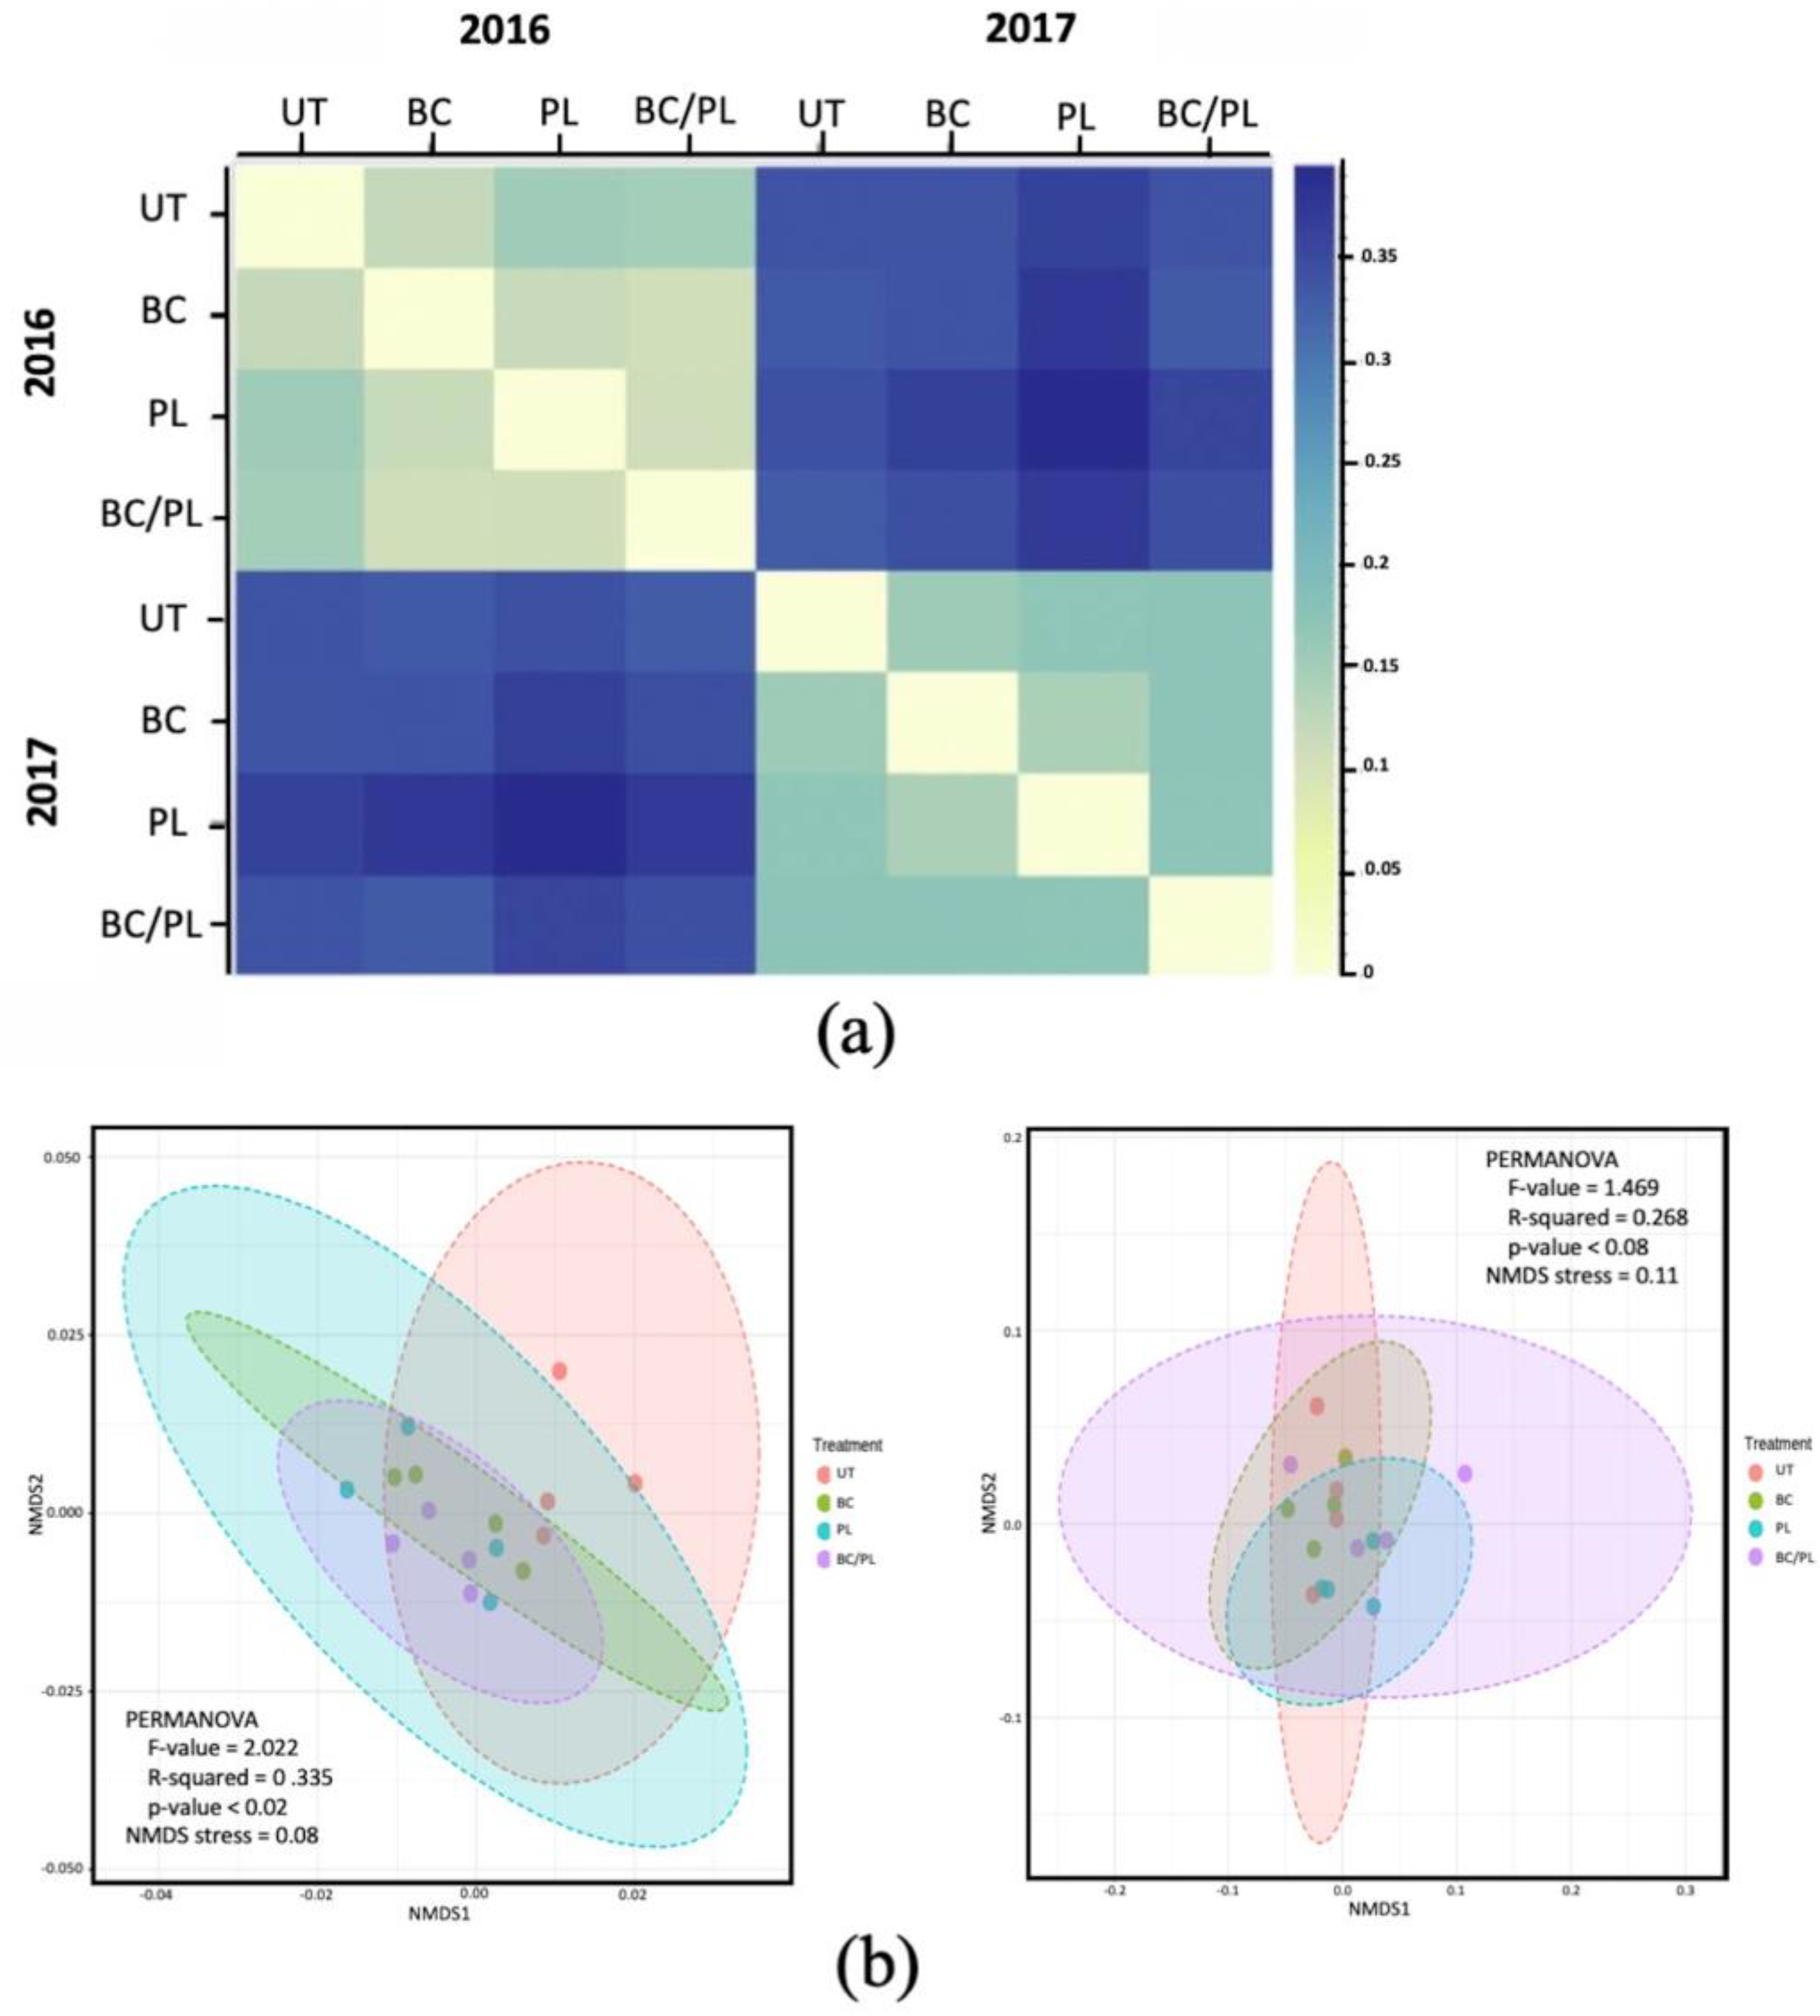
3.2. Microbial Community Profiles and Structure
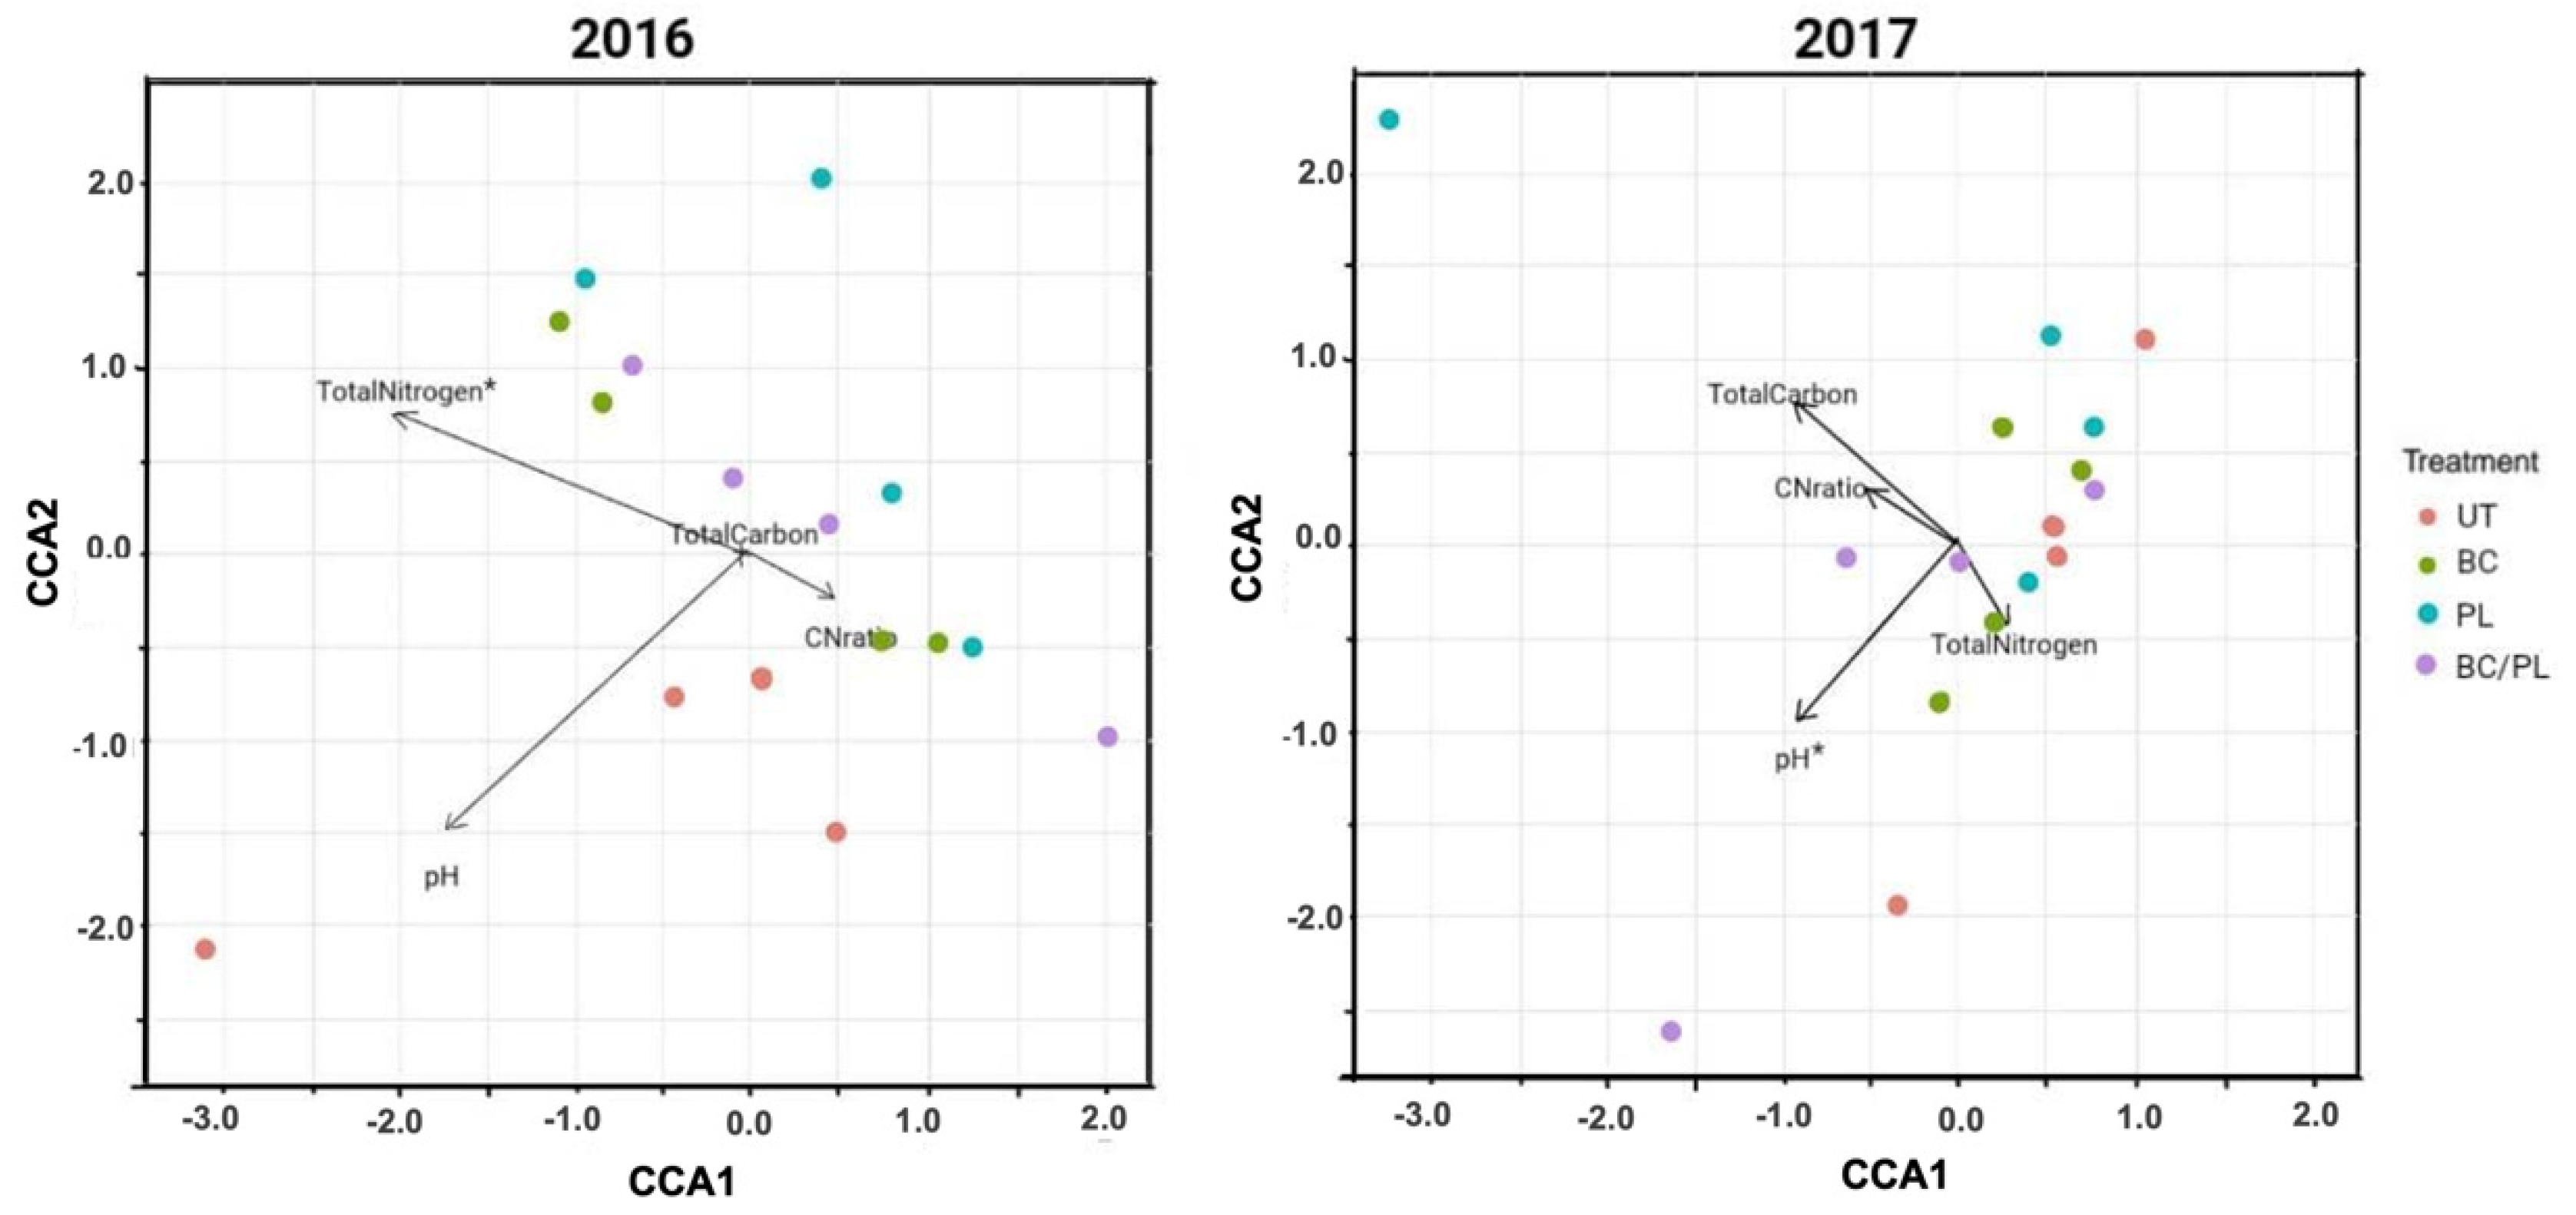
3.3. Canonical Correspondence Analysis
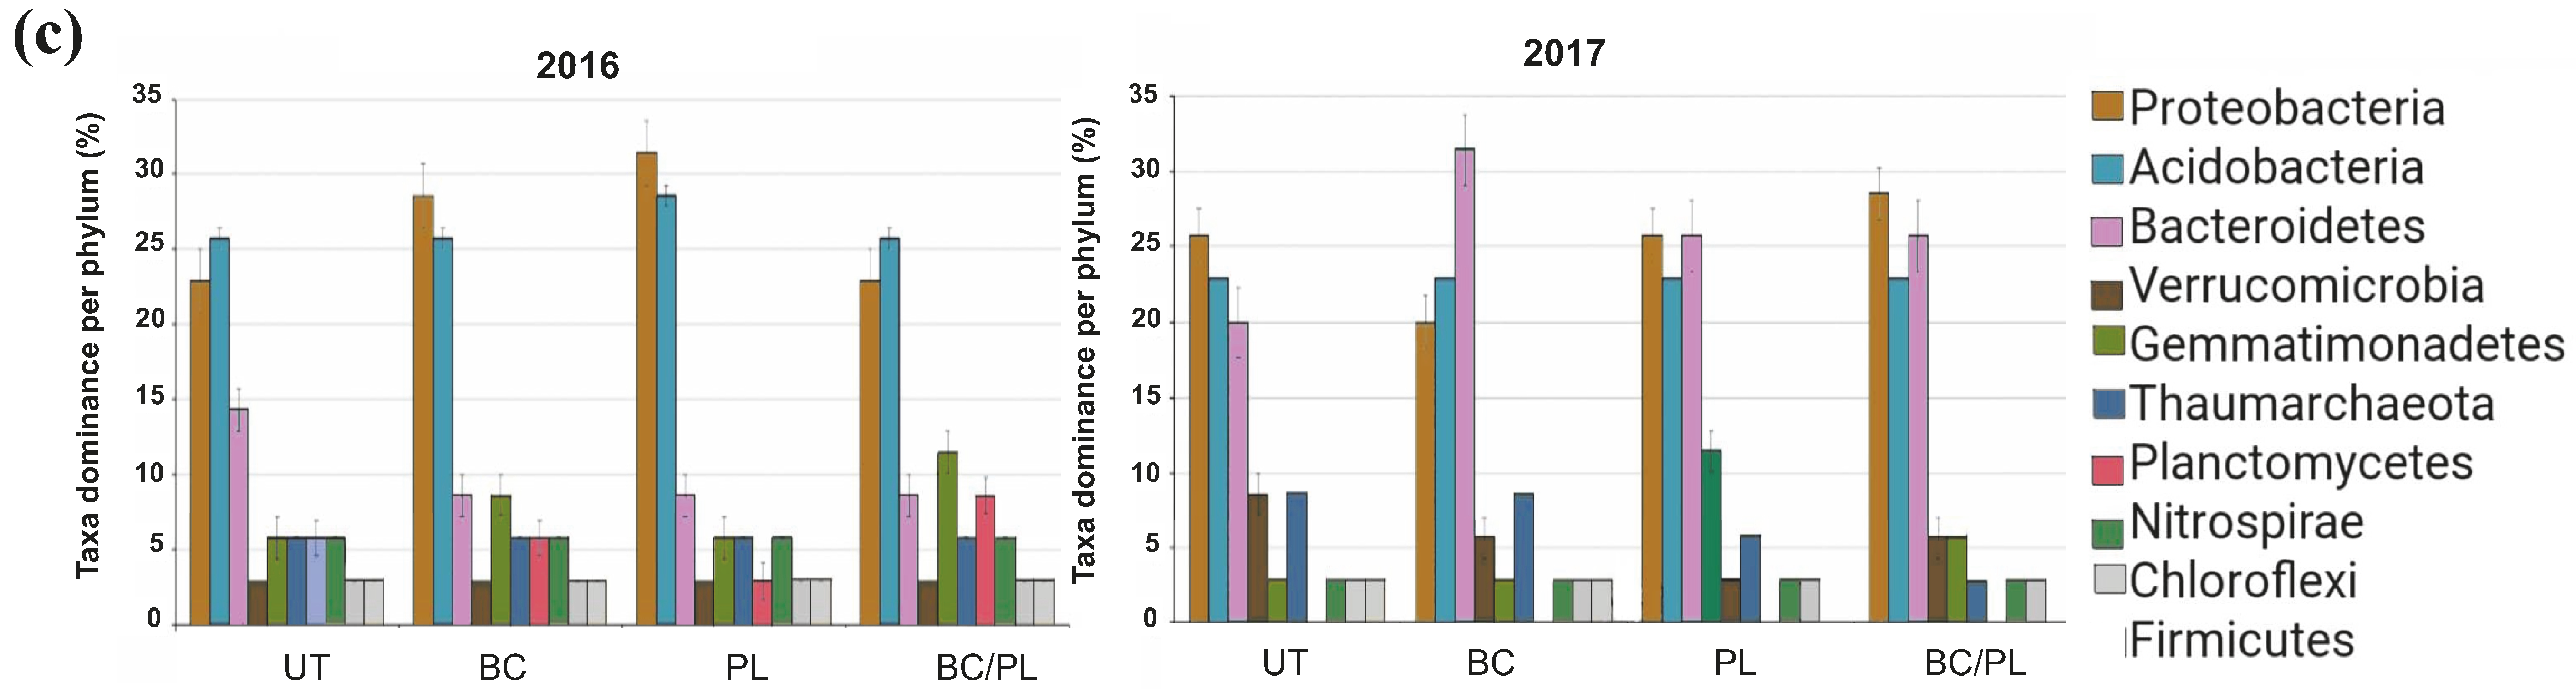
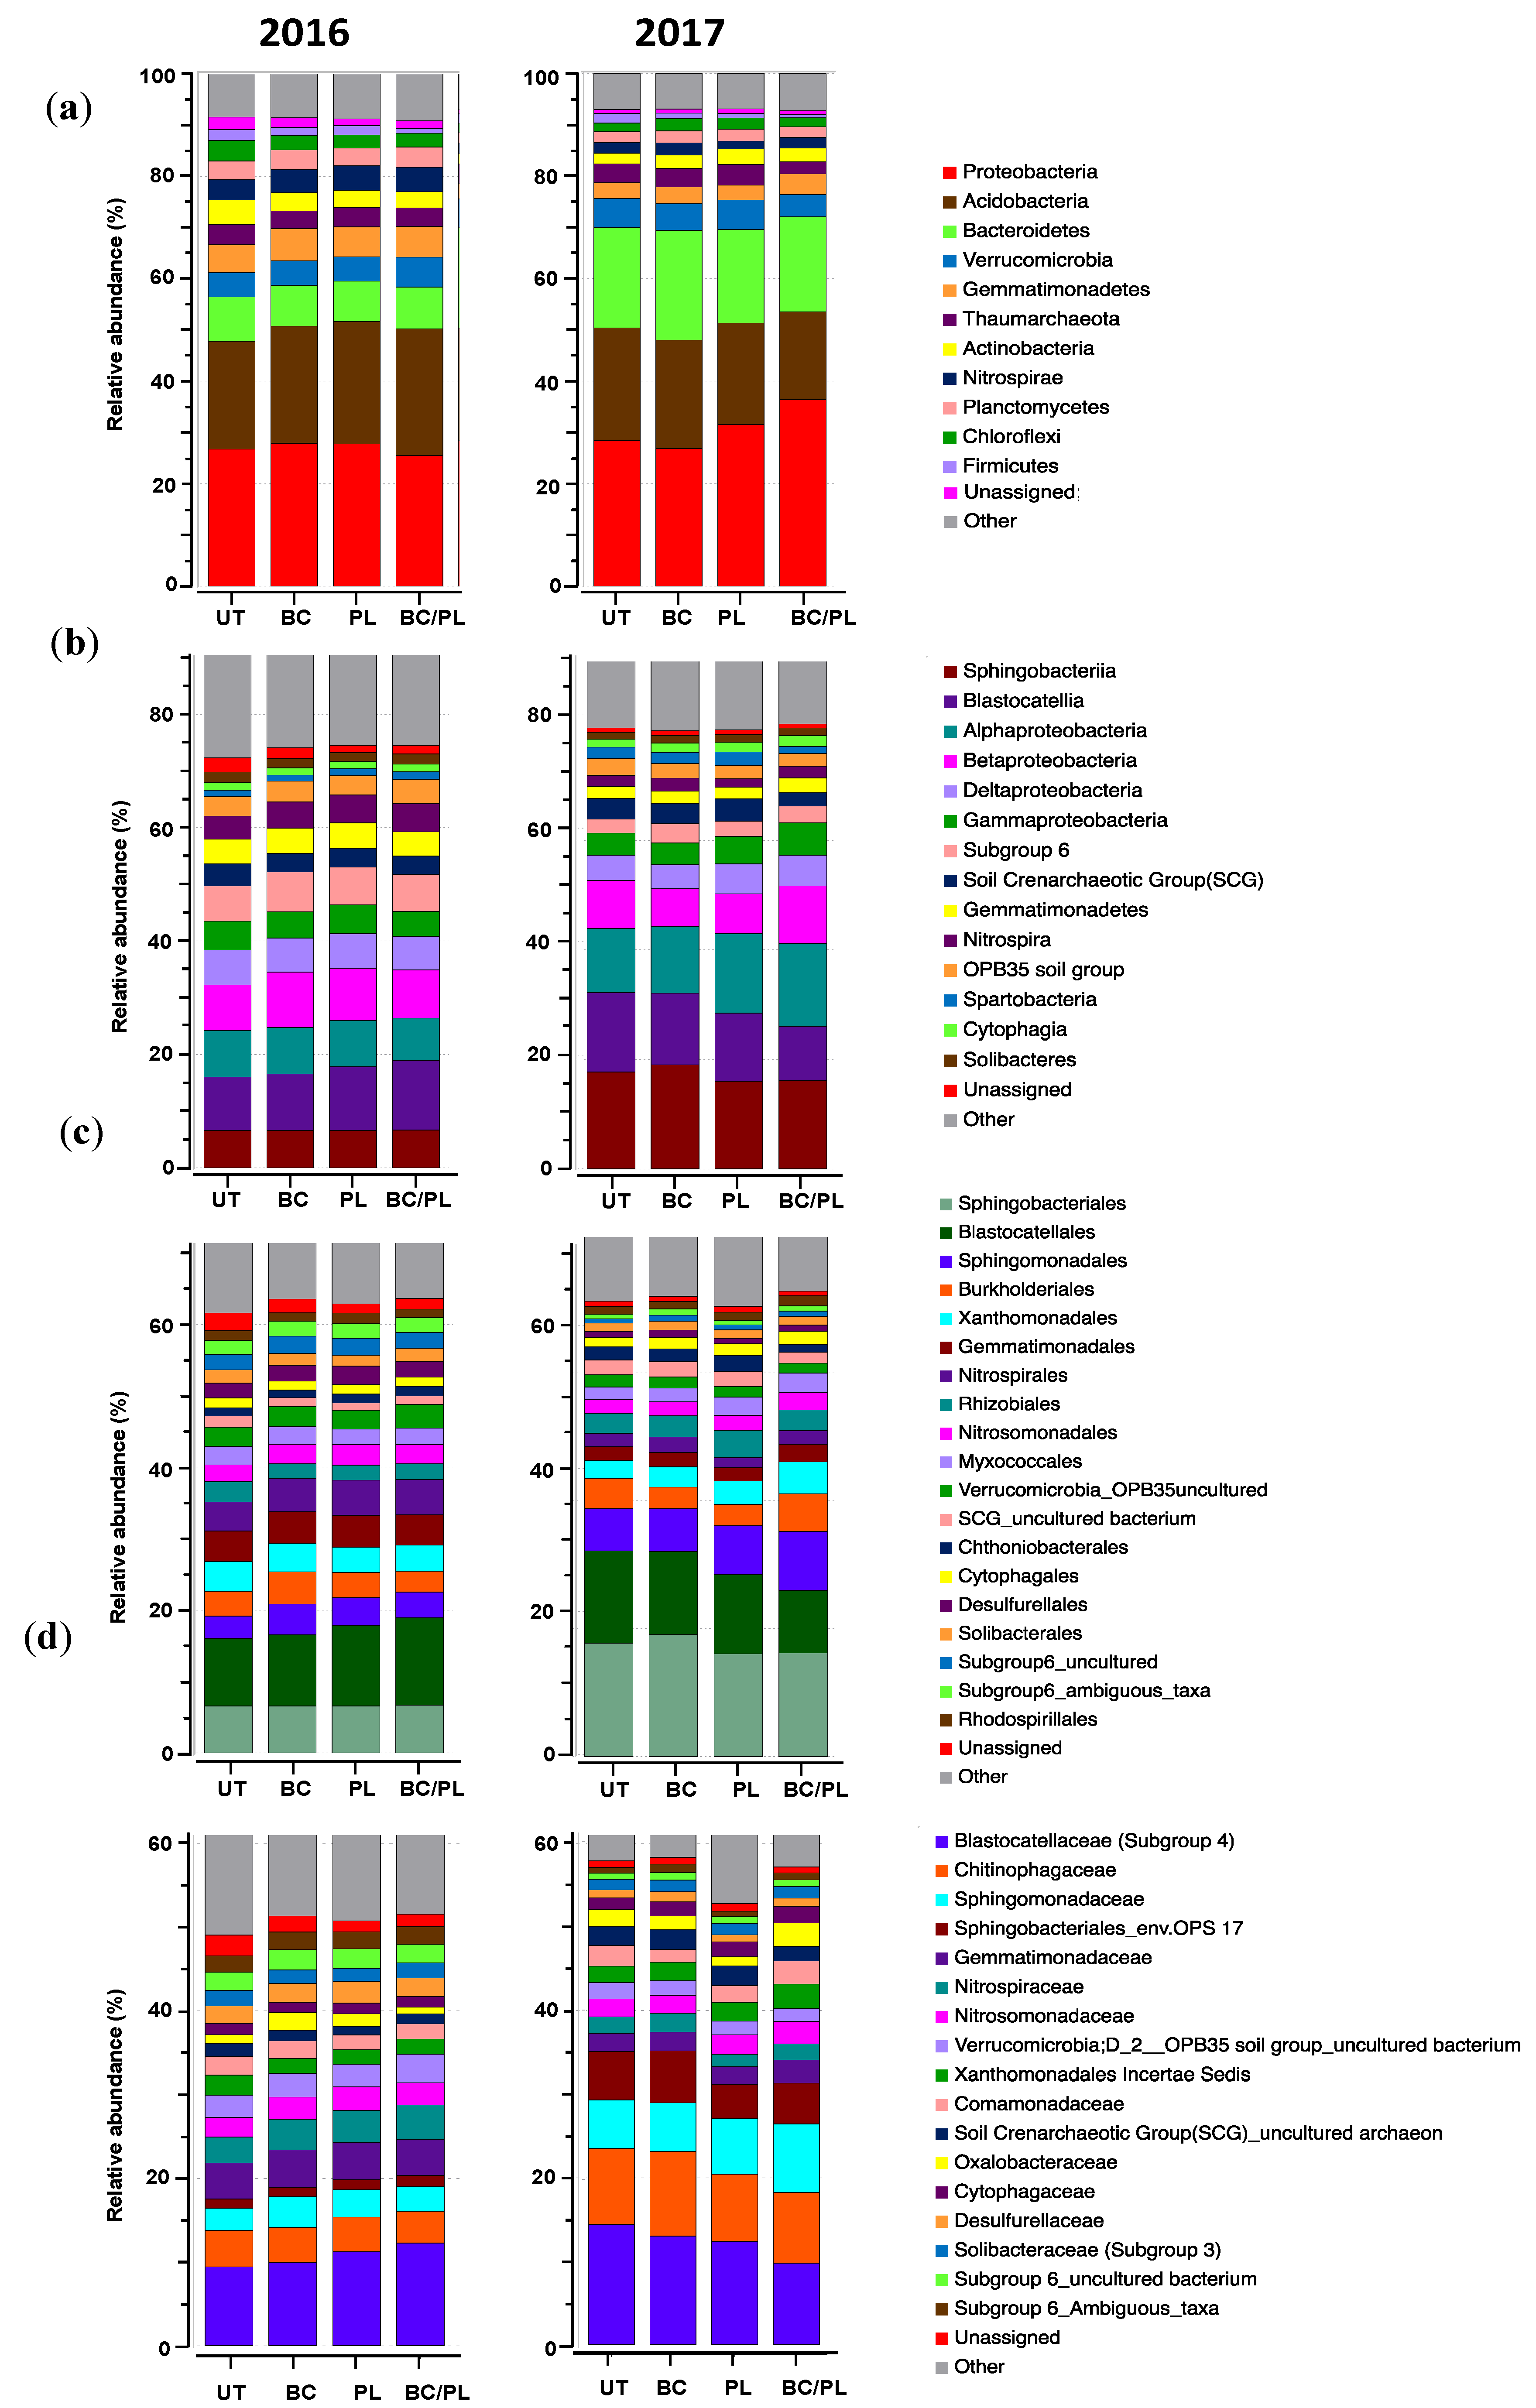
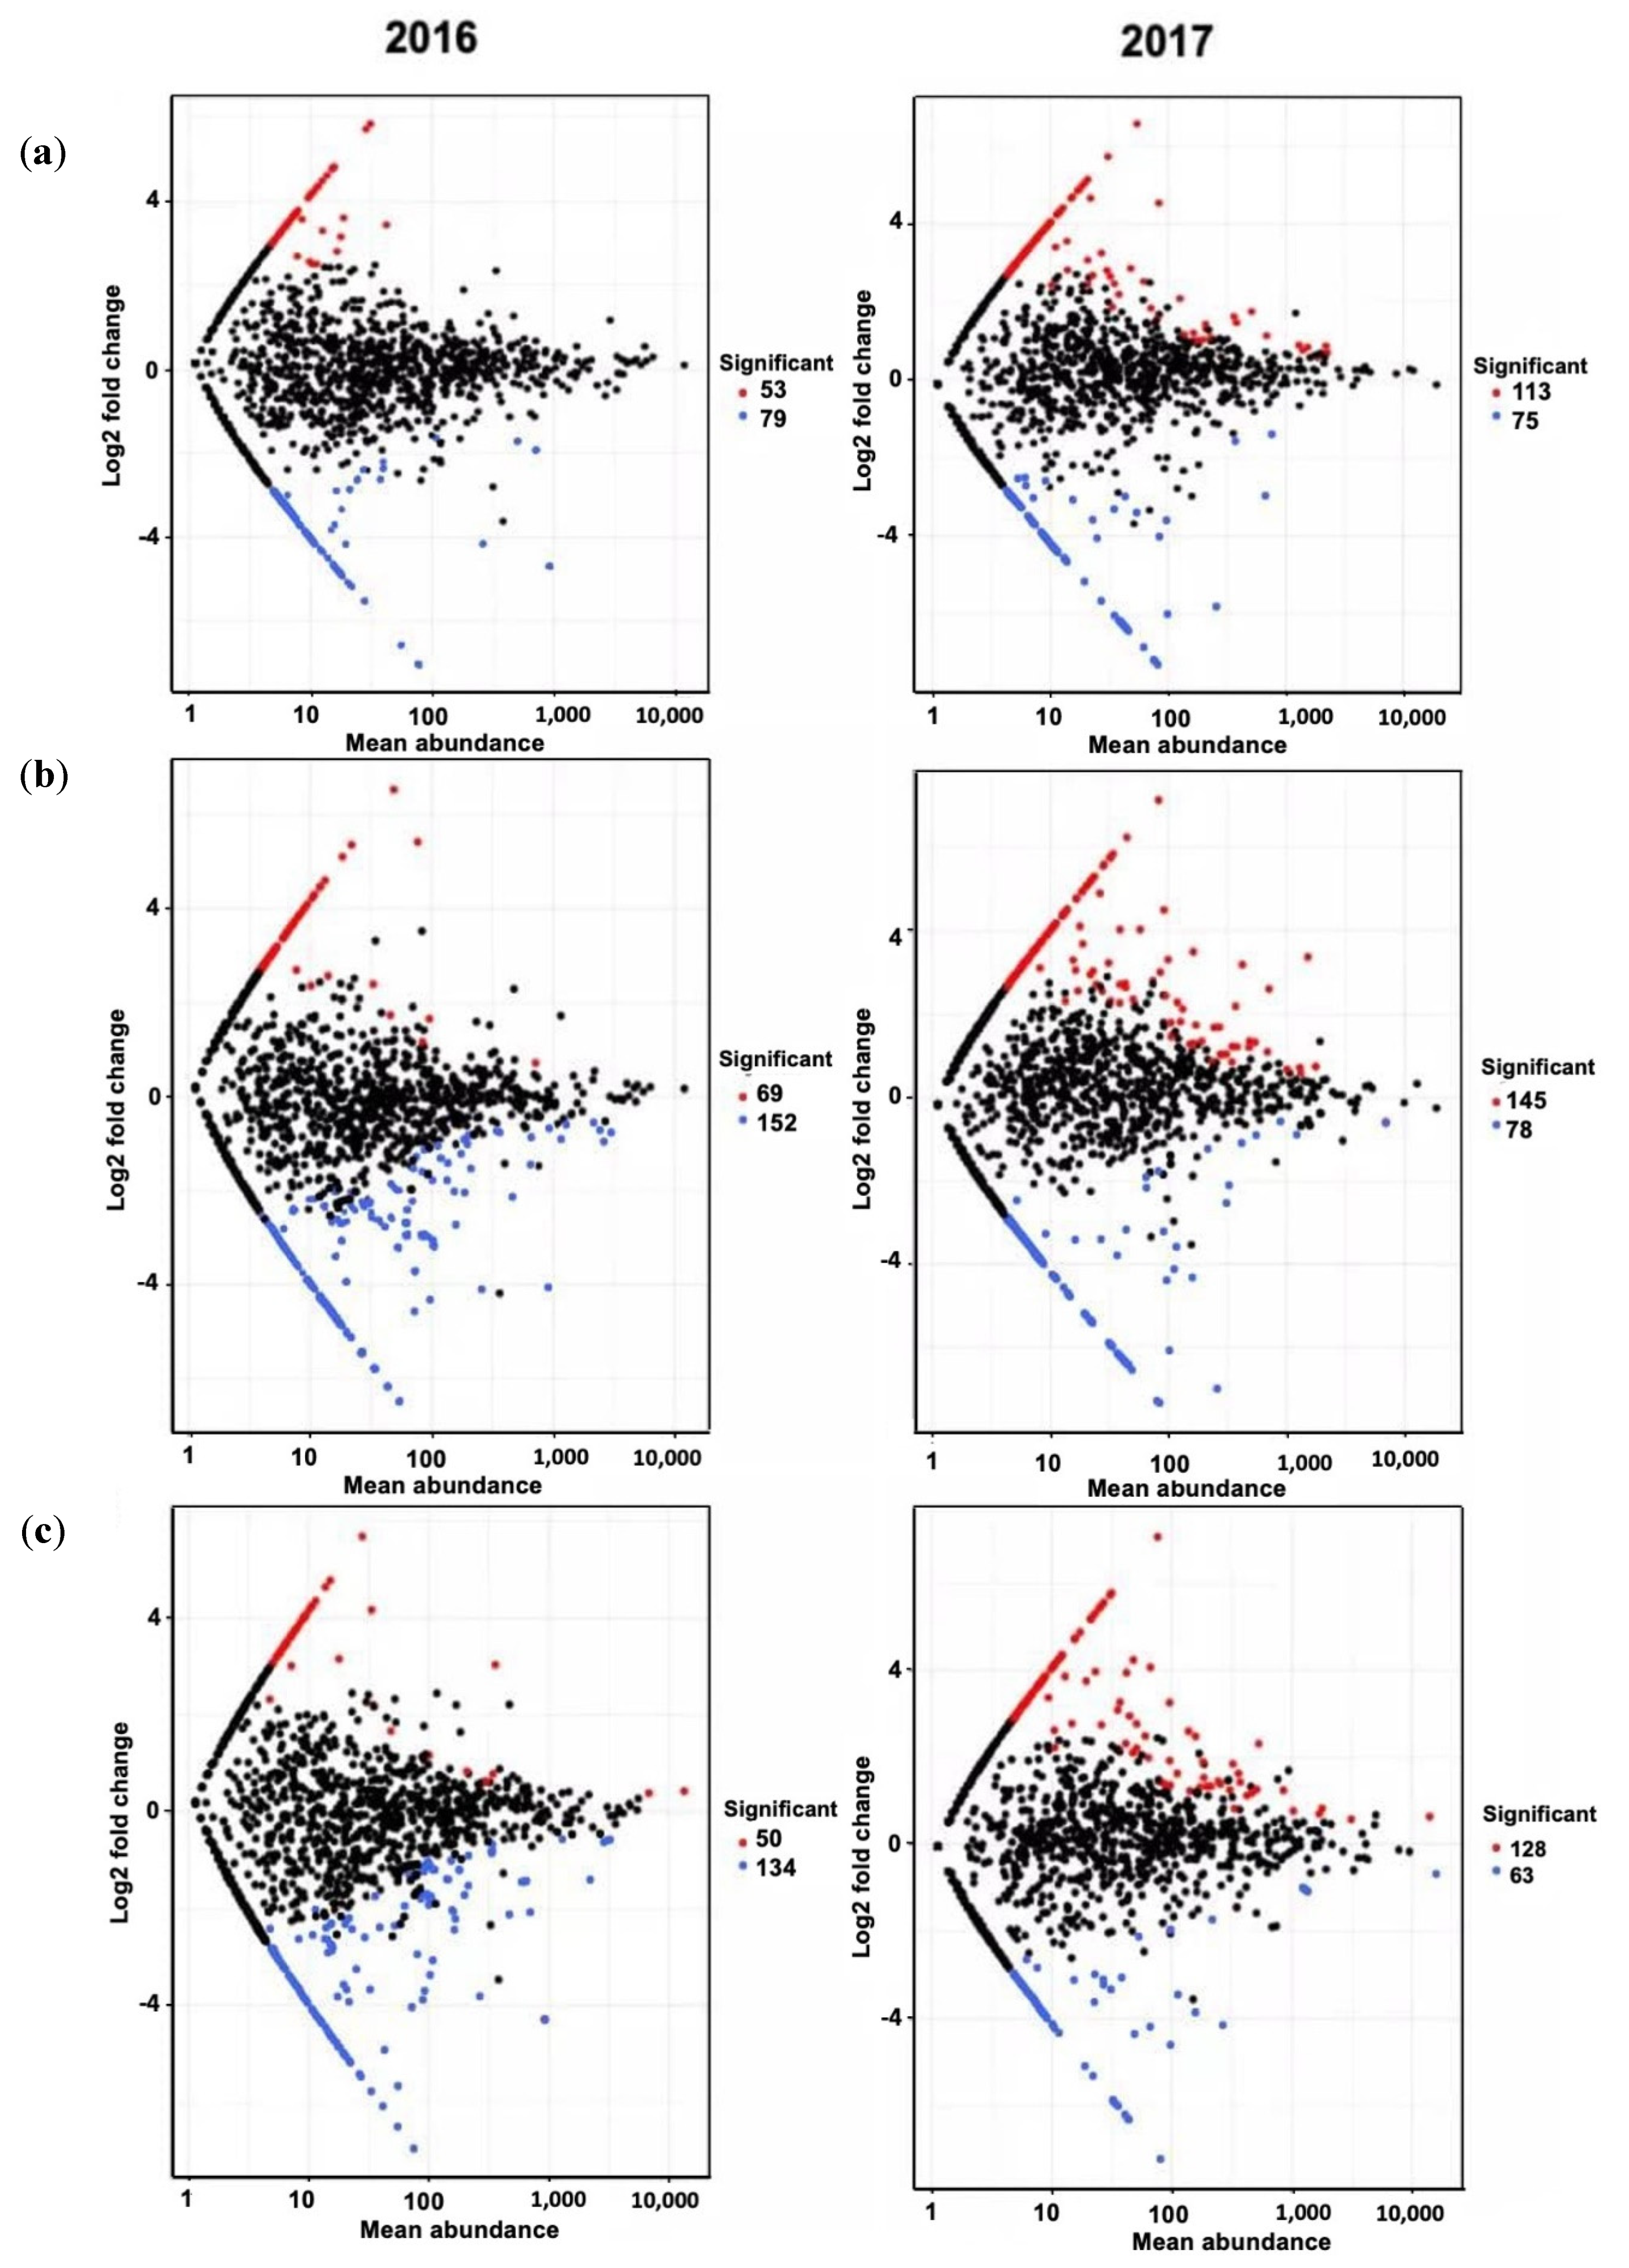
3.4. Bacterial Community Composition and Differential Abundance
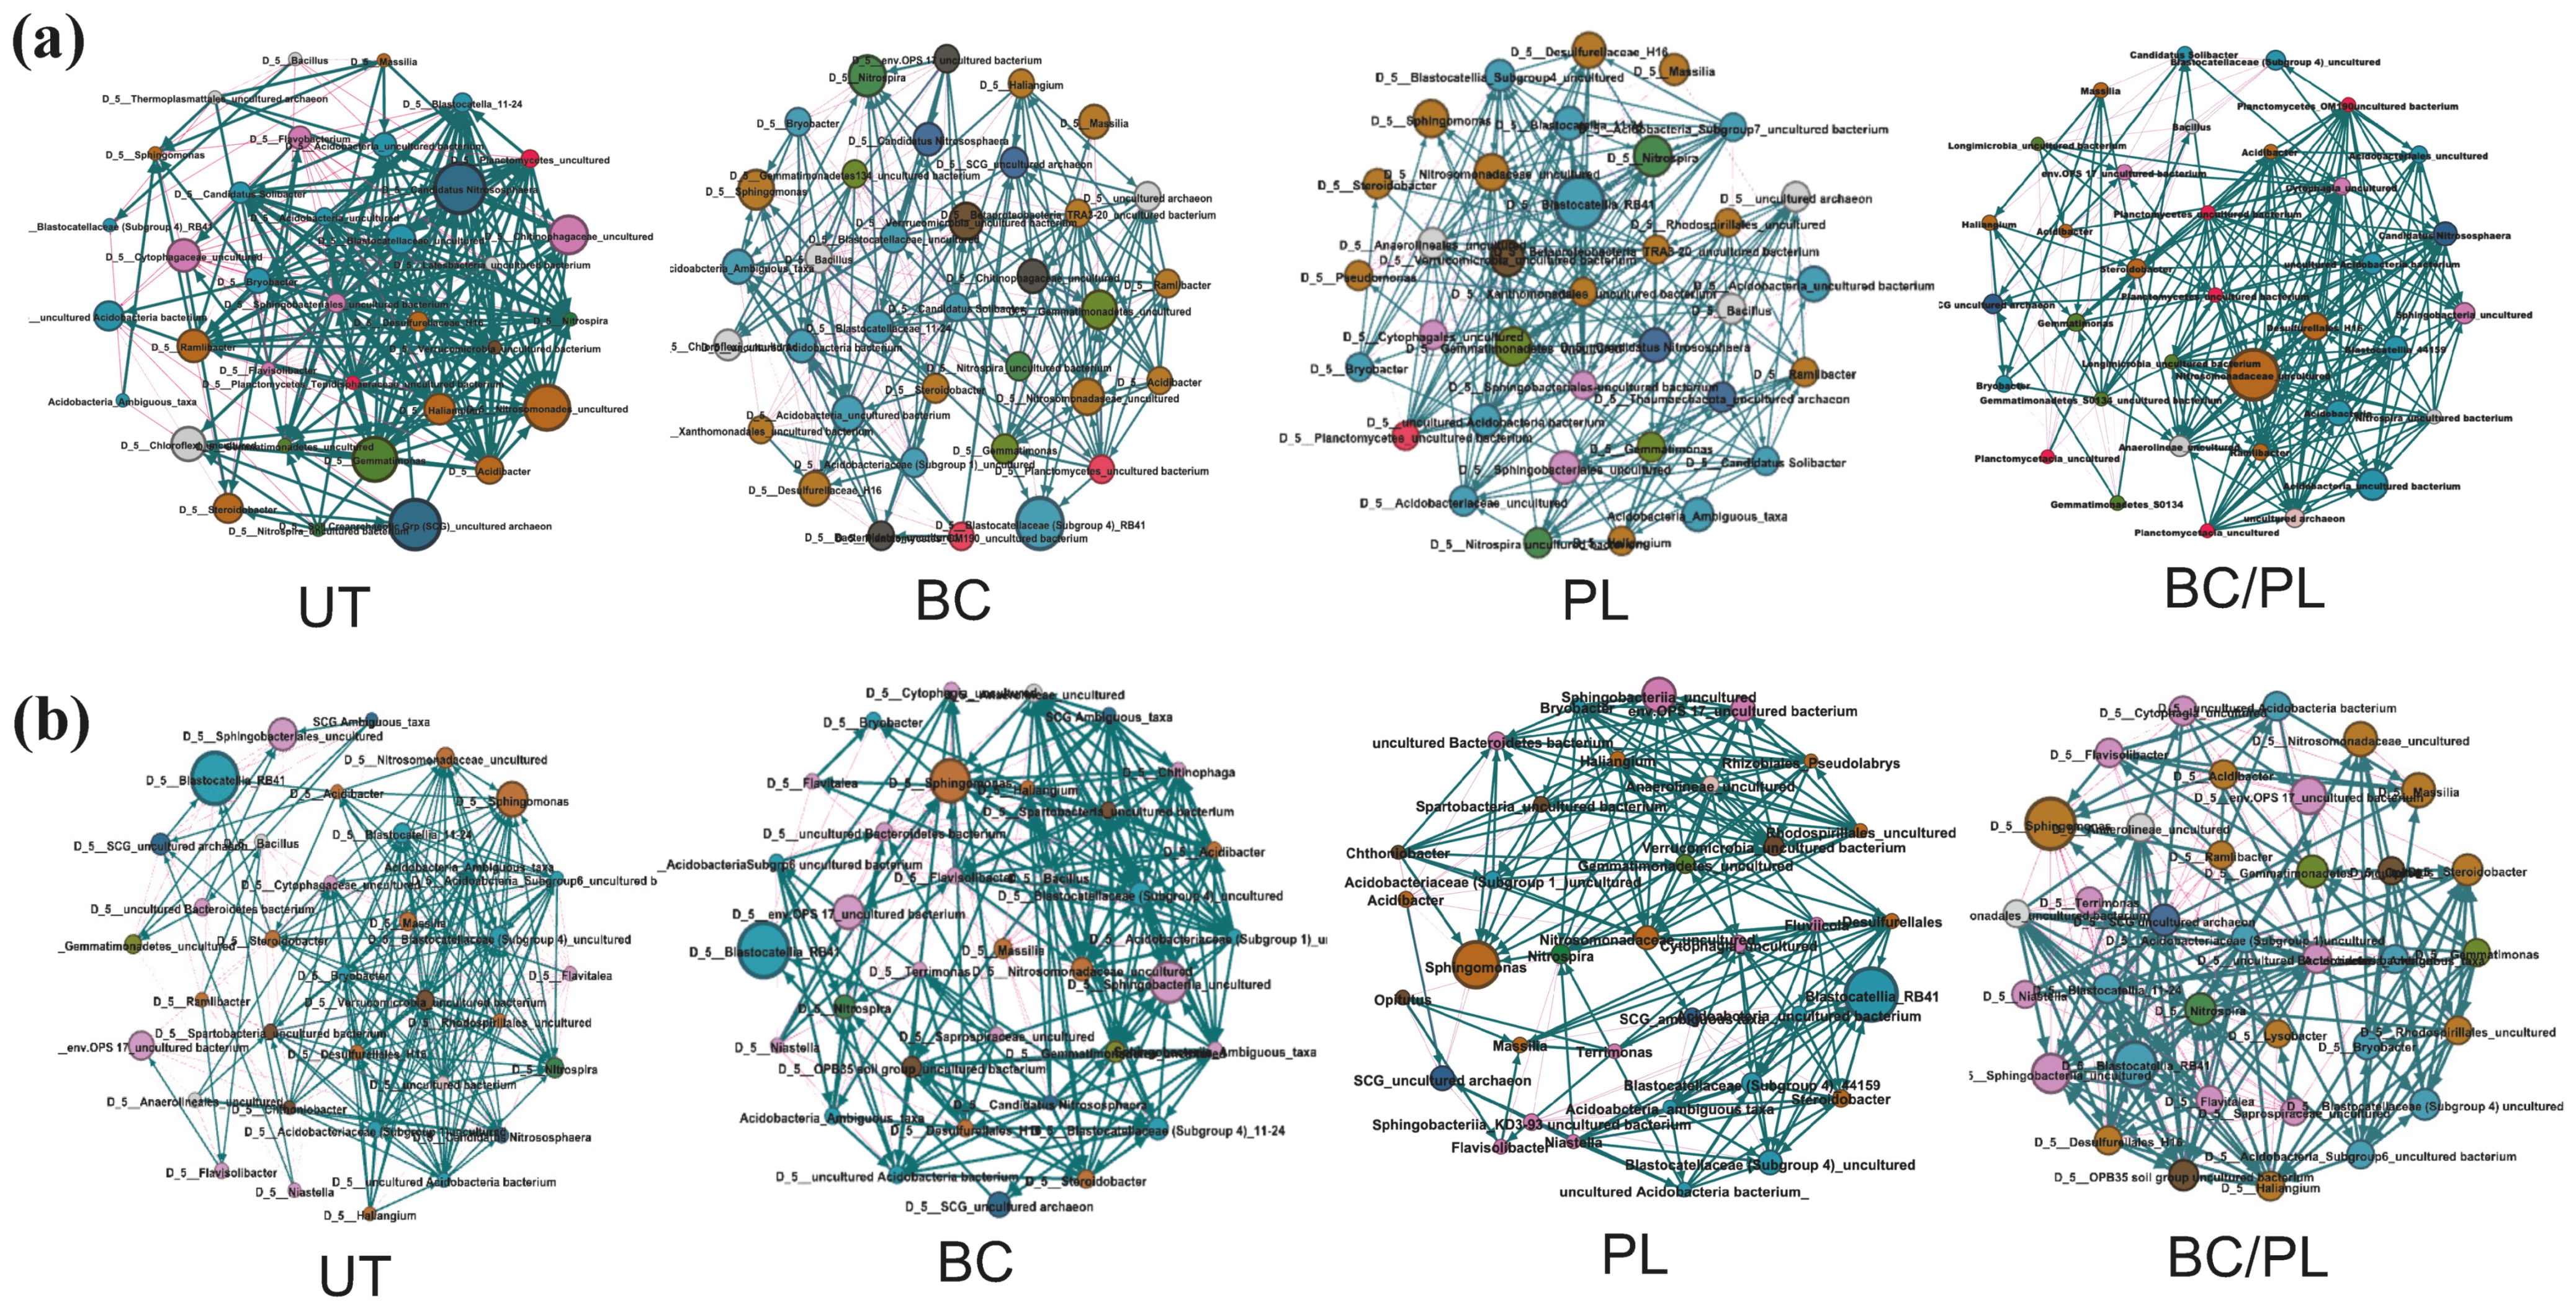
3.5. Microbial Network Analysis
4. Discussion
5. Conclusions
Supplementary Materials
Author Contributions
Funding
Data Availability Statement
Acknowledgments
Conflicts of Interest
References
- Janvier, C.; Villeneuve, F.; Alabouvette, C.; Edel-Hermann, V.; Mateille, T.; Steinberg, C. Soil health through soil disease suppression: Which strategy from descriptors to indicators? Soil Biol. Biochem. 2007, 39, 1–23. [Google Scholar] [CrossRef]
- FAO of the U.N. CropWat|Land & Water|Food and Agriculture Organization of the United Nations|Land & Water|Food and Agriculture Organization of the United Nations. Available online: http://www.fao.org/land-water/databases-and-software/crop-information/soybean/en/ (accessed on 5 January 2019).
- Mus, F.; Crook, M.B.; Garcia, K.; Garcia Costas, A.; Geddes, B.A.; Kouri, E.D.; Paramasivan, P.; Ryu, M.-H.; Oldroyd, G.E.D.; Poole, P.S.; et al. Symbiotic Nitrogen Fixation and the Challenges to Its Extension to Nonlegumes Downloaded from. Appl. Environ. Microbiol. 2016, 82. [Google Scholar] [CrossRef] [PubMed] [Green Version]
- Rascovan, N.; Carbonetto, B.; Perrig, D.; Díaz, M.; Canciani, W.; Abalo, M.; Alloati, J.; González-Anta, G.; Vazquez, M.P. Integrated analysis of root microbiomes of soybean and wheat from agricultural fields. Sci. Rep. 2016, 6. [Google Scholar] [CrossRef] [PubMed]
- Rodríguez-Navarro, D.N.; Margaret Oliver, I.; Albareda Contreras, M.; Ruiz-Sainz, J.E. Soybean interactions with soil microbes, agronomical and molecular aspects. Agron. Sustain. Dev. 2011, 31, 173–190. [Google Scholar] [CrossRef] [Green Version]
- Schmidt, J.E.; Kent, A.D.; Brisson, V.L.; Gaudin, A.C.M. Agricultural management and plant selection interactively affect rhizosphere microbial community structure and nitrogen cycling. Microbiome 2019, 7, 146. [Google Scholar] [CrossRef] [Green Version]
- Graham, E.B.; Knelman, J.E.; Schindlbacher, A.; Siciliano, S.; Breulmann, M.; Yannarell, A.; Beman, J.M.; Abell, G.; Philippot, L.; Prosser, J.; et al. Microbes as engines of ecosystem function: When does community structure enhance predictions of ecosystem processes? Front. Microbiol. 2016, 7. [Google Scholar] [CrossRef] [Green Version]
- Man, Y.; Wang, B.; Wang, J.; Slaný, M.; Yan, H.; Li, P.; El-Naggar, A.; Shaheen, S.M.; Rinklebe, J.; Feng, X. Use of biochar to reduce mercury accumulation in Oryza sativa L: A trial for sustainable management of historically polluted farmlands. Environ. Int. 2021, 153, 106527. [Google Scholar] [CrossRef]
- Mendes, L.W.; Kuramae, E.E.; Navarrete, A.A.; Van Veen, J.A.; Tsai, S.M. Taxonomical and functional microbial community selection in soybean rhizosphere. ISME J. 2014, 8, 1577–1587. [Google Scholar] [CrossRef]
- Fierer, N. Embracing the unknown: Disentangling the complexities of the soil microbiome. Nat. Rev. Microbiol. 2017, 15, 579–590. [Google Scholar] [CrossRef]
- Biochar: Prospects of Commercialization—Farm Energy. Available online: https://farm-energy.extension.org/biochar-prospects-of-commercialization/#TheStateoftheBiocharIndustry (accessed on 14 June 2021).
- Abiven, S.; Schmidt, M.W.I.; Lehmann, J. Biochar by Design. Nat. Geosci. 2014, 7, 326–327. [Google Scholar] [CrossRef]
- Dai, Z.; Hu, J.; Xu, X.; Zhang, L.; Brookes, P.C.; He, Y.; Xu, J. Sensitive responders among bacterial and fungal microbiome to pyrogenic organic matter (biochar) addition differed greatly between rhizosphere and bulk soils. Sci. Rep. 2016, 6, 36101. [Google Scholar] [CrossRef] [PubMed] [Green Version]
- Lehmann, J.; Rillig, M.C.; Thies, J.; Masiello, C.A.; Hockaday, W.C.; Crowley, D. Biochar effects on soil biota—A review. Soil Biol. Biochem. 2011, 43, 1812–1836. [Google Scholar] [CrossRef]
- Elad, Y.; David, D.R.; Harel, Y.M.; Borenshtein, M.; Kalifa, H.B.; Silber, A.; Graber, E.R. Induction of systemic resistance in plants by biochar, a soil-applied carbon sequestering agent. Phytopathology 2010, 100, 913–921. [Google Scholar] [CrossRef] [PubMed] [Green Version]
- Palansooriya, K.N.; Wong, J.T.F.; Hashimoto, Y.; Huang, L.; Rinklebe, J.; Chang, S.X.; Bolan, N.; Wang, H.; Ok, Y.S. Response of microbial communities to biochar-amended soils: A critical review. Biochar 2019, 1, 3–22. [Google Scholar] [CrossRef] [Green Version]
- Lin, Y.; Watts, D.B.; Van Santen, E.; Cao, G. Influence of poultry litter on crop productivity under different field conditions: A meta-analysis. Agron. J. 2018, 110, 807–818. [Google Scholar] [CrossRef]
- EPA. National Management Measures to Control Nonpoint Source Pollution from Agriculture; Office of Water: Washington, DC, USA, 2003.
- Lehmann, J. Commentary. Nature 2007, 447, 10–11. [Google Scholar]
- Spokas, K.A.; Novak, J.M.; Stewart, C.E.; Cantrell, K.B.; Uchimiya, M.; DuSaire, M.G.; Ro, K.S. Qualitative analysis of volatile organic compounds on biochar. Chemosphere 2011, 85, 869–882. [Google Scholar] [CrossRef] [PubMed]
- Jeong, C.Y.; Dodla, S.K.; Wang, J.J. Fundamental and molecular composition characteristics of biochars produced from sugarcane and rice crop residues and by-products. Chemosphere 2016, 142, 4–13. [Google Scholar] [CrossRef]
- Martínez-Hidalgo, P.; Hirsch, A.M. The Nodule Microbiome: N2-Fixing Rhizobia Do Not Live Alone. Phytobiomes J. 2017, 1, 70–82. [Google Scholar] [CrossRef] [Green Version]
- Sharaf, H.; Rodrigues, R.R.; Moon, J.; Zhang, B.; Mills, K.; Williams, M.A. Unprecedented bacterial community richness in soybean nodules vary with cultivar and water status. Microbiome 2019, 7. [Google Scholar] [CrossRef]
- Sugiyama, A.; Ueda, Y.; Zushi, T.; Takase, H.; Yazaki, K. Changes in the Bacterial Community of Soybean Rhizospheres during Growth in the Field. PLoS ONE 2014, 9, 100709. [Google Scholar] [CrossRef] [Green Version]
- Egamberdieva, D.; Wirth, S.; Behrendt, U.; Abd Allah, E.F.; Berg, G. Biochar Treatment Resulted in a Combined Effect on Soybean Growth Promotion and a Shift in Plant Growth Promoting Rhizobacteria. Front. Microbiol. 2016, 7, 209. [Google Scholar] [CrossRef] [PubMed] [Green Version]
- Khadem, A.; Raiesi, F. Responses of microbial performance and community to corn biochar in calcareous sandy and clayey soils. Appl. Soil Ecol. 2017, 114, 16–27. [Google Scholar] [CrossRef]
- Luo, S.; Wang, S.; Tian, L.; Li, S.; Li, X.; Shen, Y.; Tian, C. Long-term biochar application influences soil microbial community and its potential roles in semiarid farmland. Appl. Soil Ecol. 2017, 117–118, 10–15. [Google Scholar] [CrossRef]
- Zhu, L.X.; Xiao, Q.; Shen, Y.F.; Li, S.Q. Microbial functional diversity responses to 2 years since biochar application in silt-loam soils on the Loess Plateau. Ecotoxicol. Environ. Saf. 2017, 144, 578–584. [Google Scholar] [CrossRef] [PubMed]
- Lehmann, J.; Silva, J.P.d.; Steiner, C.; Nehls, T.; Zech, W.; Glaser, B. Nutrient availability and leaching in an archaeological anthrosol and a ferralsol of the Central Amazon basin: Fertilizer, manure and charcoal amendments. Plant Soil 2003, 249, 343–357. [Google Scholar] [CrossRef]
- Steiner, C.; Teixeira, W.G.; Lehmann, J.; Nehls, T.; De MacÊdo, J.L.V.; Blum, W.E.H.; Zech, W. Long term effects of manure, charcoal and mineral fertilization on crop production and fertility on a highly weathered Central Amazonian upland soil. Plant Soil 2007, 291, 275–290. [Google Scholar] [CrossRef] [Green Version]
- Shin, J.D.; Park, S.W.; Jeong, C. Assessment of Agro-Environmental Impacts for Supplemented Methods to Biochar Manure Pellets during Rice (Oryza sativa L.) Cultivation. Energies 2020, 13, 2070. [Google Scholar] [CrossRef] [Green Version]
- Tian, J.; Wang, J.; Dippold, M.; Gao, Y.; Blagodatskaya, E.; Kuzyakov, Y. Biochar affects soil organic matter cycling and microbial functions but does not alter microbial community structure in a paddy soil. Sci. Total Environ. 2016, 556, 89–97. [Google Scholar] [CrossRef]
- Elzobair, K.A.; Stromberger, M.E.; Ippolito, J.A.; Lentz, R.D. Contrasting effects of biochar versus manure on soil microbial communities and enzyme activities in an Aridisol. Chemosphere 2016, 142, 145–152. [Google Scholar] [CrossRef]
- Sandhu, S.; Sekaran, U.; Ozlu, E.; Hoilett, N.O.; Kumar, S. Short-term impacts of biochar and manure application on soil labile carbon fractions, enzyme activity, and microbial community structure. Biochar 2019, 1, 271–282. [Google Scholar] [CrossRef] [Green Version]
- Spivey, T. Louisiana Soybean Nutrient Handbook; LSU AgCenter: Baton Rouge, LA, USA, 2018; Available online: https://www.lsuagcenter.com/articles/page1544546713123 (accessed on 5 January 2019).
- Bigham, J.M. Method of Soil Analysis. Part 3-Chemical Methods. Soil Sci. Soc. Am. B Ser. 1996, 5, 961–1010. [Google Scholar]
- Klute, A. Method of Soil Analysis. Part 1—Physical and Mineralogical Methods. Soil Sci. Soc. Am. B Ser. 1986, 2, 1188. [Google Scholar]
- Caporaso, J.G.; Lauber, C.L.; Walters, W.A.; Berg-Lyons, D.; Huntley, J.; Fierer, N.; Owens, S.M.; Betley, J.; Fraser, L.; Bauer, M.; et al. Ultra-high-throughput microbial community analysis on the Illumina HiSeq and MiSeq platforms. ISME J. 2012, 6, 1621–1624. [Google Scholar] [CrossRef] [Green Version]
- Bokulich, N.A.; Kaehler, B.D.; Rideout, J.R.; Dillon, M.; Bolyen, E.; Knight, R.; Huttley, G.A.; Caporaso, J.G. Optimizing taxonomic classification of marker-gene amplicon sequences with QIIME 2′s q2-feature-classifier plugin. Microbiome 2018, 6, 90. [Google Scholar] [CrossRef]
- Callahan, B.J.; McMurdie, P.J.; Rosen, M.J.; Han, A.W.; Johnson, A.J.A.; Holmes, S.P. DADA2: High-resolution sample inference from Illumina amplicon data. Nat. Methods 2016, 13, 581. [Google Scholar] [CrossRef] [Green Version]
- Camacho, C.; Coulouris, G.; Avagyan, V.; Ma, N.; Papadopoulos, J.; Bealer, K.; Madden, T.L. BLAST+: Architecture and applications. BMC Bioinform. 2009, 10, 421. [Google Scholar] [CrossRef] [PubMed] [Green Version]
- Katoh, K.; Misawa, K.; Kuma, K.I.; Miyata, T. MAFFT: A novel method for rapid multiple sequence alignment based on fast Fourier transform. Nucleic Acids Res. 2002, 30, 3059–3066. [Google Scholar] [CrossRef] [PubMed] [Green Version]
- Price, M.N.; Dehal, P.S.; Arkin, A.P. FastTree 2-Approximately Maximum-Likelihood Trees for Large Alignments. PLoS Comput. Biol. 2010. [Google Scholar] [CrossRef]
- Neilson, J.W.; Califf, K.; Cardona, C.; Copeland, A.; van Treuren, W.; Josephson, K.L.; Knight, R.; Gilbert, J.A.; Quade, J.; Caporaso, J.G.; et al. Significant Impacts of Increasing Aridity on the Arid Soil Microbiome. mSystems 2017, 2. [Google Scholar] [CrossRef] [Green Version]
- Wagner Mackenzie, B.; Waite, D.W.; Taylor, M.W. Evaluating variation in human gut microbiota profiles due to DNA extraction method and inter-subject differences. Front. Microbiol. 2015, 6, 130. [Google Scholar] [CrossRef] [Green Version]
- DeSantis, T.Z.; Hugenholtz, P.; Larsen, N.; Rojas, M.; Brodie, E.L.; Keller, K.; Huber, T.; Dalevi, D.; Hu, P.; Andersen, G.L. Greengenes, a chimera-checked 16S rRNA gene database and workbench compatible with ARB. Appl. Environ. Microbiol. 2006, 72, 5069–5072. [Google Scholar] [CrossRef] [PubMed] [Green Version]
- Faith, D.P. Conservation evaluation and phylogenetic diversity. Biol. Conserv. 1992, 61, 1–10. [Google Scholar] [CrossRef]
- Shannon, C.E.; Weaver, W. The Mathematical Theory of Communication; University of Illinois Press: Urbana, IL, USA, 1949; Volume 27, pp. 379–423. [Google Scholar]
- Lozupone, C.; Knight, R. UniFrac: A new phylogenetic method for comparing microbial communities. Appl. Environ. Microbiol. 2005, 71, 8228–8235. [Google Scholar] [CrossRef] [Green Version]
- Love, M.I.; Huber, W.; Anders, S. Moderated estimation of fold change and dispersion for RNA-seq data with DESeq2. Genome Biol. 2014, 15, 550. [Google Scholar] [CrossRef] [Green Version]
- Oksanen, J.; Blanchet, F.G.; Friendly, M.; Kindt, R.; Legendre, P.; McGlinn, D.; Minchin, P.; O’Hara, R.; Simpson, G.; Solymos, P.; et al. Vegan: Community Ecology Package. Ordination Methods, Diversity Analysis and Other Functions for Community and Vegetation Ecologists. Version 2.4-6. Available online: https://CRAN.R-project.org/package=vegan. (accessed on 15 January 2018).
- Clarke, K.R.; Ainsworth, M. A Method of Linking Multivariate Community Structure to Environmental Variables; lymouth PL1 3DH; Marine Ecology Progress Series; lymouth Marine Laboratory: England, UK, 1993; Volume 92, pp. 205–219. [Google Scholar] [CrossRef]
- Robertson, C.E.; Harris, J.K.; Wagner, B.D.; Granger, D.; Browne, K.; Tatem, B.; Feazel, L.M.; Park, K.; Pace, N.R.; Frank, D.N. Explicet: Graphical user interface software for metadata-driven management, analysis and visualization of microbiome data. Bioinformatics 2013, 29, 3100–3101. [Google Scholar] [CrossRef] [Green Version]
- Ssekagiri, A.; Sloan, W.T.; Zeeshan Ijaz, U. microbiomeSeq: An R package for analysis of microbial communities in an environmental context. In Proceedings of the ISCB Africa ASBCB Conference, Entebbe, Uganda, 10–12 October 2017. [Google Scholar] [CrossRef]
- Chong, J.; Liu, P.; Zhou, G.; Xia, J. Using MicrobiomeAnalyst for comprehensive statistical, functional, and meta-analysis of microbiome data. Nat. Protoc. 2020, 15, 799–821. [Google Scholar] [CrossRef]
- Ju, F.; Xia, Y.; Guo, F.; Wang, Z.; Zhang, T. Taxonomic relatedness shapes bacterial assembly in activated sludge of globally distributed wastewater treatment plants. Environ. Microbiol. 2014, 16, 2421–2432. [Google Scholar] [CrossRef] [PubMed]
- Barberán, A.; Bates, S.T.; Casamayor, E.O.; Fierer, N. Using network analysis to explore co-occurrence patterns in soil microbial communities. ISME J. 2012, 6, 343–351. [Google Scholar] [CrossRef] [PubMed] [Green Version]
- Junker, B.; Schreiber, F. Analysis of Biological Networks; John Wiley & Sons, Inc.: Hoboken, NJ, USA, 2008; ISBN 9780470041444. [Google Scholar]
- Benjamini, Y.; Hochberg, Y. Controlling the False Discovery Rate: A Practical and Powerful Approach to Multiple Testing. J. R. Stat. Soc. Ser. B 1995, 57, 289–300. [Google Scholar] [CrossRef]
- Ihaka, R.; Gentleman, R. R: A Language for Data Analysis and Graphics. J. Comput. Graph. Stat. 1996, 5, 299–314. [Google Scholar] [CrossRef]
- Csardi, G.; Nepusz, T. The igraph software package for complex network research. Inter J. Complex Syst. 2006. [Google Scholar] [CrossRef]
- Harrell, J.F.E. Hmisc: Harrell Miscellaneous R Package Version: 35—2 R Foundation for Statistical Computing; CRAN: Vienna, Austria, 2008; Available online: https://github.com/harrelfe/Hmisc/ (accessed on 12 May 2019).
- Bastian, M.; Heymann, S.; Jacomy, M. Gephi: An Open Source Software for Exploring and Manipulating Networks Visualization and Exploration of Large Graphs; Gephi WebAtlas: Paris, France, 2009; Available online: http://gephi.org/ (accessed on 7 April 2019).
- Banerjee, S.; Walder, F.; Büchi, L.; Meyer, M.; Held, A.Y.; Gattinger, A.; Keller, T.; Charles, R.; van der Heijden, M.G.A. Agricultural intensification reduces microbial network complexity and the abundance of keystone taxa in roots. ISME J. 2019, 13, 1722–1736. [Google Scholar] [CrossRef] [Green Version]
- Kumar, U.; Kumar Nayak, A.; Shahid, M.; Gupta, V.V.S.R.; Panneerselvam, P.; Mohanty, S.; Kaviraj, M.; Kumar, A.; Chatterjee, D.; Lal, B.; et al. Continuous application of inorganic and organic fertilizers over 47 years in paddy soil alters the bacterial community structure and its influence on rice production. Agric Ecosyst. Environ. 2018, 262, 65–75. [Google Scholar] [CrossRef]
- FAQs—Biochar-International. Available online: https://biochar-international.org/faqs/ (accessed on 7 May 2021).
- Anderson, C.R.; Condron, L.M.; Clough, T.J.; Fiers, M.; Stewart, A.; Hill, R.A.; Sherlock, R.R. Biochar induced soil microbial community change: Implications for biogeochemical cycling of carbon, nitrogen and phosphorus. Pedobiol. Int. J. Soil Biol. 2011, 54, 309–320. [Google Scholar] [CrossRef]
- Anders, E.; Watzinger, A.; Rempt, F.; Kitzler, B.; Wimmer, B.; Zehetner, F.; Stahr, K.; Zechmeister-Boltenstern, S.; Soja, G. Biochar affects the structure rather than the total biomass of microbial communities in temperate soils. Agric. Food Sci. 2013, 22, 404–423. [Google Scholar] [CrossRef] [Green Version]
- Foster, E.J.; Hansen, N.; Wallenstein, M.; Cotrufo, M.F. Biochar and manure amendments impact soil nutrients and microbial enzymatic activities in a semi-arid irrigated maize cropping system. Agric. Ecosyst. Environ. 2016, 233, 404–414. [Google Scholar] [CrossRef] [Green Version]
- Jones, D.L.; Rousk, J.; Edwards-Jones, G.; DeLuca, T.H.; Murphy, D.V. Biochar-mediated changes in soil quality and plant growth in a three year field trial. Soil Biol. Biochem. 2012, 45, 113–124. [Google Scholar] [CrossRef]
- Ameloot, N.; Graber, E.R.; Verheijen, F.G.A.; De Neve, S. Interactions between biochar stability and soil organisms: Review and research needs. Eur. J. Soil Sci. 2013, 64, 379–390. [Google Scholar] [CrossRef]
- Chen, J.; Sun, X.; Zheng, J.; Zhang, X.; Liu, X.; Bian, R.; Li, L.; Cheng, K.; Zheng, J.; Pan, G. Biochar amendment changes temperature sensitivity of soil respiration and composition of microbial communities 3 years after incorporation in an organic carbon-poor dry cropland soil. Biol. Fertil. Soils 2018, 54, 175–188. [Google Scholar] [CrossRef]
- O’Neill, B.; Grossman, J.; Tsai, M.T.; Gomes, J.E.; Lehmann, J.; Peterson, J.; Neves, E.; Thies, J.E. Bacterial Community Composition in Brazilian Anthrosols and Adjacent Soils Characterized Using Culturing and Molecular Identification. Microb. Ecol. 2009. [Google Scholar] [CrossRef]
- Liu, X.; Li, J.; Yu, L.; Pan, H.; Liu, H.; Liu, Y.; Di, H.; Li, Y.; Xu, J. Simultaneous measurement of bacterial abundance and composition in response to biochar in soybean field soil using 16S rRNA gene sequencing. Land Degrad. Dev. 2017, 29, 2172–2182. [Google Scholar] [CrossRef]
- Chen, L.; Jiang, Y.; Liang, C.; Luo, Y.; Xu, Q.; Han, C.; Zhao, Q.; Sun, B. Competitive interaction with keystone taxa induced negative priming under biochar amendments. Microbiome 2019, 7, 77. [Google Scholar] [CrossRef] [PubMed]
- Lauber, C.L.; Hamady, M.; Knight, R.; Fierer, N. Pyrosequencing-based assessment of soil pH as a predictor of soil bacterial community structure at the continental scale. Appl. Environ. Microbiol. 2009, 75, 5111–5120. [Google Scholar] [CrossRef] [PubMed] [Green Version]
- Sheng, Y.; Zhu, L. Biochar alters microbial community and carbon sequestration potential across different soil pH. Sci. Total Environ. 2018, 622–623, 1391–1399. [Google Scholar] [CrossRef] [PubMed]
- Francioli, D.; Schulz, E.; Lentendu, G.; Wubet, T.; Buscot, F.; Reitz, T. Mineral vs. organic amendments: Microbial community structure, activity and abundance of agriculturally relevant microbes are driven by long-term fertilization strategies. Front. Microbiol. 2016, 7, 1446. [Google Scholar] [CrossRef] [Green Version]
- Li, F.; Chen, L.; Zhang, J.; Yin, J.; Huang, S. Bacterial community structure after long-term organic and inorganic fertilization reveals important associations between soil nutrients and specific taxa involved in nutrient transformations. Front. Microbiol. 2017, 8, 187. [Google Scholar] [CrossRef] [PubMed] [Green Version]
- Sun, J.; Zhang, Q.; Zhou, J.; Wei, Q. Pyrosequencing technology reveals the impact of different manure doses on the bacterial community in apple rhizosphere soil. Appl. Soil Ecol. 2014, 78, 28–36. [Google Scholar] [CrossRef]
- Das, S.; Jeong, S.T.; Das, S.; Kim, P.J. Composted cattle manure increases microbial activity and soil fertility more than composted swine manure in a submerged rice paddy. Front. Microbiol. 2017, 8, 1702. [Google Scholar] [CrossRef] [PubMed]
- Xu, H.J.; Wang, X.H.; Li, H.; Yao, H.Y.; Su, J.Q.; Zhu, Y.G. Biochar impacts soil microbial community composition and nitrogen cycling in an acidic soil planted with rape. Environ. Sci. Technol. 2014, 48, 9391–9399. [Google Scholar] [CrossRef]
- Zheng, Y.; Han, X.; Li, Y.; Yang, J.; Li, N.; An, N. Effects of Biochar and Straw Application on the Physicochemical and Biological Properties of Paddy Soils in Northeast China. Sci. Rep. 2019, 9, 16531. [Google Scholar] [CrossRef] [Green Version]
- Delgado-Baquerizo, M.; Oliverio, A.M.; Brewer, T.E.; Benavent-González, A.; Eldridge, D.J.; Bardgett, R.D.; Maestre, F.T.; Singh, B.K.; Fierer, N. A Global Atlas of the Dominant Bacteria found in Soil. Science 2018, 359, 320–325. [Google Scholar] [CrossRef] [PubMed] [Green Version]
- Xu, N.; Tan, G.; Wang, H.; Gai, X. Effect of biochar additions to soil on nitrogen leaching, microbial biomass and bacterial community structure. Eur. J. Soil Biol. 2016, 74, 1–8. [Google Scholar] [CrossRef]
- Yu, J.; Deem, L.M.; Crow, S.E.; Deenik, J.; Ryan Penton, C. Comparative metagenomics reveals enhanced nutrient cycling potential after 2 years of biochar amendment in a tropical oxisol. Appl. Environ. Microbiol. 2019, 85. [Google Scholar] [CrossRef] [PubMed] [Green Version]
- Leung, H.T.C.; Maas, K.R.; Wilhelm, R.C.; Mohn, W.W. Long-term effects of timber harvesting on hemicellulolytic microbial populations in coniferous forest soils. ISME J. 2016, 10, 363–375. [Google Scholar] [CrossRef] [Green Version]
- Kim, B.-Y.; Weon, H.-Y.; Yoo, S.-H.; Chen, W.-M.; Kwon, S.-W.; Go, S.-J.; Stackebrandt, E. Chitinimonas koreensis sp. nov., isolated from greenhouse soil in Korea. Int. J. Syst. Evol. Microbiol. 2006, 56, 1761–1764. [Google Scholar] [CrossRef] [PubMed]
- Eida, A.A.; Bougouffa, S.; Alam, I.; Saad, M.M.; Hirt, H. Complete genome sequence of the endophytic bacterium Cellulosimicrobium sp. JZ28 isolated from the root endosphere of the perennial desert tussock grass Panicum turgidum. Arch. Microbiol. 2020, 202, 1563–1569. [Google Scholar] [CrossRef]
- Yoshida, S.; Tazaki, K.; Minamikawa, T. Occurrence of shikimic and quinic acids in angiosperms. Phytochemistry 1975, 14, 195–197. [Google Scholar] [CrossRef]
- Reichenbach, H. Nannocystis. In Bergey’s Manual of Systematics of Archaea and Bacteria; Wiley: Hoboken, NJ, USA, 2015; pp. 1–8. [Google Scholar]
- Kunze, B.; Reichenbach, H.; Müller, R.; Höfle, G. Aurafuron a and B, new bioactive polyketides from Stigmatella aurantiaca and Archangium gephyra (myxobacteria): Fermentation, isolation, physico-chemical properties, structure and biological activity. J. Antibiot. 2005, 58, 244–251. [Google Scholar] [CrossRef] [Green Version]
- Tang, X.; Zhong, R.; Jiang, J.; He, L.; Huang, Z.; Shi, G.; Wu, H.; Liu, J.; Xiong, F.; Han, Z.; et al. Cassava/peanut intercropping improves soil quality via rhizospheric microbes increased available nitrogen contents. BMC Biotechnol. 2020, 20, 13. [Google Scholar] [CrossRef] [PubMed] [Green Version]
- Daims, H.; Lebedeva, E.V.; Pjevac, P.; Han, P.; Herbold, C.; Albertsen, M.; Jehmlich, N.; Palatinszky, M.; Vierheilig, J.; Bulaev, A.; et al. Complete nitrification by Nitrospira bacteria. Nature 2018, 528, 504–509. [Google Scholar] [CrossRef]
- Raths, R.; Peta, V.; Bücking, H. Duganella callida sp. Nov., a novel addition to the duganella genus, isolated from the soil of a cultivated maize field. Int. J. Syst. Evol. Microbiol. 2021, 71, 004599. [Google Scholar] [CrossRef] [PubMed]
- Verma, P.; Nath Yadav, A.; Khannam Kazy, S.; Saxena, A.K.; Suman, A. Evaluating the diversity and phylogeny of plant growth promoting bacteria associated with wheat (Triticum aestivum) growing in central zone of India. Int. J. Curr. Microbiol. Appl. Sci. 2014, 3, 432–447. [Google Scholar]
- Ishii, S.; Joikai, K.; Otsuka, S.; Senoo, K.; Okabe, S. Denitrification and nitrate-dependent Fe(II) oxidation in various Pseudogulbenkiania strains. Microbes Environ. 2016, 31, 293–298. [Google Scholar] [CrossRef] [Green Version]
- Han, F.; Ye, W.; Wei, D.; Xu, W.; Du, B.; Wei, Q. Simultaneous nitrification-denitrification and membrane fouling alleviation in a submerged biofilm membrane bioreactor with coupling of sponge and biodegradable PBS carrier. Bioresour. Technol. 2018, 270, 156–165. [Google Scholar] [CrossRef] [PubMed]
- Pishgar, R.; Dominic, J.A.; Sheng, Z.; Tay, J.H. Denitrification performance and microbial versatility in response to different selection pressures. Bioresour. Technol. 2019, 281, 72–83. [Google Scholar] [CrossRef]
- Fierer, N.; Ladau, J.; Clemente, J.C.; Leff, J.W.; Owens, S.M.; Pollard, K.S.; Knight, R.; Gilbert, J.A.; McCulley, R.L. Reconstructing the microbial diversity and function of pre-agricultural tallgrass prairie soils in the United States. Science 2013, 342, 621–624. [Google Scholar] [CrossRef] [Green Version]
- Whitman, T.; Pepe-Ranney, C.; Enders, A.; Koechli, C.; Campbell, A.; Buckley, D.H.; Lehmann, J. Dynamics of microbial community composition and soil organic carbon mineralization in soil following addition of pyrogenic and fresh organic matter. ISME J. 2016, 10, 2918–2930. [Google Scholar] [CrossRef] [PubMed] [Green Version]
- Khodadad, C.L.M.; Zimmerman, A.R.; Green, S.J.; Uthandi, S.; Foster, J.S. Taxa-specific changes in soil microbial community composition induced by pyrogenic carbon amendments. Soil Biol. Biochem. 2011, 43, 385–392. [Google Scholar] [CrossRef]
- De Vries, F.T.; Griffiths, R.I. Impacts of Climate Change on Soil Microbial Communities and Their Functioning. Dev. Soil Sci. 2018, 35, 111–129. [Google Scholar]
- Thomas, F.; Hehemann, J.H.; Rebuffet, E.; Czjzek, M.; Michel, G. Environmental and gut Bacteroidetes: The food connection. Front. Microbiol. 2011, 2, 93. [Google Scholar] [CrossRef] [PubMed] [Green Version]
- Nemergut, D.R.; Townsend, A.R.; Sattin, S.R.; Freeman, K.R.; Fierer, N.; Neff, J.C.; Bowman, W.D.; Schadt, C.W.; Weintraub, M.N.; Schmidt, S.K. The effects of chronic nitrogen fertilization on alpine tundra soil microbial communities: Implications for carbon and nitrogen cycling. Environ. Microbiol. 2008, 10, 3093–3105. [Google Scholar] [CrossRef] [PubMed]


| Property | Units | Biochar | Poultry Litter |
|---|---|---|---|
| pH | 8.9 | 7.34 | |
| EC | dS m−1 | 0.8 | 13.5 |
| Ash | % | 15 | N/A * |
| Total C | % | 69.1 | 27.2 |
| Total N | % | 0.28 | 3.86 |
| Organic matter | % | N/A | 24.54 |
| Ca | mg kg−1 | 108 | 4322 |
| Cu | mg kg−1 | ND ** | 101 |
| Mg | mg kg−1 | 25 | 3977 |
| P | mg kg−1 | 38 | 1393 |
| K | mg kg−1 | 59 | 4905 |
| Na | mg kg−1 | 130 | 814 |
| S | mg kg−1 | 20 | 2922 |
| Zn | mg kg−1 | ND | 641 |
| Raw Data | 2016 | 2017 |
|---|---|---|
| File type | Conventional base calls | Conventional base calls |
| Encoding | Sanger/Illumina 1.9 | Sanger/Illumina 1.9 |
| Total sequence | 6,193,760 for 16 samples | 5,470,755 for 16 samples |
| Sequence length | 236–250 (Read 1); 43–250 (Read 2) | 236–250 (Read 1); 44–250 (Read 2) |
| Sequence flag as poor quality | 0 | 0 |
| Guanine/cytosine content (GC%) | 56–57 | 54–55 |
| Sequence range (total sequence per sample) | 309,916–478,815 | 250,643–471,980 |
| Treatment | 2016 | 2017 | ||||
|---|---|---|---|---|---|---|
| Mean | Standard Deviation | Standard Error | Mean | Standard Deviation | Standard Error | |
| (A) Plant growth (cm) | ||||||
| UT | 119.01 a | 7.04 | 3.52 | 115.38 b | 2.70 | 1.35 |
| BC | 119.25 a | 13.18 | 6.59 | 113.67 b | 5.27 | 2.64 |
| PL | 115.19 a | 17.40 | 8.70 | 121.73 a | 1.91 | 0.95 |
| BC/PL | 120.59 a | 14.59 | 7.30 | 118.87 a,b | 3.45 | 1.72 |
| (B) Yield (kg/ha) | ||||||
| UT | 3540.04 a | 49.83 | 24.91 | 3571.65 a | 316.43 | 158.22 |
| BC | 3549.62 a | 35.90 | 17.95 | 3485.06 a | 795.95 | 397.98 |
| PL | 3456.99 a | 118.99 | 59.50 | 3673.03 a | 327.71 | 163.86 |
| BC/PL | 4135.37 a | 1091.93 | 545.96 | 3945.22 a | 536.61 | 268.31 |
| (A) Species Richness (Observed Feature) | |||||||||
| Combined Years p = 0.189 | 2016 (p = 0.368) | 2017 (p = 0.355) | |||||||
| UT | BC | PL | BC/PL | UT | BC | PL | BC/PL | ||
| 2016 | UT | 0.64 | 0.18 | 0.18 | 0.08 | 0.03 | 0.28 | 0.05 | |
| BC | 0.64 | 0.32 | 0.32 | 0.22 | 0.16 | 0.65 | 0.18 | ||
| PL | 0.18 | 0.32 | 0.32 | 0.22 | 0.16 | 0.65 | 0.18 | ||
| BC/PL | 0.18 | 0.32 | 0.32 | 0.22 | 1.00 | 0.65 | 0.65 | ||
| 2017 | UT | 0.08 | 0.22 | 0.22 | 0.22 | 1.00 | 0.24 | 1 | |
| BC | 0.03 | 0.16 | 1.00 | 1.00 | 1.00 | 0.48 | 0.48 | ||
| PL | 0.28 | 0.65 | 0.65 | 0.65 | 0.25 | 0.48 | 0.28 | ||
| BC/PL | 0.05 | 0.18 | 0.65 | 0.65 | 1.00 | 0.48 | 0.28 | ||
| (B) Species Richness (Faith_pd: Faith’s Phylogenetic Diversity) | |||||||||
| Combined Years p = 0.508 | 2016 (p = 0.109) | 2017 (p = 0.598) | |||||||
| UT | BC | PL | BC/PL | UT | BC | PL | BC/PL | ||
| 2016 | UT | 0.24 | 0.08 | 0.24 | 0.04 | 0.08 | 0.08 | 0.08 | |
| BC | 0.24 | 0.24 | 0.14 | 0.14 | 0.56 | 1 | 0.14 | ||
| PL | 0.08 | 0.24 | 0.38 | 0.38 | 1 | 0.24 | 0.77 | ||
| BC/PL | 0.24 | 0.14 | 0.38 | 0.24 | 1 | 1 | 0.38 | ||
| 2017 | UT | 0.04 | 0.14 | 0.38 | 0.24 | 0.77 | 0.24 | 1 | |
| BC | 0.08 | 0.56 | 1 | 1 | 0.77 | 0.38 | 0.38 | ||
| PL | 0.08 | 1 | 0.24 | 1 | 0.24 | 0.38 | 0.24 | ||
| BC/PL | 0.08 | 0.14 | 0.77 | 0.38 | 1 | 0.38 | 0.24 | ||
| (C) Shannon’s Diversity Index | |||||||||
| Combined Years p = 0.113 | 2016 (p = 0.222) | 2017 (p = 0.517) | |||||||
| UT | BC | PL | BC/PL | UT | BC | PL | BC/PL | ||
| 2016 | UT | 0.17 | 0.17 | 0.17 | 0.08 | 0.03 | 0.04 | 0.04 | |
| BC | 0.17 | 0.31 | 0.31 | 0.22 | 0.15 | 0.17 | 0.17 | ||
| PL | 0.17 | 0.31 | 0.31 | 0.22 | 0.15 | 0.17 | 0.17 | ||
| BC/PL | 0.17 | 0.31 | 0.31 | 0.22 | 0.15 | 0.65 | 0.65 | ||
| 2017 | UT | 0.08 | 0.22 | 0.22 | 0.22 | 0.64 | 0.56 | 0.56 | |
| BC | 0.03 | 0.15 | 0.15 | 0.15 | 0.64 | 0.72 | 0.47 | ||
| PL | 0.04 | 0.17 | 0.17 | 0.65 | 0.56 | 0.72 | 0.82 | ||
| BC/PL | 0.04 | 0.17 | 0.17 | 0.65 | 0.56 | 0.47 | 0.82 | ||
| Beta Diversity Metrics | Untreated vs. BC vs. PL vs. BC/PL | 2016 vs. 2017 | ||
|---|---|---|---|---|
| 2016 | 2017 | Combined | ||
| Beta group significance | ||||
| Unweighted unifrac | 0.477 | 0.369 | 0.403 | 0.001 |
| Weighted unifrac | 0.146 | 0.206 | 0.287 | 0.001 |
| Adonis test | 0.020 | 0.078 | 0.419 | 0.001 |
| Treatment | 2016 | 2017 | ||||
|---|---|---|---|---|---|---|
| Mean | Standard Deviation | Standard Error | Mean | Standard Deviation | Standard Error | |
| (A) pH | ||||||
| UT | 7.68 | 0.134 | 0.067 | 6.85 | 0.244 | 0.122 |
| BC | 7.50 | 0.042 | 0.021 | 7.07 | 0.141 | 0.071 |
| PL | 7.36 | 0.226 | 0.113 | 6.87 | 0.257 | 0.129 |
| BC/PL | 7.46 | 0.271 | 0.135 | 7.18 | 0.501 | 0.250 |
| (B) Total nitrogen | ||||||
| UT | 0.045 | 0.004 | 0.002 | 0.056 a,b | 0.006 | 0.003 |
| BC | 0.045 | 0.006 | 0.003 | 0.063 a | 0.011 | 0.005 |
| PL | 0.042 | 0.008 | 0.004 | 0.036 b | 0.004 | 0.002 |
| BC/PL | 0.047 | 0.006 | 0.003 | 0.054 a,b | 0.019 | 0.009 |
| (C) Total carbon | ||||||
| UT | 0.223 | 0.042 | 0.021 | 0.381 | 0.071 | 0.036 |
| BC | 0.225 | 0.095 | 0.047 | 0.611 | 0.064 | 0.032 |
| PL | 0.171 | 0.122 | 0.061 | 0.431 | 0.200 | 0.100 |
| BC/PL | 0.373 | 0.122 | 0.061 | 0.547 | 0.139 | 0.070 |
| (D) C–N ratio | ||||||
| UT | 4.950 | 0.642 | 0.321 | 6.958 | 2.088 | 1.044 |
| BC | 4.868 | 1.461 | 0.731 | 9.953 | 1.711 | 0.855 |
| PL | 3.785 | 1.981 | 0.991 | 12.375 | 6.830 | 3.415 |
| BC/PL | 8.113 | 3.396 | 1.698 | 10.553 | 2.400 | 1.200 |
| Environmental Variable(s) (No. of Variables) | BIOENV a Spearman Coefficient (rs) | Adonis Test b (p-Values) |
|---|---|---|
| 2016 | ||
| pH (1) | - | 0.145 |
| Total carbon (1) | - | 0.135 |
| Total nitrogen (1) | 0.742 | 0.039 |
| C:N ratio (1) | - | 0.294 |
| pH, total nitrogen (2) | 0.559 | 0.377 |
| pH, total nitrogen, total carbon (3) | 0.509 | 0.403 |
| pH, total nitrogen, total carbon, C:N ratio (4) | 0.472 | 1.00 |
| 2017 | ||
| pH (1) | 0.358 | 0.035 |
| Total carbon (1) | - | 0.703 |
| Total nitrogen (1) | - | 0.192 |
| C:N ratio (1) | - | 0.533 |
| pH, total carbon (2) | 0.422 | 0.165 |
| pH, total nitrogen, total carbon (3) | 0.363 | 0.031 |
| pH, total nitrogen, total carbon, C:N ratio (4) | 0.243 | 1.00 |
| Taxonomy | ANOVA | Kruskal–Wallis Test | ||||
|---|---|---|---|---|---|---|
| Year 1 | Year 2 | Year 1 | Year 2 | |||
| p | p | χ2 | p | χ2 | p | |
| Phylum | ||||||
| Proteobacteria | 0.113 | 0.188 | 6.15 | 0.104 | 4.85 | 0.183 |
| Acidobacteria | 0.781 | 0.317 | 0.55 | 0.907 | 2.47 | 0.481 |
| Bacteroidetes | 0.167 | 0.074 | 4.3 | 0.23 | 5.69 | 0.128 |
| Verrucomicrobia | 0.571 | 0.438 | 2.8 | 0.423 | 3.53 | 0.317 |
| Gemmatimonadetes | 0.424 | 0.127 | 3.07 | 0.382 | 5.89 | 0.117 |
| Thaumarchaeota | 0.571 | 0.410 | 2.27 | 0.518 | 1.28 | 0.734 |
| Nitrospira | 0.960 | 0.252 | 0.19 | 0.978 | 3.24 | 0.356 |
| Actinobacteria | 0.0006 | 0.277 | 9.55 | 0.022 | 4.96 | 0.175 |
| Chloroflexi | 0.0014 | 0.211 | 9.22 | 0.026 | 4.76 | 0.189 |
| Planctomycetes | 0.308 | 0.522 | 2.86 | 0.415 | 2.67 | 0.446 |
| Firmicutes | 0.088 | 0.399 | 7.35 | 0.062 | 4.08 | 0.253 |
| Cyanobacteria | 0.625 | 0.645 | 1.57 | 0.667 | 1.83 | 0.608 |
| Class | ||||||
| Sphingobacteriia | 0.375 | 0.078 | 4.48 | 0.214 | 4.65 | 0.199 |
| Blastocatellia | 0.578 | 0.146 | 1.88 | 0.599 | 5.18 | 0.159 |
| Alphaproteobacteria | 0.048 | 0.239 | 7.13 | 0.680 | 3.62 | 0.306 |
| Betaproteobacteria | 0.258 | 0.441 | 2.96 | 0.399 | 1.48 | 0.687 |
| Deltaproteobacteria | 0.439 | 0.312 | 2.89 | 0.409 | 3.15 | 0.368 |
| Gammaproteobacteria | 0.378 | 0.039 | 3.99 | 0.262 | 7.88 | 0.049 |
| Acidobacteria_Subgroup 6 | 0.450 | 0.226 | 2.34 | 0.505 | 4.04 | 0.258 |
| Soil Crenarchaeotic Group (SCG) | 0.159 | 0.407 | 4.13 | 0.248 | 1.70 | 0.637 |
| Gemmatimonadetes | 0.522 | 0.323 | 3.60 | 0.309 | 4.12 | 0.248 |
| Nitrospira | 0.960 | 0.252 | 0.20 | 0.978 | 3.24 | 0.356 |
| OPB35 soil group | 0.440 | 0.857 | 3.20 | 0.362 | 1.48 | 0.687 |
| Spartobacteria | 0.915 | 0.248 | 0.49 | 0.922 | 5.85 | 0.119 |
| Cytophagia | 0.795 | 0.096 | 0574 | 0.903 | 7.21 | 0.065 |
| Solibacteres | 0.301 | 0.705 | 3.51 | 0.320 | 1.32 | 0.724 |
| Unassigned | 0.029 | 0.624 | 8.36 | 0.039 | 1.52 | 0.677 |
| Order | ||||||
| Sphingobacteriales | 0.374 | 0.078 | 4.48 | 0.214 | 4.65 | 0.198 |
| Blastocatellales | 0.578 | 0.146 | 1.87 | 0.599 | 5.18 | 0.158 |
| Sphingomonadales | 0.180 | 0.362 | 3.81 | 0.282 | 3.73 | 0.292 |
| Burkholderiales | 0.065 | 0.62 | 7.23 | 0.064 | 1.30 | 0.729 |
| Xanthomonadales | 0.148 | 0.008 | 5.58 | 0.133 | 9.33 | 0.025 |
| Gemmatimonadales | 0.522 | 0.329 | 3.60 | 0.308 | 4.12 | 0.248 |
| Nitrospirales | 0.959 | 0.252 | 0.20 | 0.977 | 3.24 | 0.355 |
| Rhizobiales | 0.011 | 0.226 | 7.56 | 0.056 | 5.85 | 0.119 |
| Nitrosomonadales | 0.94 | 0.631 | 0.29 | 0.962 | 2.18 | 0.535 |
| Myxococcales | 0.01 | 0.033 | 8.58 | 0.035 | 8.14 | 0.043 |
| Verrucomicrobia_OPB35uncultured | 0.515 | 0.866 | 3.24 | 0.356 | 1.88 | 0.599 |
| SCG_uncultured bacterium | 0.027 | 0.745 | 8.49 | 0.037 | 0.82 | 0.846 |
| Chthoniobacterales | 0.915 | 0.248 | 0.48 | 0.922 | 5.85 | 0.119 |
| Cytophagales | 0.794 | 0.095 | 0.57 | 0.902 | 7.21 | 0.065 |
| Desulfurellales | 0.889 | 0.465 | 1.12 | 0.771 | 2.38 | 0.497 |
| Solibacterales | 0.3 | 0.704 | 3.50 | 0.320 | 1.32 | 0.724 |
| Subgroup6_uncultured | 0.429 | 0.2 | 1.61 | 0.657 | 4.32 | 0.228 |
| Subgroup6_ambiguous_taxa | 0.583 | 0.196 | 1.70 | 0.637 | 4.79 | 0.188 |
| Rhodospirillales | 0.421 | 0.605 | 2.36 | 0.501 | 1.30 | 0.729 |
| Unassigned | 0.028 | 0.623 | 8.36 | 0.039 | 1.52 | 0.677 |
| Family | ||||||
| Blastocatellaceae (subgroup 4) | 0.578 | 0.146 | 1.88 | 0.599 | 5.18 | 0.159 |
| Chitinophagaceae | 0.297 | 0.037 | 3.64 | 0.303 | 6.51 | 0.089 |
| Sphingomonadaceae | 0.105 | 0.369 | 4.35 | 0.227 | 2.92 | 0.402 |
| Sphingobacteriales_env.OPS | 0.919 | 0.241 | 0.51 | 0.917 | 4.36 | 0.225 |
| Gemmatimonadaceae | 0.522 | 0.329 | 3.60 | 0.309 | 4.13 | 0.248 |
| Nitrospiraceae | 0.860 | 0.273 | 0.11 | 0.991 | 3.24 | 0.356 |
| Nitrosomonadaceae | 0.935 | 0.621 | 0.33 | 0.954 | 2.18 | 0.535 |
| Verrrucomicrobia_OPB35 group | 0.516 | 0.866 | 3.24 | 0.356 | 1.88 | 0.599 |
| Xanthomonadales Incertae Sedis | 0.036 | 0.021 | 7.79 | 0.051 | 7.17 | 0.067 |
| Comamonadaceae | 0.060 | 0.455 | 7.21 | 0.065 | 2.98 | 0.395 |
| Soil Crenarchaetotic Group (SCG) | 0.623 | 0.745 | 1.83 | 0.608 | 0.82 | 0.846 |
| Oxalobacteraceae | 0.153 | 0.714 | 6.37 | 0.087 | 0.81 | 0.845 |
| Cytophagaceae | 0.806 | 0.104 | 6.57 | 0.087 | 6.55 | 0.088 |
| Desulfurellaceae | 0.889 | 0.465 | 1.13 | 0.771 | 2.38 | 0.497 |
| Solibacteraceae (subgroup 3) | 0.301 | 0.705 | 3.51 | 0.320 | 1.33 | 0.724 |
| Subgroup 6_uncultured | 0.429 | 0.196 | 1.61 | 0.657 | 4.79 | 0.188 |
| Subgroup6_Ambiguous_taxa | 0.672 | 0.227 | 2.05 | 0.562 | 2.14 | 0.544 |
| Unassigned | 0.029 | 0.624 | 8.36 | 0.030 | 1.52 | 0.677 |
| 2016 | |||||
| Phylum | Count | Enriched ASVs * | Log2 FC | p-Adjusted | |
| BC vs. UT | Proteobacteria | 17 | Nitrospirae_uncultured | 4.487 | 0.009 |
| Bacteroidetes | 9 | Acinetobacter | 5.711 | 0.022 | |
| Actinobacteria | 5 | Rivibacter | 5.839 | 0.027 | |
| Verrucomicrobia | 3 | Chlamydiales | 4.322 | 0.054 | |
| Planctomycetes | 3 | Verrucomicrobia_uncultured | 4.823 | 0.060 | |
| Gemmatimonadetes | 2 | Spirochaetae_Turneriella | 4.810 | 0.060 | |
| Nitrospirae | 2 | Uncultured_Pseudolabrys | 4.221 | 0.062 | |
| Acidobacteria | 2 | Crocinitomix | 4.143 | 0.062 | |
| Others | 10 | Latescibacteria_uncultured | 3.436 | 0.065 | |
| Total | 53 | Uncultured_alphaproteobacterium | 4.760 | 0.062 | |
| PL vs. UT | Proteobacteria | 28 | Chthoniobacterales_DA101 | 5.349 | 0.016 |
| Acidobacteria | 10 | Sphingobacterium | 5.409 | 0.029 | |
| Bacteroidetes | 6 | Uncultured euyarchaeote | 6.523 | 0.037 | |
| Planctomycetes | 4 | Acidobacteria_uncultured | 5.093 | 0.037 | |
| Verrucomicrobia | 4 | Acinetobacter | 4.467 | 0.037 | |
| Thaumarcheota | 3 | Uncultured alpha proteobacterium | 4.444 | 0.037 | |
| Nitrospirae | 2 | Rhodocista | 4.016 | 0.046 | |
| Firmicutes | 2 | Uncultured_Pseudolabrys | 4.293 | 0.049 | |
| Others | 10 | Proteobacteria_Delftia | 4.598 | 0.052 | |
| Total | 69 | Rhodospirillales_uncultured | 3.987 | 0.052 | |
| BC/PL vs. UT | Proteobacteria | 16 | Chthoniobacterales_DA101 | 5.692 | 0.004 |
| Planctomycetes | 5 | Flavobacteriales_uncultued | 4.780 | 0.022 | |
| Acidobacteria | 5 | Sphingobacterium | 4.170 | 0.022 | |
| Bacteroidetes | 4 | Duganella | 4.644 | 0.030 | |
| Verrucomicrobia | 4 | Planctomycetes | 4.074 | 0.042 | |
| Nitrospirae | 2 | Prosthecobacter | 4.179 | 0.050 | |
| Actinobacteria | 2 | Acidobacteria_uncultured | 4.010 | 0.062 | |
| Gemmatimonadetes | 2 | Proteobacteria_Leptothrix | 4.358 | 0.067 | |
| Others | 10 | Proteobacteria_uncultured | 4.005 | 0.067 | |
| Total | 50 | Myxococcales_uncultured | 4.005 | 0.067 | |
| 2017 | |||||
| Phylum | Count | Enriched ASVs * | Log2 FC | p-Adjusted | |
| BC vs. UT | Proteobacteria | 46 | Pelomonas | 6.563 | 3.06E-05 |
| Cyanobacteria | 16 | Paenarthrobacter | 4.662 | 0.007 | |
| Bacteroidetes | 13 | Proteobacteria_uncultured | 5.725 | 0.009 | |
| Actinobacteria | 10 | Proteobacteria_uncultured | 5.054 | 0.016 | |
| Acidobacteria | 7 | Bacteroidetes_Emticicia | 4.857 | 0.025 | |
| Firmicutes | 4 | Acidobacteria_uncultured | 5.143 | 0.035 | |
| Planctomycetes | 3 | Cyanobacteria_uncultured | 4.964 | 0.045 | |
| Nitrospirae | 2 | Ohtaekwangia | 1.461 | 0.045 | |
| Others | 12 | Proteobacteria_uncultured | 4.419 | 0.047 | |
| Total | 113 | Leptospirillum | 4.534 | 0.068 | |
| PL vs. UT | Proteobacteria | 76 | Nannocystis | 3.494 | 0.001 |
| Actinobacteria | 17 | Cellulosimicrobium | 6.237 | 0.001 | |
| Bacteroidetes | 13 | Paenarthrobacter | 4.902 | 0.001 | |
| Cyanobacteria | 13 | Proteobacteria_uncultured | 7.134 | 0.006 | |
| Firmicutes | 6 | Luteimonas | 5.551 | 0.007 | |
| Acidobacteria | 4 | Stigmatella | 5.840 | 0.007 | |
| Gemmatimonadetes | 2 | Lysinimonas | 5.209 | 0.007 | |
| Armatimonadetes | 2 | Proteobacteria_Devosia | 2.187 | 0.009 | |
| Others | 12 | Chitinimonas | 5.587 | 0.010 | |
| Total | 145 | Actinobacteria_Pilimelia | 5.761 | 0.016 | |
| BC/PL vs. UT BC vs. UT | Proteobacteria | 75 | Chitinimonas | 7.058 | 0.025 |
| Actinobacteria | 14 | Proteobacteria_uncultured | 5.718 | 0.025 | |
| Bacteroidetes | 10 | Proteobacteria_Minicystis | 5.549 | 0.025 | |
| Cyanobacteria | 7 | Bacteroidetes_Emticicia | 5.404 | 0.033 | |
| Gemmatimonadetes | 5 | Proteobacteria_uncultured | 5.770 | 0.033 | |
| Firmicutes | 4 | Noviherbaspirillum | 5.288 | 0.033 | |
| Planctomycetes | 4 | Actinobacteria_Lentzea | 5.170 | 0.035 | |
| Acidobacteria | 3 | Comamonas | 1.892 | 0.035 | |
| Others | 6 | Proteobacteria_Pelomonas | 5.468 | 0.049 | |
| Total | 128 | Proteobacteria_uncultured | 4.873 | 0.053 | |
| 2016 | |||||
| Phylum | Count | Depleted ASVs * | Log2 FC | p-Adjusted | |
| BC vs. UT | Proteobacteria | 34 | Thaumarchaeota_uncultured | −6.554 | 0.001 |
| Actinobacteria | 12 | Cellulomonas | −4.917 | 0.001 | |
| Bacteroidetes | 5 | Erwinia | −7.011 | 0.010 | |
| Chloroflexi | 5 | Cyanobacteria | −4.809 | 0.018 | |
| Firmicutes | 4 | Proteobacteria_Zymoseptoria | −4.165 | 0.027 | |
| Cyanobacteria | 3 | Proteobacteria_Lecanicillium | −4.500 | 0.027 | |
| Elusimicrobia | 3 | Proteobacteria_uncultured | −3.871 | 0.027 | |
| Armatimonadetes | 2 | Firmicutes_Clostridium | −4.648 | 0.033 | |
| Others | 11 | Flavobacterium | −4.679 | 0.037 | |
| Total | 79 | Chloroflexi | −4.155 | 0.037 | |
| PL vs. UT | Proteobacteria | 62 | Proteobacteria_Metarhizium | −4.314 | <0.000 |
| Actinobacteria | 21 | Thaumarchaeota_uncultured | −6.476 | <0.000 | |
| Chloroflexi | 17 | Bradyrhizobium | −2.117 | 0.002 | |
| Bacteroidetes | 9 | Cellulomonas | −4.852 | 0.002 | |
| Acidobacteria | 8 | Hypsibius | −6.149 | 0.002 | |
| Cyanobacteria | 8 | Proteobacteria uncultured | −2.946 | 0.015 | |
| Planctomycetes | 5 | Roseiflexus | −1.459 | 0.016 | |
| Parcubacteria | 5 | Dactylosporangium | −1.767 | 0.017 | |
| Others | 21 | Caldithrix | −2.679 | 0.029 | |
| Total | 156 | Cyanobacteria | −3.207 | 0.029 | |
| BC/PL vs. UT | Proteobacteria | 58 | Proteobacteria_Zymoseptoria | −3.803 | <0.000 |
| Actinobacteria | 22 | Caldithrix | −5.662 | <0.000 | |
| Chloroflexi | 12 | Actinobacteria_Asanoa | −5.777 | <0.000 | |
| Firmicutes | 9 | Thaumarchaeota_uncultured | −6.496 | <0.000 | |
| Bacteroidetes | 4 | Chloroflexi_Roseiflexus | −1.432 | <0.000 | |
| Cyanobacteria | 3 | Firmicutes_Tumebacillus | −2.191 | <0.000 | |
| Parcubacteria | 3 | Nitrospirae_uncultured | −3.682 | <0.000 | |
| Thaumarcheota | 3 | Proteobacteria_uncultured | −6.088 | <0.000 | |
| Others | 20 | Bradyrhizobium | −2.112 | <0.000 | |
| Total | 134 | Virgisporangium | −5.750 | <0.000 | |
| 2017 | |||||
| Phylum | Count | Depleted ASVs * | Log2 FC | p-Adjusted | |
| BC vs. UT | Proteobacteria | 35 | Pseudogulbenkiania | −7.155 | 0.000 |
| Firmicutes | 13 | Dechloromonas | −7.262 | 0.000 | |
| Actinobacteria | 7 | Paucimonas | −6.845 | 0.000 | |
| Bacteroidetes | 3 | Aquincola | −6.457 | 0.000 | |
| Acidobacteria | 3 | Dechlorobacter | −6.209 | 0.000 | |
| Cyanobacteria | 2 | Proteobacteria_uncultured | −5.666 | 0.001 | |
| Elusimicrobia | 2 | Bacteroidetes_uncultured | −1.382 | 0.008 | |
| Siprochaetes | 2 | Firmicutes_Clostridium | −5.981 | 0.022 | |
| Others | 8 | Azotobacter | −7.282 | 0.022 | |
| Total | 75 | Lachnoclostridium | −6.377 | 0.045 | |
| PL vs. UT | Proteobacteria | 27 | Firmicutes_Clostridium | −6.232 | 0.000 |
| Firmicutes | 18 | Herbaspirillum | −7.281 | 0.004 | |
| Bacteroidetes | 11 | Geobacter | −2.536 | 0.006 | |
| Actinobacteria | 4 | Gemmatimonadetes_AKAU4049 | −5.408 | 0.006 | |
| Gemmatimonadetes | 3 | Caenimonas | −5.876 | 0.006 | |
| Cyanobacteria | 3 | Bacteroidetes_Pedobacter | −5.986 | 0.006 | |
| Acidobacteria | 2 | Firmicutes_Clostridium | −6.988 | 0.007 | |
| Chloroflexi | 2 | Proteobacteria_uncultured | −5.171 | 0.008 | |
| Others | 8 | Gemmatimonadetes_bacterium | −6.134 | 0.008 | |
| Total | 78 | Sporacetigenium | −5.354 | 0.010 | |
| BC/PL vs. UT | Firmicutes | 17 | Bacteroidetes_Pedobacter | −5.868 | 0.025 |
| Proteobacteria | 16 | Proteobacteria_uncultured | −5.075 | 0.027 | |
| Actinobacteria | 6 | Gemmatimonadetes_bacterium | −5.984 | 0.027 | |
| Bacteroidetes | 5 | Azotobacter | −7.199 | 0.033 | |
| Cyanobacteria | 4 | Cyanobacteria_Calothrix | −5.306 | 0.053 | |
| Verrucomicrobia | 4 | Sedimentibacter | −6.200 | 0.056 | |
| Acidobacteria | 3 | Lachnoclostridium | −6.293 | 0.056 | |
| Chlamydia | 2 | Clostridium | −5.087 | 0.060 | |
| Others | 6 | Elusimicrobia_uncultured | −3.052 | 0.079 | |
| Total | 63 | Verrucomicrobia_uncultured | −3.077 | 0.095 | |
Publisher’s Note: MDPI stays neutral with regard to jurisdictional claims in published maps and institutional affiliations. |
© 2021 by the authors. Licensee MDPI, Basel, Switzerland. This article is an open access article distributed under the terms and conditions of the Creative Commons Attribution (CC BY) license (https://creativecommons.org/licenses/by/4.0/).
Share and Cite
Calderon, R.B.; Jeong, C.; Ku, H.-H.; Coghill, L.M.; Ju, Y.J.; Kim, N.; Ham, J.H. Changes in the Microbial Community in Soybean Plots Treated with Biochar and Poultry Litter. Agronomy 2021, 11, 1428. https://doi.org/10.3390/agronomy11071428
Calderon RB, Jeong C, Ku H-H, Coghill LM, Ju YJ, Kim N, Ham JH. Changes in the Microbial Community in Soybean Plots Treated with Biochar and Poultry Litter. Agronomy. 2021; 11(7):1428. https://doi.org/10.3390/agronomy11071428
Chicago/Turabian StyleCalderon, Rosalie B., Changyoon Jeong, Hyun-Hwoi Ku, Lyndon M. Coghill, Young Jeong Ju, Nayong Kim, and Jong Hyun Ham. 2021. "Changes in the Microbial Community in Soybean Plots Treated with Biochar and Poultry Litter" Agronomy 11, no. 7: 1428. https://doi.org/10.3390/agronomy11071428
APA StyleCalderon, R. B., Jeong, C., Ku, H.-H., Coghill, L. M., Ju, Y. J., Kim, N., & Ham, J. H. (2021). Changes in the Microbial Community in Soybean Plots Treated with Biochar and Poultry Litter. Agronomy, 11(7), 1428. https://doi.org/10.3390/agronomy11071428