Article

Soil Greenhouse Gas Responses to Biomass Removal in the Annual and Perennial Cropping Phases of an Integrated Crop Livestock System

by
Elizabeth Christenson
1,
Virginia L. Jin
2,*,
Marty R. Schmer
2,
Robert B. Mitchell
3 and
Daren D. Redfearn
1,*
1
Department of Agronomy and Horticulture, 136 Keim Hall, East Campus, University of Nebraska-Lincoln, Lincoln, NE 68583, USA
2
USDA-Agricultural Research Service (ARS) Agroecosystem Management Research Unit, 251 Filley Hall, East Campus, University of Nebraska-Lincoln, Lincoln, NE 68583, USA
3
USDA-ARS Wheat, Sorghum and Forage Research Unit, 251 Filley Hall, East Campus, University of Nebraska-Lincoln, Lincoln, NE 68583, USA
*
Authors to whom correspondence should be addressed.
Agronomy 2021, 11(7), 1416; https://doi.org/10.3390/agronomy11071416
Submission received: 1 June 2021 / Revised: 1 July 2021 / Accepted: 13 July 2021 / Published: 15 July 2021
(This article belongs to the Special Issue Biofuels and Bioenergy Contribute to Sustainable Global Development)

Abstract

:
Diversifying agronomic production systems by combining crops and livestock (i.e., Integrated Crop Livestock systems; ICL) may help mitigate the environmental impacts of intensive single-commodity production. In addition, harvesting row-crop residues and/or perennial biomass could increase the multi-functionality of ICL systems as a potential source for second-generation bioenergy feedstock. Here, we evaluated non-CO2 soil greenhouse gas (GHG) emissions from both row-crop and perennial grass phases of a field-scale model ICL system established on marginally productive, poorly drained cropland in the western US Corn Belt. Soil emissions of nitrous oxide (N2O) and methane (CH4) were measured during the 2017–2019 growing seasons under continuous corn (Zea mays L.) and perennial grass treatments consisting of a common pasture species, ‘Newell’ smooth bromegrass (Bromus inermis L.), and two cultivars of switchgrass (Panicum virgatum L.), ‘Liberty’ and ‘Shawnee.’ In the continuous corn system, we evaluated the impact of stover removal by mechanical baling vs. livestock grazing for systems with and without winter cover crop, triticale (x Triticosecale neoblaringhemii A. Camus; hexaploid AABBRR). In perennial grasslands, we evaluated the effect of livestock grazing vs. no grazing. We found that (1) soil N2O emissions are generally higher in continuous corn systems than perennial grasslands due to synthetic N fertilizer use; (2) winter cover crop use had no effect on total soil GHG emissions regardless of stover management treatment; (3) stover baling decreased total soil GHG emissions, though grazing stover significantly increased emissions in one year; (4) grazing perennial grasslands tended to increase GHG emissions in pastures selected for forage quality, but were highly variable from year to year; (5) ICL systems that incorporate perennial grasses will provide the most effective GHG mitigation outcomes.

1. Introduction

Diversifying agricultural systems by integrating livestock with row-crop production (i.e., Integrated Crop Livestock, ICL, systems) has the potential to increase economic and environmental resiliency and could help mitigate greenhouse gas (GHG) emissions from the agricultural sector [1,2,3]. Livestock integration can include grazing of annual crop residues, winter cover crops, or perennial grasslands [4,5]. Cash crop residues (i.e., stover), some cover crops, and perennial grasses can also be used as biomass feedstocks for second-generation biofuels, further diversifying the array of ICL system-based products while providing a low-carbon alternative to fossil fuels [6,7].
One component of ICL system adoption may include the conversion of existing cropland to grassland for supporting grazing and/or biofuel production. While shifting current land-use from highly intensive to lower-input production practices is key to mitigating the rise in atmospheric GHG concentrations [8,9], such conversions on highly productive croplands can have limited carbon sequestration benefits [10]. In contrast, the conversion of marginally productive lands from row-cropping to grass-based agriculture can increase farm profitability and environmental sustainability by integrating perennial vegetation [6,11].
The environmental and ecosystem service benefits of maintaining existing perennial vegetation or converting marginal land from cropland-to-grassland include reduced soil erosion, better soil health, increased soil organic carbon (SOC) sequestration, improved water quality, and greater habitat for wildlife and pollinators, among others [3,4,12]. Less clear are the impacts of ICL systems on soil emissions of non-CO2 GHGs (i.e., nitrous oxide, N2O; methane, CH4), particularly how livestock grazing of crop residues, cover crops, and perennial grasses affects these emissions. Soil emissions of non-CO2 GHGs are generally lower under perennial grasses compared to row-crops soils due to lower fertilizer N inputs [7,13,14,15]. When grazing is incorporated, decreasing fertilizer use as well as decreasing the intensity of grazing (i.e., lower stocking rates, using multi-paddock/rotational/flash grazing vs. continuous grazing) can decrease system GHG emissions compared to more conventional continuous grazing practices [16,17,18]. Soil GHG responses to grazing of crop residues, cover crops, and perennial grasses, however, are highly variable, reflecting the spatial and temporal complexity arising from interactions between ICL system design and management of row-crop, perennial grass, and livestock components [19,20]. Similarly, soil GHG responses to mechanical removal of annual or perennial biomass for offsite livestock use or bioenergy feedstock can also be highly variable as a result of site-specific interactions between weather, management, manure inputs, and soil conditions [21,22,23].
In this study, we evaluated short-term (<3 years) non-CO2 soil greenhouse gas (GHG) emissions from both row-crop and perennial grass phases of a field-scale model ICL system established on marginally productive, poorly drained cropland in eastern Nebraska USA. This model ICL system demonstration site included 8 ha of continuous corn (Zea mays L.) production where non-grain crop residue (i.e., stover) removal occurred by grazing or mechanical baling, with or without a winter cover crop (hexaploid triticale, x Triticosecale neoblaringhemii A. Camus); 4 ha each of ‘Newell’ smooth bromegrass (Bromus inermis L.), a cool-season pasture grass selected for improved digestibility [24]; ‘Liberty’ switchgrass (Panicum virgatum L.), a high-yielding, winter-hardy warm-season grass cultivar developed for bioenergy production [25]; ‘Shawnee’ switchgrass, a warm-season grass cultivar developed for improved forage quality [26]. Our objectives were to determine how growing season (GS) soil GHG emissions responded to (1) grazing or baling of row-crop residues, with and without cover crop use, and (2) different grazing practices (non-, flash-, or conventionally grazed) on different perennial grasses, including a bioenergy cultivar. We also compared GHG emissions between row-crop and perennial phases of this ICL system. These findings are expected to contribute to the growing body of published information to clarify how soil emissions of non-CO2 GHGs respond to various aspects of agricultural management within the multi-functional context of ICL systems.

2. Materials and Methods

2.1. Site Description and Experimental Design

The field study was located at the University of Nebraska-Lincoln’s Eastern Nebraska Research and Extension Center near Ithaca, Nebraska (41°09′20.4″ N, 96°26′47.2″ W). The site was established in 2015 on 20 ha of non-irrigated, marginally productive cropland. Cropland was defined as marginally productive because ~40% of the site area is classified as somewhat poorly drained. Soils were silt loams and silty clay loams of soil series common to this region: Tomek (Fine, smectitic, mesic Pachic Argiudoll; 40%); Filbert (Fine, smectitic, mesic Vertic Argialboll; 27%); Yutan (Fine-silty, mixed, superactive, mesic Mollic Hapludalf; 20%); Fillmore (Fine, smectitic, mesic Vertic Argialboll; 13%) [27]. Long-term mean annual precipitation and mean annual temperature were 747 mm and 9.9 °C, respectively [28]. Weather data were collected from a weather station located 600 m SE of the ICL system (Station ID Mead 6S). During the growing season (April–October) of 2017, 2018, and 2019, the site received 675, 537, and 633 mm of rainfall, respectively.
Of the 20 ha site area, 8 ha were planted to continuous corn production in 2015, 8 ha were planted to perennial grass in 2015 (4 ha each Newell smooth bromegrass and Liberty switchgrass), and 4 ha were planted to Shawnee switchgrass in 2006. Hereafter, these treatments are referred to as “Newell,” “Liberty,” and “Shawnee,” respectively. The 8 ha continuous corn area consisted of a randomized complete block design in 3 blocks (2.7 ha each) to assess corn stover removal practice (no removal, mechanical baling, or livestock grazing) and winter cover crop use (with or without triticale). Grazed subplot sizes were twice as large as non-grazed subplots to accommodate forage needs for cattle (grazing management described below).
In the remaining 12 ha of site, land was split into three 4 ha pastures, each with a different perennial grass. To measure soil and GHG fluxes, three pseudo-replicate areas within each 4 ha pasture were selected at random across the pasture landscape. An open-top cattle exclusion cage made of welded wire fencing (2 m W × 4 m L × 1.2 m H) was installed at each pseudo-replicate location and partitioned into two 2 m subsections plus a non-exclosed 2 m segment immediately adjacent to the exclosure. Each subsection was used for one of three grazing treatments: non-grazed and flash-grazed were within the exclosure, and conventionally grazed was in the adjacent area outside the exclosure. The non-grazed subsection was permanently exclosed for the duration of the study. The flash-grazed subsection was open for the first seven days of grazing during each conventionally grazed period, after which flash-grazed GHG bases were closed off from grazing. The conventionally grazed subsections were always open for continuous grazing when livestock were present in the pasture. Exclosures were located 50–150 m apart from each other within each pasture to ensure spatial representation of the pasture area. Exclosed areas were also used for measuring baseline soil properties in addition to soil GHGs (described below). All grazing in annual row-crop and perennial phases of the ICL system was done with crossbred yearling steers each year.

2.2. Row-Crop Management and Grazing of Stover, Cover Crop

Corn was planted in late April in 76 cm rows (~65,240 seeds ha1). Nitrogen fertilizer was applied prior to planting in late April with 140 kg N ha−1 applied as UAN (28-0-0) using a multi-row applicator with injector coulters between corn rows to a soil depth of ~10 cm. Pre- and post-emergent herbicides were also applied. Corn grain was harvested in mid-late September, followed by triticale planting in early October. Triticale was planted at a rate of 112 kg ha−1 using a no-till drill with 9 cm row spacing. Stover removal by baling occurred after grain harvest (i.e., early October) in 2016 and 2017 using commercial hay equipment (self-propelled windrower with disc header knives and a large, round baler) approximating a ~50% removal rate.
Grazing duration was determined by initial cattle weight, grazing date, and corn yield for each year. Differences in grazing duration, across years, were largely the result of corn residue availability differences between 2018 and 2019. Stover removal by fall stalk grazing occurred in 2018 only for 10–14 days after triticale planting. As triticale biomass was very low, subplot areas with and without cover crop were combined for livestock grazing (total grazed subplot area = 1.35 ha−1 per block). In 2018, stover was grazed for 16 days (27 September to 12 October) with 6 steers (460 kg hd−1). In 2019, stover was grazed 7 days (23 October to 29 October) with 6 steers (379 kg hd−1). Triticale was chemically terminated in spring the following year approximately 10 days prior to corn planting.

2.3. Perennial Grass Grazing Management

All grass cultivars were planted at a rate of 7.8 kg ha−1, or ~320 Pure Live Seed (PLS) m−2, using a no-till drill with 9 cm row spacing at the time of establishment (2015 for Newell and Liberty; 2006 for Shawnee). No fertilizer application and no grazing occurred in 2015 and 2016 to allow for adequate stand establishment. All perennial grass pastures were mechanically harvested for hay in 2016 (7 June for Newell, 15 November for Liberty and Shawnee). Beginning in 2017, each pasture received 56 kg N ha−1 annually in late April–early May and grazing was initiated. Both Liberty and Shawnee pastures were hayed in mid-November 2017–2019, corresponding with a post-killing frost harvest which is the recommended best management practice for harvesting warm-season perennial grasses for biofuel feedstock [29]. Fall biomass removal of switchgrass was considered a part of warm-season grass management and therefore not evaluated as a separate treatment within the switchgrass pastures.
In 2017, Newell was grazed for 21 days in the spring (18 May to 8 June) by 18 steers (342 kg hd−1). The steers were then moved to flash graze Liberty for 7 days (13–20 June). The same steers (367 kg hd−1) were then moved to graze Shawnee for 73 days (20 June to 1 September). The steers were moved back to Newell to graze smooth bromegrass re-growth for 29 days (7 September to 6 October). In 2018, 18 steers (394 kg hd−1) grazed Newell for 31 days (2 May to 1 June). The herd was then equally divided, moving 9 steers (416 kg hd−1) to graze Liberty and 9 steers (413 kg hd−1) to graze Shawnee for 79 days (11 June to 29 August). The herd was then recombined, and the 18 steers (457 kg hd−1) returned to graze the regrowth of Newell smooth bromegrass pasture for 13 days (5–18 September). Grazing in 2019 was managed identically to 2018, with 18 steers (289 kg hd−1) grazing Newell for 26 days (3–29 May), followed by splitting the herd and moving 9 steers (339 kg hd−1) to graze Liberty and 9 steers (340 kg hd−1) to graze Shawnee for 79 days (5 June to 23 August). The herd was again recombined after switchgrass grazing and the 18 steers (362 kg hd−1) returned to graze Newell regrowth for 23 days (3–26 September).

2.4. Baseline Soil Sampling

Baseline soils data were collected during the study establishment phase on 14 June 2016 using a hydraulic soil sampling system. In the continuous corn treatments, three cores (3.1 cm DIA) equally spaced along a linear transect through each plot were sampled and composited by depth increment (0–5, 5–15, 15–30, 30–60, 60–90, 90–120 cm). In the perennial grass pastures, two soil cores were sampled within each of the three grazing treatment subsections of each exclosure and composited by the same depth increments described above.
Soils were air-dried, homogenized, and passed through a 2 mm sieve prior to soil chemical analyses. Soil bulk density was determined by using the volume and dry weights (dried at 105 °C) from the sample cores [30]. Soil electrical conductivity (dS m−1) and pH were determined in solution after extraction with deionized water (1:1 soil:water ratio) using a combination electrode (Orion Star A215; Thermo Fisher, Waltham, MA, USA). A subsample of sieved soil was finely ground then analyzed for total carbon and nitrogen (%) using dry combustion (FlashEA 1112 Series NC Soil Analyzer; Thermo Fisher) [31]. A subsample of sieved soil was sent to a commercial testing lab for determination of exchangeable cations (K, Ca, Mg, Na) (Ward Laboratory; Kearney, NE, USA). For this study, baseline soil values were aggregated into means weighted by increment depth for the top 30 cm of soil (Table 1).

2.5. Soil Greenhouse Gas Emissions

Soil GHG emissions were sampled in all treatments in the continuous corn system (RCBD) and perennial grass system (pseudo-replicates) throughout the 2017–2019 growing seasons, regardless of whether the treatment was implemented or not in any given year. Soil GHGs were measured using vented static chambers following the standardized protocols from the USDA-ARS’s Greenhouse gas Reduction through Agricultural Carbon Enhancement network (GRACEnet) [32,33,34]. Sampling chambers were covered with reflective insulation to help maintain temperature, and both sampling chambers and bases were built with 20-gage stainless steel. The bases covered an area of 1707 cm2 (52.7 × 32.4 cm) and were installed to a soil depth of 5–7 cm, leaving 5–7 cm aboveground. One chamber base was used per experimental unit. In the corn system, the base was placed perpendicularly such that the corn row was ~1/3 inside the chamber area, parallel to the short edge of the chamber. The remainder of the base extended into the between-row area, resulting in a total footprint of 2:1 between-row to in-row microsite area. The between-row microsite included the fertilizer injection furrow. Bases were removed during any field operations that required machine traffic then re-installed when management was complete. The immediate effects of soil disturbance on GHG emissions following base installation were allowed to dissipate for a minimum of 24 h [35], but typically 2–4 days before gas sampling.
Headspace gas samples (25 mL) were collected via syringes and then injected into 12 mL evacuated vials at time 0, 10, 20, and 30 min for each sampling event. Over-pressurization of vials ensured that sufficient sample would be available for automated GHG analysis in the laboratory (described below). Samples were taken during the morning of each sampling date to account for diurnal variability and approximate daily average temperature. Repeated sampling occurred throughout the growing season (April–October) each year as weather, ground conditions, and resources allowed. Eight sampling events occurred during the 2017 growing season, 5 events in the 2018 growing season, and 9 events in the 2019 growing season. Additional data collected on each sampling date for making flux-suppression corrections (described below) included air temperature, soil temperature at 15 cm, and soil moisture from 0 to 15 cm depth measured with a handheld time domain reflectometer (FieldScout TDR 300; Spectrum Technologies, Aurora, IL, USA) with a site-specific calibration.
Sample GHG concentrations were analyzed within 10 d of sample collection using a headspace autosampler (CombiPAL; CTC Analytics, Zwingen, Switzerland) connected to a gas chromatograph (450-GC; Varian, Middelburg, the Netherlands) with different detectors for simultaneous measurement of N2O (electron capture detector), CH4 (flame ionization detector), and CO2 (thermal conductivity detector). Only N2O and CH4 data are reported here. Soil N2O and CH4 fluxes were calculated as the linear or quadratic change in the gas concentration in the headspace over time in the enclosed chamber volume [36,37]. Additionally, the soil N2O fluxes were corrected for suppression of the surface–atmosphere concentration gradient [38]. Positive or negative GHG fluxes were considered non-zero when rates exceeded the flux detection limit calculated by ambient gas concentration, analytical precision, and chamber deployment time [39]. Cumulative growing season N2O and CH4 emissions for each year were calculated by linear interpolation of daily emissions between sampling dates and summing daily emissions over the growing season (i.e., trapezoidal integration). Positive total growing season flux values indicated that soils were a GHG source, and negative values indicated that soils were a GHG sink.

2.6. Statistics

Statistical analyses to determine the effects of grazing management and crop residue management on growing season GHG fluxes were conducted separately for each phase of the ICL system due to experimental design differences. Moreover, separate analyses were completed for each year of the study to account for seasonal differences in management practice and/or uneven number of GHG sampling events across years (described below).
The continuous corn system was evaluated as a randomized complete block design to test the main and interaction effects of corn stover management (retained, grazed, or baled) and winter cover crop use (with or without triticale). In the continuous corn system, stover was removed by baling in fall 2016 and 2017 only, which would be expected to affect 2017 and 2018 growing season emissions, respectively. No grazing occurred in 2017 and 2018, so those experimental units were assigned as the “no removal” stover removal treatment. Therefore, 2017 and 2018 GHG emissions from corn were evaluated for the main and interaction effects of stover removal (no removal, baling) and cover crop (with or without triticale). Fall stover grazing occurred only in 2018 and was expected to affect 2019 growing season GHG emissions. Similarly, fall 2019 stover grazing was expected to affect 2020 growing season GHG emissions, but those emissions were not measured because the experiment was terminated in the spring of 2020 prior to the start of the growing season. Although stover was not baled in 2018, the experimental assignments were retained as “baled” due to baling history (2016, 2017). As a result, 2019 data were evaluated with their original assigned treatments (i.e., three levels of stover removal, two levels of cover crop).
The perennial grasslands were evaluated as a pseudo-replicated split plot design to test the main and treatment interaction effects of grass type (Newell, Liberty, Shawnee) and grazing management (non-grazed, flash grazed, conventionally grazed). Only one grazing treatment variance occurred in 2017 when Liberty was flash grazed only (i.e., no convention grazing). No treatment modifications occurred in 2018 or 2019.
In addition to the phase-specific analyses above, we also assessed whether different land-use affected soil GHG emissions (i.e., perennial grassland vs. annual corn production). For each year of the study, significant main or interaction means from perennial grass and continuous corn phases determined above were then compared using contrast statements. Given the experimental design differences between the perennial grass and corn phases of this ICL system, contrast statements were unbalanced because the most granular level of data were used.
All statistical tests were performed with SAS v9.3 [40]. Normality and homogeneous variance were evaluated using the conditional studentized residuals and the UNIVARIATE procedure, and data was ln-transformed when necessary. Main and interaction effects were evaluated with PROC GLIMMIX, and least significant means were reported for significant main effects or significant interactions. Significance was set at p < 0.05, and 0.05 < p < 0.10 was considered marginally significant. All treatment values are reported as untransformed means ± standard errors.

3. Results

3.1. Growing Season Soil CH4 Fluxes

3.1.1. Continuous Corn

Total growing season (GS) soil CH4 fluxes in the continuous corn system were low and fluctuated around zero for all years and treatments, showing slight positive fluxes (i.e., CH4 emission) or slight negative fluxes (i.e., CH4 consumption) (Figure 1). Stover and cover crop treatments affected soil CH4 in 2017 only, when there was a significant stover-by-cover crop interaction (p = 0.041). Soils CH4 emissions were highest in 2017 when stover was baled and no triticale cover crop was present (0.24 ± 0.06 kg C ha−1). All other treatment means were not significantly different from zero (no removal/no triticale = −0.04 ± 0.04; no removal/with triticale = −0.05 ± 0.14; baled/with triticale = −0.14 ± 0.05 kg C ha−1). In 2018, total GS soil CH4 emissions were significantly greater than zero when no stover was removed, but there were no significant treatment effects (2018 mean = 0.14 ± 0.03 kg C ha−1). In 2019, total GS soil CH4 emissions were significantly greater than zero when stover was baled and triticale cover crop was present, and when stover was grazed with no triticale present. There were no significant main or interaction treatment effects (2019 mean = 0.72 ± 0.34 kg C ha−1).

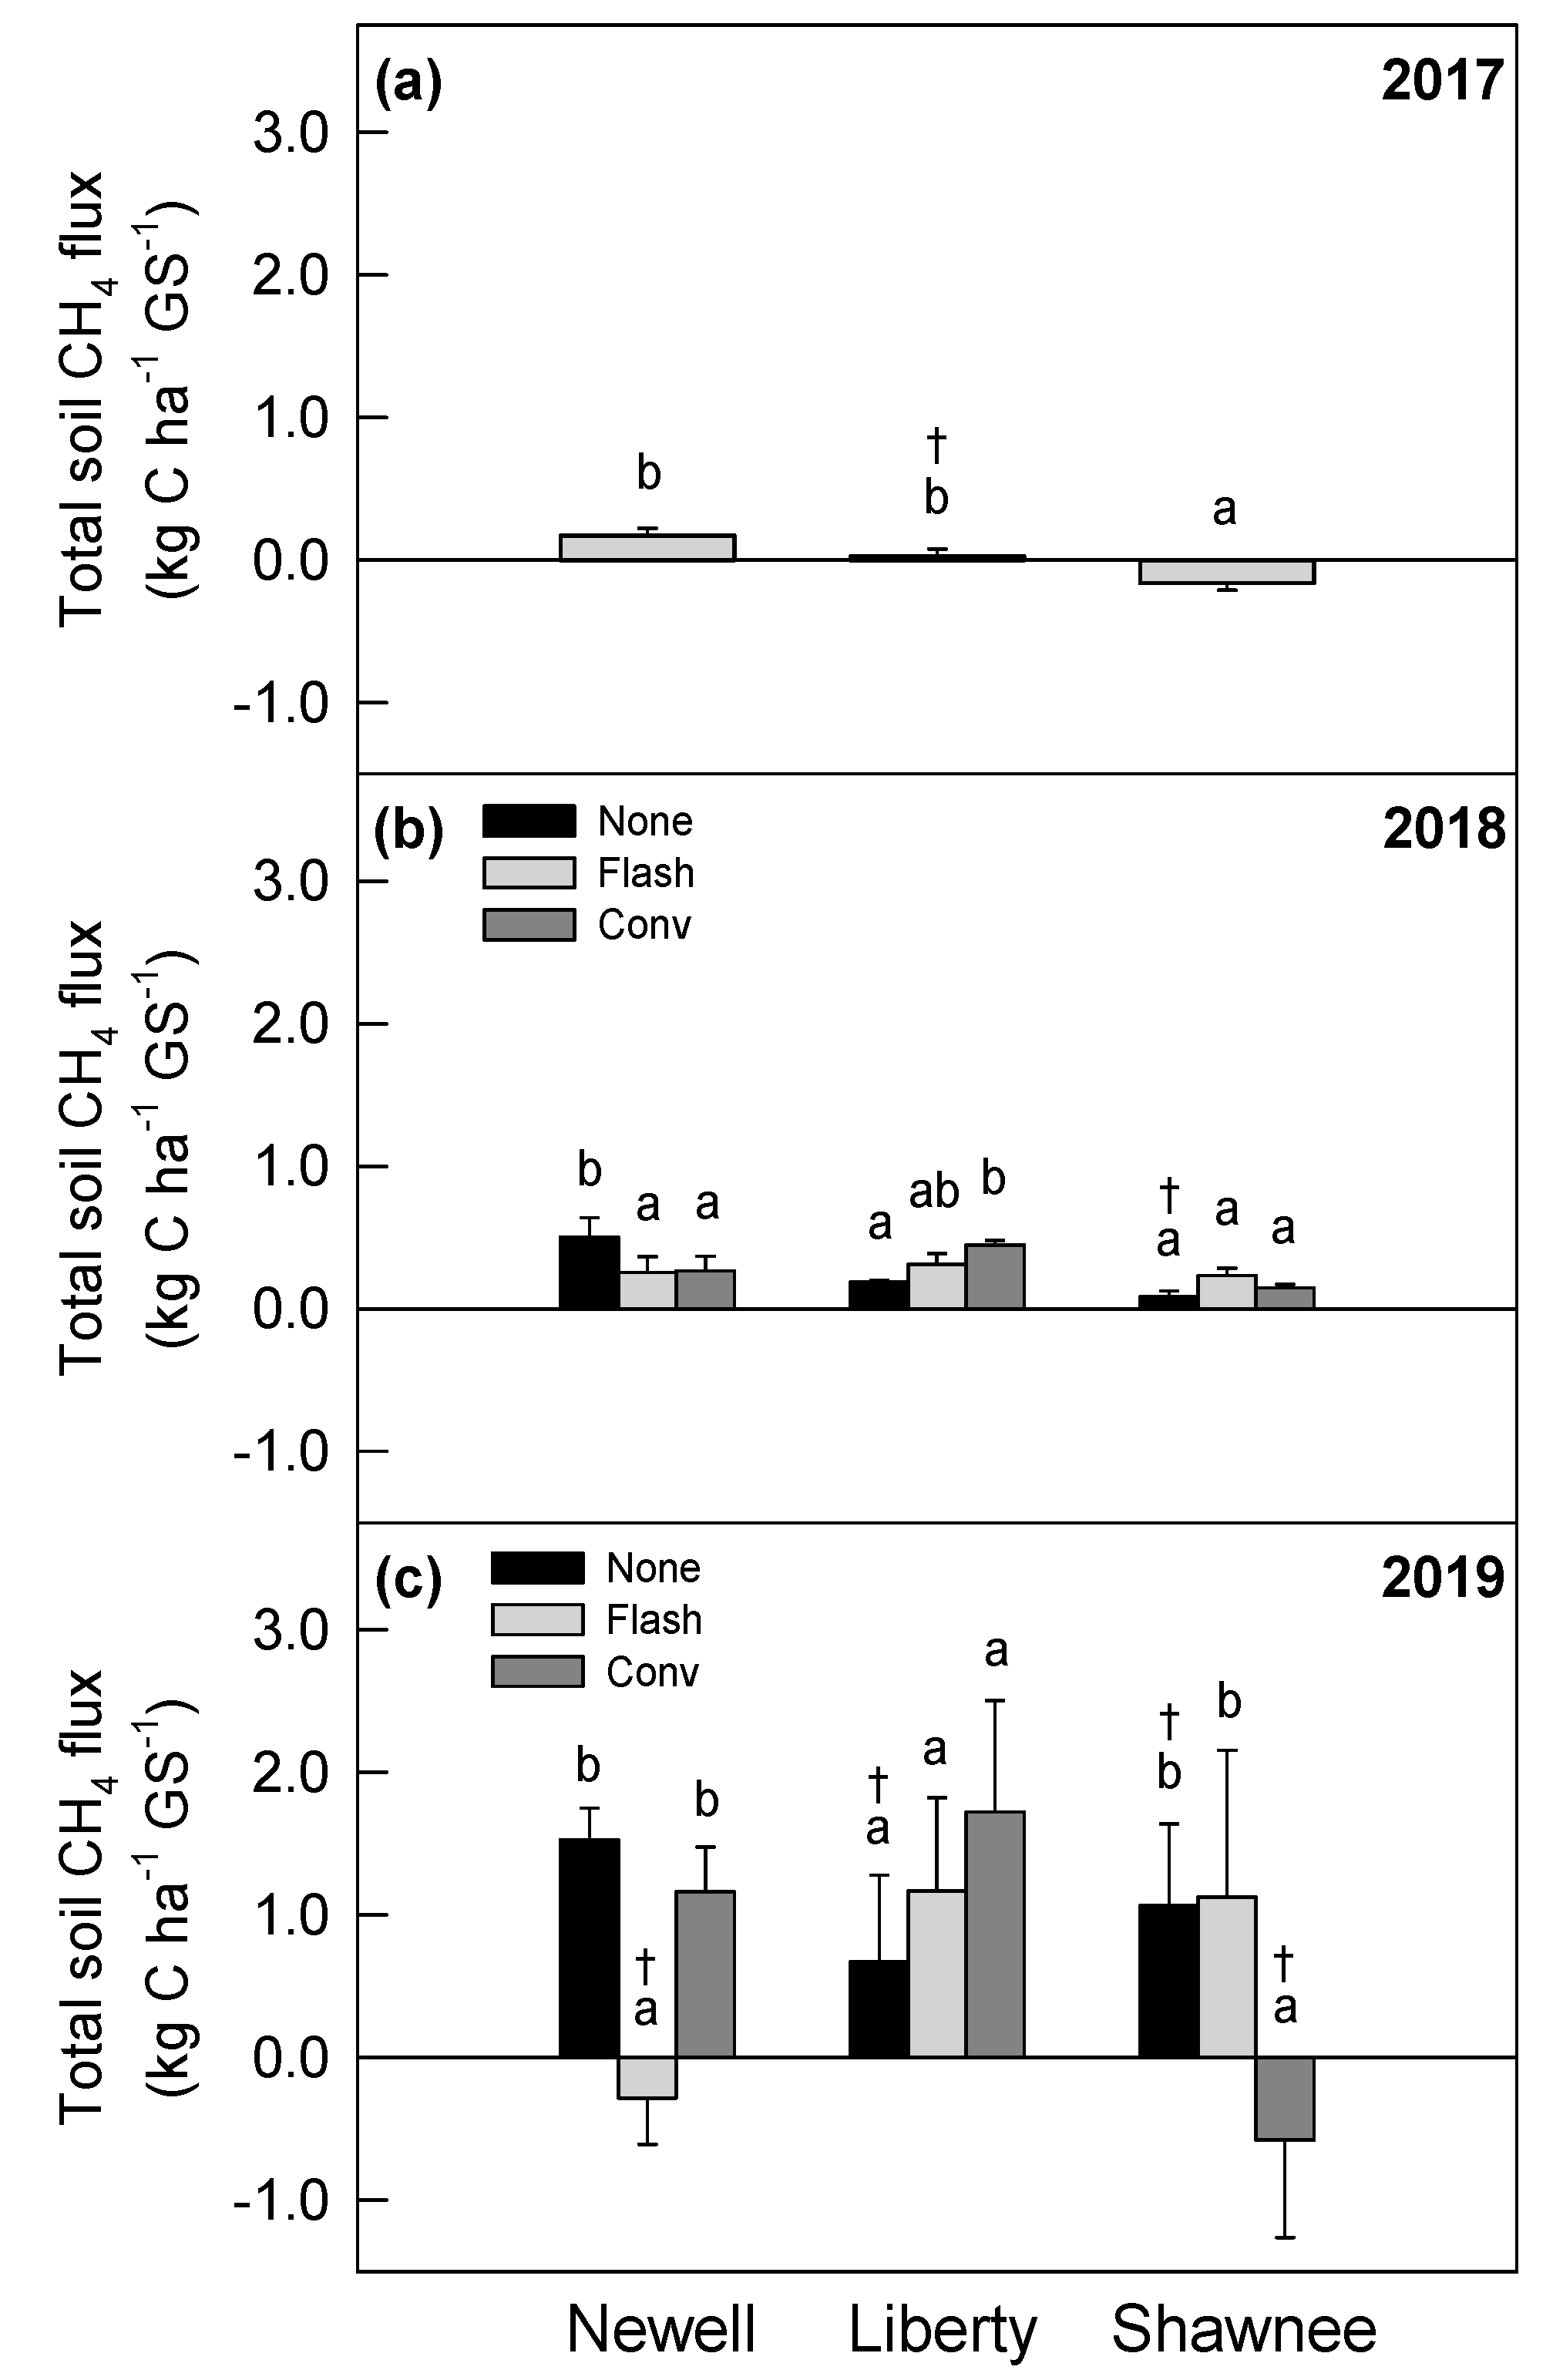
3.1.2. Perennial Grass

Total GS CH4 fluxes in perennial grass pastures were low and fluctuated around zero (Figure 1). In 2017, there was no effect of grazing and only the main effect of grass type was significant (p = 0.001). Growing season CH4 fluxes were not different between soils under Newell and Liberty (0.17 ± 0.05 and 0.03 ± 0.05 kg C ha−1, respectively), but Liberty fluxes were not significantly different from zero. Growing season CH4 fluxes were the lowest in Shawnee among all pasture treatments, indicating significant CH4 consumption (−0.16 ± 0.05 kg C ha−1). In 2018, the grass type-by-grazing interaction was significant (p = 0.007), and all treatment means were significantly greater than zero except for non-grazed soils in Shawnee pasture. Soil CH4 emissions tended to be numerically greatest in non-grazed Newell pasture and lowest in Shawnee pasture. In 2019, the grass type-by-grazing interaction was marginally significant (p = 0.061), with only two treatment means significantly greater than zero (non-grazed Newell, conventionally grazed Liberty).

3.2. Growing Season Soil N2O Emissions

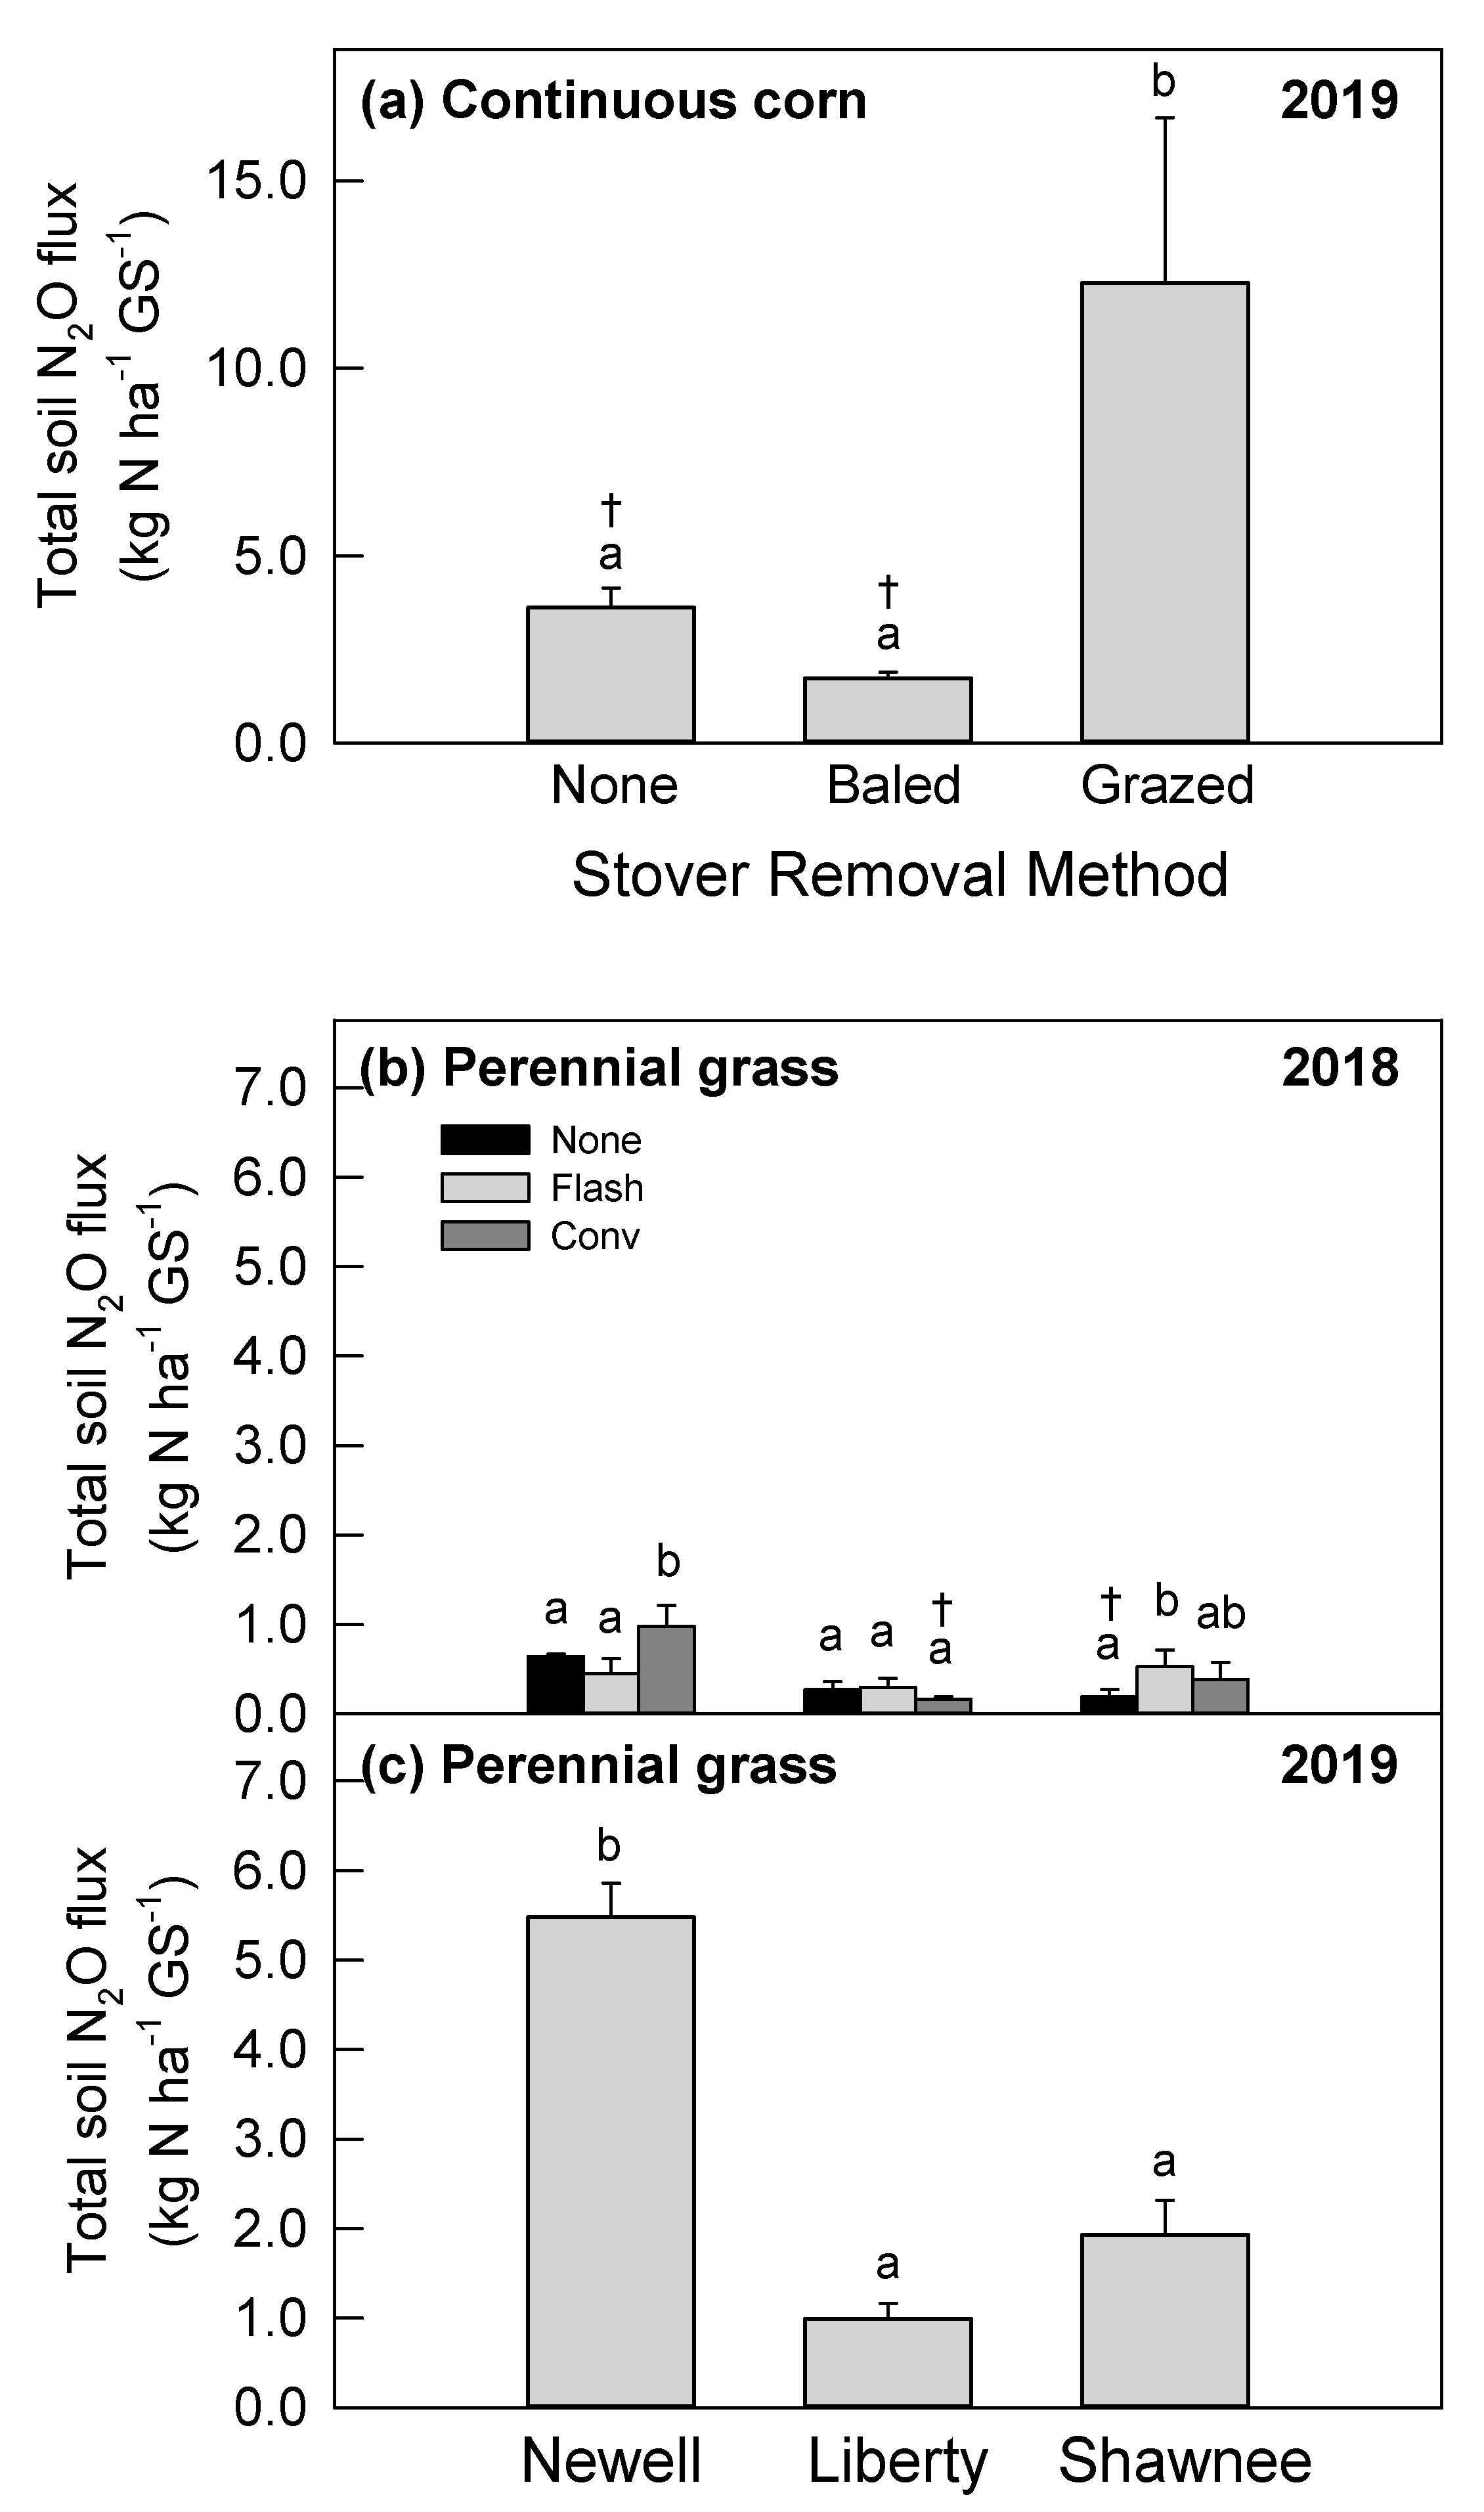
3.2.1. Continuous Corn

Total GS N2O fluxes in the continuous corn system were positive (i.e., emissions) over the three-year study for almost all treatment combinations. In 2017, there were no significant treatment effects, and all soils were N2O sources (2017 mean = 5.5 ± 0.9 kg N ha−1). In 2018, there were no significant treatment effects and only soils with no stover removal (with and without triticale) had N2O emissions significantly greater than zero (2018 mean = 4.6 ± 1.4 kg N ha−1). In 2019, there was a main effect of stover removal treatment only (p = 0.044) on GS N2O emissions and only soils that were grazed (with and without triticale) had fluxes significantly greater than zero (Figure 2a).

3.2.2. Perennial Grass

Total GS N2O fluxes in the perennial grass systems were positive over the three-year study for almost all treatment combinations. In 2017, there were no significant treatment effects, and all Shawnee soils (non-grazed, flash grazed, conventionally grazed) and flash grazed Liberty soils showed emissions that were significantly greater than zero (2017 mean = 0.8 ± 0.1 kg N ha−1). In 2018, there was a significant grass type-by-grazing interaction (p = 0.053), with all soils emitting N2O except for conventionally grazed Liberty and non-grazed Shawnee which had fluxes not different than zero (Figure 2b). Soil N2O emissions under different grass types did not differ when flash grazed, and there was no difference among grazing treatments in Liberty soils. The highest emissions tended to occur in the Newell pasture system and whenever pastures were conventionally grazed. In 2019, total GS N2O emissions differed by grass type only (p < 0.001), where Newell had the highest emissions (5.5 ± 0.4 kg N ha−1) compared to either switchgrass cultivar (Liberty = 1.0 ± 0.2 kg N ha−1; Shawnee = 1.9 ± 0.4 kg N ha−1) (Figure 2c). All soils in 2019 were N2O emitters except for flash grazed Liberty, where flux was not different from zero.

3.3. Land-Use Effects on Growing Season Soil GHG Emissions

The impacts of land use were evaluated using contrast statements for each year of the study due to differences in experimental design between the continuous corn phase and perennial grass phase of the ICL system. Here, we report only those contrasts for significant treatment differences that were different from zero which indicated a significant positive (or negative) flux. Positive or negative fluxes indicated that soils were a GHG source or sink, respectively.

3.3.1. Soil CH4 Fluxes

In 2017, the only treatments with significant non-zero total GS CH4 fluxes were continuous corn soils where stover was baled and no triticale cover crop planted (positive flux), Newell smooth bromegrass (positive flux), and Shawnee switchgrass (negative flux). For these three systems, CH4 emissions from the continuous corn system were not different than Newell, and both were significantly higher than Shawnee. In 2018, almost all significant treatments were non-zero GS CH4 emissions, where the overall continuous corn average was lower than non-grazed Newell and grazed Liberty (flash, conventional). In 2019, no significant differences in GS CH4 fluxes occurred between any continuous corn or perennial grass system.

3.3.2. Soil N2O Fluxes

In 2017 and 2018, significant non-zero GS N2O emissions occurred in both continuous corn and perennial grass systems, with emissions from corn significantly higher than those from perennial grasses. In 2018, corn emissions were nearly five times greater than perennial grass emissions. In 2019, all continuous corn treatments emitted more N2O than Liberty, and all corn treatments except for baled stover emitted more N2O than Shawnee. Total GS N2O emissions from Newell, however, were higher than either corn stover retained or baled systems but significantly lower than grazed corn systems. Fall-grazed continuous corn systems had the highest total N2O emissions compared to any other land use.

4. Discussion

The adoption of ICL systems has increased in the last 10 years, particularly in the US Great Plains where both crop and livestock production contribute significantly to regional economies [3]. Although this agricultural diversification could enhance agroecosystem sustainability, it is unclear how land use decisions and associated management practices could impact the overall GHG mitigation potential of ICL systems, particularly on marginally productive lands. The limited number of empirical studies conducted in ICL systems indicate a high degree of spatial and temporal complexity as a result of management interactions between row-crop, perennial grass, and livestock components. In this study, we evaluated the impacts of various management practices on soil non-CO2 GHG emissions for both row-crop and perennial grass phrases in a model ICL system on marginally productive soils. Although soil CO2 emissions were also measured here, we did not present this data in the context of system GHG mitigation potential because chamber-based CO2 represents only CO2 outputs, not net ecosystem CO2 exchange [41].
We also note that the limited GHG sampling frequency used in this study introduces substantial uncertainty in the calculation of total growing season GHG emissions [42,43]. To reduce this uncertainty, we limited comparisons of total GHG emissions between treatments within growing seasons instead of across seasons and our results are discussed below.

4.1. Management Effects on Total Growing Season CH4 Fluxes

Our findings are consistent with other studies reporting that upland agricultural soils are typically minor emitters or minor sinks for CH4 [15,16,22,34,44,45]. For all years of this study, the total growing season (GS) soil CH4 fluxes tended to fluctuate around zero regardless of management. Soils generally acted as a slight CH4 source, except Shawnee in 2017 which was a CH4 sink. Other studies have also found that grazed pastures are minor CH4 sinks [16,46] or are CH4 neutral [47,48,49]. Similarly, we found no consistent effects of grazing on total GS CH4 fluxes from either perennial grass or continuous corn phases of this ICL system.
Livestock production systems are significant sources of CH4 globally [50,51], but >70% of direct cattle GHG emissions (CH4 + N2O) is from CH4 released during enteric fermentation and only 4% from manure CH4 [52,53]. The static chamber method here was limited to quantifying soil-derived GHG fluxes only, where livestock impacts occurred through current or legacy effects of excreta deposition or soil disturbance/compaction from hoof action within the GHG chamber footprint. Given that CH4 production is expected under more anoxic conditions [54], the low CH4 emissions measured here are consistent with the somewhat poorly drained classification of soils at this marginally productive site.

4.2. Management Effects on Total Growing Season N2O Fluxes

Total GS emissions of N2O were generally positive for all management treatments in all production systems, indicating that soils in both annual and perennial phases of this experimental ICL system were N2O sources. The range of total GS N2O emissions here (4.6 to 12.3 kg N ha−1) were within the range of reported values from other row-crop, perennial grassland, or ICL system studies in the US Great Plains region [20,22,49,55,56,57,58].

4.2.1. Cover Crop Effects on Soil N2O

In the continuous corn system, total GS emissions of N2O were numerically similar from year-to-year and showed no overall effect of winter cover crop use (i.e., triticale). Although cover cropping did decrease N2O emissions in two out of three years in a South Dakota USA corn–soybean (Glycine max (L.) Merr.) rotation system [56], there was no response to ungrazed or grazed winter cover crop use in different ICL systems in South Dakota [49,57]. Moreover, a study in a subtropical ICL system found that cover crop grazing increased soil N2O emissions [59]. These inconsistent results were confirmed by a global meta-analysis that found that 40% of studies reported cover crops mitigating soil N2O emissions while 60% exacerbated emissions, depending on N management and cover crop type (i.e., legume vs. non-legume) [60]. For non-legume cover crops used in high N input systems, the relative impact of using cereal cover crops increased with fertilizer rate but approximated a zero-response for the fertilizer rate used here (140 kg N ha−1) [60], which was consistent with our measured results.

4.2.2. Effects of Stover Baling on Soil N2O

The effect of mechanical corn stover removal on soil GHG emissions is highly site-specific and spatially variable, particularly across the US Corn Belt region [22]. Generally, mechanical stover removal, particularly in more temperate regions, decreases soil N2O emissions by decreasing the availability of C and N for soil microbial use [21,22,61]. In Nebraska, mechanical removal of corn stover (~35–65% removal of non-grain biomass) decreased annual soil N2O emissions by 23% compared to when stover was retained [15,34]. In the current study, baling had no impact on soil N2O emissions in two of three years, but decreased emissions by ~50% compared to non-removed controls in 2019. The high variability of stover baling effects on soil N2O emissions reported here highlights the complexity of soil responses to site-specific management and variability in environmental conditions (i.e., soils, weather).

4.2.3. Effects of Stover Grazing on Soil N2O

Although fall grazing of corn stover was implemented in only one year of this ICL system field study (2019), total GS N2O emissions were three to seven times higher under grazing than when stover removed by baling or not removed, respectively. Information on the effect of annual crop residue grazing on soil GHG emissions is scarce. Grazing of corn stover did not affect GS N2O emissions in an ICL experiment in South Dakota [57] or another ICL study in North Dakota [20], though emissions were numerically greater when stover was grazed in both studies. In another ICL study, cumulative GS N2O emissions increased by five times when grazed compared to a previously ungrazed period [49].
The stimulation of N2O production under stover grazing could result from changes in both soil physical properties (i.e., compaction) and/or due to N inputs from livestock excreta. Potential compaction of soils by fall or winter livestock grazing could occur before soils freeze, leading to more anaerobic soil conditions that could promote N2O produced during denitrification [62]. Subsequent disruptions of soil aggregates during freeze–thaw cycles could make additional soil C and N resources available to denitrifiers, further exacerbating N2O losses [62]. Similar increases in N2O production were found with successive rewetting/drying cycles in compacted soils amended with synthetic cattle urine [63]. Urine and dung deposition supplies water and labile nutrients to soils that can rapidly increase soil N2O emissions [64]. Moreover, the effects of excreta inputs can persist throughout the growing season if soils receive adequate rainfall to maintain soil moisture [65]. While neither soil compaction nor livestock excreta effects were quantified in the current study, both mechanisms may have contributed to the significant increase in total GS N2O emissions when stover was grazed in 2019.

4.2.4. Effects of Perennial Grass Type on Soil N2O

In the perennial grass phase of this ICL study, we found that total GS N2O emissions tended to be greater in Newell, a cool-season forage grass, compared to the two warm-season switchgrass pastures (Liberty, Shawnee). Differences GS N2O emissions have been noted between pasture types in other studies, primarily as a positive function of fertilizer N inputs [18,66]. Similarly, fertilizer N inputs into non-grazed grass systems, such as those that may be targeted for second-generation bioenergy feedstock production, also have a direct impact on cumulative N2O emissions. For example, annual N2O emissions increased with fertilizer N inputs in perennial bioenergy grass systems grown on a marginally productive site in eastern Nebraska, with very high emissions occurring when fertilizer was applied in excess of perennial grass demand [15].
In the current ICL study, however, the same N fertilizer rate was used in all three perennial grass systems (56 kg N ha−1 year−1), suggesting that the high N2O emissions from Newell pasture may be related to site-specific soil differences. The location of the Newell pasture on the far north end of the study site is slightly higher in elevation, with somewhat better drainage. These conditions may have been more conducive to incomplete denitrification (and therefore greater release of N2O) compared to the more poorly drained Liberty and Shawnee pastures. While the effect of soil spatial variability on N2O emissions is beyond the scope of this study, we note that an electro-magnetic induction survey completed at this site (data not shown) also indicated that soil properties in the Newell pasture differed from those in the other grass pastures.

4.2.5. Effects of Perennial Grass Grazing Practices on Soil N2O

Grazing management of perennial grasses had limited effects on total GS N2O emissions in this experimental ICL system. Grazing practices affected N2O emissions in only one of three years of the study (2018), and only in the two perennial grasses that were selected for forage quality (Newell, Shawnee). In both pastures, GS N2O emissions increased with cattle grazing. While we found no consistent differences in flash vs. conventional (i.e., continuous) grazing treatments, other studies have noted that decreasing the intensity of grazing (i.e., lower stocking rates, using multi-paddock/rotational/flash grazing vs. continuous grazing) can decrease system GHG emissions compared to more conventional continuous grazing practices [16,17,18,46,58].

4.2.6. Land-Use Effects on Soil N2O

Although the experimental design of each row-crop and perennial grass phases of this ICL study precluded comparisons using traditional statistical methods, using contrast statements allowed us to compare total GS N2O emissions between the significant treatments in each annual or perennial crop phases each year of the study. As reported in other studies [20,57,67], we found that total soil N2O emissions were higher in the row-crop phase compared to the perennial grass phase of this ICL system. These general land use differences were attributed to higher annual fertilizer N inputs in continuous corn (140 kg N ha−1 year−1) compared to the perennial grass pastures (56 kg N ha−1 year−1).
In the US Great Plains, recent producer trends indicate the potential for greater adoption of more diverse, environmentally sustainable production systems with opportunities to profitably reintegrate livestock into conventional row-crop production systems [2,3,12]. This trend, in part, reflects profit-driven decision making by producers, as the profitability of crop production has decreased while cattle markets have remained relatively steady in recent years [12,68]. Moreover, direct grazing of crop residues after grain harvest can reduce feed costs [3], decrease the need for fertilizer inputs [69], and enhance cash crop yield [70]. Regional producers in Colorado, Kansas, Nebraska, North Dakota, and South Dakota already report substantial corn acreage used for residue grazing by livestock, ranging from 18 to 56% [71,72]. While challenges exist for expanding corn residue utilization for livestock grazing, stover can provide a cost-efficient winter forage for beef cows and enhance the net return to both crop and livestock enterprises through integration [72].
Converting marginally productive lands from more input-intensive row-cropping to less intensive grass-based agriculture can increase farm profitability and environmental sustainability by integrating perennial vegetation [2,6,11]. In addition to livestock forage, conversion of marginally productive cropland to perennial grassland further diversifies end-user options, such as harvesting grass for bioenergy feedstock. Both modeling and empirical field studies note the GHG mitigation potential of annual crop-to-perennial grassland conversions [11,13,15,73]. This and other studies demonstrate that the use of perennial grasses can decrease direct GHG emissions compared to row-crops, suggesting that the GHG mitigation potential of ICL systems can be improved by utilizing perennial grasslands or even perennial grass-based cover crops [20].

5. Conclusions

In many areas of the US Great Plains, monoculture cropping and associated external dependencies on GHG-intensive practices are increasingly unsustainable (Kumar et al., 2019). As more producers explore options to diversify their farming enterprises by incorporating livestock, there is a growing need for critical information to fill the knowledge gaps on the environmental and economic impacts of perennial grass incorporation and grazing management of crop residues, cover crops, and perennial grasses. In this model ICL system study, we found that direct emissions of non-CO2 gases from soils were generally higher in continuous corn systems than perennial grasslands due to synthetic N fertilizer use. We also noted that winter triticale cover crop use had no effect on total soil GHG emissions regardless of stover management treatment. Removing corn stover by mechanical means (baling) decreased total soil GHG emissions, though grazing stover significantly increased emissions in only one year when stover grazing was evaluated. Finally, our results showed that although grazing perennial grasslands tended to increase GHG emissions in pastures selected for forage quality, incorporating perennial grasses into the overall ICL system will likely provide the most effective GHG mitigation outcomes, particularly on marginally productive lands where intensive row-crop production practices would exacerbate, not abate, soil GHG emissions. Future work includes continued evaluation of perennial grass species management, grazing management in both perennial grasses and crop residues, and the incorporation of enteric emissions for a full system-level GHG assessment.

Author Contributions

Conceptualization, V.L.J., M.R.S., R.B.M., D.D.R.; methodology, V.L.J., M.R.S., R.B.M., D.D.R.; formal analysis, E.C., V.L.J.; investigation, E.C., V.L.J., M.R.S., R.B.M., D.D.R.; resources, R.B.M., D.D.R.; data curation, E.C., V.L.J.; writing—original draft preparation, E.C., V.L.J., M.R.S., R.B.M., D.D.R.; writing—review and editing, E.C., V.L.J., M.R.S., R.B.M., D.D.R.; visualization, E.C., V.L.J.; supervision, R.B.M., D.D.R.; project administration, R.B.M., D.D.R.; funding acquisition, R.B.M., D.D.R. All authors have read and agreed to the published version of the manuscript.

Funding

This research was funded by the United States Department of Agriculture-NIFA as a Coordinated Agricultural Project (CAP), Award no. 2016-68004-24768. Research was also supported by the United States Department of Agriculture-Agricultural Research Service (USDA-ARS).

Institutional Review Board Statement

All animal-related activities implemented in this study were approved by the Institutional Animal Care and Use Committee (IACUC #1785) at the University of Nebraska-Lincoln.

Informed Consent Statement

Not applicable.

Data Availability Statement

The data presented in this study are available on request from the corresponding authors.

Acknowledgments

The authors gratefully acknowledge the contributions of the many student workers, technicians, and support scientists who were instrumental in maintaining this experiment, collecting data, and providing analytical laboratory support. A special thanks to Ben Fann and David Walla, and to UNL’s Agronomy and Horticulture farm crew and Animal Science folks for their logistic support of farming and livestock operations. The USDA, University of Nebraska, and Nebraska Extension are equal opportunity employers and providers. These groups prohibit discrimination in their programs and activities on the basis of race, color, national origin, age, disability, and where applicable, sex, marital status. Additionally, family status, parental status, religious preference, sexual orientation, genetic information, political beliefs, reprisal, or because all or part of an individual’s income is derived from any public assistance program has no effect on program delivery. Mention of trade names or specific commercial products in this publication is solely for the purpose of providing specific information and neither endorses nor implies recommendation or endorsement by the USDA, University of Nebraska, or Nebraska Extension.

Conflicts of Interest

The authors declare no conflict of interest.

References

  1. Tracy, B.F.; Zhang, Y. Soil compaction, corn yield response, and soil nutrient pool dynamics within an integrated crop-livestock system in Illinois. Crop Sci. 2008, 48, 1211–1218. [Google Scholar] [CrossRef]
  2. Sulc, R.M.; Franzluebbers, A.J. Exploring integrated croplivestock systems in different ecoregions of the United States. Eur. J. Agron. 2014, 57, 21–30. [Google Scholar] [CrossRef]
  3. Kumar, S.; Sieverding, H.; Lai, L.; Thandiwe, N.; Wienhold, B.; Redfearn, D.; Archer, D.; Ussiri, D.; Faust, D.; Landblom, D.; et al. Facilitating crop-livestock reintegration in the Northern Great Plains. Agron. J. 2019, 111, 2141–2156. [Google Scholar] [CrossRef] [Green Version]
  4. Russelle, M.P.; Entz, M.H.; Franzluebbers, A.J. Reconsidering integrated crop-livestock systems in North America. Agron. J. 2007, 99, 325–334. [Google Scholar] [CrossRef] [Green Version]
  5. Sulc, R.M.; Tracy, B.F. Integrated crop-livestock systems in the U.S. Corn Belt. Agron. J. 2007, 99, 335–345. [Google Scholar] [CrossRef] [Green Version]
  6. Mitchell, R.B.; Schmer, M.R.; Anderson, W.F.; Jin, V.; Balkcom, K.S.; Kiniry, J.; Coffin, A.; White, P. Dedicated energy crops and crop residues for bioenergy feedstocks in the central and eastern USA. Bioenergy Res. 2016, 9, 384–398. [Google Scholar] [CrossRef] [Green Version]
  7. Jeswani, H.K.; Chilvers, A.; Azapagic, A. Environmental sustainability of biofuels: A review. Proc. R. Soc. A 2020, 476, 20200351. [Google Scholar] [CrossRef]
  8. Seguin, B.; Arrouays, D.; Balesdent, J.; Soussana, J.F.; Bondeau, A.; Smith, P.; Zaehle, S.; de Noblet, N.; Viovy, N. Moderating the impact of agriculture on climate. Agric. For. Meteorol. 2007, 142, 278–287. [Google Scholar] [CrossRef]
  9. Olsson, L.; Barbosa, H.; Bhadwal, S.; Cowie, A.; Delusca, K.; Flores-Renteria, D.; Hermans, K.; Jobbagy, E.; Kurz, W.; Li, E.; et al. Land degradation. In Climate Change and Land: An IPCC Special Report on Climate Change, Desertification, Land Degradation, Sustainable Land Management, Food Security, and Greenhouse Gas Fluxes in Terrestrial Ecosystems; IPCC Special Report; Shukla, P.R., Skea, J., Calvo Buendia, E., Masson-Delmotte, V., Pörtner, H.-O., Roberts, D.C., Zhai, P., Slade, R., Connors, S., van Diemen, R., et al., Eds.; IPCC: Geneva, Switzerland, 2019; 92p. [Google Scholar]
  10. Gosling, P.; van der Gast, C.; Bending, G.D. Converting highly productive arable cropland in Europe to grassland: A poor candidate for carbon sequestration. Sci. Rep. 2017, 7, 10493. [Google Scholar] [CrossRef] [Green Version]
  11. Wang, T.; Jin, H.; Kreuter, U.; Teague, R. Expanding grass-based agriculture on marginal land in the U.S. Great Plains: The role of management intensive grazing. Land Use Policy 2021, 104, 105155. [Google Scholar] [CrossRef]
  12. Smart, A.J.; Redfearn, D.; Mitchell, R.; Wang, T.; Zilverberg, C.; Bauman, P.J.; Derner, J.D.; Walker, J.; Wright, C. Forum: Integration of crop-livestock systems: An opportunity to protect grasslands from conversion to cropland in the US Great Plains. Rangel. Ecol. Manag. 2020, in press. [Google Scholar] [CrossRef]
  13. Davis, S.C.; Parton, W.J.; Del Grosso, S.J.; Keough, C.; Marx, E.; Adler, P.R.; Delucia, E.H. Impact of second-generation biofuel agriculture on greenhouse-gas emissions in the corn-growing regions of the US. Front. Ecol. Environ. 2012, 10, 69–74. [Google Scholar] [CrossRef] [Green Version]
  14. Abraha, M.; Gelfand, I.; Hamilton, S.K.; Chen, J.; Robertson, G.P. Legacy effects of land use on soil nitrous oxide emissions in annual crop and perennial grassland ecosystems. Ecol. Appl. 2018, 289, 1362–1369. [Google Scholar] [CrossRef] [Green Version]
  15. Jin, V.L.; Schmer, M.R.; Stewart, C.E.; Mitchell, R.B.; Williams, C.O.; Wienhold, B.J.; Varvel, G.E.; Follett, R.F.; Kimble, J.; Vogel, K.P. Management controls the net greenhouse gas outcomes of growing bioenergy feedstocks on marginally productive croplands. Sci. Adv. 2019, 5, eaav9318. [Google Scholar] [CrossRef] [Green Version]
  16. Liebig, M.A.; Gross, J.R.; Kronberg, S.L.; Phillips, R.L.; Hanson, J.D. Grazing management contributions to net global warming potential: A long-term evaluation in the Northern Great Plains. J. Environ. Qual. 2010, 39, 799–809. [Google Scholar] [CrossRef] [PubMed]
  17. Wang, T.; Teague, W.R.; Park, S.C.; Bevers, S. GHG mitigation potential of different grazing strategies in the United States southern Great Plains. Sustainability 2015, 7, 13500–13521. [Google Scholar] [CrossRef] [Green Version]
  18. Franzluebbers, A.J. Cattle grazing effects on the environment: Greenhouse gas emissions and carbon footprint. In Management Strategies for Sustainable Cattle Production in Southern Pastures; Rouquette, M., Aiken, G.E., Eds.; Academic Press: San Diego, CA, USA, 2020; pp. 11–34. [Google Scholar] [CrossRef]
  19. Franzluebbers, A.J.; Sawchik, J.; Taboada, M.A. Agronomic and environmental impacts of pasture-crop rotations in temperate North and South America. Agric. Ecosys. Environ. 2014, 190, 18–26. [Google Scholar] [CrossRef]
  20. Liebig, M.A.; Faust, D.R.; Archer, D.W.; Kronberg, S.L.; Hendrickson, J.R.; Aukema, K.D. Grazing effects on nitrous oxide flux in an integrated crop-livestock system. Agric. Ecosys. Environ. 2020, 304, 107146. [Google Scholar] [CrossRef]
  21. Chen, H.; Li, X.; Hu, F.; Shi, W. Soil nitrous oxide emissions following crop residue addition: A meta-analysis. Global Chang. Biol. 2013, 10, 2956–2964. [Google Scholar] [CrossRef]
  22. Jin, V.L.; Baker, J.M.; Johnson, J.M.J.; Karlen, D.L.; Lehman, R.M.; Osborne, S.L.; Sauer, T.J.; Stott, D.E.; Varvel, G.E.; Venterea, R.T.; et al. Soil greenhouse gas emissions in response to corn stover removal and tillage management across the US Corn Belt. Bioenergy Res. 2014, 7, 517–527. [Google Scholar] [CrossRef] [Green Version]
  23. Rakkar, M.; Blanco-Canqui, H.; Rasby, R.J.; Ulmer, K.; Cox-O’Neill, J.; Drewnoski, M.E.; Drijber, R.A.; Jenkins, K.; MacDonald, J.C. Grazing crop residues has less impact in the short-term on soil properties than baling in the central Great Plains. Agron. J. 2018, 111, 109–121. [Google Scholar] [CrossRef]
  24. Vogel, K.P.; Mitchell, R.B.; Waldron, B.L.; Haferkamp, M.R.; Berdahl, J.D.; Baltensperger, D.D.; Erickson, G.; Klopfenstein, T.J. Registration of ‘Newell’ smooth bromegrass. J. Plant Regist. 2015, 9, 35–40. [Google Scholar] [CrossRef] [Green Version]
  25. Vogel, K.P.; Mitchell, R.B.; Casler, M.D.; Sarath, G. Registration of ‘Liberty’ switchgrass. J. Plant Regist. 2014, 8, 242–247. [Google Scholar] [CrossRef] [Green Version]
  26. Vogel, K.P.; Hopkins, A.A.; Moore, K.J.; Johnsond, K.D.; Carlson, I.T. Registration of ‘Shawnee’ switchgrass. Crop Sci. 1996, 36, 1713. [Google Scholar] [CrossRef] [Green Version]
  27. Soil Survey Staff, Natural Resources Conservation Service, United States Department of Agriculture. Web Soil Survey. Available online: http://websoilsurvey.sc.egov.usda.gov/ (accessed on 7 January 2017).
  28. National Oceanic and Atmospheric Administration/National Climatic Data Center (NOAA/NCDC). Daily/Monthly Normals (1981–2010). Station Mead 6S (ID USC00255362). Available online: https://www.ncdc.noaa.gov/cdo-web/datatools/normals (accessed on 1 December 2019).
  29. Mitchell, R.B.; Schmer, M.R. Switchgrass harvest and storage. In Switchgrass, a Valuable Biomass Crop for Energy; Monti, A., Ed.; Springer: London, UK, 2012; pp. 113–127. [Google Scholar] [CrossRef] [Green Version]
  30. Blake, G.R.; Hartge, K.H. Bulk density. In Methods of Soil Analysis, Part I Physical and Mineralogical Methods, 2nd ed.; Klute, A., Ed.; ASA-SSSA: Madison, WI, USA, 1986; pp. 363–375. [Google Scholar]
  31. Nelson, D.W.; Sommers, L.E. Total carbon, organic carbon, and organic matter. In Methods of Soil Analysis Part 3: Chemical Methods; Sparks, D.L., Page, A.L., Helmke, P.A., Loeppert, R.H., Soluanpour, P.N., Tabatabai, M.A., Johnston, C.T., Sumner, M.E., Eds.; Soil Science Society of America, Inc.: Madison, WI, USA; American Society of Agronomy, Inc.: Madison, WI, USA, 1996; pp. 961–1010. [Google Scholar] [CrossRef]
  32. Hutchinson, G.L.; Mosier, A.R. Improved soil cover method for field measurement of nitrous oxide fluxes. Soil Sci. Soc. Am. J. 1981, 45, 311–316. [Google Scholar] [CrossRef]
  33. Parkin, T.B.; Venterea, R.T. Chamber-based trace gas flux measurements. In Sampling Protocols; Follett, R.F., Ed.; pp. 3-1–3-39. Available online: http://www.ars.usda.gov/research/GRACEnetChamberBasedTraceGasFluxMeasurements (accessed on 1 February 2011).
  34. Jin, V.L.; Schmer, M.R.; Stewart, C.E.; Sindelar, A.J.; Varvel, G.E.; Wienhold, B.J. Long-term no-till and stover retention each decrease the global warming potential of irrigated continuous corn. Global Chang. Biol. 2017, 23, 2848–2862. [Google Scholar] [CrossRef] [Green Version]
  35. Reicosky, D.C.; Lindstrom, M.J.; Schumacher, T.E.; Lobb, D.E.; Malo, D.D. Tillage-induced CO2 loss across an eroded landscape. Soil Till. Res. 2005, 81, 183–194. [Google Scholar] [CrossRef]
  36. Wagner, S.W.; Reicosky, D.C.; Alessi, S.R. Regression models for calculating gas fluxes measured with a closed chamber. Agronomy 1997, 89, 279–284. [Google Scholar] [CrossRef]
  37. Venterea, R.T.; Maharjan, B.; Dolan, M.S. Fertilizer source and tillage effects on yield-scaled nitrous oxide emissions in a corn cropping system. J. Environ. Qual. 2011, 40, 1521–1531. [Google Scholar] [CrossRef] [Green Version]
  38. Venterea, R.T. Simplified method for quantifying theoretical underestimation of chamber-based trace gas fluxes. J. Environ. Qual. 2010, 39, 126–135. [Google Scholar] [CrossRef] [Green Version]
  39. Parkin, T.; Venterea, R.T.; Hargreaves, S.K. Calculating the detection limits of chamber-based soil greenhouse gas flux measurements. J. Environ. Qual. 2012, 41, 705–715. [Google Scholar] [CrossRef] [Green Version]
  40. SAS Institute. The SAS System for Windows; Version 9.3; SAS Institute: Cary, NC, USA, 2014. [Google Scholar]
  41. Cavigelli, M.A.; Parkin, T. Cropland management contributions to greenhouse gas flux. In Managing Agricultural Greenhouse Gases: Coordinated Agricultural Research through GRACEnet to Address Our Changing Climate; Liebig, M., Franzluebbers, A., Follett, R.F., Eds.; Academic Press: Waltham, MA, USA, 2012; pp. 129–165. [Google Scholar] [CrossRef]
  42. Parkin, T.B. Effect of sampling frequency on estimates of cumulative nitrous oxide emissions. J. Environ. Qual. 2008, 37, 1390–1395. [Google Scholar] [CrossRef] [Green Version]
  43. Charteris, A.F.; Chadwick, D.R.; Thorman, R.E.; Vallejo, A.; de Klein, C.A.M.; Rochette, P.; Cardenas, L.M. Global Research Alliance N2O chamber methodology guidelines: Recommendations for deployment and accounting for sources of variability. J. Environ. Qual. 2020, 49, 1092–1109. [Google Scholar] [CrossRef]
  44. Bronson, K.F.; Mosier, A.R. Suppression of methane oxidation in aerobic soil by nitrogen fertilizers, nitrification inhibitors, and urease inhibitors. Biol. Fertil. Soils 1994, 17, 263–268. [Google Scholar] [CrossRef]
  45. Mosier, A.R.; Halvorson, A.D.; Reule, C.A.; Liu, X.J. Net global warming potential and greenhouse gas intensity in irrigated cropping systems in northeastern Colorado. J. Environ. Qual. 2006, 35, 1584–1598. [Google Scholar] [CrossRef] [Green Version]
  46. Gamble, A.V.; Howe, J.A.; Balkcom, K.B.; Wood, C.W.; DiLorenzo, N.; Watts, D.B.; van Santen, E. Soil organic carbon storage and greenhouse gas emissions in a grazed perennial forage-crop rotation system. Agrosyst. Geosci. Environ. 2019, 2, 1–9. [Google Scholar] [CrossRef] [Green Version]
  47. Allard, V.; Soussana, J.-F.; Falcimagne, R.; Berbiger, P.; Bonnefond, J.M.; Ceschia, E.; D’hour, P.; Hénault, C.; Laville, P.; Martin, C.; et al. The role of grazing management for the net biome productivity and greenhouse gas budget (CO2, N2O and CH4) of semi-natural grassland. Agric. Ecosyst. Environ. 2007, 121, 47–58. [Google Scholar] [CrossRef]
  48. Wang, X.; Huang, D.; Zhang, Y.; Chen, W.; Wang, C.; Yang, X.; Luo, W. Dynamic changes of CH4 and CO2 emission from grazing sheep urine and dung patches in typical steppe. Atmos. Environ. 2013, 79, 576–581. [Google Scholar] [CrossRef]
  49. Singh, N.; Abagandura, G.O.; Kumar, S. Short-term grazing of cover crops and maize residue impacts on soil greenhouse gas fluxes in two Mollisols. J. Environ. Qual. 2019, 49, 628–639. [Google Scholar] [CrossRef] [PubMed] [Green Version]
  50. Johnson, K.A.; Johnson, D.E. Methane emissions from cattle. J. Anim. Sci. 1995, 73, 2483–2492. [Google Scholar] [CrossRef] [PubMed]
  51. Wolf, J.; Asrar, G.R.; West, T.O. Revised methane emissions factors and spatially distributed annual carbon fluxes for global livestock. Carbon Balance Manag. 2017, 12, 16. [Google Scholar] [CrossRef] [Green Version]
  52. Gerber, P.J.; Hristov, A.N.; Henderson, B.; Makkar, H.; Oh, J.; Lee, C.; Meinen, R.; Montes, F.; Ott, T.; Firkins, J.; et al. Technical options for the mitigation of direct methane and nitrous oxide emissions from livestock: A review. Animal 2013, 7, 220–234. [Google Scholar] [CrossRef] [PubMed] [Green Version]
  53. Opio, C.; Gerber, P.; Mottet, A.; Falcucci, A.; Tempio, G.; MacLeod, M.; Vellinga, T.; Henderson, B.; Steinfeld, H. Greenhouse Gas Emissions from Ruminant Supply Chains—A Global Life Cycle Assessment; Food and Agriculture Organization of the United Nations (FAO): Rome, Italy, 2013. [Google Scholar]
  54. Conrad, R. Soil microorganisms as controllers of atmospheric trace gases (H2, CO, CH4, OCS, N2O and NO). Microbiol. Rev. 1996, 60, 609–640. [Google Scholar] [CrossRef] [PubMed]
  55. Lehman, R.M.; Osborne, S.L. Soil greenhouse gas emissions and carbon dynamics of a no-till, corn-based cellulosic ethanol production system. Bioenergy Res. 2016, 9, 1101–1108. [Google Scholar] [CrossRef]
  56. Wegner, B.R.; Chalise, K.P.; Singh, S.; Lai, L.; Abagandura, G.O.; Kumar, S.; Osborne, S.L.; Lehman, R.M.; Jagadamma, S. Response of soil surface greenhouse gas fluxes to crop residue removal and cover crops under a corn-soybean rotation. J. Environ. Qual. 2018, 47, 1146–1154. [Google Scholar] [CrossRef] [PubMed]
  57. Abagandura, G.O.; Şentürklü, S.; Singh, N.; Kumar, S.; Landblom, D.G.; Ringwall, K. Impacts of crop rotational diversity and grazing under integrated crop-livestock system on soil surface greenhouse gas fluxes. PLoS ONE 2019, 14, e0217069. [Google Scholar] [CrossRef] [Green Version]
  58. Dowhower, S.L.; Teague, W.R.; Casey, K.D.; Daniel, R. Soil greenhouse gas emissions as impacted by soil moisture and temperature under continuous and holistic planned grazing in native tallgrass prairie. Agric. Ecosyst. Environ. 2020, 287, 106647. [Google Scholar] [CrossRef]
  59. Piva, J.T.; Dieckow, J.; Bayer, C.; Zanatta, J.A.; de Moraes, A.; Tomazi, M.; Pauletti, V.; Barth, G.; de Cassia Piccolo, M. Soil gaseous N2O and CH4 emissions and carbon pool due to integrated crop-livestock in a subtropical Ferralsol. Agric. Ecosys. Environ. 2014, 190, 87–93. [Google Scholar] [CrossRef]
  60. Basche, A.D.; Miguez, F.E.; Kaspar, T.C.; Castellano, M.J. Do cover crops increase or decrease nitrous oxide emissions? A meta-analysis. J. Soil Water Conserv. 2014, 69, 471–482. [Google Scholar] [CrossRef] [Green Version]
  61. Mitchell, D.C.; Castellano, M.J.; Sawner, J.E.; Pantoja, J. Cover crop effects on nitrous oxide emissions: Role of mineralizable carbon. Soil Sci. Soc. Am. J. 2013, 77, 1765–1773. [Google Scholar] [CrossRef] [Green Version]
  62. Beare, M.H.; Gregorich, E.G.; St-Georges, P. Compaction effects on CO2 and N2O production during drying and rewetting of soil. Soil Biol. Biochem. 2009, 41, 611–621. [Google Scholar] [CrossRef]
  63. Harrison-Kirk, T.; Thomas, S.M.; Clough, T.J.; Beare, M.H.; vander Weerden, T.J.; Meenken, E.D. Compaction influences N2O and N2 emissions from 15N-labeled synthetic urine in wet soils during successive saturation/drainage cycles. Soil Biol. Biochem. 2015, 88, 178–188. [Google Scholar] [CrossRef]
  64. Cai, Y.; Chang, S.X.; Cheng, Y. Greenhouse gas emissions from excreta patches of grazing animals and their mitigation strategies. Earth Sci. Rev. 2017, 171, 44–57. [Google Scholar] [CrossRef]
  65. Snell, L.K.; Guretzky, J.A.; Jin, V.L.; Drijber, R.A.; Mamo, M. Nitrous oxide emissions and herbage accumulation in smooth bromegrass pastures with nitrogen fertilizer and ruminant urine application. Nutr. Cycl. Agroecosyst. 2014, 98, 223–234. [Google Scholar] [CrossRef]
  66. Liebig, M.A.; Gross, J.R.; Kronberg, S.L.; Hanson, J.D.; Frank, A.B.; Phillips, R.L. Soil response to long-term grazing in the Northern Great Plains of North America. Agric. Ecosys. Environ. 2006, 115, 270–276. [Google Scholar] [CrossRef]
  67. Bavin, T.K.; Griffis, T.J.; Baker, J.M.; Venterea, R.T. Impact of reduced tillage and cover cropping on the greenhouse gas budget of a maize/soybean rotation ecosystem. Agric. Ecosyst. Environ. 2009, 134, 234–242. [Google Scholar] [CrossRef]
  68. Wang, T.; Luri, M.; Janssen, L.; Hennessy, D.; Feng, H.; Wimberly, M.C.; Arora, G. Determinants of motives for land use decisions at the margins of the Corn Belt. Ecol. Econ. 2017, 134, 227–237. [Google Scholar] [CrossRef] [Green Version]
  69. Liebig, M.; Tanaka, D.; Kronberg, S.; Scholljegerdes, E.; Karn, J. Integrated crops and livestock in central North Dakota, USA: Agroecosystem management to buffer soil change. Renew. Agric. Food Syst. 2012, 27, 115–124. [Google Scholar] [CrossRef]
  70. Drewnoski, M.E.; MacDonald, J.C.; Erickson, G.E.; Hanford, K.J.; Klopfenstein, T.J. Long-term corn residue grazing improves subsequent soybean yields in a corn-soybean rotation. Crop Forage Turfgrass Manage. 2016, 2, 1–6. [Google Scholar] [CrossRef]
  71. Schmer, M.R.; Brown, R.M.; Jin, V.L.; Mitchell, R.B.; Redfearn, D.D. Corn residue use by livestock in the United States. Agric. Environ. Lett. 2017, 2, 160043. [Google Scholar] [CrossRef]
  72. Redfearn, D.; Parsons, J.; Drewnoski, M.; Schmer, M.; Mitchell, R.; MacDonald, J.; Farney, J.; Smart, A. Assessing the value of grazed corn residue for crop and cattle producers. Agric. Environ. Lett. 2019, 4, 180066. [Google Scholar] [CrossRef]
  73. Nocentini, A.; Monti, A. Comparing soil respiration and carbon pools of a maize-wheat rotation and switchgrass for predicting land-use change-driven SOC variations. Agric. Syst. 2019, 173, 209–217. [Google Scholar] [CrossRef]
Figure 1. Mean total soil CH4 fluxes for 2017 (a), 2018 (b), and 2019 (c) growing seasons (GS; 1 April–31 October) for Newell smooth bromegrass, Liberty switchgrass, and Shawnee switchgrass. Different lower-case letters within each grass type indicate grazing treatment differences (p ≤ 0.05). None = non-grazed, Flash = flash grazed, Conv = conventionally grazed. Symbols (†) indicate soil CH4 fluxes not significantly different from zero.
Agronomy 11 01416 g001
Figure 2. Total growing season (GS) soil N2O emissions for 2019 continuous corn (a), 2018 perennial grass (b), and 2019 perennial grass (c) (GS; April 1–October 31). Different lower-case letters in panels (a,c) denote significant stover removal method or grass type differences, respectively (p ≤ 0.05). In (b), different lower-case letters indicate significant grazing treatment differences within each grass type. None = non-grazed, Flash = flash grazed, Conv = conventionally grazed. Symbols (†) indicate soil N2O fluxes not significantly different from zero.
Agronomy 11 01416 g002
Table 1. Baseline soil properties. Field-level averages for surface soils (0–30 cm depth) at study establishment.
Perennial GrassRow-Crop
Soil PropertyUnitsNewellLibertyShawneeCorn
Bulk densityMg m−31.341.311.211.34
Electrical conductivitydS m−10.510.510.510.54
Soil pH (1:1 in water)-5.365.205.425.27
Total soil organic Cg kg−115.9016.1316.4717.25
Total nitrogeng kg−11.471.471.431.57
Total base cationscmolc kg−114.7015.7616.314.97
Cacmolc kg−110.4311.2711.8110.90
Mgcmolc kg−13.463.583.683.09
Kcmolc kg−10.740.800.710.89
Nacmolc kg−10.090.111.100.11
Publisher’s Note: MDPI stays neutral with regard to jurisdictional claims in published maps and institutional affiliations.

