Article

The Effect of N Fertilizer Application Timing on Wheat Yield on Chernozem Soil

by
Marko M. Kostić
1,*,
Aristotelis C. Tagarakis
2,
Nataša Ljubičić
3,
Dragana Blagojević
3,
Mirjana Radulović
3,
Bojana Ivošević
3 and
Dušan Rakić
4
1
Faculty of Agriculture, University of Novi Sad, 21000 Novi Sad, Serbia
2
Center for Research and Technology Hellas-CERTH, Institute for Bio-Economy and Agri-Technology-iBO, 6th km Charilaou-Thermi Rd, GR 57001 Thessaloniki, Greece
3
BioSense Institute, University of Novi Sad, 21000 Novi Sad, Serbia
4
Faculty of Technology, University of Novi Sad, 21000 Novi Sad, Serbia
*
Author to whom correspondence should be addressed.
Agronomy 2021, 11(7), 1413; https://doi.org/10.3390/agronomy11071413
Submission received: 19 June 2021 / Revised: 5 July 2021 / Accepted: 9 July 2021 / Published: 14 July 2021

Abstract

:
The challenges of the global food supply and environment conservation require ongoing scientific observations of soil-to-plant and plant-to-environment interactions with the aim of improving agriculture resource management. This study included observations of winter wheat yield and biomass of four varieties over three consecutive growing seasons and four site-year cases to assess the effects of nitrogen (N) fertilization rate and time of application on grain yield and biomass. For different wheat varieties, the full factorial design was performed, where factorial combinations of year, location, fall and spring N applications were laid out in a randomized complete block design. The N rate significantly influenced grain yield and biomass production efficiency. The time of N application had a highly significant effect on grain yield, biomass and NUE traits. The N rate of 120 kg ha−1 was recognized as a breakpoint over which the grain yield and biomass showed a downtrend. N application in the fall had a significantly higher impact on grain yield and biomass compared to spring N application. The major contribution of wheat variability production belongs to seasonal climate circumstances (<85%) and consequential intrinsic soil properties. The average difference of grain yield between varieties was 15.75%, and 12% of biomass, respectively.

1. Introduction

Cereals, and wheat specifically, are traditionally of the most important crops grown globally. This is reflected in the proportion of the total cultivated area occupied by these crops, in the total grain production and their participation in the world trade. The cultivated area shows fluctuations according to the market prices and the local agricultural policies. According to the food and agricultural organization of the United Nations (http://www.fao.org/faostat/en/#data, accessed on 15 May 2020), despite the yearly fluctuations in the area cultivated with wheat, the total amount of produced grain is constantly increasing. This is attributed to the increasing trends of yield potential as a result of the better crop management and improved genetic material, which gradually increased the yields acquired by the farmers on a global basis. On the other hand, the fluctuations in the quantity of wheat grain produced in Serbia followed the trends of arable land covered with wheat crops (FAOSTAT, 2020). This indicates that wheat productivity remained at similar levels during the last 13-year period and thus, there is scope for yield improvement of wheat in Serbia.
In Serbia, for the period 2017–2019, winter wheat production occupied around 17% of total arable land [1]. In the recent past, farmers preferred wheat due to its remedial effect on soil in the crop rotation cycle and positive contribution to pest control. Serbia is among the highest yielding wheat producers in the world (32nd out of 124 countries); however, in relation to European countries (rank 22/38), wheat yields in Serbia can be characterized as low [2].
General projections imply that wheat yield must increase at least by 50% [3] by 2050 with the existed or slightly reduced natural resources due to the expanding human population worldwide. Among all cereals, winter wheat can be characterized as one of the most nitrogen (N) demanding crops [4]. However, Serbia uses approximately 600 kt of N fertilizer annually, which is relatively low compared to other parts of Europe [5]. In Serbia, a uniform system it is still not established that regulates wheat trading on a farm-scale respecting grain protein content as a price leveling factor. Thus, farmers are strictly focused on reaching maximal grain yield.
Despite the established wheat quality market classes in developed countries, producers are also prone to grow high-yielding wheat varieties and, consequently, manage their resources in such a way to increase yield leading to lower protein content in the grain [6]. Traditionally, in agricultural production, nitrogen fertilizer is the most utilized due to its well-proven, instantaneous and visible effect on plant appearance. Nowadays, annual nitrogen fertilizer consumption has reached 170 million tons worldwide, a multifold increase from the annual consumption in the early 1960s [7,8].
Increased N fertilizer application does not always imply an increase of grain yield; on the contrary, even a decrease in crop yields is seen in poorly managed production systems. Nitrogen application at the right amount contributes to higher yields by increasing the number of spikes and the number of kernels per spike [9,10]. Improper nitrogen management is environmentally hazardous and has an indirect negative impact on human and animal health. As [11] showed, about 67% of total applied N fertilizer in wheat production could be lost because of natural processes like denitrification, leaching, volatilization (NH3), and greenhouse gas (N2O, NO or NO2) emissions.
One of the methods for estimating nitrogen fertilizer utilization is defined by [12] as the ratio of the gained yield and the amount of applied nitrogen fertilizer. Nitrogen utilization efficiency (NUE) is defined as the amount of grain produced per unit of N uptake at maturity [13]. Several methods improve the efficiency of nitrogen fertilizers, and they are based on the knowledge of the yield potential, an adaptation of the N rate to soil organic matter content, and mineralization potential [14] as environmental-related factors. The selection of fertilizer, the time of application and the method and the amount of fertilizer application are important aspects for minimizing nitrogen losses from the soil [15]. The short-time dynamics of nitrogen content in the soil limits the possibility of assessing the site-specific optimal fertilization rate [16] and time-specific roles for the adequate application of achieving the desired yield levels. Nitrogen stocks in the soil come largely from organic matter that bacteria transforms into an accessible form for plants to uptake. It is a part of soil material, and many essential compounds for plant life are contained therein, such as nucleic acids, proteins, enzymes, chlorophyll and others. The work of [17] points out that the problems of mineral nutrition of wheat are of regional character, since the efficiency of applied quantities and nutrient ratios depends on numerous soil properties, specific climatic conditions, as well as cultivar specifics in terms of adoption to the environmental conditions, and uptake, transport and accumulation of minerals. The relationship between yield and NUE and factors influencing this interaction are still not completely investigated [18].
Considering the rate of rapid climate change in the past decade, whose major implications directly affect open-sky agriculture, studies must be continued [19] regionally towards the mitigation of its negative impact, by efficient and less environmentally hazardous management of any available resource. Nitrogen fertilizers are of the most utilized artificially produced chemical compounds in agriculture worldwide due to the importance of nitrogen in crop growth. Spatial and temporal dynamics of available N in the soil is strongly related to applied agronomic procedure is the appropriate assessment of NUE and its underlying components using methods that allow for fair comparisons across different crops, varieties, experimental setups and agroecological environments [20]. In general, it is known that early N application may result in lower grain yield in comparison to mid-season sensor-based fertilization [11]. The contribution of early, or mid-season N application and their combination, to grain yield and biomass of winter wheat, has not been adequately determined for chernozem soils.
Vojvodina is a traditionally agricultural region located in Northern Serbia. It is the southern part of the Pannonian region characterized by mainly flat landscapes and fertile soils. There are numerous soil types in the Vojvodina region, but chernozems predominate approximately 43% of the total arable land [21]. Chernozem soils are very fertile with a high content of organic matter [22].
The common agronomical practice in wheat production that most farmers follow is performing the split application of the N fertilizer in two or three doses. Starting with the basic fertilization, synthetic fertilizer in granular form is usually incorporated in the soil shortly before or at sowing (October 5–25th). A second fertilization is applied in spring (late February–early March) as the top-dress application of urea (46%) in granular form. Some farmers follow a second, top-dress application at the end of stem elongation (mid-April) as the optional fine-tuning correction of N (usually applying ammonium-nitrate). The amount of N is usually selected based on a regional agronomical recommendation without recognizing the annual variability in yield potential and crop response to N [23]. Some farmers conduct early spring soil analysis to determine the residual nitrate in the soil and the potential for soil mineralization which is the basis for the N application recipe.
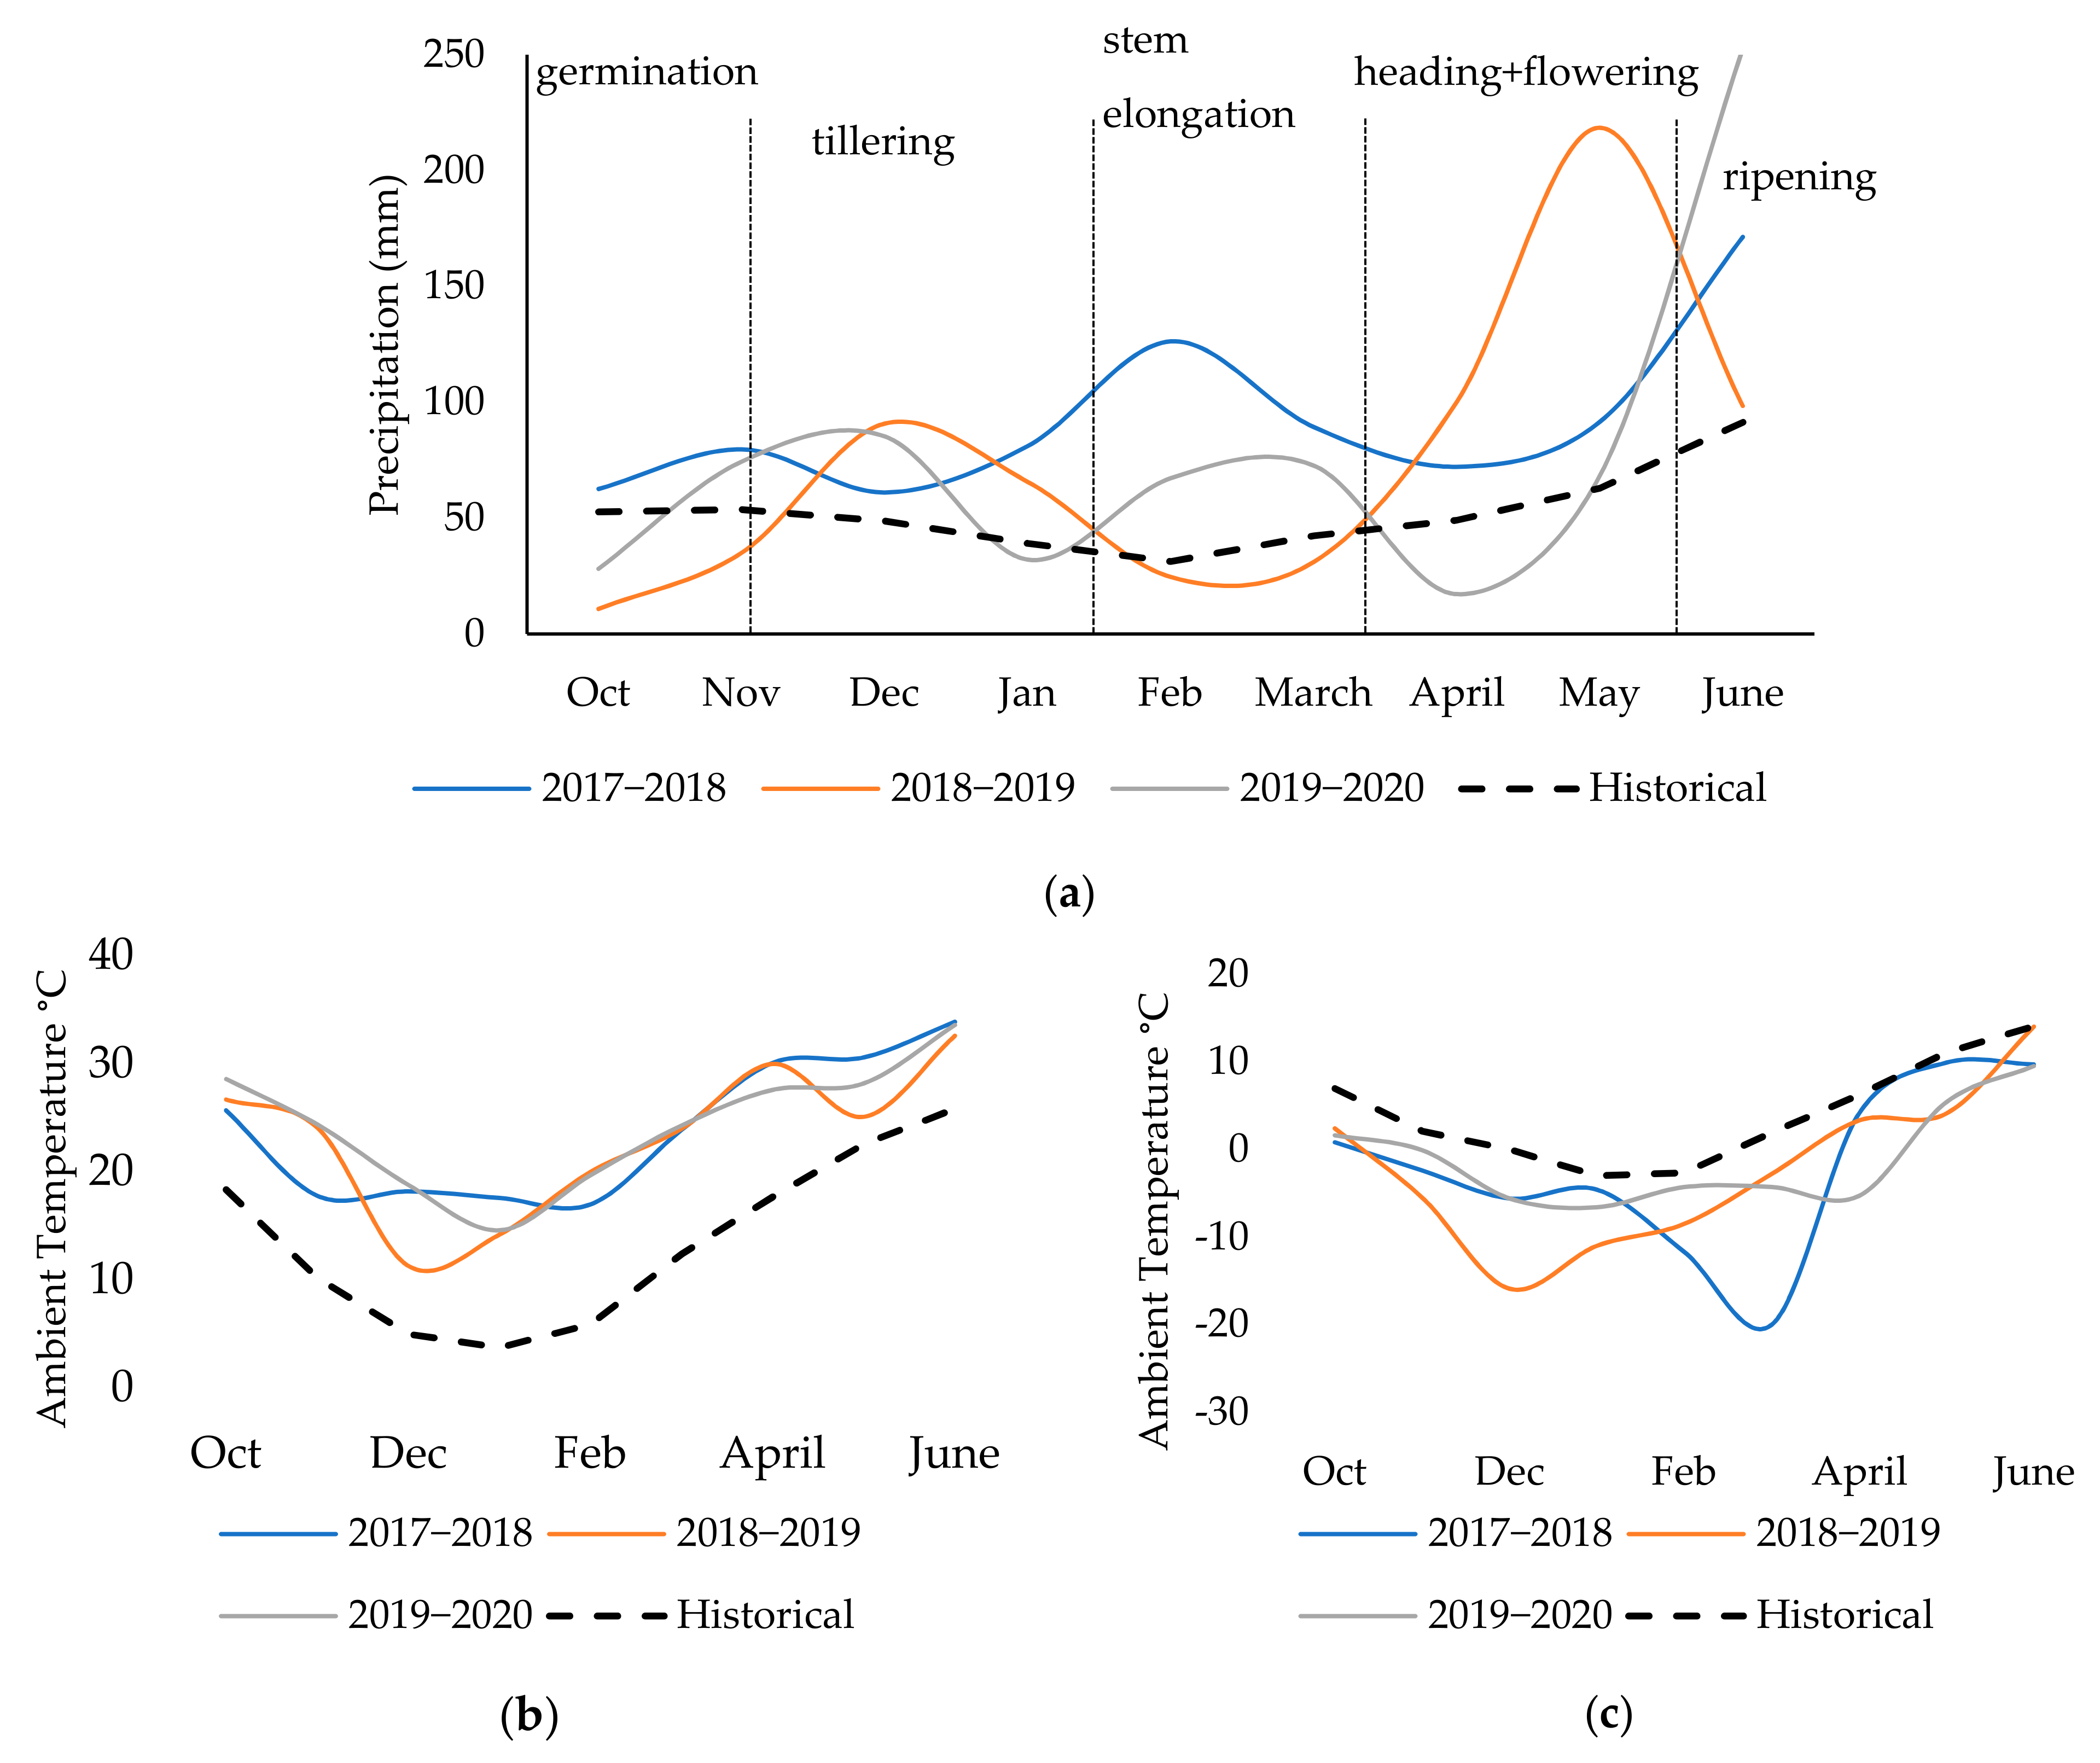
The main hypothesis of this study was that specific environmental conditions in Vojvodina region in combination with different genotypes and N timing application in three consecutive growing seasons affect the efficiency of the applied N fertilizer in winter wheat production. Thus, the study aimed to find optimal fertilization scheme that better fits the soil and climatic conditions in Vojvodina region. The experiment was set up accordingly to study which basic N application rate is more profitable, whether a second top-dress application at spring increases profitability, and at which rate, under variable weather conditions. This will be the basis for the development of automated N application systems adjusted to chernozem soils and to the special conditions of the Pannonian regions.

2. Materials and Methods

The study was conducted over a three-year period (2018–2020), at four commercial fields at different geographical locations with similar climatic conditions and different soil properties located in Ravno Selo and Bajmok, in central-west and northern Vojvodina, respectively. Therefore, the overall experiment was conducted at four site-years as summarized in Table 1.
Two high-yielding cultivars of winter wheat (Triticum aestivum L.), widely grown in Serbia and other neighboring countries, were included in the study, namely: “NS40S” and “Ingenio”. The cultivar NS40S was released by the Institute of Field and Vegetable Crops, based in Novi Sad, in Serbia, while CCB Ingenio is an imported variety from Syngenta’s catalog (Syngenta, France). The cultivars were selected based on their variability in plant height, and grain yield potential and other characteristics; (a) NS40S is recommended as medium early, resistant to lodging, tolerant to drought, resistant to powdery mildew and leaf rust; (b) Ingenio is also medium early and resistant to lodging, resistant to Fusarium wilt and well adapted to the Serbian growing conditions. According to data from the Institute of Field and Vegetable Crops in Novi Sad, on average, for NS40S variety, based on multiyearyear average, grain yield increases from 4–6 t ha−1 in unfavorable conditions and more than 10 t ha−1 in favorable conditions. Regarding the Ingenio variety, during the introduction process, the average yield was 8.8 t ha−1, in some localities, the yield was above 10 t ha−1 in 2009, while in 2010 the average yield reached 7.7 t ha−1, and in some localities, it was exceeded 9 t ha−1 in production conditions.
The practices for soil preparation included conventional tillage (CT) with a moldboard plow at 20 cm depth, followed by a final soil consolidation using a combined cultivator to ensure uniform soil condition over the plots. As [24] recognized, a lower intensity of soil tillage increased small-scale variation in nitrogen use efficiency. Sowing took place in the fall (October) using a 25-row wheat-seeder equipped with a single-disc furrow opener at 0.12 m distance between rows, which was calibrated to perform seeding rate of 500–550 seeds m−2. The typical pest control approach was conducted in the trials, including early insecticide application after plant emergence (Alfa–cipermetrin 100 g L−1), followed by herbicide application in early spring (metsulfuron metil 600 g kg−1) simultaneously with the first fungicide treatment (Propikonazol 250 g L−1), while at the beginning of flowering, the final pesticide application was performed for ear protection (Tebukonazol 133 g L−1 + Prohloraz 267 g L−1).
Based on the common farmers’ practice in the region, approximately 50 kg of N ha−1 are applied as basic fertilization at sowing and up to 150 kg of N ha−1 are top-dressed in spring. Some farmers also apply a second top-dress application depending on the weather conditions and plant nitrogen supply assessments, relying on farmers’ personal perception. The N rates applied in the study were arranged to cover from no application up to a rate two times higher than the commonly applied rate for both basic and top-dress application.
At site-years 1, 2 and 4, the plots were 2-m wide and 8-m long. Using small-sized plots helped minimize the within-plot variability. The basic N fertilizer application was hand-applied on the soil surface immediately after sowing, using pre-weighed labelled bags with the corresponding fertilizer quantity for each plot. During the spring top-dress application, the plots were split into four subplots sized 2 m by 2 m.
At site-year 3, the plots were larger, 3-m wide and 12 m-long, in order to accommodate the mechanical application of basic fertilizer. Shortly after sowing, a 3 m wide conventional wheat seeder (Majevica Ltd., Bačka Palanka, Serbia) was used, after properly calibrated, incorporating the corresponding rates of ammonium nitrate (urea 46% N) in granular form, in each plot. The same procedure was repeated for the second application in spring utilizing ammonium nitrate (34% N).
Soil sampling took place right after setting up the experimental plots and before fertilizer application to define the initial soil nutritional levels. A composite soil sample per field was taken, consisted of four subsamples, one from each plot of the corresponding treatment. Dichromate wet oxidation method proposed by [25] was performed to determine soil humus content. Grain N concentration was multiplied by grain yield to obtain grain N uptake (kg ha−1). Nitrogen use efficiency was computed using the difference method (http://www.nue.okstate.edu/N_Fertilizers/NUE_definition.html, accessed on 16 May 2020) as defined in the following equation:
NUE   % = Grain   N   from   ( Fertilized   plots Unfertilized   plots ) N   applied × 100 .
Harvest took place at the end of June or the beginning of July (Table 2), depending on weather conditions when the plants reached full maturity and the grain moisture content was approximately 14%. The crop was hand-harvested, cutting the above surface biomass, including the grain from 1-m2 areas located in the center of each subplot. The harvested samples were weighed in the field and placed in pre-labelled bags for further processing. The grain was manually threshed, and grain weight and the above-ground biomass were measured.
In the fall, at site-years 1 and 2, a full factorial design was followed with 4 replications and 5 rates of nitrogen fertilizer application starting from 0-N (control) up to 180 kg of N ha−1 (0, 30, 60, 120, and 180 kg of N ha−1). At site-year 3, the identical number of replications was conducted even so with 4 rates of nitrogen fertilizer (Table 3). The experimental design at site-year 4 followed the previous year; however, the number of replications was reduced to three to make the experiment more manageable. With the changes of experiment design over time, we have strived to keep track of the experimental design used to obtain a given observation. Urea (46% N) was selected as the fertilizer to be applied in the fall since the local farmers widely adopt it as a good agricultural practice.
A spring top-dress application followed during the end of tillering and the beginning of stem elongation. The initial plots were split into four additional treatments of top-dress N starting with 0-N up to 150 kg of N ha−1 in increments of 50 kg of N ha−1 (Table 3). Ammonium nitrogen form of fertilizer (34% N) has been chosen for spring top-dressing because ammonium ions are less subject to loosening of nitrogen to the atmosphere even under dry conditions.
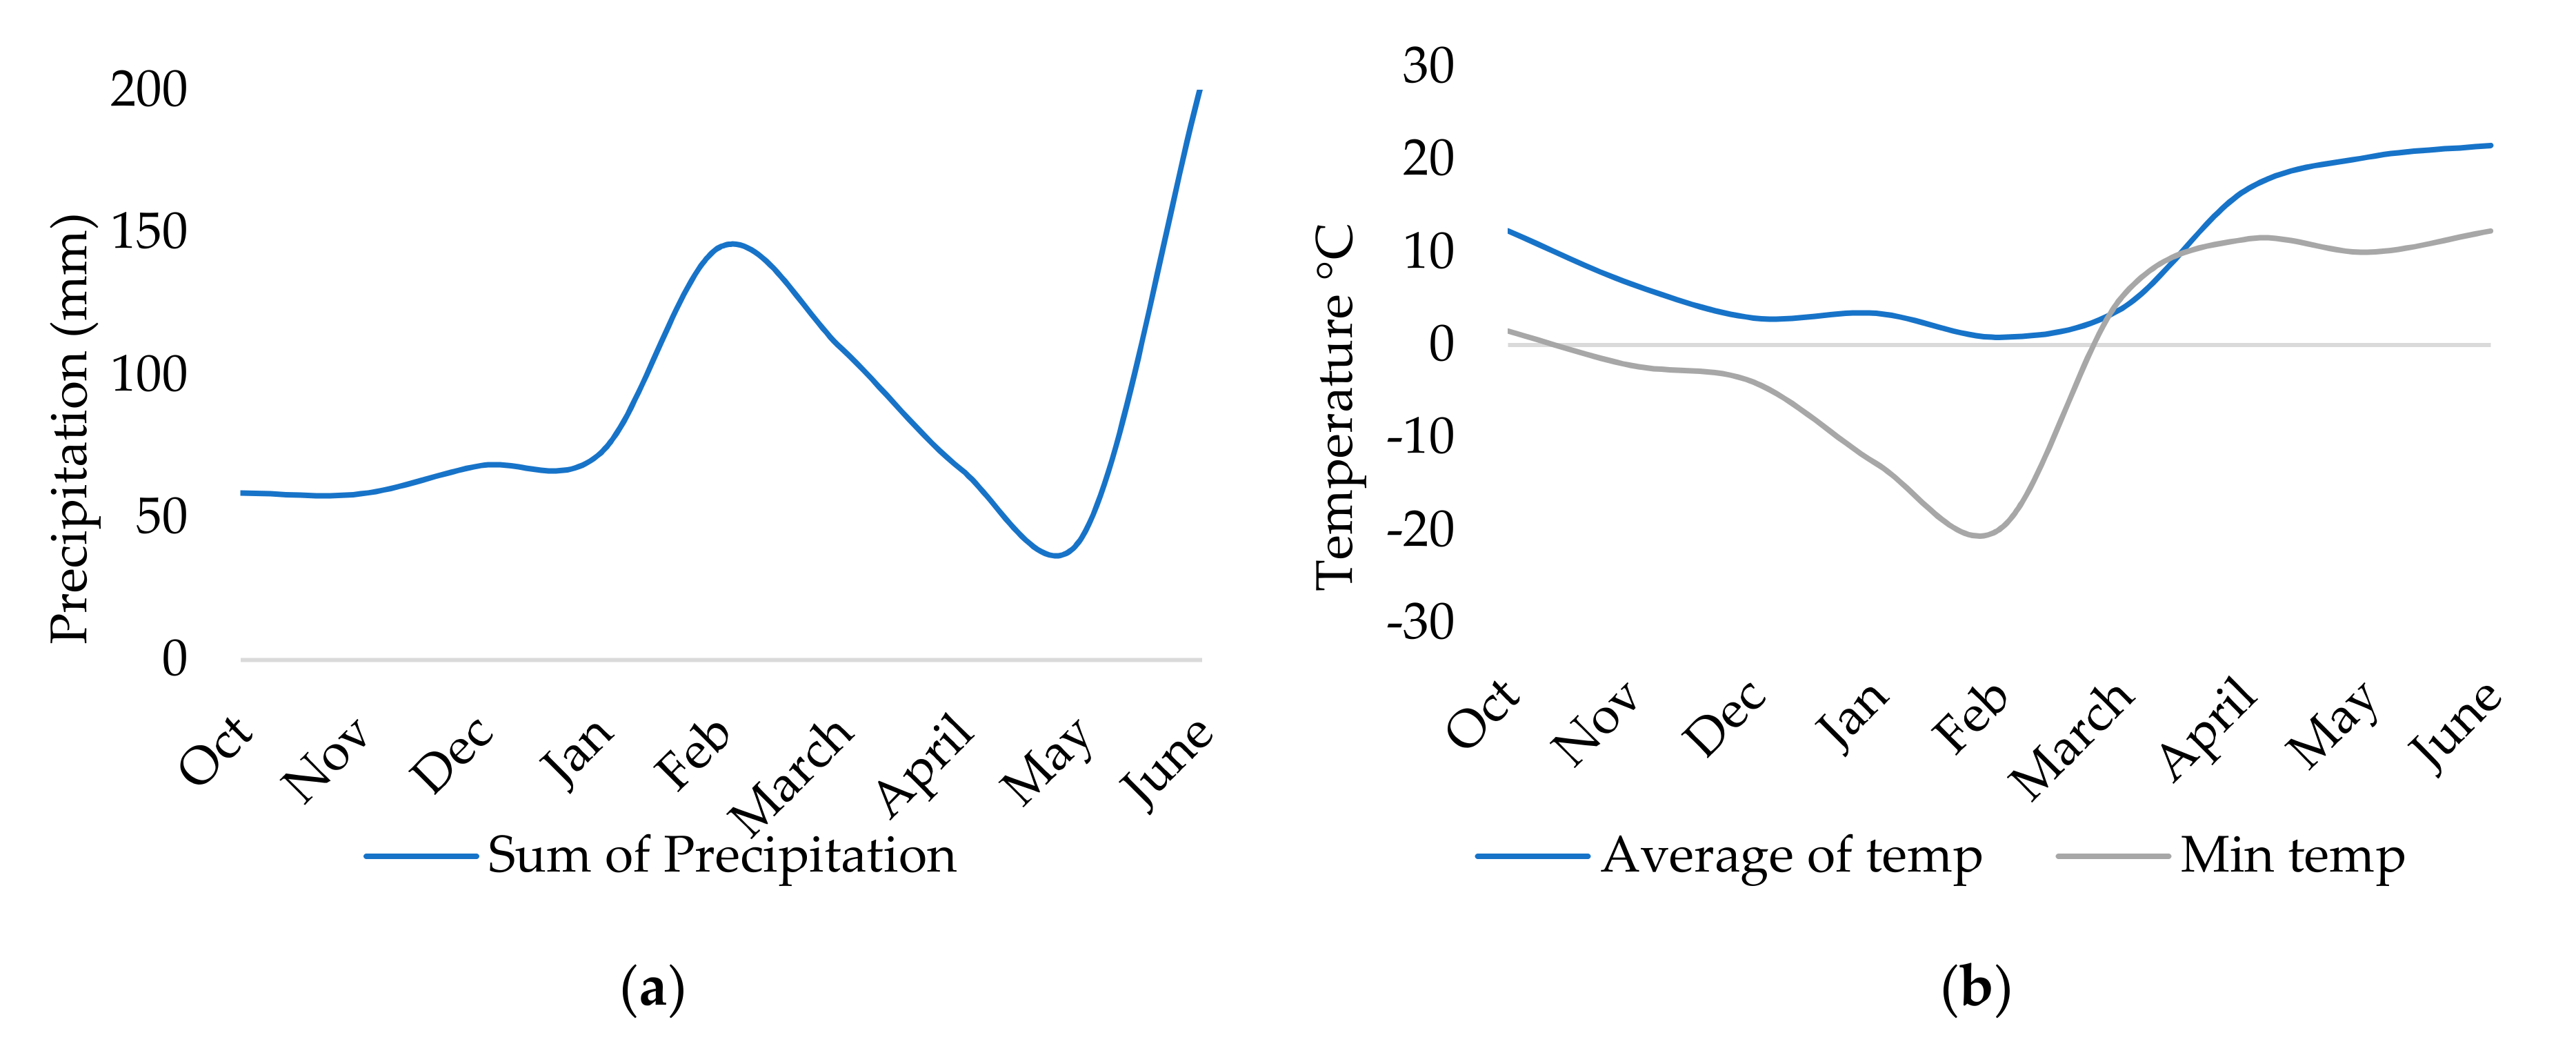
The climate and weather data for the three years of study were acquired from the National Oceanic and Atmospheric Administration (NOAA) and analyzed to explain the results and behavior of the crop response to N fertilizer applications.

2.1. Statistical Analysis on the Influence of N on Wheat Production

As an adequate approach for the analysis of variations in wheat yield, a design of experiments (DOE) methodology was used. Using analysis of variance (ANOVA), particular contributions of main factors and interactions in the total influence on responses was calculated proportionally to the sum of squares, i.e., to mean square errors (in the case when degrees of freedoms of observed effect differs), while statistically significant influences were confirmed by p-value (<0.05). In the research, the focus was on the determination of the influence of controlled factors on wheat yield and biomass. Full factorial design was used with a two-factor interaction (2FI) model [26]. The influence of factors on yield traits was analyzed using “Design-Expert” software (version 11, Stat-Ease, Inc., Minneapolis, MN). Besides the influence of fall and spring fertilizer treatment on yield and biomass, variability caused by location, variety and year were studied. It was expected that a comprehensive analysis would show a significant impact yearly. So, in order to obtain more precise and noticeable results of the influence of the remaining factors on yield and biomass firstly were performed, then an analysis during the particular years for separated varieties and multiyear study after that.
Nitrogen fertilization management and cultivar selection are the main factors deteriorating yield potential. The results from the nitrogen fertilization experiments performed in the framework this study, are thoroughly discussed in the following subsections.

2.2. Soil Analyses Results

Comparing the soil characteristics, all four site-years showed similar pH levels. On the other hand, the rest of the measured soil parameters, showed considerable variations among site-years, as shown in Table 4.

3. Results and Discussion

3.1. Weather and Climate Data from the Experimental Sites

Weather in Ravno Selo showed rather significant temporal variability during the three years of study (Figure 1) regarding site-years 1, 3, and 4. The beginning of the wheat growing season in the first year (October–November 2017), was characterized by a relatively sufficient water supply for plant germination. Oppositely, in 2018, a small amount of precipitation was recorded, which could justify poor germination and tillering of wheat plants. This could affect wheat production since a positive relationship was found between wheat plant density and yield [27]. According to the findings from previous studies in Vojvodina region [2], highly positive correlation between the yield and amount of rainfall during November was obtained. Weather conditions from sowing until February are crucial for vernalization and water accumulation in the soil profile. February to March in 2018 was characterized by significantly high precipitation indicating high water accumulation (Figure 1a). In addition, the first post-emerge application of nitrogen fertilizer was performed during this period, which aims to create sufficient nutrient supplies for the purpose of building the organic matter of the plants. The end of March is the beginning of stem elongation, and rapid growth occurs. Any water shortage at this stage leads to reduced yield potential. May was a rather wet month in 2019, showing increased risk for diseases, while late rainfalls during June occurred in 2020, which could jeopardize grain yield and postpone harvest operation. Precipitation in site-year 2 (Figure 2a) followed the pattern that occurred in site-year 1.
In terms of temperature, the average monthly values during the three growing seasons were higher as compared to the historical climate average (Figure 1b). Contrary to that, the minimum temperatures were lower than the historical climate data with extreme frosts occurring in March 2018 (at tillering stage) and December 2019 (at stem elongation stage) (Figure 1b,c). In 2020, the temperature regimes were more favorable but with a mild late frost occurring in April. In site-year 2, an extreme frost occurred in February 2018, recording the lowest temperatures among all site-years (Figure 2b).

3.2. Results from 2018 Study Sites

A comprehensive analysis of the impacts of selected variables (location, fall N application and spring N application) on grain yield in 2018 was conducted. In 2018, the experiment included two wheat cultivars (Ingenio and NS40S) and two locations (Ravno Selo and Bajmok; site-years 1 and 2, respectively). ANOVA results within a full factorial experimental design (Table 5) indicate a statistically significant influence of location on grain yield for tested varieties (p < 0.01). The field location showed a weaker but statistically significant contribution to the Ingenio yield (p = 0.0047). Fall N application highly impacted the grain yield of both wheat varieties (p < 0.01). Different responses of the grain yield to spring top-dressing of N fertilizer appeared between the two cultivars, showing a more significant contribution for Ingenio (p < 0.01) in relation to NS40S (p = 0.023).
ANOVA also revealed the considerable impact of location on biomass production (Table 6). Similar to the yield analysis results, the N application affected biomass production significantly (at the 0.0001 level) except for NS40S where the spring application was slightly less significant compared to the fall application (although the p-value was significant at the 0.05 level). The interaction of AB factors nominates location and fall N application as dominant factors for a build-up of wheat biomass in 2018. The interaction of location and spring N application was not statistically significant, contrary to the yield case.
Further in-depth analysis revealed the quantified contribution of each factor in relation to the measured output (Figure 3). The most important factor influencing biomass in both varieties (42 and 46% for Ingenio and NS40S, respectively) was the location. Further, Fall N fertilizer application showed significantly higher influence on biomass production (32% and 35% for Ingenio and NS40S, respectively) compared to the Spring N application (11% and 6% for Ingenio and NS40S, respectively). The contribution of AB and AC interactions were on a similar level as the spring N application. Concerning the results from the yield data analysis, this location had only 18% of total impact in yield of the Ingenio variety, whilst the grain yield data of NS40S was more impacted by field location (56%) as a variable.
The results indicate that even though the biomass production of the Ingenio variety was greatly affected by the location and the growing environmental conditions, yield was considerably less influenced. The explanation could be in context to the different soil conditions of trial locations, which caused the altered grain to total shoot dry matter ratio (or Harvest index–HI) of Ingenio variety. NS40S had a more stable contribution of the included factors to yield and biomass. This indicates differences in the genetic background of the two varieties, where the NS40S genotype is bred in the local climate and soil conditions, and thus showed a more stable performance. Ingenio also showed higher nitrogen-use efficiency from the spring N application in terms of yield improvement (22%) than the NS40S variety (7%). These findings are contrary to [28], who observed that the application of N in the fall resulted in lower N use efficiency (NUE) when compared with spring-applied N. In the trials of [29], grain yield of high yielding irrigated hard red winter wheat (HRW, Triticum aestivum L.) was not appreciably affected by N application timing.
Each variety had a specific genotypic reaction to the environmental conditions as Figure 4 depicts. Site-year 1 (Ravno Selo) provided a higher grain yield than site-year 2 (Bajmok) (Figure 4a). In addition, the grain yield had a different ratio to biomass yield, respecting trial locations since a higher biomass production was recorded in Site-year 2 (Figure 4b). This can be explained by the considerably higher soil OM, available N, and K2O initial levels in the soil (Table 4) and by the more favorable weather conditions during growth (Figure 1).
Overall, wheat was considerably more responsive to basic N fertilization applied in Fall in terms of yield and biomass increase. The highest yield and biomass were achieved at 120 kgN ha−1, with the exception of biomass of Ingenio that offered its maximal productivity at the highest fall N dose (Figure 4c,d). If applying more than 180 kg of N, not only was the no yield increase; on the contrary, a yield loss was recorded. This means that applying more than the optimal amount of fertilizer, N use efficiency decreases, leading to increased N losses to the environment. This is a typical response confirmed in studies on wheat [30] and other grain-producing crops such as maize [31]. A similar trend was followed by the biomass production.
The breaking point is the point on the model graph on which the maximum yield and economically acceptable scenario were obtained. According to the 2018 results, in both locations, the most economical rate of nitrogen (MERN) for the basic fertilization applied in fall, was in the range of 60 and 120 kg of N per ha. Overall, NS40S performed lower average yield and biomass than Ingenio (ΔY = 1.25 t ha−1, ΔBM = 3.09 t ha−1) under different N rates and time of application might be attributed to lower grain yield potential and lower response to increased N availability of the specific cultivar.
Spring N top-dress application had less significant impact on grain yield and biomass for both varieties in the study than the fall N application (Figure 4e,f). This can be attributed to the disharmony between the time of N application and rainfall scheme that is very important to avoid N volatilization as one of major N loss factor. Possibly, at the time of high requirement for N, the plants might have taken most of the nitrate from the mineralized organic matter, which depends on climate regime. Notwithstanding, [32] observed a better response to N when it was split-applied in the fall and spring, with NUE reaching as high as 60% compared with a single fall (55%) or spring (53%) application.
In general, the Ingenio variety showed a better response to a spring N application than NS40S. In the case of Ingenio, the breaking point was situated at 50 kg of N per ha. For NS40S, this point was reached at 100 kg of N per ha, but the obtained yield differences were statistically insignificant for applied spring N doses. The Ingenio variety performed the highest average grain yield at the highest nitrogen application rate (150 kgN ha−1), although observed differences among average yields obtained for specific spring N treatment were insignificant. This suggests that the potential for further yield improvement may have existed if higher N rates than 150 kg N ha−1 were applied. Hypothetically, a higher N rate applied in spring would be wasted resulting in a low economic benefit. According to basic economical calculations, the yield increase from the top-dress spring application was not high enough to justify the costs of the extra inputs required for the application for both cultivars and using any top-dress N application rate.

3.3. Results from 2019 Study Sites

In 2019, the experiment included the same wheat cultivars used in 2018; Ingenio and NS40S. Based on the ANOVA results, in site-year 3, none of the fertilizer applications or their interaction had a statistically significant impact on yield or biomass for Ingenio cultivar (Table 7 and Table 8; p > 0.05). Conversely, a statistically significant contribution of fall N application to grain yield and biomass production was obtained for NS40S. This was not the case with the spring top-dress application, which according to the ANOVA results, did not significantly increase yield or biomass. This can be attributed to the fact that precipitation was insufficient during end of fall and in the beginning of spring season (Figure 1) which diminished the potential for nitrogen uptake. Due to the top-dressing application, according to which N fertilizer granules are distributed on the soil surface, the occurrence of rainfall is vital to dissolve and translocate nitrogen into the root zone. In addition, the Chernozem soil type has high organic matter content, hence the high cation exchange capacity which might contribute to a sufficient nutrient supply during the spring growing season.
The contributions of factors on yield and biomass in 2019 are depicted in Figure 5, which imply specific genotype to environment interaction. Ingenio grain yield was mostly impacted by the spring N application (42%) followed by the interaction of fall and spring N treatment (34%), and the least contribution had a fall N application (24%). Conversely, biomass responded mostly to the fall N treatment (63%) while spring N treatment had very small contribution (12%). Nevertheless, these results were not statistically significant according to ANOVA analysis (Table 3). In the case of NS40S, the majority of grain yield and biomass variations were related to fall N application (>87%), while the spring application (5–9%) and the interaction of the treatments (4–5%) had a minor contribution to yield and biomass.
Figure 6 shows the response of the wheat plants to N fertilizer management concerning grain yield and biomass production in 2019. The varieties differ significantly in utilizing the total plant N for grain yield. A chart characterized the impact of fall and spring N application on the Ingenio cultivar (Figure 6a,c) similarly to previous studies [33], with the highest yield achieved by applying 60 kg of N per ha in fall and 50 kg of N per ha in spring fertilization. However, as already mentioned, the contributions of applied fertilizer to the depicted parameters were not significant, indicating low NUE. With the increase of fall N rate on the Ingenio plots, a relative improvement was only 8% on grain yield and 11% on biomass.
Concerning NS40S, yield and biomass measurements were affected by the fall basic N fertilization (80% grain increase; 58% biomass increase) with the rate of 120 kg of N per ha being the most appropriate (Figure 6a,b). Grain yield production efficiency for NS40S at different N rates ranged from 44.2 to 62.5 kg kg−1 N at the rates of 60 and 120 kg N ha−1, respectively. Van Sanford et al. [34] also obtained similar results in which they noted N use efficiency values of 29.3–43.9 and 31.8–48.3 kg kg−1 N, respectively. N application in spring season offered meaningful grain and biomass improvement of NS40S, confirming the ANOVA results according to which the response to this application was statistically significant (p = 0.04). Yield and biomass dispersion of NS40S and Ingenio illustrated in Figure 6c,d can be associated with internal heterogeneity of genotype thus quantitative trait variation [35].

3.4. Results from 2020 Study Site

The results from this site-year presented the potential of specific varieties to improve productive characteristics by applying fall and spring N fertilization in a certain manner as presented in Table 9, Table 10, Table 11 and Table 12.
The Ingenio variety was significantly impacted by the fall N treatment, at the p < 0.01 significance level (Table 9). Conversely, the spring N treatment had a significant contribution only in biomass production (p < 0.05).
Based on the results in Table 10, variability of NS40S grain yield and biomass production was only affected by the fall N application showing statistically significant results at the p < 0.01 significance level.
The share of influence of each experimental factor in yield and biomass for the included wheat varieties examined in 2020 is shown in Figure 7. In general, dominant impact on grain yield and biomass for the fall N application was in the range between 57% and 71%. Le Gouis et al. [36] reported a nonsignificant influence of variety and interaction between N rate and genotype on NUE. Fall N treatment was most contributive to NS40S (71&69%) variety followed by Ingenio (61&57%). Weather conditions in 2020 indicate low precipitation from March until May (Figure 1) when the N fertilizer was applied, disabling nitrogen uptake by the plants.
Tested cultivars were only responsive to fall N application in terms of grain yield and biomass (Figure 8). Ingenio and NS40S achieved a considerably different yield showing distinctive response to fall N application. In the study by [36] that included 20 wheat genotypes on two years trials, genotype × year × N level interactions were not significant. Significant differences between varieties performance and response to N application were also confirmed in a previous study [37]. Taking into account fall N application, the NS40S grain yield was maximized when applying 60 kg of N per ha, even though the Ingenio variety required 120 kg of N per ha to reach the maximum yield (Figure 8a). This can be explained by the fact that Ingenio showed a higher-yielding potential compared to the NS40S variety. A similar reaction to the N fertilization occurred due to biomass production (Figure 8b).

3.5. Multiyear Analysis

In the multiyear analysis, the datasets for the two varieties studied throughout all the three years of trial (2018–2020) were analyzed, widening the insight of the different factors’ implications on wheat traits (Table 11 and Table 12). The calculated Pearson’s correlation coefficients (r2018 = 0.85, r2019 = 0.82, 2020 r2020 = 0.84, overall roverall = 0.84) between yield and biomass over the years and treatments coincide with the results of the authors [38]. In this representation, the strong correlation between grain yield and biomass impose the inference that biomass can be used as an indicator of grain yield responses to N treatments [39]. Growing season conditions, as well as genotype specificity, appears to result in a grain to straw ratio. Following the previous discussion on the climate during the trial period, it is clear that better harmonization of yield and biomass is occurring under favorable conditions and vice versa. In some cases, genotypes can reach the peak of vegetative development earlier, shortening the phenological cycle, as we experienced in the 2019 growing season, which can disturb the uniformity of the plants’ development over the field/plot.
In terms of the grain yield, a highly significant contribution of year and fall N treatment were depicted (Table 11; p < 0.01). On the other hand, spring N application did not have any significant contribution to NS40S grain yield variability, although the Ingenio variety had statistically remarkable response (p = 0.051). In terms of biomass (Table 12), the dominant inducing factors were location and fall N application (p < 0.01), while spring N application was statistically significant at the p < 0.05 level.
According to the multiyear analysis, the strongest influence on the variability of yield and biomass for both varieties, was attributed to the specific conditions at each year (Figure 9). The yield in 2019 was significantly lower, which can be attributed to unfavorable weather conditions after sowing. The extreme precipitation scarcity that season, resulted in the late and inadequate emergence of wheat plants with a direct effect on end-of0season yield. For this particular year, the yield response to N application, especially for spring application, was higher, as compared to the other two experimental seasons. This indicates that basic fertilizer N utilization was limited due to the soil moisture scarcity, making the spring application more responsive. This finding shows several opportunities for advancement in the field management to make wheat production less dependent to weather impact. Alcoz et al. [40] reported similar findings and concluded that applying all N fertilizer preplant vs. split-applied appeared to have a low impact on yield. Moreover, even though the contribution of N fertilization to yield and biomass production was considerably low with the inclusion of the year as a factor in the analysis, it was statistically significant, thus worthy of further investigation. The fall N treatment had higher contribution compared to spring application.
The overall results from the multiyear analysis (Figure 10 and Figure 11) suggested the existence of various interactions between wheat traits and included factors. The lowest grain yield and biomass were obtained in 2019, while the highest production was recorded in 2020 (Figure 10a,b). Generally, the overall N rates and growing seasons, Ingenio cultivar had 18.1% higher yield and 20.5% higher biomass production per unit of total plant N compared to NS40S. This could lead to the conclusion of improved soil utilization and climate adaptation of foreign variety, which include genetics originated from successful cross-bred cultivars. Looking at the yearly averages from 2018 to 2020, Ingenio and NS40S had similar variations of grain yield and biomass production (Figure 10), indicating the significant dependence of non-irrigated winter wheat productivity from weather, regardless of soil fertility.
In accordance with the analyses from the separate years, the wheat plants from both cultivars were mostly responsive only to the fall N fertilizer application (Figure 11a,b). The efficiency significantly dropped when the N application rate changed from 120 to 180 kg N ha−1. The difference in the fall N utilization efficiency for Ingenio was 13% if the fertilizer application rate increased from 60 (19%) to 180 (6%) kg N ha−1, while for NS40S it decreased from 24% to 11%. Figure 11a,b illustrates that yield and biomass production for both cultivars were maximized with fall N inputs lower than 120 kg ha−1. Spring N application did not offer any significant contribution to yield and biomass production considering both varieties examined in the study (Figure 11c,d). Wheat varieties did not respond to supplemented inorganic fertilizer N, possibly due to the high soil mineralization potential that supplied adequate N, meeting crop demands over the springtime. Similar results were achieved by [41]. Spring N treatment provided low NUE for NS40S (only 3% for 50 N kg ha−1; 4%for 100 N kg ha−1; 3% for 150 N kg ha−1). Ingenio showed higher NUE (19% for 50 N kg ha−1; 11% for 100 N kg ha−1; 9% for 150 N kg ha−1), which explains its higher yield potential. Therefore, Ingenio was responsive to the spring N application with the most economic rate at 50 kg ha−1; however, this response was not statistically significant.

4. Conclusions

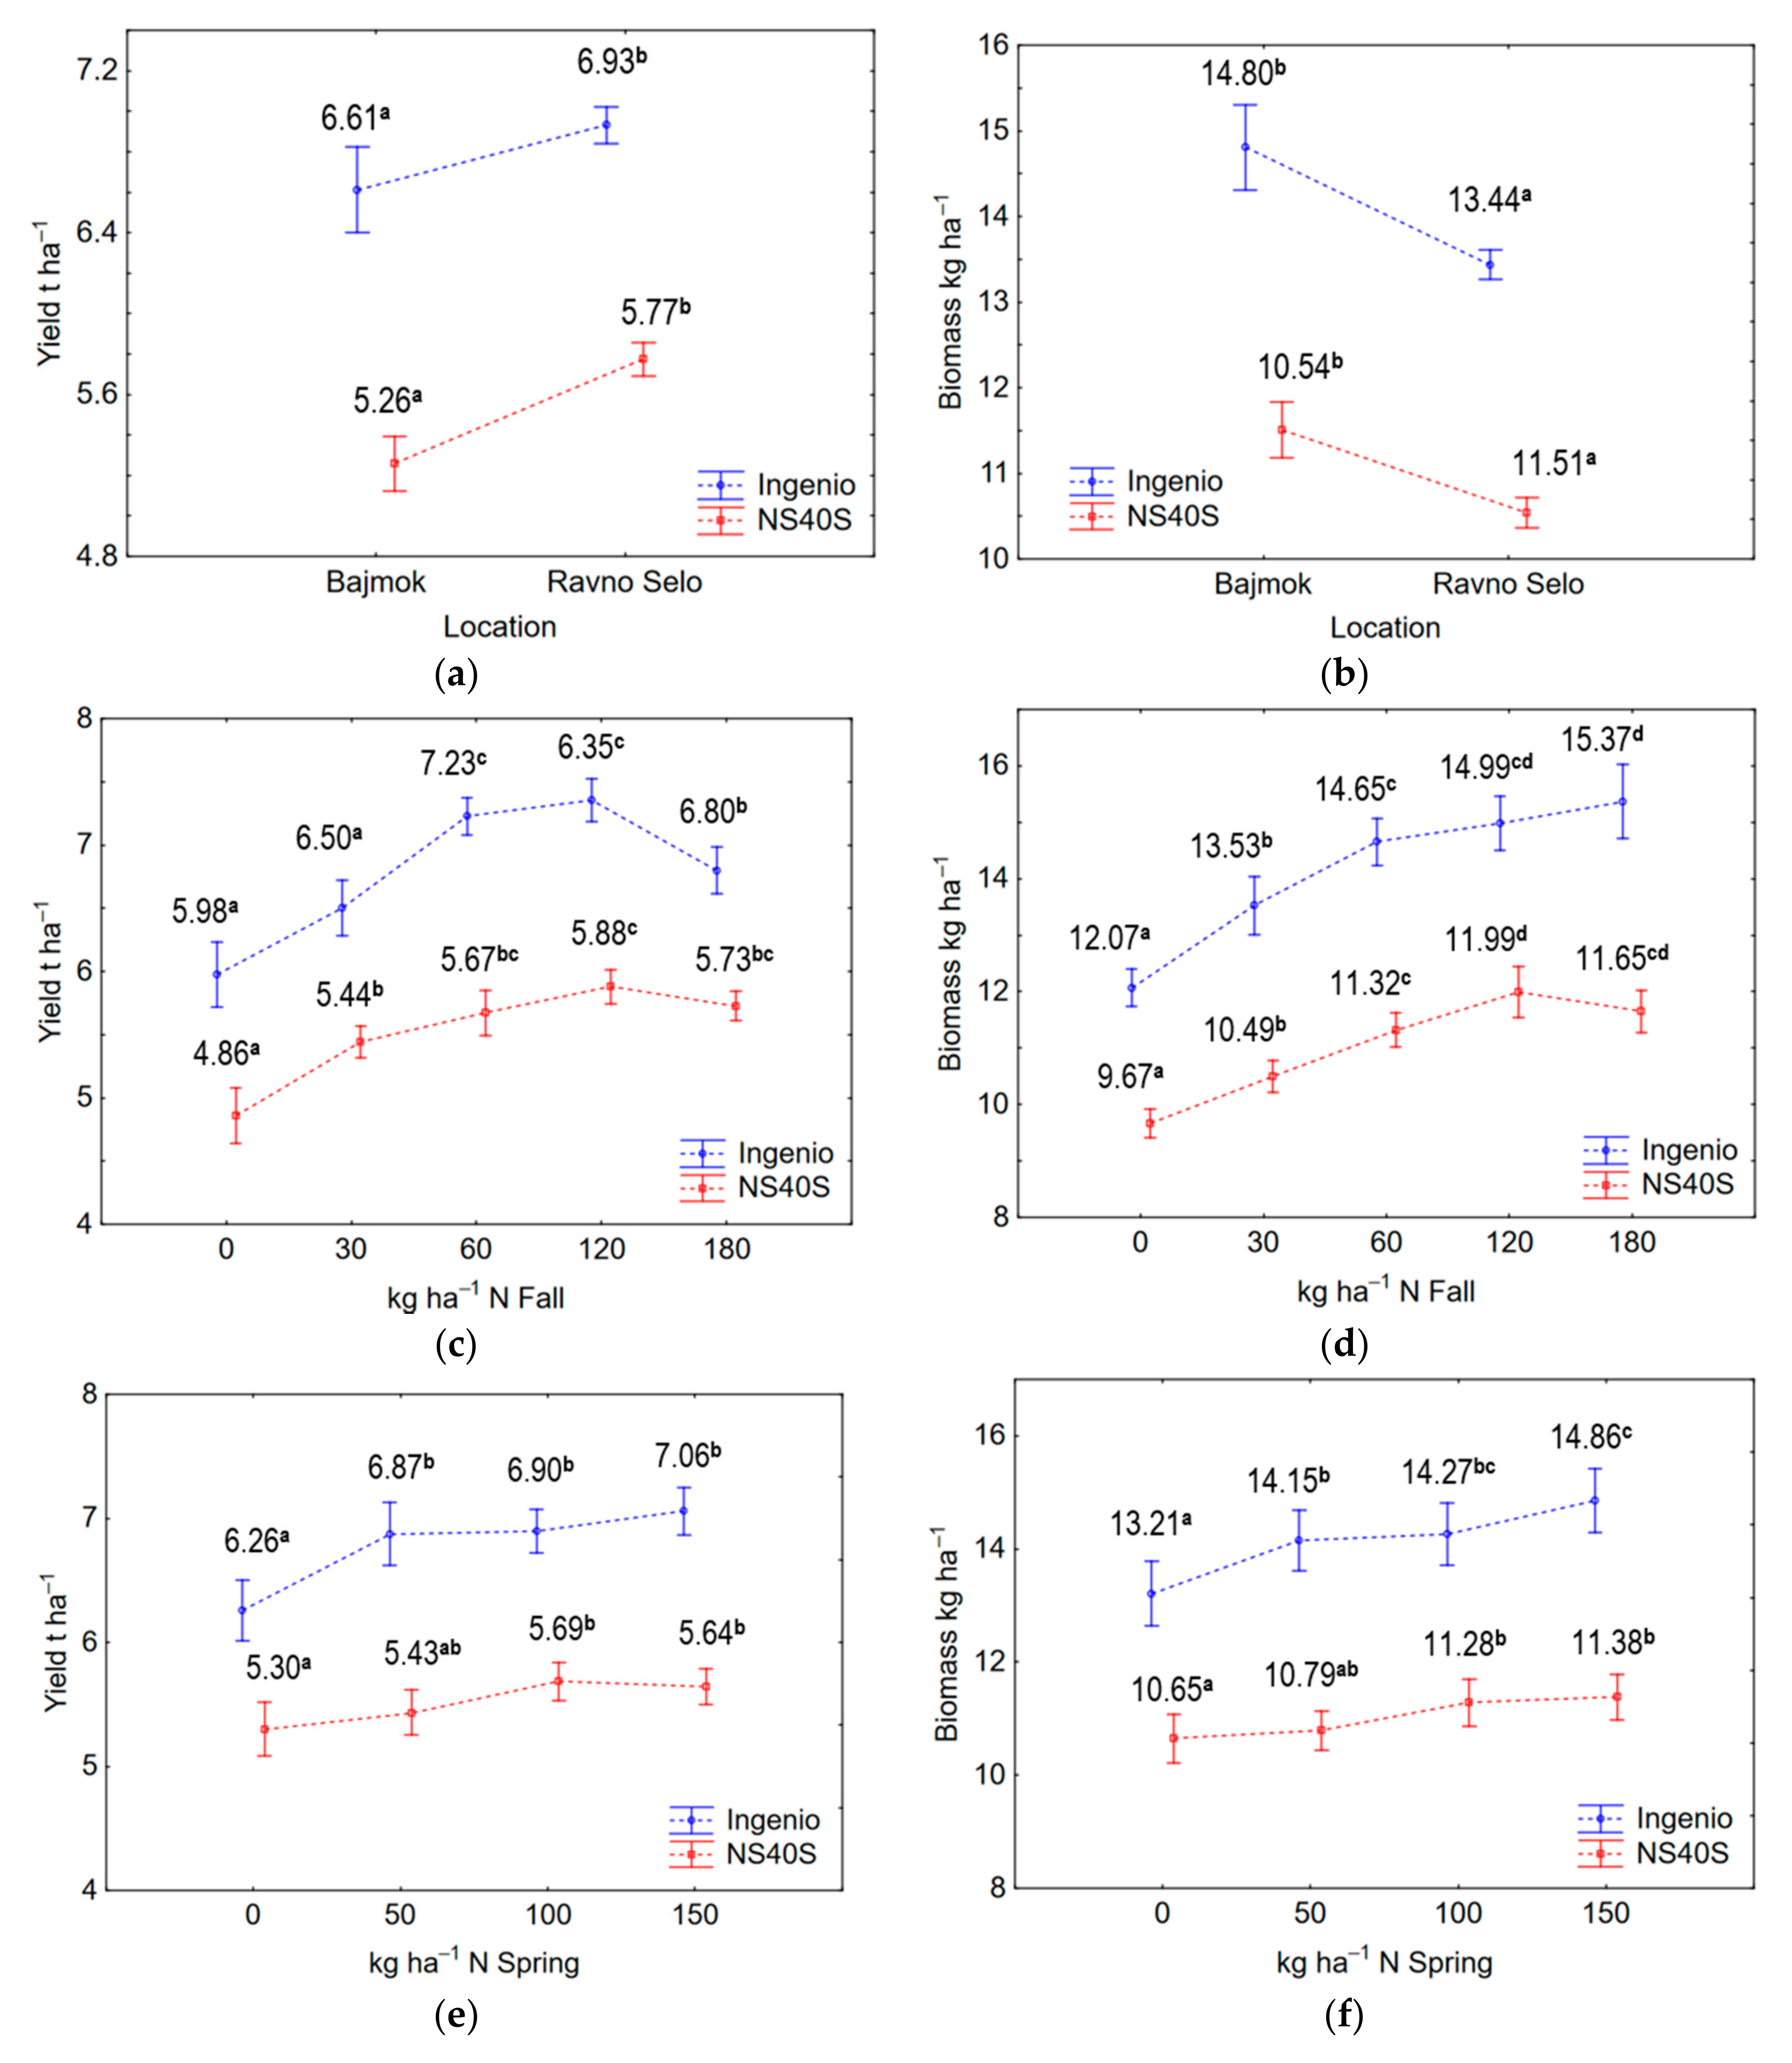
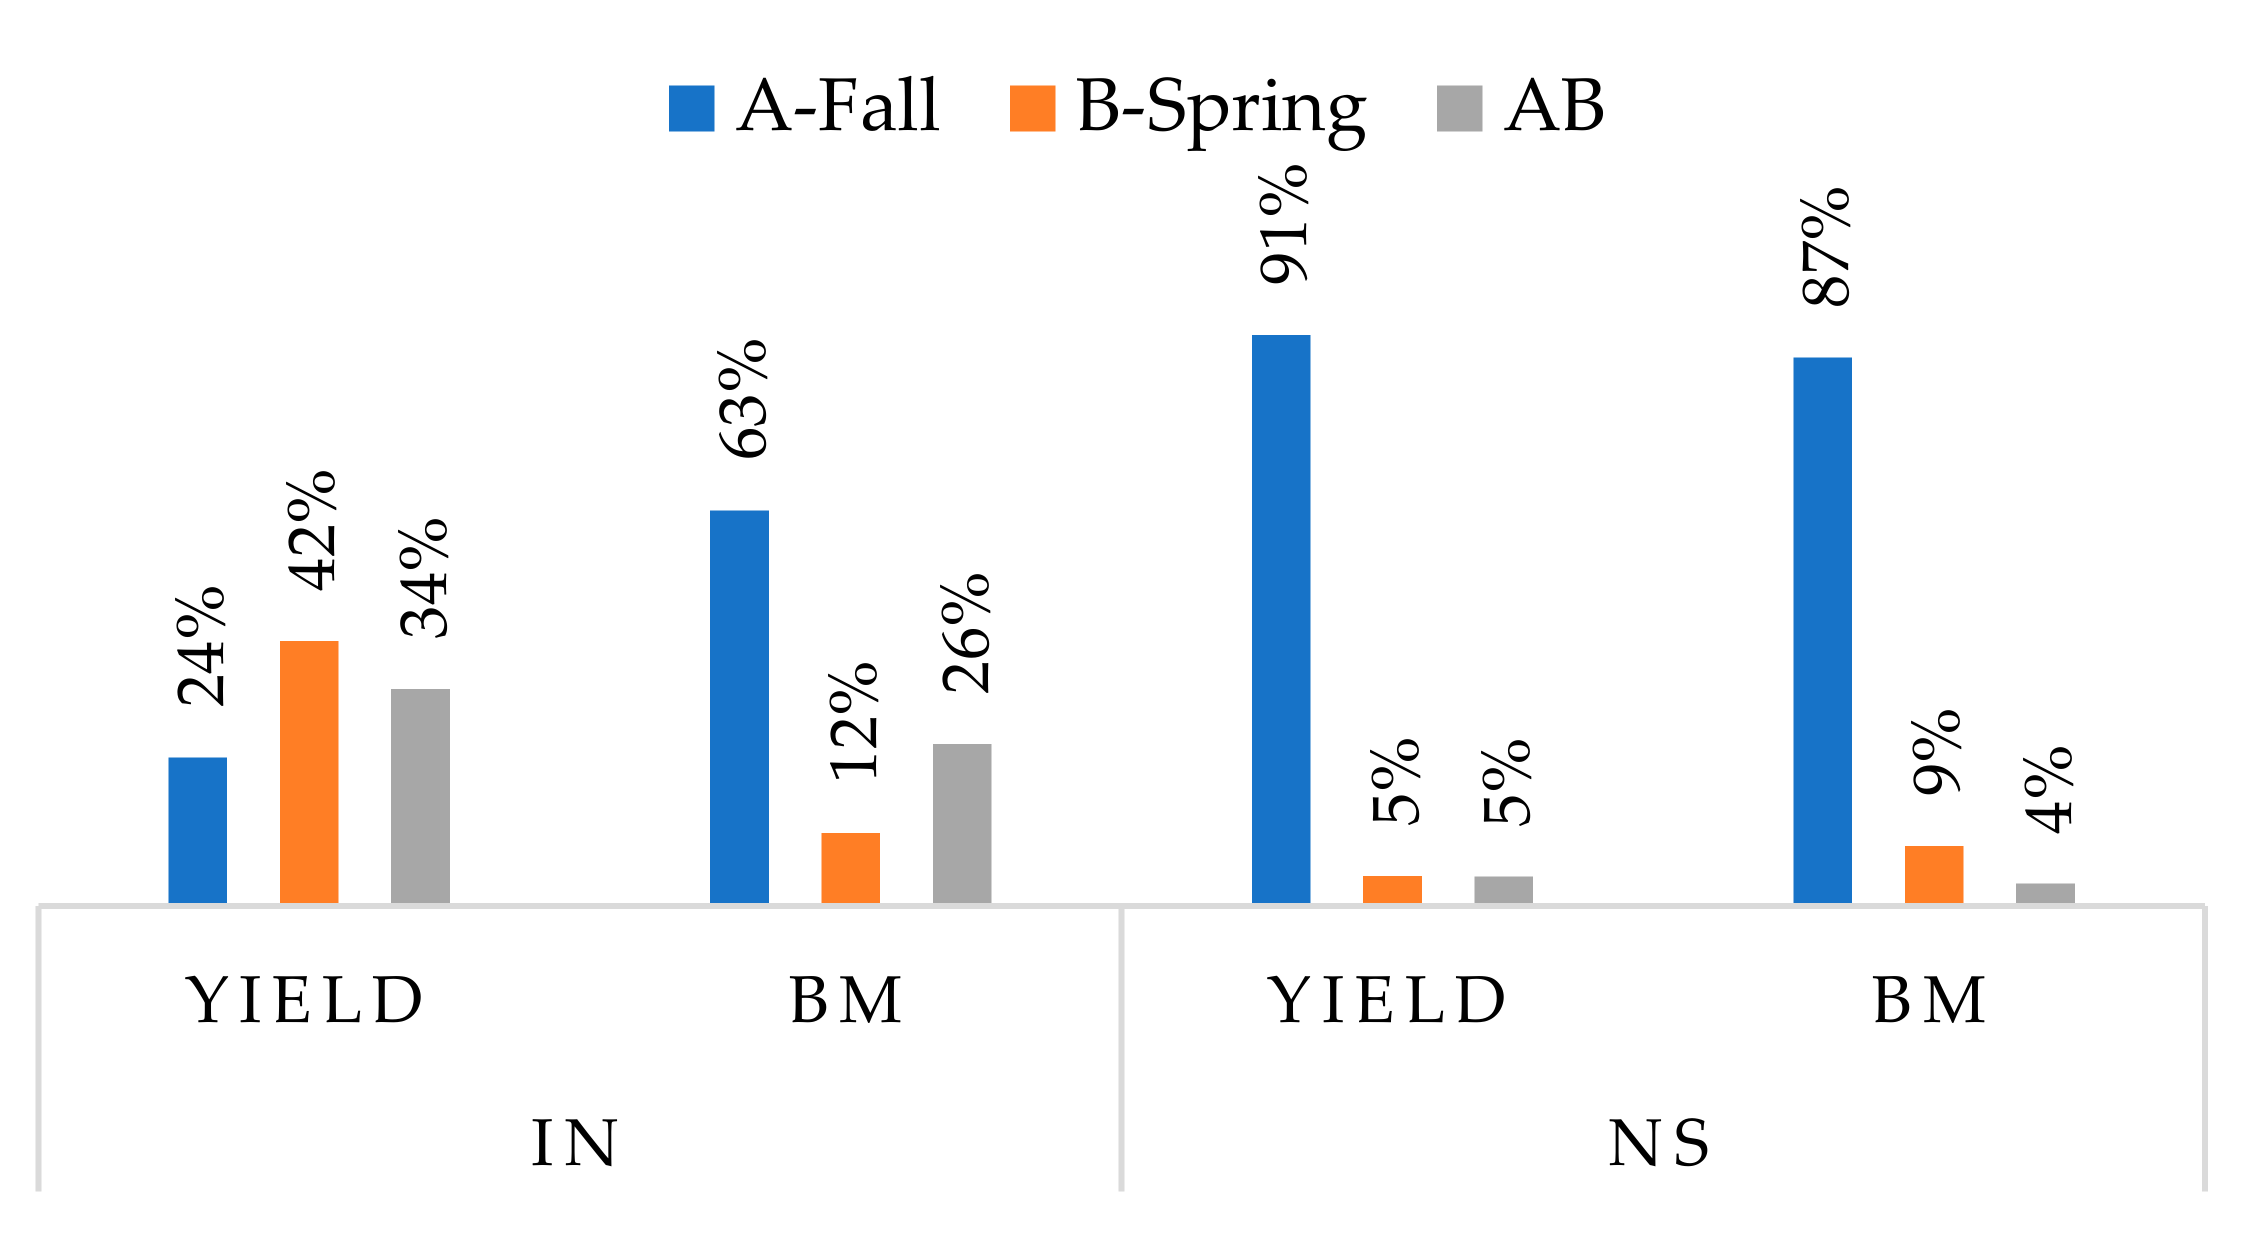
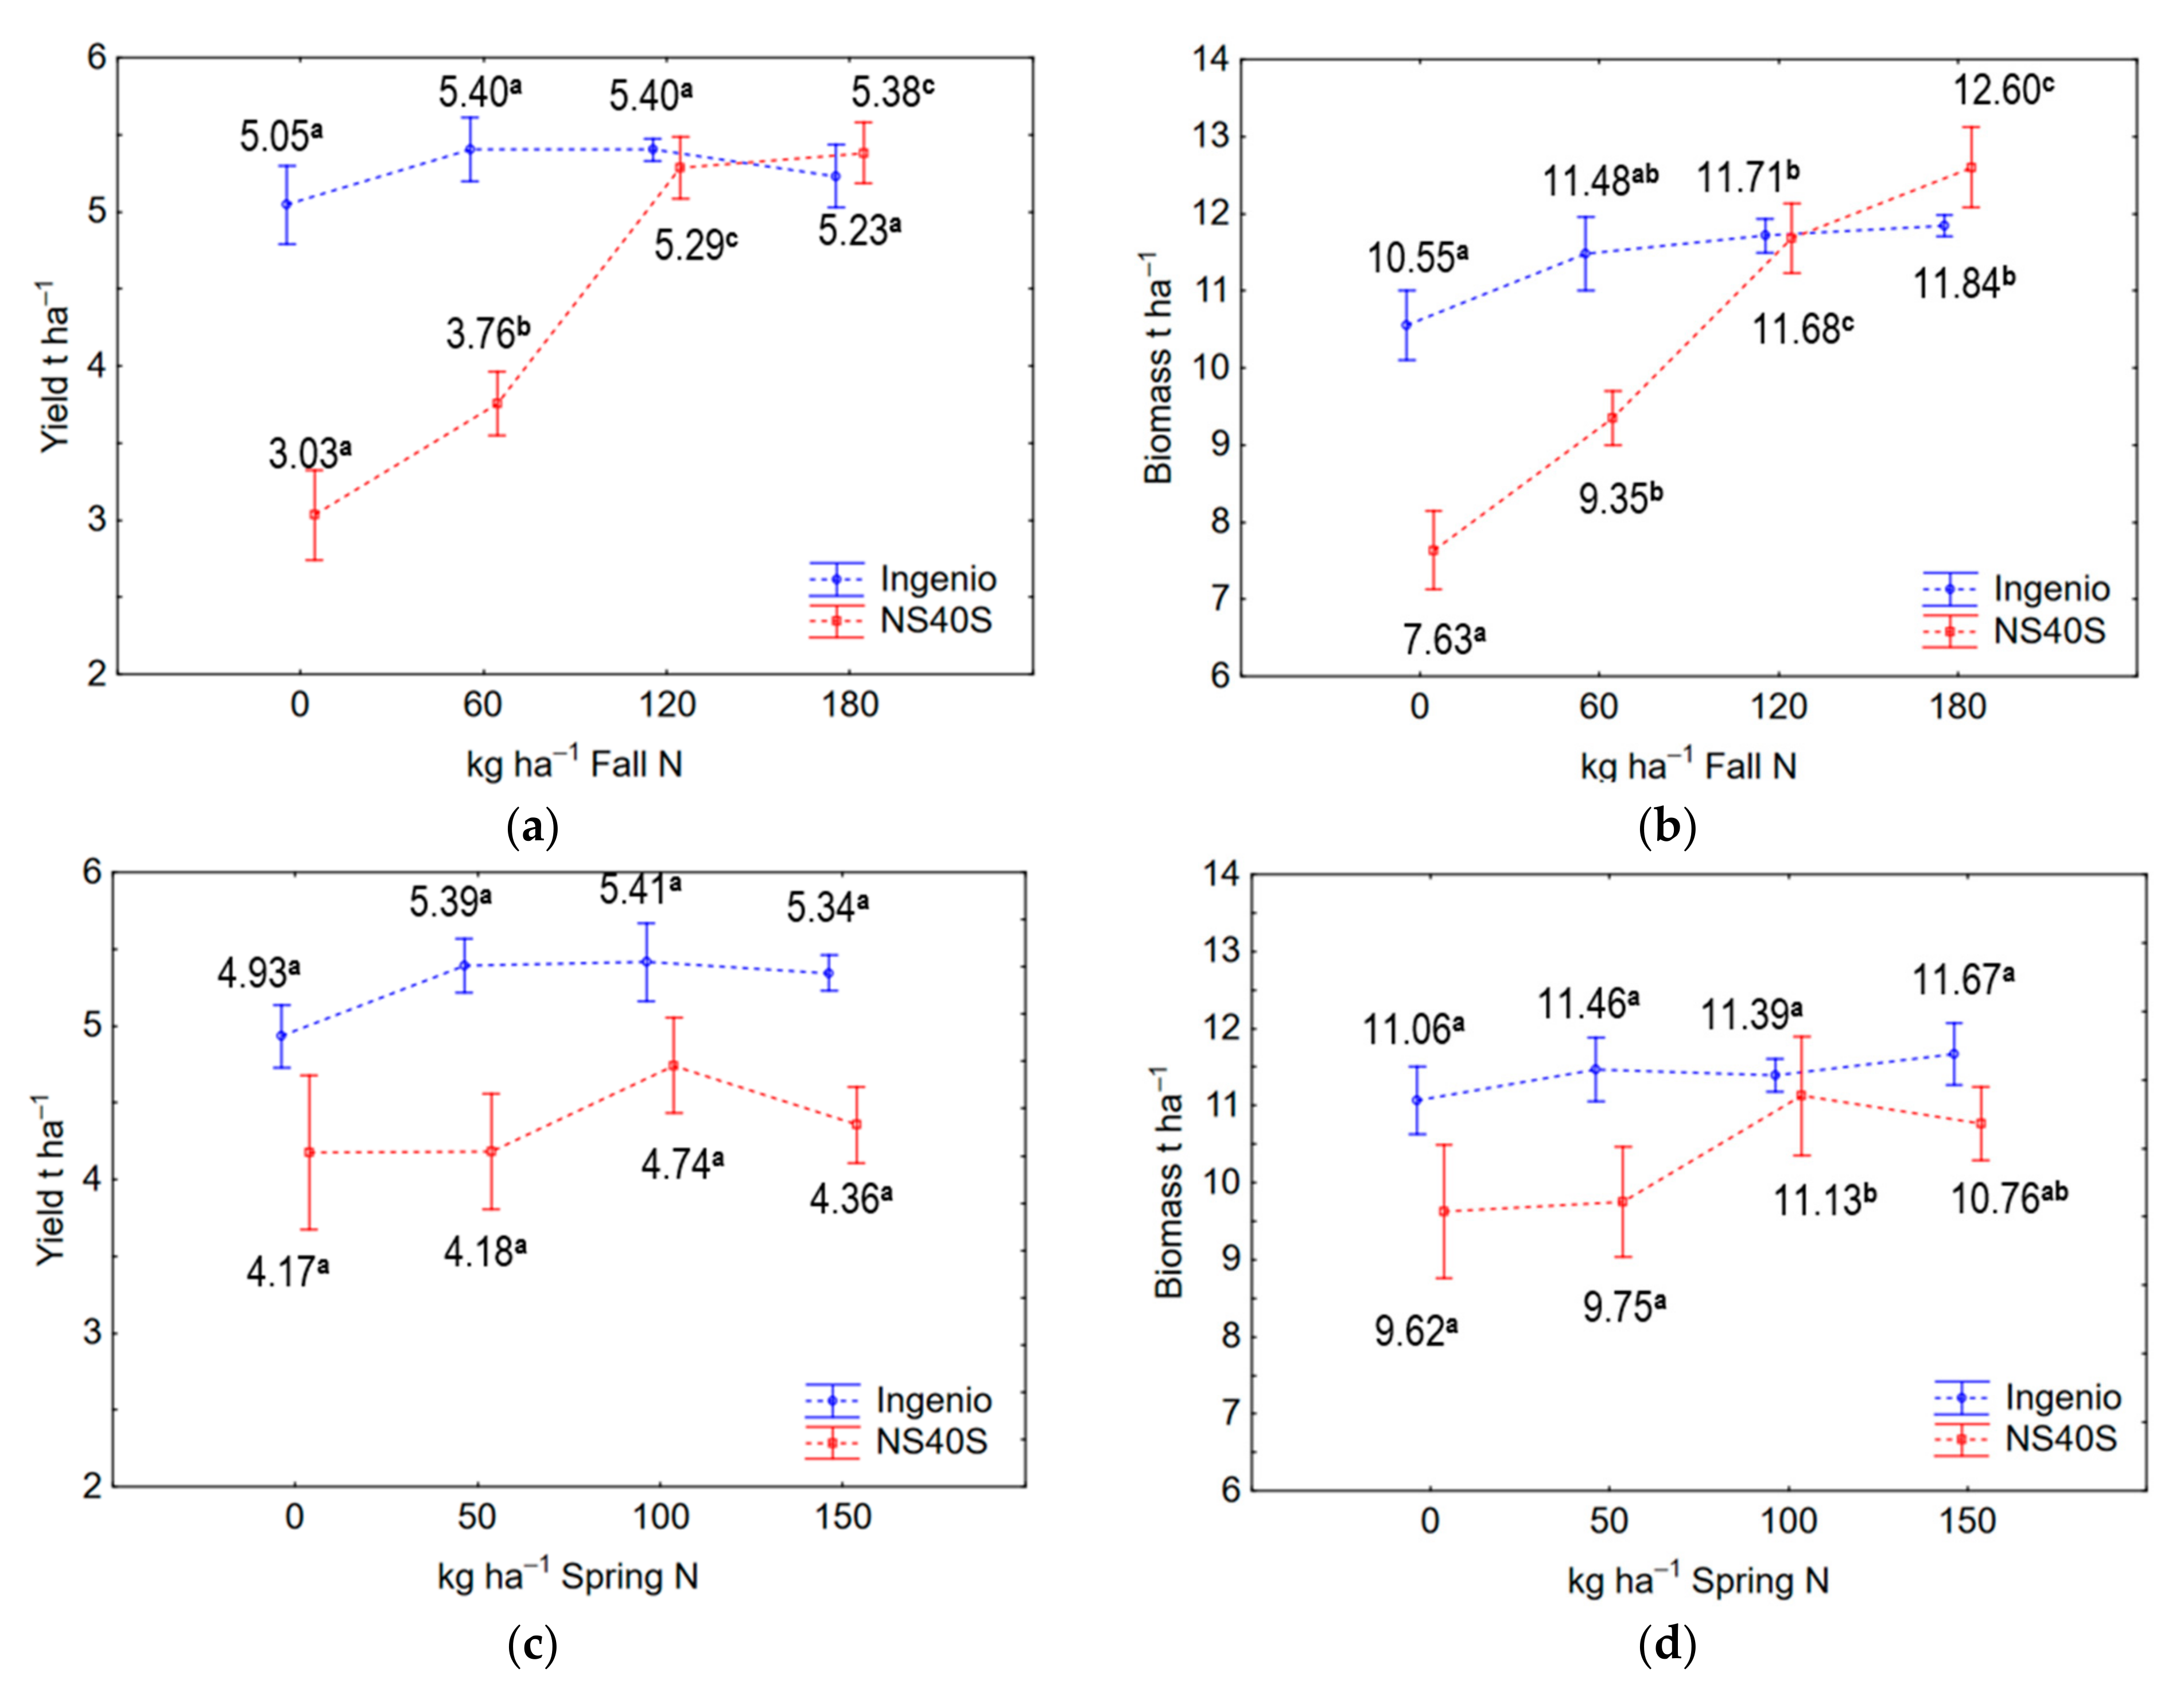
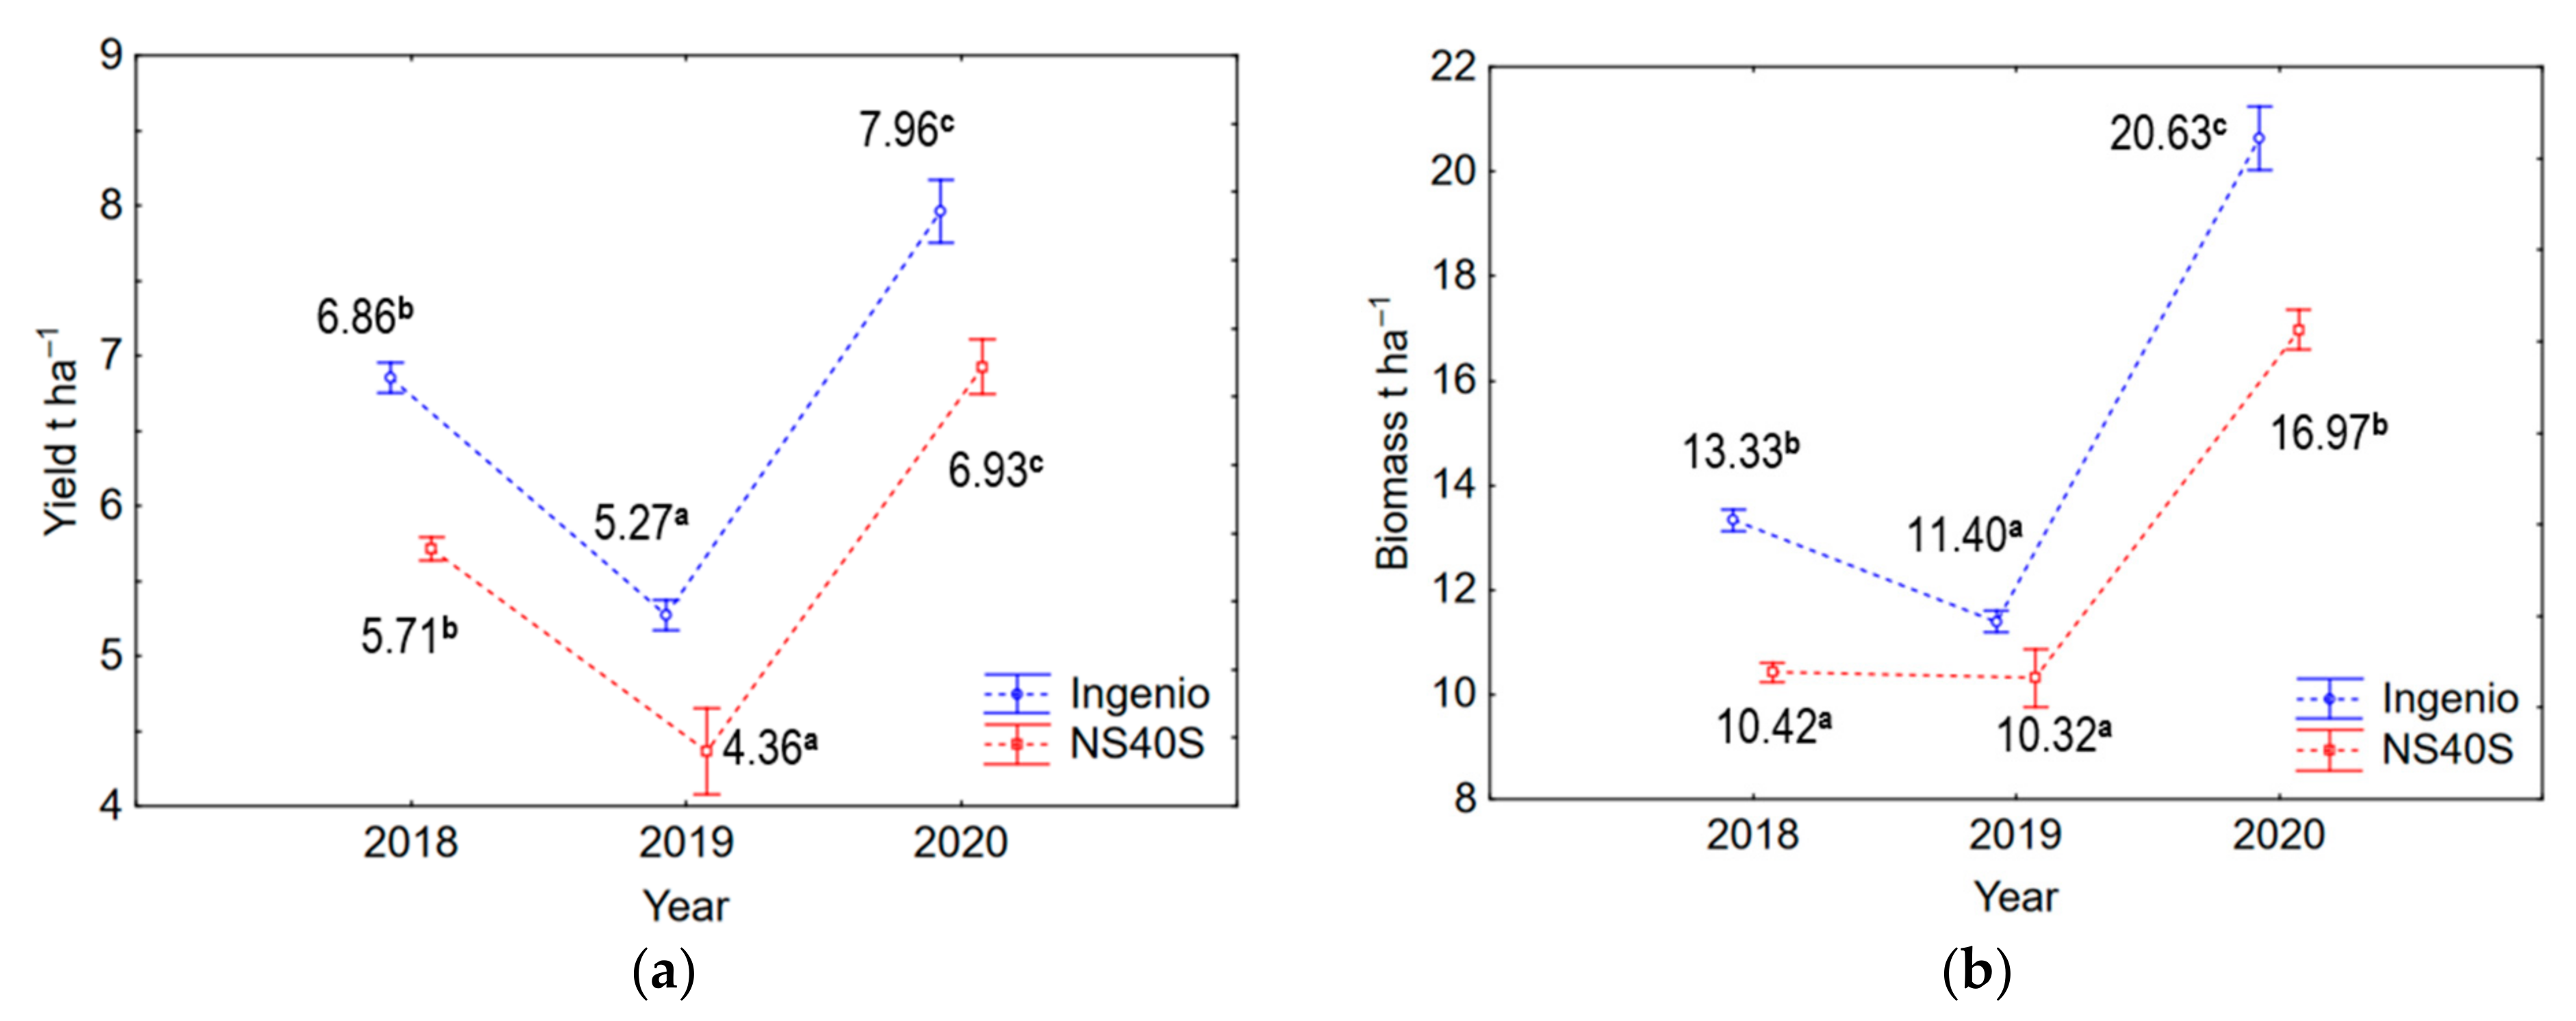
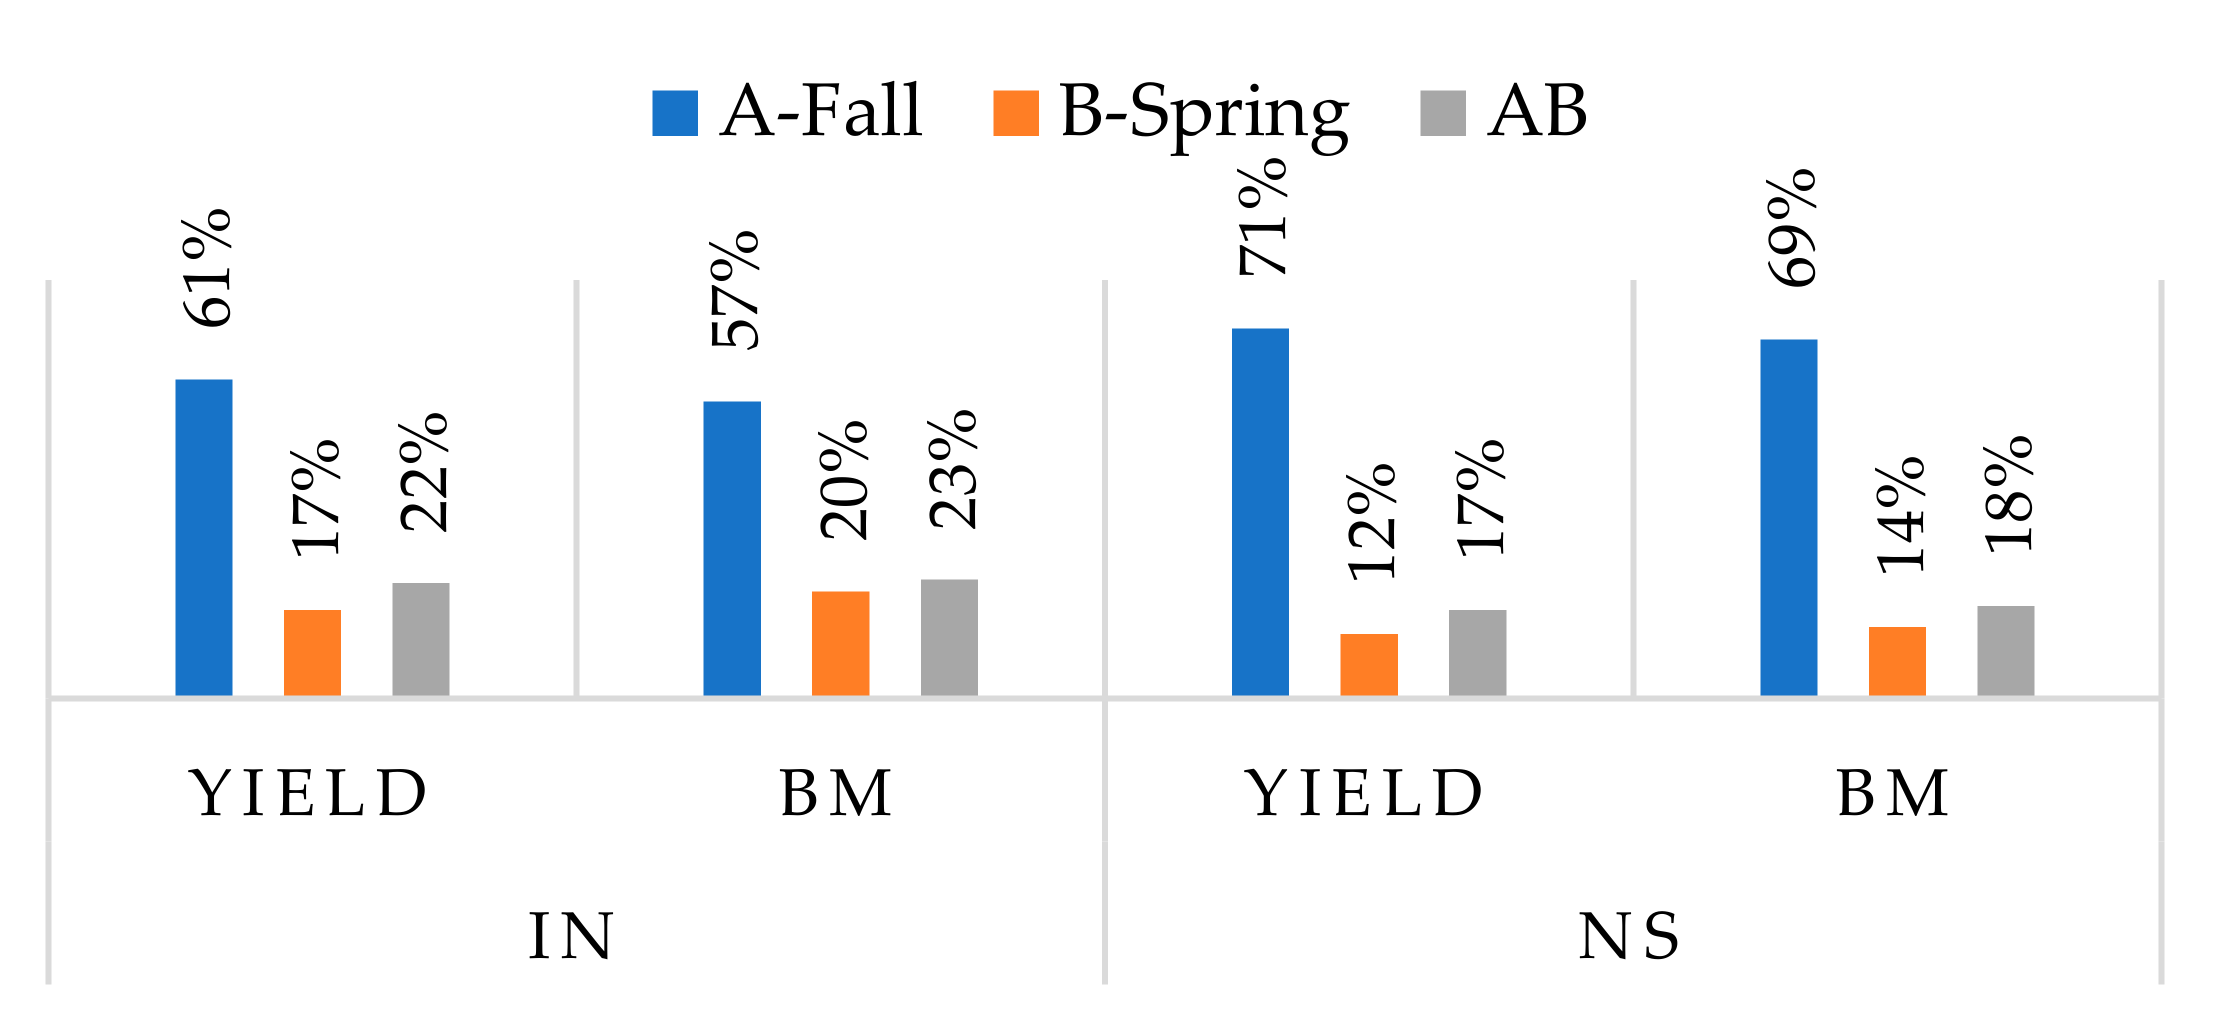
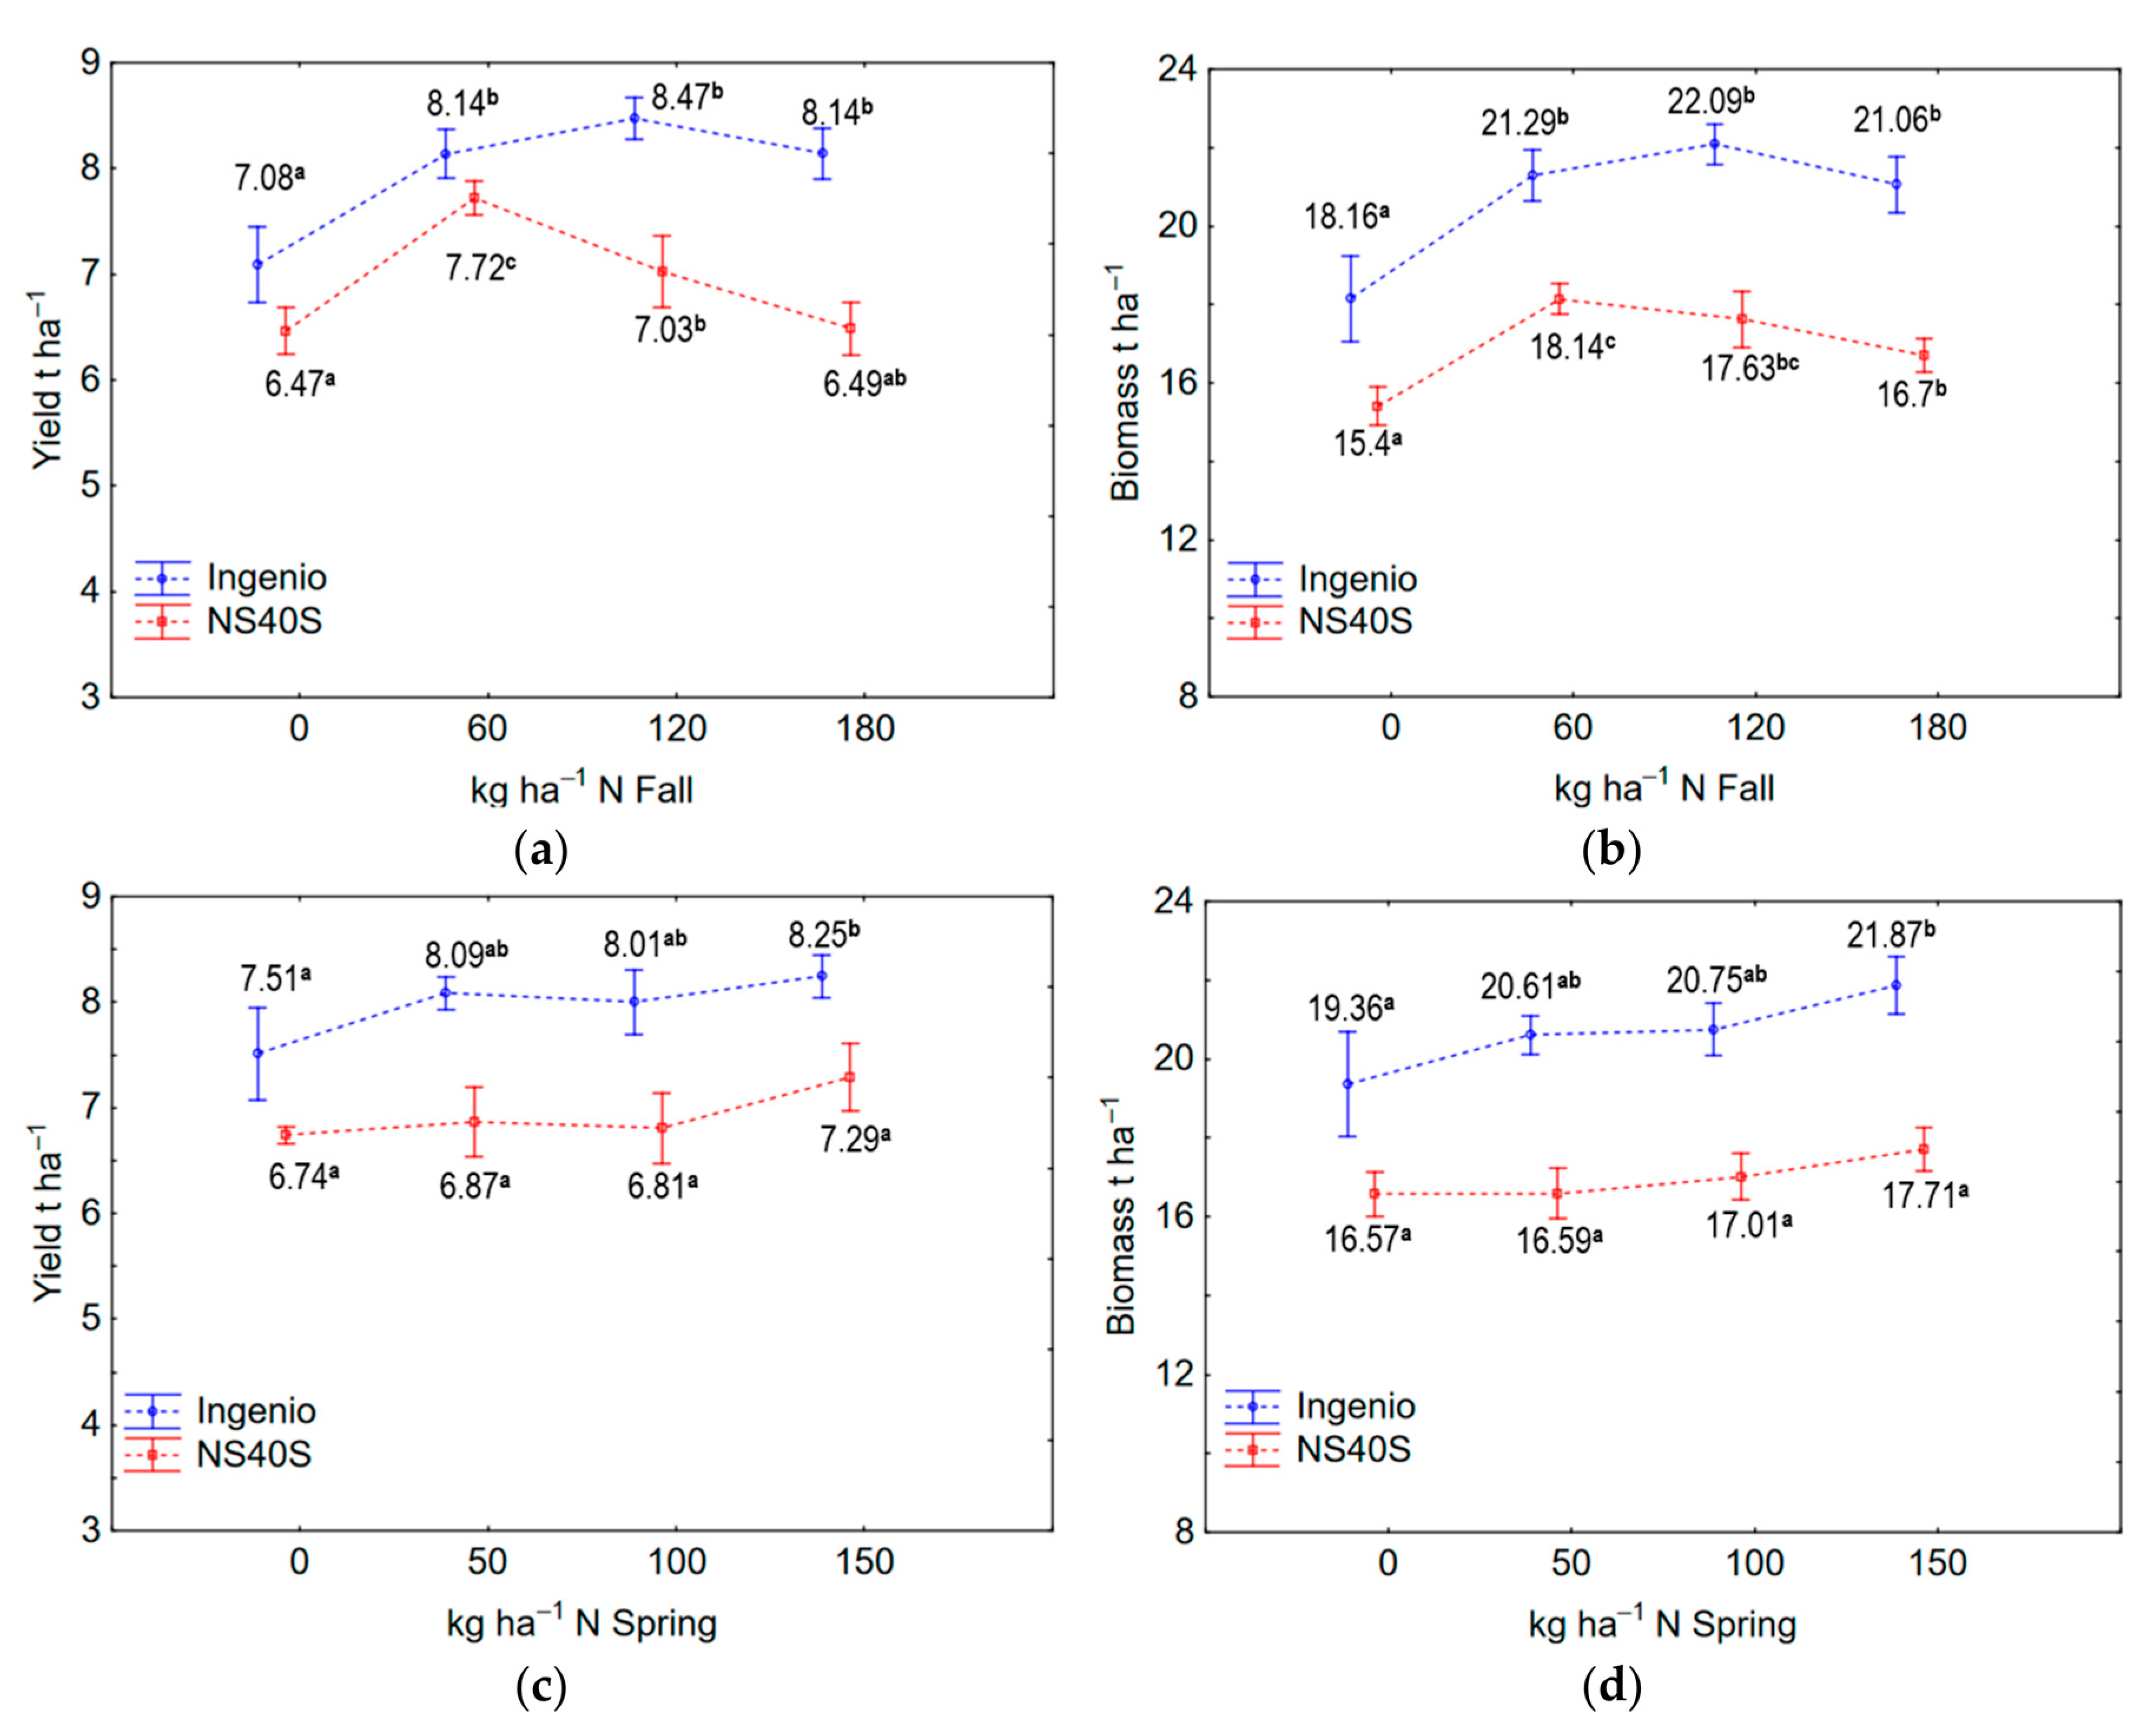
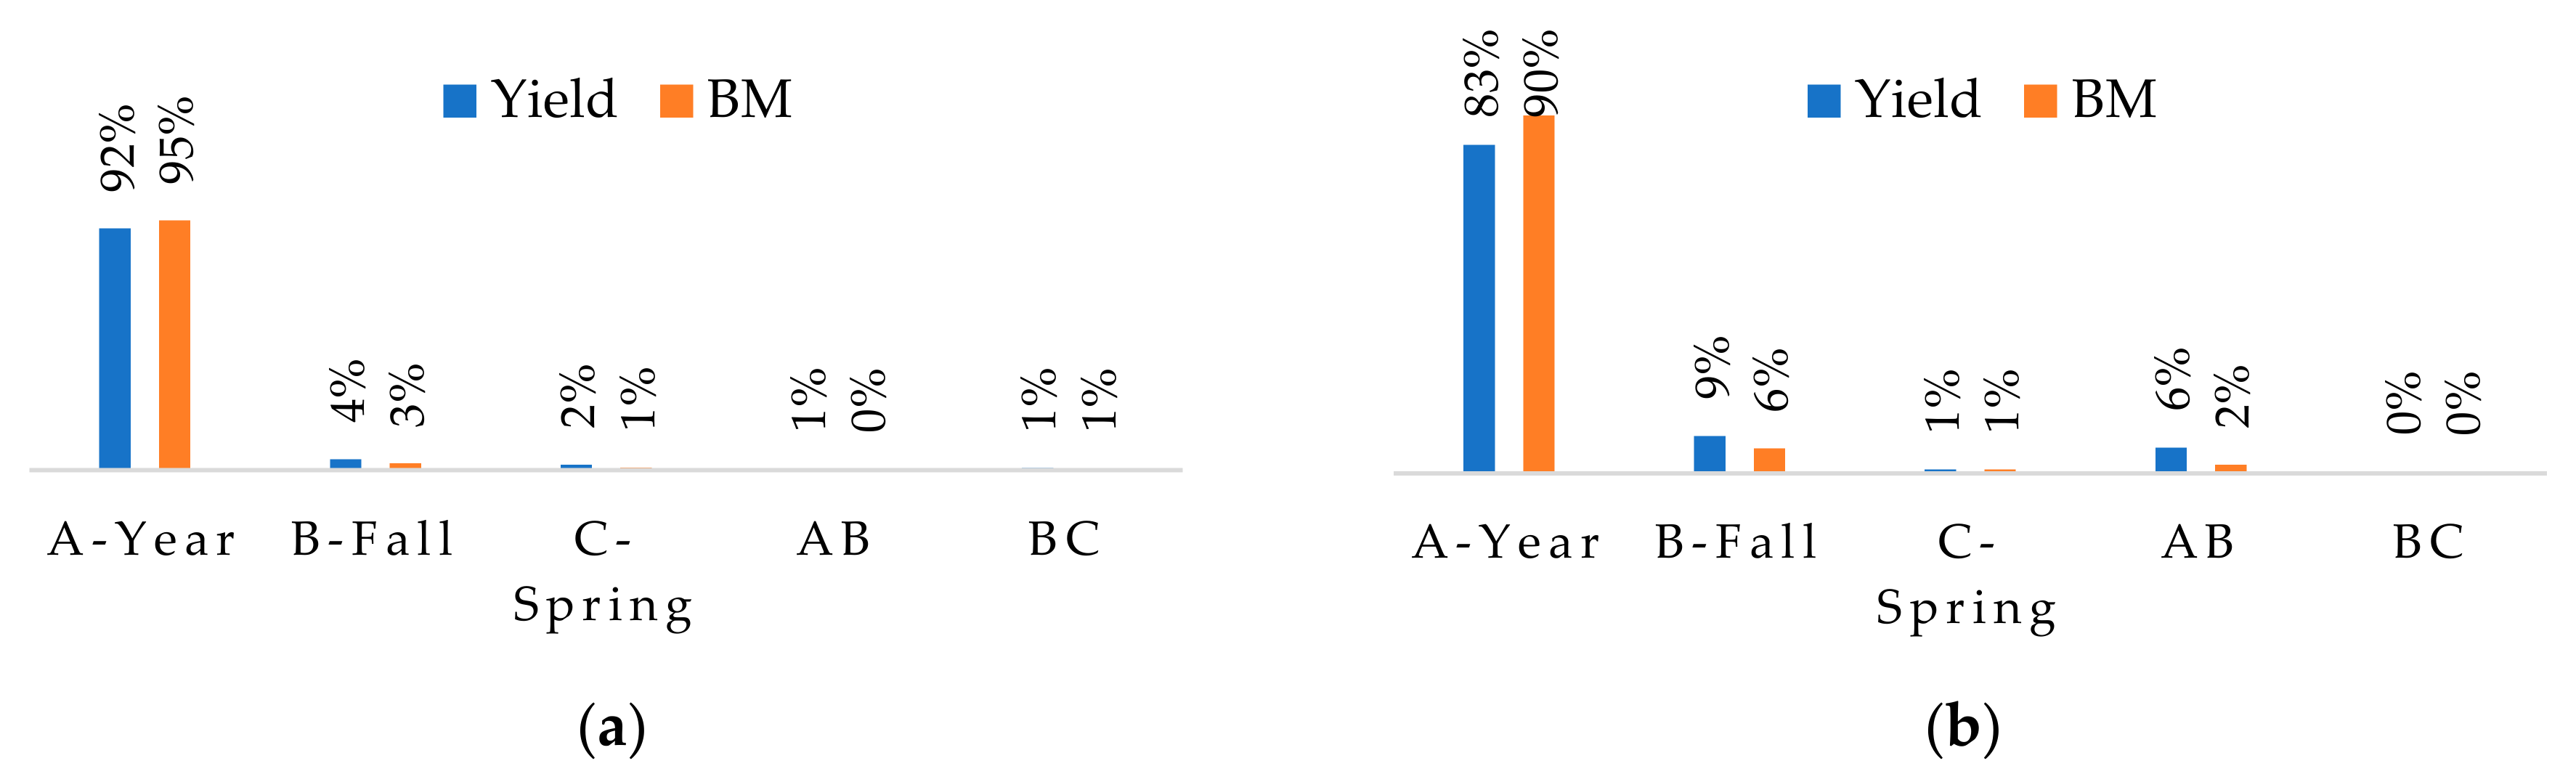
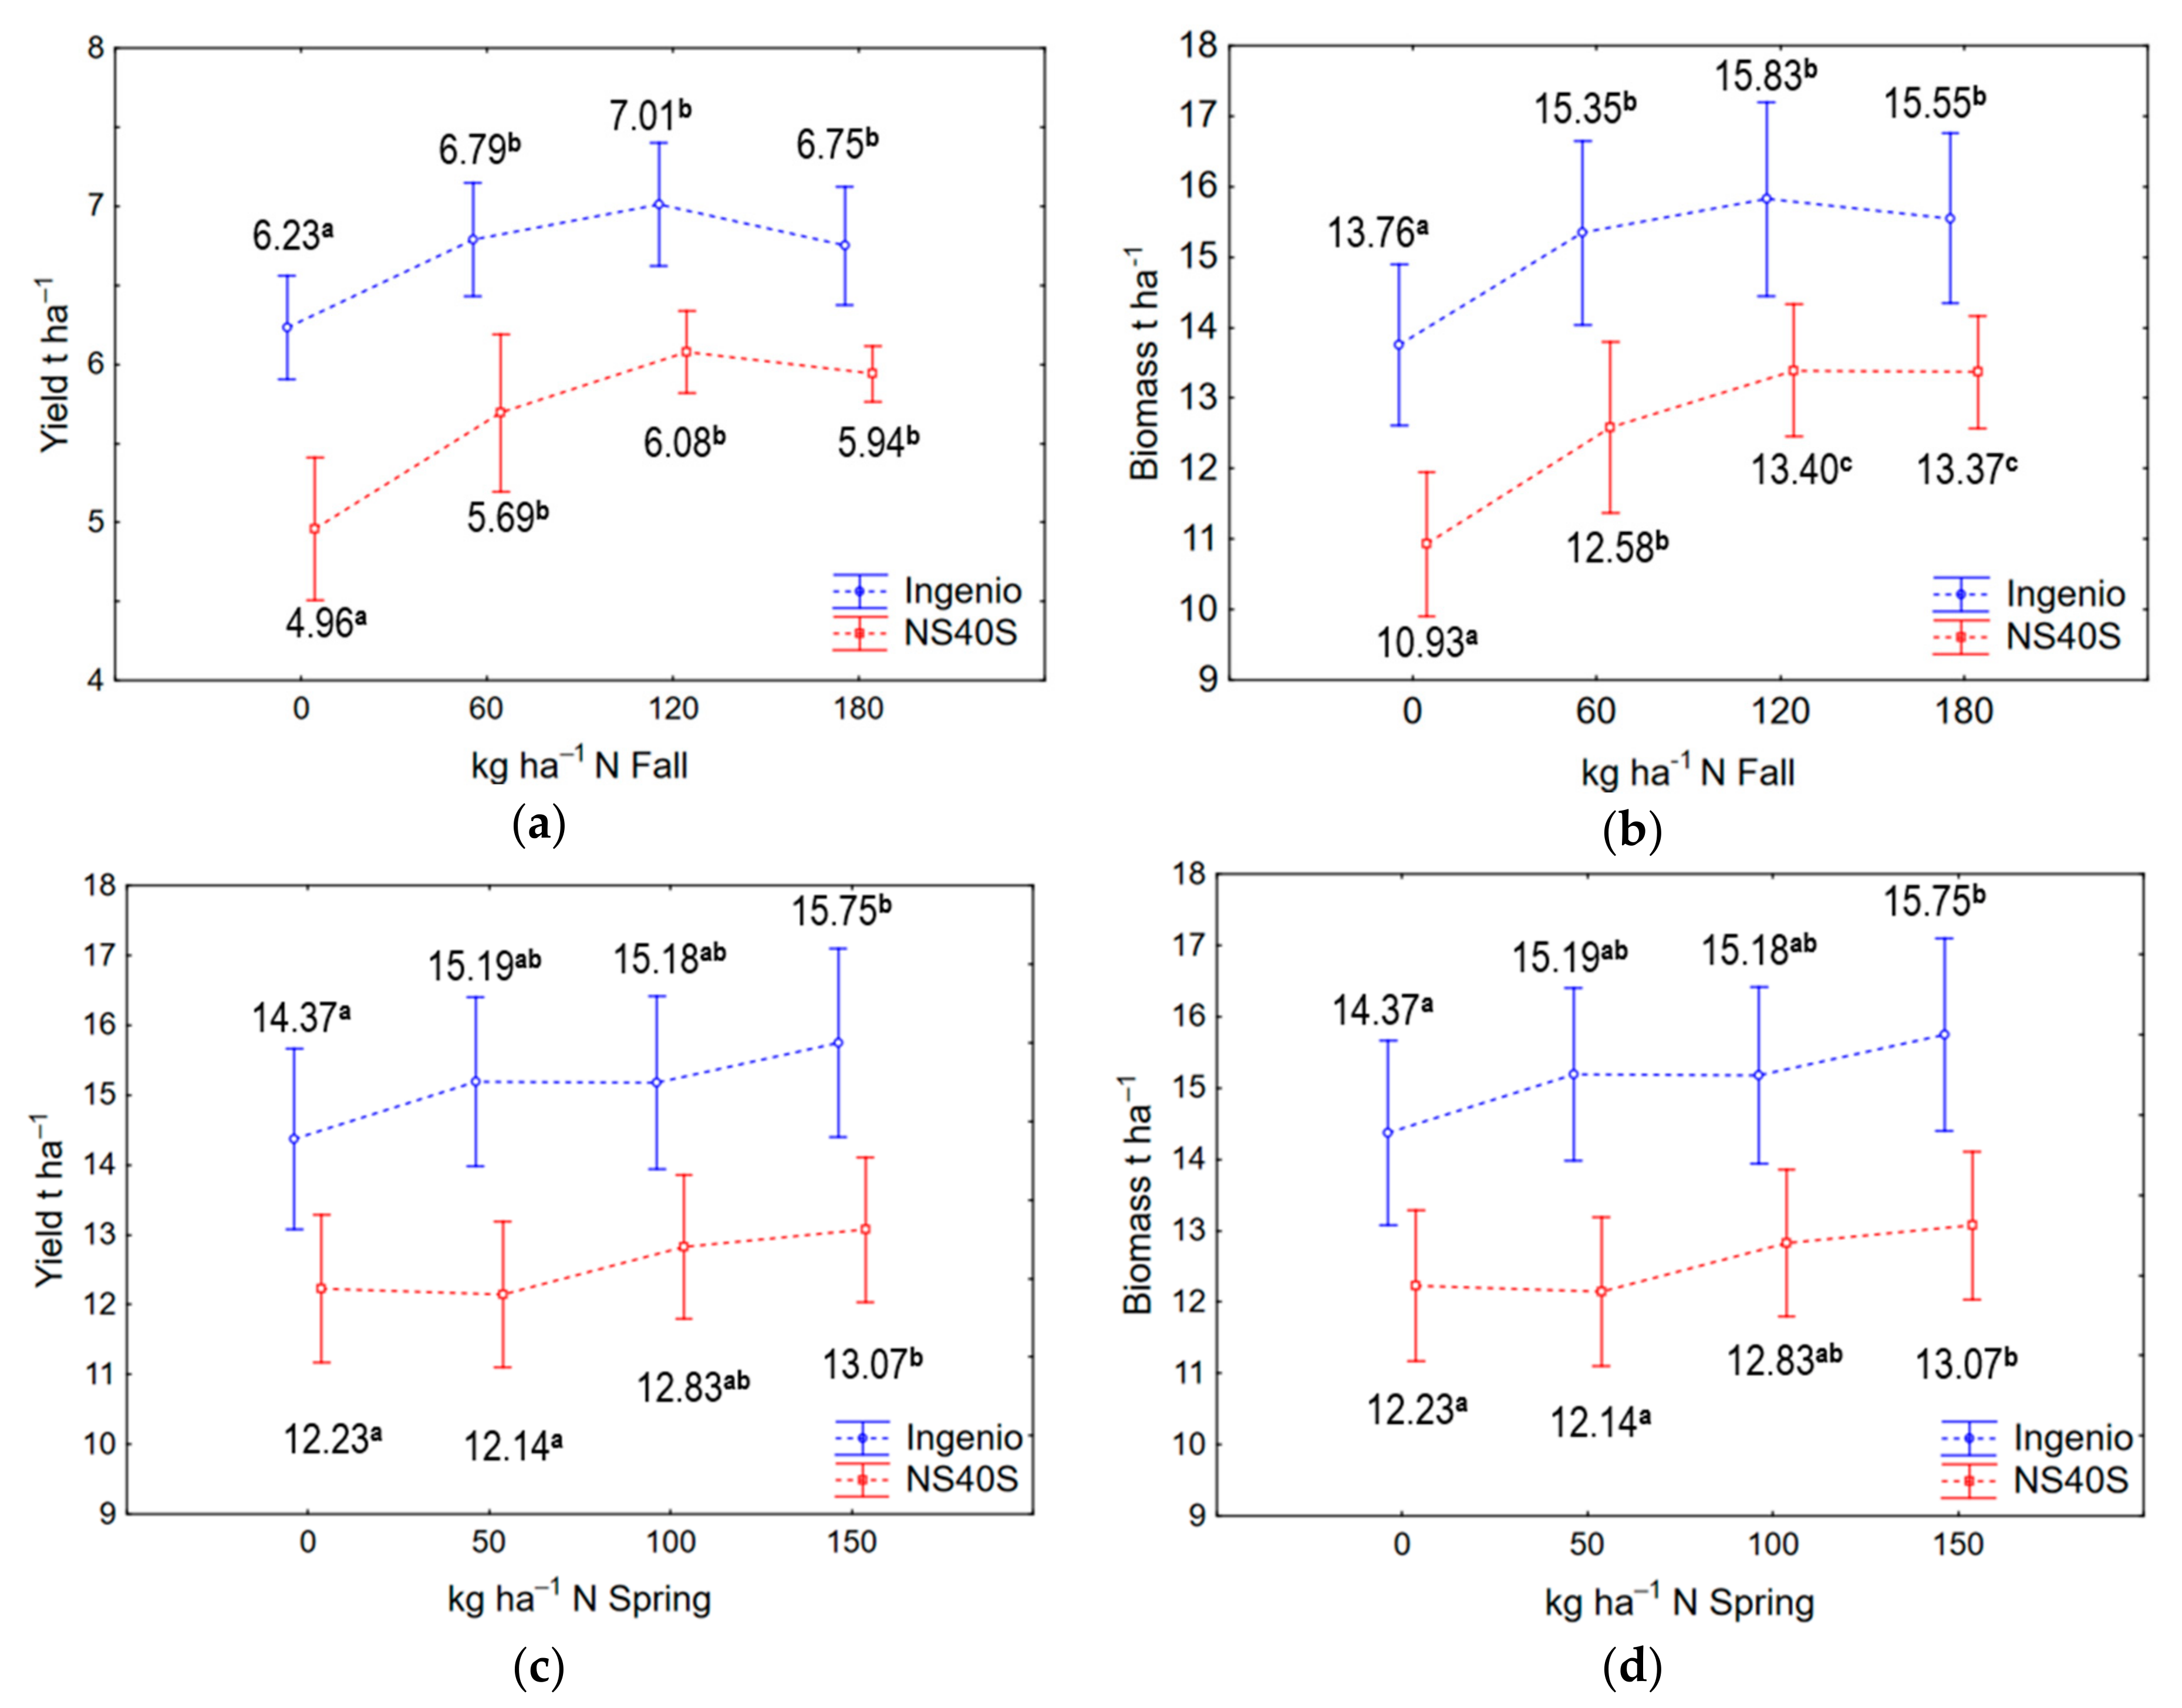
Arable land in the northern part of Serbia is considerably fertile, providing high yield potentials for wheat production even with poor fertilizer management. Nevertheless, high soil organic matter content makes the task of optimization of nitrogen management more difficult, due to temporal variability of soil nitrogen-releasing activities. In this study, it was observed that about 85% of seasonal fluctuations of yield and biomass production are caused by weather conditions. According to a multiyear study, the observed differences in response to applied nitrogen respecting grain and biomass production, suggest that foreign imported variety (Ingenio) demonstrated higher sensitivity to spring N fertilizer than domestic one (NS40S), and vice versa in the case of N fertilizer applied in fall. Fall N application (up to 120 kg ha−1) procured a reliable positive impact on yield and biomass.
The results do not support a rigid approach to the field practice of application of N fertilizer over time; hence it must be updated to respect the specifics of the grown genotypes. The spring N application had a low and unstable impact on wheat performance over the trial period, distinctive for specific genotype and environment conditions. For this reason, N fertilizer forms and application methods in the spring must be modified in such a way as to place or inject fertilizer directly into the soil, but it requires additional investment in new equipment, which would be the only cost-effective in the case of large farms. Low spring N utilization by the plants was also due to a relatively long rainfall absence from the time of spring top-dressing. According to this, the rainfall factor must be part of a holistic N management strategy on a global scale, although the forecast at the field level—especially during the spring season in the Vojvodina region—is quite unreliable, which leaves too much room for uncertainty. On clayey soils, under continental climate conditions, we suggest that 60–80% of the nitrogen in the form of urea should be applied in the fall, and the rest of nitrogen in the early spring by banding or dribbling liquid nitrogen fertilizer on the surface rather than broadcasting.

Author Contributions

Conceptualization, M.M.K. and A.C.T.; methodology, A.C.T., M.M.K., N.L.; software, M.M.K., D.R.; formal analysis, M.M.K., D.R. and A.C.T.; investigation, M.M.K., A.C.T., B.I., M.R. and D.B.; data curation, M.M.K., A.C.T., B.I., M.R. and D.B.; writing—original draft preparation, M.M.K. and A.C.T.; writing—review and editing, M.M.K., D.R. and A.C.T.; visualization, M.M.K.; supervision, M.M.K. and A.C.T.; project administration, A.C.T.; funding acquisition, M.M.K. All authors have read and agreed to the published version of the manuscript.

Funding

This research has received funding from the European Union’s Horizon 2020 research and innovation programmes under grant agreements No. 739570 (ANTARES) through which the general research topic was identified as part of the ANTARES Joint Strategic Research Agenda and No. 810775 (DRAGON) through which the specific theme was further conceptualized and investigated through the field work. The financial support of the Ministry of Education, Science and Technological Development of the Republic of Serbia is acknowledged: Grant No. 451-03-68/2020-14/ 200358 for authors N.L., D.B., M.R., B.I. and /200125 for authors M.M.K. and D.R.

Data Availability Statement

Not applicable.

Conflicts of Interest

The authors declare no conflict of interest.

References

  1. Statistical Yearbook of Republic of Serbia; Statistical Office of the Republic of Serbia: Belgrade, Serbia, 2020; pp. 214–220.
  2. Jaćimović, G. Optimization of Mineral Nutrition of Wheat, Depending on Weather Conditions during the Year. Ph.D. Thesis, University of Novi Sad, Novi Sad, Serbia, 2012. [Google Scholar]
  3. Fischer, T.; Byerlee, D.; Edmeades, G.O. Copy Yields and Global Food Security: Will Yield Increase Continue to Feed the World? Australian Centre for International Agricultural Research: Canberra, Australia, 2014; ISBN 978-1-925133-05-9. [Google Scholar]
  4. Ladha, J.K.; Pathak, H.; Krupnik, T.J.; Six, J.; van Kessel, C. Efficiency of fertilizer Nitrogen in Cereal production: Retrospects and prospects. Adv. Agron. 2005, 87, 85–156, ISBN 978-0-12-000785-1. [Google Scholar]
  5. Bogdanović, D. Mineralna Đubriva i Đubrenje; University of Novi Sad, Faculty of Agriculture: Novi Sad, Serbia, 2014. [Google Scholar]
  6. Jaenisch, B.R.; de Oliveira Silva, A.; DeWolf, E.; Ruiz-Diaz, D.A.; Lollato, R.P. Plant population and fungicide economically reduced winter wheat yield gap in Kansas. Agron. J. 2019, 111, 650–665. [Google Scholar] [CrossRef] [Green Version]
  7. Anbessa, Y.; Juskiw, P. Review: Strategies to Increase Nitrogen Use Efficiency of Spring Barley. Can. J. Plant. Sci. 2012, 92, 617–625. [Google Scholar] [CrossRef]
  8. Food and Agriculture Organization of the United Nations. World Fertilizer Trends and Outlook to 2020; FAO: Roma, Italy, 2017. [Google Scholar]
  9. Abedi, T.; Alemzadeh, A.; Seyed Abdolreza, K. Wheat Yield and grain protein response to Nitrogen amount and timing. Aust. J. Crop. Sci. 2011, 5, 330–336. [Google Scholar]
  10. SI, Z.; Zain, M.; Mehmood, F.; Wang, G.; Gao, Y. Effects of Nitrogen Application rate and irrigation regime on growth, yield, and water-Nitrogen use efficiency of drip-irrigated winter wheat in the North China plain. Agric. Water Manag. 2020, 321, 106002. [Google Scholar] [CrossRef]
  11. Raun, W.R.; Solie, J.B.; Johnson, G.V.; Stone, M.L.; Mullen, R.W.; Freeman, K.W.; Thomason, W.E.; Lukina, E.V. Improving Nitrogen Use efficiency in cereal grain production with optical sensing and variable rate application. Agron. J. 2002, 94, 6. [Google Scholar] [CrossRef] [Green Version]
  12. Lopez-Bellido, R.J.; Lopez-Bellido, L. Eficiency of Nitrogen in wheat under Mediterranean conditions: Effect of Tillage, crop rotation and N fertilization. Field Crop Res. 2001, 16, 31–46. [Google Scholar] [CrossRef]
  13. Ciampitti, I.A.; Vyn, T.J. Understanding Global and historical nutrient use efficiencies for closing Maize yield gaps. Agron. J. 2014, 106. [Google Scholar] [CrossRef] [Green Version]
  14. Setiyono, T.D.; Yang, H.; Walters, D.T.; Dobermann, A.; Ferguson, R.B.; Roberts, D.F.; Lyon, D.J.; Clay, D.E.; Cassman, K.G. Maize-N: A Decision tool for Nitrogen management in Maize. Agron. J. 2011, 103, 1276–1283. [Google Scholar] [CrossRef] [Green Version]
  15. Rhezali, A.; Lahlali, R. Nitrogen (N) Mineral Nutrition and Imaging Sensors for Determining N Status and requirements of Maize. J. Imaging 2017, 3, 51. [Google Scholar] [CrossRef] [Green Version]
  16. Heggenstaller, A.; Munaro, E.; Gunzenhauser, B. Agronomy Science-Research Summary 2019; Corteva Agriscience: Wilmington, DE, USA, 2019; pp. 104–108. [Google Scholar]
  17. Sarić, M.; Jocić, B. Biološki Potencijal Gajenih Biljaka u Agrofitocenozi u Zavisnosti od Mineralne Ishrane; SANU: Beograd, Serbia, 1993; ISBN 86-7025-179-5. [Google Scholar]
  18. de Oliveira Silva, A.; Ciampitti, I.A.; Slafer, G.A.; Lollato, R.P. Nitrogen Utilization efficiency in wheat: A Global perspective. Eur. J. Agron. 2020, 114, 126008. [Google Scholar] [CrossRef]
  19. Siller, A.; Hashemi, M.; Wise, C.; Smychkovich, A.; Darby, H. Date of planting and Nitrogen management for winter Malt Barley production in the Northeast, USA. Agronomy 2021, 11, 797. [Google Scholar] [CrossRef]
  20. Weih, M. A calculation tool for analyzing Nitrogen use efficiency in annual and perennial crops. Agronomy 2014, 4, 470–477. [Google Scholar] [CrossRef] [Green Version]
  21. Jovanović, M.; Pavić, D.; Mesaroš, M.; Stankov, U.; Pantelić, M.; Armenski, T.; Dolinaj, D.; Popov, S.; Ćosić, Đ.; Popović, L.; et al. Water shortage and drought monitoring in Bačka region (Vojvodina, North Serbia)—Setting-up measurement stations network. Geogr. Pannonica 2013, 17, 114–124. [Google Scholar] [CrossRef]
  22. Kostić, M.M.; Rakić, D.Z.; Savin, L.Đ.; Dedović, N.M.; Simikić, M.Đ. Application of an original soil tillage resistance sensor in spatial prediction of selected soil properties. Comput. Electron. Agric. 2016, 127, 615–624. [Google Scholar] [CrossRef]
  23. Raun, W.; Solie, J.; Stone, M. Independence of Yield potential and crop Nitrogen response. Precis. Agric. 2011, 12, 508–518. [Google Scholar] [CrossRef] [Green Version]
  24. Lüder, R.-M.H.; Qin, R.; Richner, W.; Stamp, P.; Streit, B.; Herrera, J.M.; Noulas, C. Small-scale variation in Nitrogen use efficiency parameters in winter wheat as affected by N Fertilization and tillage intensity. Sustainability 2020, 12, 3621. [Google Scholar] [CrossRef]
  25. Tyurin, I.V. New Volumetric Measuring Method of Humus Using Chromic Acid, 5th ed.; Pochvovedenie: Moscow, Russia, 1934. [Google Scholar]
  26. Montgomery, D. Design and Analysis of Experiments, 9th ed.; John Wiley & Sons: New York, NY, USA, 2017. [Google Scholar]
  27. Bokan, N.; Malešević, M. The planting density effect on wheat yield structure. Acta Agric. Serbica 2004, 9, 65–79. [Google Scholar]
  28. Soweers, K.; Pan, W.; Miller, B.; Smith, J. Nitrogen use efficiency of split Nitrogen applications in soft white winter wheat. Agron. J. 1994, 86, 942–948. [Google Scholar] [CrossRef]
  29. Brown, B.; Petrie, S. Irrigated hard winter wheat response to fall, spring, and late season applied Nitrogen. Field Crop Res. 2006, 96, 260–268. [Google Scholar] [CrossRef]
  30. Eck, V.E. Winter wheat response to Nitrogen and irrigation. Agron. J. 1988, 80, 902–908. [Google Scholar] [CrossRef]
  31. Tagarakis, A.C.; Ketterings, Q.M. In-season estimation of corn yield potential using proximal sensing. Agron. J. 2017, 109, 1323–1330. [Google Scholar] [CrossRef] [Green Version]
  32. Mahler, R.; Koehler, F.; Lutcher, L.K. Nitrogen source, timing of application, and placement: Effects on winter wheat production. Agron. J. 1994, 86, 637–642. [Google Scholar] [CrossRef]
  33. Haile, D.; Nigussie, D.; Ayana, A. Nitrogen use efficiency of bread wheat: Effects of Nitrogen rate and time of application. J. Soil Sci. Plant Nutr. 2012, 12, 389–409. [Google Scholar]
  34. Van Sanford, D.A.; MacKown, C.T. Variation in Nitrogen use efficiency among soft red winter wheat genotypes. Theoret. Appl. Genetics 1986, 72, 158–163. [Google Scholar] [CrossRef] [PubMed]
  35. Lu, Y.; Boswell, M.; Boswell, W.; Kneitz, S.; Klotz, B.; Savage, M.; Salinas, R.; Marks, R.; Regneri, J.; Postlethwait, J.; et al. Gene expression variation and parental Allele inheritance in a Xiphophorus interspecies hybridization model. PLoS Genet. 2018, 14, e1007875. [Google Scholar] [CrossRef] [PubMed]
  36. Le Gouis, J.; Béghin, D.; Heumez, E.; Pluchard, P. Genetic differences for Nitrogen uptake and Nitrogen utilisation efficiencies in winter wheat. Eur. J. Agron. 2000, 12, 163–173. [Google Scholar] [CrossRef]
  37. Singh, V.P.; Arora, A. Intraspecific Variation in Nitrogen Uptake and Nitrogen utilization efficiency in wheat (Triticum Aestivum L.). J. Agron. Crop. Sci. 2001, 186, 239–244. [Google Scholar] [CrossRef]
  38. Mirosavljević, M.; Momčilović, V.; Pržulj, N.; Maksimović, I.; Putnik-Delić, M. Dry matter accumulation of winter wheat and barley at different sowing dates. Ratar. Povrt. 2018, 55, 87–94. [Google Scholar] [CrossRef] [Green Version]
  39. Rahimi Eichi, V.; Okamato, M.; Haefele, S.M.; Jewell, N.; Brien, C.; Garnett, T.; Langridge, P. Understanding the Interactions between biomass, grain production and grain protein content in high and low protein wheat genotypes under controlled environments. Agronomy 2019, 9, 706. [Google Scholar] [CrossRef] [Green Version]
  40. Alcoz, M.; Hons, F.; Habby, V. Nitrogen fertilization timing effect on wheat production, Nitrogen uptake efficiency, and residual soil Nitrogen. Agron. J. 1993, 85, 1198–1203. [Google Scholar] [CrossRef]
  41. Aula, L.; Omara, P.; Oyebiyi, F.B.; Eickhoff, E.; Carpenter, J.; Nambi, E.; Fornah, A.; Raun, W.R. Improving winter wheat grain yield and Nitrogen use efficiency using Nitrogen application time and rate. Agrosyst. Geosci. Environ. 2021, 4. [Google Scholar] [CrossRef]
Figure 1. Climate data and weather; precipitation (a), average temperature (b), and minimal temperatures (c) in Ravno Selo, during 2018–2020 growing seasons (site-years 1, 3, and 4).
Agronomy 11 01413 g001
Figure 2. Weather data; precipitation (a), average temperature and minimal temperatures (b) in Bajmok, during 2018 growing season (site-year 2).
Agronomy 11 01413 g002
Figure 3. Contribution of the factors examined in the study (location-A, Fall N fertilizer application-B, Spring N fertilizer application-C) on yield and biomass of Ingenio (a) and NS40S (b) varieties in 2018.
Agronomy 11 01413 g003
Figure 4. The effects of location on yield (a) and biomass (b), fall N fertilizer application on yield (c) and biomass (d), and spring N fertilizer application on yield (e) and biomass (f) of Ingenio and NS40S varieties for 2018 growing season. The letters on the graph represent different classes obtained by ANOVA with p = 0.05 level of significance.
Agronomy 11 01413 g004
Figure 5. Contribution of partial variance of the factors (fall N fertilizer application, spring N fertilizer application) on yield and biomass of the Ingenio and NS40S varieties in 2019.
Agronomy 11 01413 g005
Figure 6. Effects of fall N fertilizer application (a,b) and spring N fertilizer application (c,d) on grain yield and biomass of Ingenio and NS40S wheat varieties for 2019 growing season. The letters on the graph represent different classes obtained by ANOVA with p = 0.05 level of significance.
Agronomy 11 01413 g006
Figure 7. Contribution of partial variance of the factors on yield and biomass of the Ingenio and NS40S varieties in 2020.
Agronomy 11 01413 g007
Figure 8. Effects of fall N fertilizer application (a,b) and spring N fertilizer application (c,d) on grain yield and biomass of Ingenio, NS40S, Futura, and Pobeda wheat varieties for 2020 growing season. The letters on the graph represent different classes obtained by ANOVA with p = 0.05 level of significance.
Agronomy 11 01413 g008
Figure 9. Contribution of the factors examined in the study on yield and biomass of Ingenio (a) and NS40S (b) varieties in the multiyear analysis (2018–2020).
Agronomy 11 01413 g009
Figure 10. Effects of seasonal climate circumstances on grain yield (a) and biomass (b) of Ingenio and NS40S wheat varieties. The letters on the graph represent different classes obtained by ANOVA with p = 0.05 level of significance.
Agronomy 11 01413 g010
Figure 11. Effects of fall N fertilizer application (a,b) and spring N fertilizer application (c,d) on grain yield and biomass of Ingenio, and NS40S wheat varieties for 2018–2020 growing seasons. The letters on the graph represent different classes obtained by ANOVA with p = 0.05 level of significance.
Agronomy 11 01413 g011
Table 1. Year, location, climate, and reference names of the study.
YearLocationGeolocation (WGS)Soil TypeKöppen–GeigerReference Name
2018Ravno Selo45°26′09.8″ N, 19°37′47.5″ ECalcic ChernozemDfbsite-year 1
2018Bajmok45°57′45.2″ N,19°24′37.2″ EGleyic ChernozemDfbsite-year 2
2019Ravno Selo45°26′06.1″ N, 19°37′59.4″ ECalcic ChernozemDfbsite-year 3
2020Ravno Selo45°27′25.4″ N, 19°37′49.5″ ECalcic ChernozemDfbsite-year 4
Table 2. Sowing dates, fertilizer application dates and harvest dates for the four site-years of the study.
Reference NameSowing DateFall Basic N Application DateSpring Top-Dress Application DateHarvest Date
site-year 1October 22ndOctober 27thMarch 15thJune 26th
site-year 2October 20thOctober 20thMarch 28thJuly 7th
site-year 3October 13thOctober 13thMarch 3rdJuly 5th
site-year 4October 11thOctober 11thFebruary 19thJuly 9th
Table 3. Experimental plan for the four site-years of the study.
Reference NameVarieties TestedRplBasic Application kgN ha−1Top-Dress kgN ha−1
site-year 1Ingenio, NS40S40, 30, 60, 120, 1800, 50, 100, 150
site-year 2Ingenio, NS40S40, 30, 60, 120, 1800, 50, 100, 150
site-year 3Ingenio, NS40S40, 60, 120, 1800, 50, 100, 150
site-year 4Ingenio, NS40S, Pobeda, Futura30, 60, 120, 1800, 50, 100, 150
Table 4. Results from the laboratory analysis of the soil samples collected from each site-year.
Soil ParameterSite-Year 1Site-Year 2Site-Year 3Site-Year 4
pH (KCl)7.287.337.437.29
pH (H2O)8.18.088.118.1
CaCO3 %13.6115.1711.4813.83
Organic Matter %3.913.284.054.46
N%0.20.160.20.22
AL-P2O5 mg/100g21.2525.3914.5517.1
AL-K2O mg/100g23.5821.1618.7419.9
Table 5. ANOVA table for the 2018 grain yield dataset.
IngenioNS40SdfIngenioNS40SIngenioNS40SIngenioNS40S
SourceSum of SquaresMean SquareF-Valuep-Value
Model18.5710.25151.240.6811.748.21<0.01 **<0.01 **
A1.022.6511.022.659.7131.880.005 **<0.01 **
B10.025.0842.511.2723.7715.27<0.01 **<0.01 **
C3.740.9831.250.3311.843.94<0.01 **0.02 *
AB2.740.7340.680.186.512.20.001 **0.09
AC1.030.7930.340.263.263.180.04 *0.04 *
Residual2.532240.100.08
Cor Total21.112.2439
A—Location; B—Fall N application and C—Spring N application. * Significant at the 0.05 probability level. ** Significant at the 0.01 probability level.
Table 6. ANOVA table for biomass in 2018.
IngenioNS40SdfIngenioNS40SIngenioNS40SIngenioNS40S
SourceSum of SquaresMean SquareF-Valuep-Value
Model114.7951.24157.653.4218.418.37<0.01 **<0.01 **
A18.729.36118.729.3645.0422.95<0.01 **<0.01 **
B57.328.38414.327.134.4617.39<0.01 **<0.01 **
C13.923.8934.641.311.163.18<0.01 **0.04 *
AB22.615.9445.651.4913.63.64<0.01 **0.02 *
AC2.233.6530.7441.221.792.990.180.051
Residual9.989.79240.41570.408
Cor Total124.7661.0339
A—Location; B—Fall N application and C—Spring N application. * Significant at the 0.05 probability level. ** Significant at the 0.01 probability level.
Table 7. ANOVA table for grain yield in 2019.
IngenioNS40SdfIngenioNS40SIngenioNS40SIngenioNS40S
SourceSum of SquaresMean SquareF-Valuep-Value
Model7.4658.35150.503.891.137.650.38<0.01 **
A1.0448.3230.3516.110.7931.670.51<0.01 **
B1.852.5530.620.851.401.670.260.19
AB4.567.4890.510.831.151.640.360.15
Residual13.2415.26300.440.51
Cor Total21.4175.3347
A—Fall N application and B—Spring N application ** Significant at the 0.01 probability level.
Table 8. ANOVA table for biomass in 2019.
IngenioNS40SdfIngenioNS40SIngenioNS40SIngenioNS40S
SourceSum of SquaresMean SquareF-Valuep-Value
Model29.53224.68151.9714.981.326.880.25<0.01 **
A12.23182.3434.0860.782.7327.920.06<0.01 **
B2.2619.9030.756.630.513.050.680.04 *
AB15.0422.4491.672.491.121.150.380.36
Residual44.7765.30301.492.18
Cor Total77.51294.8347
A—Fall N application and B—Spring N application. * Significant at the 0.05 probability level. ** Significant at the 0.01 probability level.
Table 9. ANOVA table for grain yield in 2020.
IngenioNS40SdfIngenioNS40SIngenioNS40SIngenioNS40S
SourceSum of SquaresMean SquareF-Valuep-Value
Model30.8023.85152.051.593.743.54<0.01 **<0.01 **
A13.0212.6234.344.217.919.37<0.01 **<0.01 **
B3.612.231.200.732.191.630.110.20
AB14.179.0291.571.002.872.23<0.01 **<0.05 *
Residual16.4613.47300.550.45
Cor Total49.9845.7247
A—Fall N application and B—Spring N application. * Significant at the 0.05 probability level. ** Significant at the 0.01 probability level.
Table 10. ANOVA table for biomass of NS40S in 2020.
IngenioNS40SdfIngenioNS40SIngenioNS40SIngenioNS40S
SourceSum of SquaresMean SquareF-Valuep-Value
Model268.85102.331517.926.824.243.26<0.01 **<0.01 **
A106.4352.00335.4817.338.398.28<0.01 **<0.01 **
B38.0610.34312.693.453.001.660.04 *0.20
AB124.3539.98913.824.443.272.12<0.01 **0.06
Residual126.8762.80304.232.09
Cor Total424.43192.7847
A—Fall N application and B—Spring N application. * Significant at the 0.05 probability level. ** Significant at the 0.01 probability level.
Table 11. ANOVA table for grain yield for the three-year time range (2018–2020).
IngenioNS40SdfIngenioNS40SIngenioNS40SIngenioNS40S
SourceSum of SquaresMean SquareF-Valuep-Value
Model68.2275.9232.973.313.0214.37<0.01 **<0.01 **
A58.552.52229.2526.26128.42114.36<0.01 **<0.01 **
B3.928.9531.312.985.7313<0.01 **<0.01 **
C2.040.879830.68050.29332.991.280.0510.305
AB1.4912.2760.24842.041.098.90.396<0.01 **
BC2.281.2790.25320.14161.110.61670.39190.77
Residual5.475.51240.22780.2296
Cor Total73.6981.4147
A—Year; B—Fall N application and C—Spring N application. ** Significant at the 0.01 probability level.
Table 12. ANOVA table for biomass for the three-year time range (2018–2020).
IngenioNS40SdfIngenioNS40SIngenioNS40SIngenioNS40S
SourceSum of SquaresMean SquareF-Valuep-Value
Model838.27563.492336.4524.4928.4432.62<0.01 **< 0.01 **
A759.33464.982379.66232.49296.26309.56<0.01 **< 0.01 **
B30.9648.24310.3216.088.0521.41<0.01 **<0.01 **
C11.657.4133.882.473.033.280.049 *0.04 *
AB11.7333.21361.965.51.537.370.21<0.01 **
BC24.69.6392.731.072.131.420.0670.23
Residual30.7618.02241.280.75
Cor Total869.02581.5147
A—Year; B—Fall N application and C—Spring N application. * Significant at the 0.05 probability level. ** Significant at the 0.01 probability level.
Publisher’s Note: MDPI stays neutral with regard to jurisdictional claims in published maps and institutional affiliations.

