
Genetic Dissection of Phosphorous Uptake and Utilization Efficiency Traits Using GWAS in Mungbean

 ,
,  ,
,  , , , ,
Abstract
1. Introduction
2. Materials and Methods
2.1. Plant Materials and Experimental Conditions
2.2. Trait Measurement
2.3. Large Scale Genotyping of Association Panel Genotypes
2.4. Depiction of Linkage Disequilibrium, Phylogenetic Details, and Population Structure
2.5. GWAS for P Use and P Utilization Efficiency-Associated Traits in Mungbean
2.6. Digital Gene Expression Analysis and Validation for the Candidate Gene
3. Results
3.1. Phenotypic Variation for P Uptake and P Utilization Efficiency-Related Traits
3.2. Linkage Disequilibrium, Phylogenetic Tree and Population Structure of AM Panel Genotypes
3.3. Candidate Gene Identification for PUse and PUtilization Traits in Mungbean Using Genome-Wide GBS
3.4. Delineation of P Utative Candidate Genes for PUptake and P Utilization Efficiency Traits in Mungbean
4. Discussion
5. Conclusions
Supplementary Materials
Author Contributions
Funding
Institutional Review Board Statement
Informed Consent Statement
Data Availability Statement
Acknowledgments
Conflicts of Interest
References
- Nair, R.; Schreinemachers, P. Global Status and Economic Importance of Mungbean; Springer: Cham, Switherlands, 2020; pp. 1–8. [Google Scholar] [CrossRef]
- Rahman, M.; Mostofa, M.G.; Rahman, A.; Islam, R.; Keya, S.S.; Das, A.K.; Miah, G.; Kawser, A.Q.M.R.; Ahsan, S.M.; Hashem, A.; et al. Acetic acid: A cost-effective agent for mitigation of seawater-induced salt toxicity in mung bean. Sci. Rep. 2019, 9, 1–15. [Google Scholar] [CrossRef] [PubMed]
- Dahiya, P.K.; Linnemann, A.R.; Van Boekel, M.; Khetarpaul, N.; Grewal, R.B.; Nout, M.J. Mung bean: Technological and nutri-tional potential. Crit. Rev. Food Sci. 2015, 15, 670–688. [Google Scholar] [CrossRef] [PubMed]
- Kim, S.K.; Nair, R.M.; Lee, J.; Lee, S.-H. Genomic resources in mungbean for future breeding programs. Front. Plant Sci. 2015, 6, 626. [Google Scholar] [CrossRef] [PubMed]
- Blair, M.W.; Wu, X.; Bhandari, D.; Zhang, X.; Hao, J. Role of legumes for and as horticultural crops in sustainable agriculture. In Organic Farming for Sustainable Agriculture; Springer: Cham, Switzerland, 2016; pp. 185–211. [Google Scholar] [CrossRef]
- Asaduzzaman, M.D.; Karim, M.F.; Ullah, M.J.; Mirza, H. Response of mungbean (Vignaradiata L.) to nitrogen and irrigation management. Am. Eurasian J. Sci. Res. 2008, 3, 40–43. [Google Scholar]
- Zhang, D.; Song, H.; Cheng, H.; Hao, D.; Wang, H.; Kan, G.; Jin, H.; Yu, D. The Acid Phosphatase-Encoding Gene GmACP1 Contributes to Soybean Tolerance to Low-Phosphorus Stress. PLoS Genet. 2014, 10, e1004061. [Google Scholar] [CrossRef]
- Menzies, N.; Lucia, S. The science of phosphorus nutrition: Forms in the soil, plant uptake, and plant response. Available online: https://grdc.com.au/resources-and-publications/grdc-update-papers/tab-content/grdc-update-papers/2009/02/the-science-of-phosphorus-nutrition-forms-in-the-soil-plant-uptake-and-plant-response (accessed on 20 March 2021).
- Shen, J.; Yuan, L.; Zhang, J.; Li, H.; Bai, Z.; Chen, X.; Zhang, W.; Zhang, F. Phosphorus Dynamics: From Soil to Plant. Plant Physiol. 2011, 156, 997–1005. [Google Scholar] [CrossRef] [PubMed]
- Hinsinger, P. Bioavailability of soil inorganic P in the rhizosphere as affected by root-induced chemical changes: A review. Plant Soil 2001, 237, 173–195. [Google Scholar] [CrossRef]
- Kirkby, E.A.; Johnston, A.E.J. Soil and fertilizer phosphorus in relation to crop nutrition. Plant Ecophysiol. 2008, 177–223. [Google Scholar] [CrossRef]
- Adhya, T.K.; Kumar, N.; Reddy, G.; Podile, A.R.; Bee, H.; Samantaray, B. Microbial mobilization of soil phosphorus and sus-tainable P management in agricultural soils. Curr. Sci. 2015, 108, 1280–1287. [Google Scholar]
- Desnos, T. Root branching responses to phosphate and nitrate. Curr. Opin. Plant Biol. 2008, 11, 82–87. [Google Scholar] [CrossRef]
- Ramaekers, L.; Remans, R.; Rao, I.M.; Blair, M.W.; Vanderleyden, J. Strategies for improving phosphorus acquisition efficiency of crop plants. Field Crop. Res. 2010, 117, 169–176. [Google Scholar] [CrossRef]
- GPRI. Declaration on Global Phosphorus Security. 2009. Available online: http://www.naturalcapitalproject.org (accessed on 10 December 2018).
- Van De Wiel, C.C.M.; Van Der Linden, C.G.; Scholten, O.E. Improving phosphorus use efficiency in agriculture: Opportunities for breeding. Euphytica 2016, 207, 1–22. [Google Scholar] [CrossRef]
- Food and Agriculture Organization of the United Nations. FAOSTAT. Available online: http://www.fao.org/faostat/en/#home (accessed on 12 March 2021).
- Syers, J.K.; Johnston, A.; Curtin, D. Efficiency of Soil and Fertilizer Phosphorus Use: Reconciling Changing Concepts of Soil Phosphorus Behaviour with Agronomic Information; Food and Agriculture Organization of The United Nations (FAO): Rome, Italy, 2019; 108p. [Google Scholar]
- Hammond, J.P.; Broadley, M.; White, P.J.; King, G.; Bowen, H.C.; Hayden, R.; Meacham, M.C.; Mead, A.; Overs, T.; Spracklen, W.P.; et al. Shoot yield drives phosphorus use efficiency in Brassica oleracea and correlates with root architecture traits. J. Exp. Bot. 2009, 60, 1953–1968. [Google Scholar] [CrossRef]
- Reddy, V.R.P.; Das, S.; Dikshit, H.K.; Mishra, G.P.; Aski, M.; Meena, S.K.; Singh, A.; Pandey, R.; Singh, M.P.; Tripathi, K.; et al. Genome-Wide Association Analysis for Phosphorus Use Efficiency Traits in Mungbean (Vignaradiata L. Wilczek) Using Genotyping by Sequencing Approach. Front. Plant Sci. 2020, 11, 537766. [Google Scholar] [CrossRef]
- Wang, X.; Shen, J.; Liao, H. Acquisition or utilization, which is more critical for enhancing phosphorus efficiency in modern crops? Plant Sci. 2010, 179, 302–306. [Google Scholar] [CrossRef]
- Mendes, F.F.; Guimarães, L.J.M.; Guimarães, C.T.; Souza, J.C.; Guimarães, P.E.O.; Parentoni, S.N. Genetic control of traits related to phosphorus use efficiency in tropical maize. Crop. Breed. Appl. Biotechnol. 2015, 15, 59–65. [Google Scholar] [CrossRef][Green Version]
- James, R.; Weligama, C.; Verbyla, K.; Ryan, P.R.; Rebetzke, G.; Rattey, A.; Richardson, A.E.; Delhaize, E. Rhizosheaths on wheat grown in acid soils: Phosphorus acquisition efficiency and genetic control. J. Exp. Bot. 2016, 67, 3709–3718. [Google Scholar] [CrossRef] [PubMed]
- Myles, S.; Peiffer, J.; Brown, P.J.; Ersoz, E.S.; Zhang, Z.; Costich, D.E.; Buckler, E. Association Mapping: Critical Considerations Shift from Genotyping to Experimental Design. Plant Cell 2009, 21, 2194–2202. [Google Scholar] [CrossRef] [PubMed]
- Shendure, J.; Ji, H. Next-generation DNA sequencing. Nat. Biotechnol. 2008, 26, 1135–1145. [Google Scholar] [CrossRef] [PubMed]
- Kumar, S.; Banks, T.W.; Cloutier, S. SNP Discovery through Next-Generation Sequencing and Its Applications. Int. J. Plant Genom. 2012, 2012, 1–15. [Google Scholar] [CrossRef]
- He, J.; Zhao, X.; Laroche, A.; Lu, Z.-X.; Liu, H.; Li, Z. Genotyping-by-sequencing (GBS), an ultimate marker-assisted selection (MAS) tool to accelerate plant breeding. Front. Plant Sci. 2014, 5, 484. [Google Scholar] [CrossRef]
- Kang, Y.J.; Kim, S.K.; Kim, M.Y.; Lestari, P.; Kim, K.H.; Ha, B.-K.; Jun, T.H.; Hwang, W.J.; Lee, T.; Lee, J.; et al. Genome sequence of mungbean and insights into evolution within Vigna species. Nat. Commun. 2014, 5, 5443. [Google Scholar] [CrossRef]
- Poland, J.A.; Rife, T. Genotyping-by-Sequencing for Plant Breeding and Genetics. Plant Genome 2012, 5, 92–102. [Google Scholar] [CrossRef]
- McCarthy, M.I.; Hirschhorn, J.N. Genome-wide association studies: Potential next steps on a genetic journey. Hum. Mol. Genet. 2008, 17, R156–R165. [Google Scholar] [CrossRef] [PubMed]
- Alqudah, A.M.; Sallam, A.; Baenziger, P.S.; Börner, A. GWAS: Fast-forwarding gene identification and characterization in temperate Cereals: Lessons from Barley—A review. J. Adv. Res. 2020, 22, 119–135. [Google Scholar] [CrossRef]
- Ning, L.; Kan, G.; Du, W.; Guo, S.; Wang, Q.; Zhang, G.; Cheng, H.; Yu, D. Association analysis for detecting significant single nucleotide polymorphisms for phosphorus-deficiency tolerance at the seedling stage in soybean [Glycine max (L.) Merr.]. Breed. Sci. 2016, 66, 191–203. [Google Scholar] [CrossRef] [PubMed]
- Ravelombola, W.; Qin, J.; Shi, A.; Lu, W.; Weng, Y.; Xiong, H.; Yang, W.; Bhattarai, G.; Mahamane, S.; Payne, W.A.; et al. Association mapping revealed SNP markers for adaptation to low phosphorus conditions and rock phosphate response in USDA cowpea (Vignaunguiculata (L.) Walp.) germplasm. Euphytica 2017, 213, 183. [Google Scholar] [CrossRef]
- Sivasakthi, K.; Tharanya, M.; Kholová, J.; Muriuki, R.W.; Thirunalasundari, T.; Vadez, V. Chickpea Genotypes Contrasting for Vigor and Canopy Conductance Also Differ in Their Dependence on Different Water Transport Pathways. Front. Plant Sci. 2017, 8, 1663. [Google Scholar] [CrossRef]
- Reddy, V.R.P.; Aski, M.S.; Mishra, G.P.; Dikshit, H.K.; Singh, A.; Pandey, R.; Singh, M.P.; Ramtekey, V.; Rai, N.; Nair, R.M.; et al. Genetic variation for root architectural traits in response to phosphorus deficiency in mungbean at the seedling stage. PLoS ONE 2020, 15, e0221008. [Google Scholar] [CrossRef]
- Meena, S.K. Interactive Effects of Phosphorus Nutrition and Elevated CO2 on Physiology and Growth of Mungbean (Vigna radiate Wilczek L.). Master’s Thesis, IARI, Delhi, India, 2012. Available online: http://krishikosh.egranth.ac.in/handle/1/77822 (accessed on 12 March 2021).
- Murphy, J.; Riley, J. A modified single solution method for the determination of phosphate in natural waters. Anal. Chim. Acta 1962, 27, 31–36. [Google Scholar] [CrossRef]
- Wang, J.; Dun, X.; Shi, J.; Wang, X.; Liu, G.; Wang, H. Genetic Dissection of Root Morphological Traits Related to Nitrogen Use Efficiency in Brassica napus L. under Two Contrasting Nitrogen Conditions. Front. Plant Sci. 2017, 8, 1709. [Google Scholar] [CrossRef]
- Saxena, M.S.; Bajaj, D.; Das, S.; Kujur, A.; Kumar, V.; Singh, M.; Bansal, K.C.; Tyagi, A.K.; Parida, S.K. An Integrated Genomic Approach for Rapid Delineation of Candidate Genes Regulating Agro-Morphological Traits in Chickpea. DNA Res. 2014, 21, 695–710. [Google Scholar] [CrossRef]
- Tamura, K.; Stecher, G.; Peterson, D.; Filipski, A.; Kumar, S. MEGA6: Molecular Evolutionary Genetics Analysis Version 6.0. Mol. Biol. Evol. 2013, 30, 2725–2729. [Google Scholar] [CrossRef]
- Liu, K.; Muse, S.V. PowerMarker: An integrated analysis environment for genetic marker analysis. Bioinformatics 2005, 21, 2128–2129. [Google Scholar] [CrossRef] [PubMed]
- Upadhyaya, H.D.; Bajaj, D.; Srivastava, R.; Daware, A.; Basu, U.; Tripathi, S.; Bharadwaj, C.; Tyagi, A.K.; Parida, S.K. Genetic dissection of plant growth habit in chickpea. Funct. Integr. Genom. 2017, 17, 711–723. [Google Scholar] [CrossRef] [PubMed]
- Austin, R.S.; Hiu, S.; Waese, J.; Ierullo, M.; Pasha, A.; Wang, T.T.; Fan, J.; Foong, C.; Breit, R.; Desveaux, D.; et al. New BAR tools for mining expression data and exploringCis-elements inArabidopsis thaliana. Plant J. 2016, 88, 490–504. [Google Scholar] [CrossRef]
- O’Rourke, J.A.; Iniguez, L.P.; Fu, F.; Bucciarelli, B.; Miller, S.S.; A Jackson, S.; E McClean, P.; Li, J.; Dai, X.; Zhao, P.X.; et al. An RNA-Seq based gene expression atlas of the common bean. BMC Genom. 2014, 15, 866. [Google Scholar] [CrossRef]
- Noble, T.J.; Tao, Y.; Mace, E.S.; Williams, B.; Jordan, D.; Douglas, C.A.; Mundree, S.G. Characterization of Linkage Disequilibrium and Population Structure in a Mungbean Diversity Panel. Front. Plant Sci. 2018, 8, 2102. [Google Scholar] [CrossRef]
- Zeng, H.; Zhang, X.; Zhang, X.; Pi, E.; Xiao, L.; Zhu, Y. Early Transcriptomic Response to Phosphate Deprivation in Soybean Leaves as Revealed by RNA-Sequencing. Int. J. Mol. Sci. 2018, 19, 2145. [Google Scholar] [CrossRef]
- Giehl, R.F.; Von Wirén, N. Root Nutrient Foraging. Plant Physiol. 2014, 166, 509–517. [Google Scholar] [CrossRef] [PubMed]
- Bhadouria, J.; Singh, A.P.; Mehra, P.; Verma, L.; Srivastawa, R.; Parida, S.K.; Giri, J. Identification of Purple Acid Phosphatases in Chickpea and Potential Roles of CaPAP7 in Seed Phytate Accumulation. Sci. Rep. 2017, 7, 1–12. [Google Scholar] [CrossRef]
- Alder, A.; Jamil, M.; Marzorati, M.; Bruno, M.; Vermathen, M.; Bigler, P.; Ghisla, S.; Bouwmeester, H.; Beyer, P.; Al-Babili, S. The Path from -Carotene to Carlactone, a Strigolactone-Like Plant Hormone. Science 2012, 335, 1348–1351. [Google Scholar] [CrossRef]
- Zeng, D.-E.; Hou, P.; Xiao, F.; Liu, Y. Overexpression of Arabidopsis XERICO gene confers enhanced drought and salt stress tolerance in rice (Oryza Sativa L.). J. Plant Biochem. Biotechnol. 2013, 24, 56–64. [Google Scholar] [CrossRef]
- Dong, J.; Piñeros, M.A.; Li, X.; Yang, H.; Liu, Y.; Murphy, A.S.; Kochian, L.V.; Liu, D. An Arabidopsis ABC Transporter Mediates Phosphate Deficiency-Induced Remodeling of Root Architecture by Modulating Iron Homeostasis in Roots. Mol. Plant 2017, 10, 244–259. [Google Scholar] [CrossRef] [PubMed]
- Liu, Y.; Xie, Y.; Wang, H.; Ma, X.; Yao, W.; Wang, H. Light and Ethylene Coordinately Regulate the Phosphate Starvation Response through Transcriptional Regulation of PHOSPHATE STARVATION RESPONSE1. Plant Cell 2017, 29, 2269–2284. [Google Scholar] [CrossRef]
- Hammond, J.P.; White, P.J. Sugar Signaling in Root Responses to Low Phosphorus Availability. Plant Physiol. 2011, 156, 1033–1040. [Google Scholar] [CrossRef] [PubMed]
- Li, J.; Zhang, M.; Sun, J.; Mao, X.; Wang, J.; Liu, H.; Zheng, H.; Li, X.; Zhao, H.; Zou, D. Heavy Metal Stress-Associated Proteins in Rice and Arabidopsis: Genome-Wide Identification, Phylogenetics, Duplication, and Expression Profiles Analysis. Front. Genet. 2020, 11, 477. [Google Scholar] [CrossRef]
- Sirohi, G.; Pandey, B.K.; Deveshwar, P.; Giri, J. Emerging Trends in Epigenetic Regulation of Nutrient Deficiency Response in Plants. Mol. Biotechnol. 2016, 58, 159–171. [Google Scholar] [CrossRef]
- Nuruzzaman, M.; Sharoni, A.M.; Kikuchi, S. Roles of NAC transcription factors in the regulation of biotic and abiotic stress responses in plants. Front. Microbiol. 2013, 4, 248. [Google Scholar] [CrossRef]
- Hsieh, L.-C.; Lin, S.-I.; Shih, A.C.-C.; Chen, J.-W.; Lin, W.-Y.; Tseng, C.-Y.; Li, W.-H.; Chiou, T.-J. Uncovering Small RNA-Mediated Responses to Phosphate Deficiency in Arabidopsis by Deep Sequencing. Plant Physiol. 2009, 151, 2120–2132. [Google Scholar] [CrossRef]
- Gamuyao, R.; Chin, J.H.; Pariasca-Tanaka, J.; Pesaresi, P.; Catausan, S.; Dalid, C.; Slamet-Loedin, I.; Tecson-Mendoza, E.M.; Wissuwa, M.; Heuer, S. The protein kinase Pstol1 from traditional rice confers tolerance of phosphorus deficiency. Nat. Cell Biol. 2012, 488, 535–539. [Google Scholar] [CrossRef]
- Muro, K.; Matsuura-Tokita, K.; Tsukamoto, R.; Kanaoka, M.M.; Ebine, K.; Higashiyama, T.; Nakano, A.; Ueda, T. ANTH domain-containing proteins are required for the pollen tube plasma membrane integrity via recycling ANXUR kinases. Commun. Biol. 2018, 1, 1–9. [Google Scholar] [CrossRef]
- Huang, W.; Huang, Y.; Li, M.-Y.; Wang, F.; Xu, Z.-S.; Xiong, A.-S. Dof transcription factors in carrot: Genome-wide analysis and their response to abiotic stress. Biotechnol. Lett. 2015, 38, 145–155. [Google Scholar] [CrossRef]
- Renna, L.; Hanton, S.L.; Stefano, G.; Bortolotti, L.; Misra, V.; Brandizzi, F. Identification and characterization of AtCASP, a plant transmembrane Golgi matrix protein. Plant Mol. Biol. 2005, 58, 109–122. [Google Scholar] [CrossRef]
- Rose, T.J.; Wissuwa, M. Rethinking Internal Phosphorus Utilization Efficiency. Adv. Agron. 2012, 185–217. [Google Scholar] [CrossRef]
- Wissuwa, M.; Ae, N. Genotypic variation for tolerance to phosphorus deficiency in rice and the potential for its exploitation in rice improvement. Plant Breed. 2001, 120, 43–48. [Google Scholar] [CrossRef]
- Valizadeh, G.R.; Rengel, Z.; Rate, A.W. Wheat genotypes differ in growth and phosphorus uptake when supplied with different sources and rates of phosphorus banded or mixed in soil in pots. Aust. J. Exp. Agric. 2002, 42, 1103–1111. [Google Scholar] [CrossRef]
- Wissuwa, M.; Kondo, K.; Fukuda, T.; Mori, A.; Rose, M.T.; Pariasca-Tanaka, J.; Kretzschmar, T.; Haefele, S.M.; Rose, T.J. Unmasking Novel Loci for Internal Phosphorus Utilization Efficiency in Rice Germplasm through Genome-Wide Association Analysis. PLoS ONE 2015, 10, e0124215. [Google Scholar] [CrossRef] [PubMed]
- Yuan, Y.; Gao, M.; Zhang, M.; Zheng, H.; Zhou, X.; Guo, Y.; Zhao, Y.; Kong, F.; Li, S. QTL Mapping for Phosphorus Efficiency and Morphological Traits at Seedling and Maturity Stages in Wheat. Front. Plant Sci. 2017, 8, 614. [Google Scholar] [CrossRef] [PubMed]
- Da Silva, D.A.; Esteves, J.A.D.F.; Gonçalves, J.G.R.; Azevedo, C.V.G.; Ribeiro, T.; Chiorato, A.F.; Carbonell, S.A.M. Evaluation of common bean genotypes for phosphorus use efficiency in Eutrophic Oxisol. Bragantia 2016, 75, 152–163. [Google Scholar] [CrossRef]
- Wang, Q.; Yuan, Y.; Liao, Z.; Jiang, Y.; Wang, Q.; Zhang, L.; Gao, S.; Wu, F.; Li, M.; Xie, W.; et al. Genome-Wide Association Study of 13 Traits in Maize Seedlings under Low Phosphorus Stress. Plant Genome 2019, 12, 190039-13. [Google Scholar] [CrossRef]
- Zhou, Z.; Jiang, Y.; Wang, Z.; Gou, Z.; Lyu, J.; Li, W.; Yu, Y.; Shu, L.; Zhao, Y.; Ma, Y.; et al. Resequencing 302 wild and cultivated accessions identifies genes related to domestication and improvement in soybean. Nat. Biotechnol. 2015, 33, 408–414. [Google Scholar] [CrossRef]
- Basu, U.; Srivastava, R.; Bajaj, D.; Thakro, V.; Daware, A.; Malik, N.; Upadhyaya, H.D.; Parida, S.K. Genome-wide generation and genotyping of informative SNPs to scan molecular signatures for seed yield in chickpea. Sci. Rep. 2018, 8, 1–11. [Google Scholar] [CrossRef]
- Ekujur, A.; Ebajaj, D.; Eupadhyaya, H.D.; Das, S.; Ranjan, R.; Eshree, T.; Saxena, M.S.; Ebadoni, S.; Kumar, V.; Etripathi, S.; et al. Employing genome-wide SNP discovery and genotyping strategy to extrapolate the natural allelic diversity and domestication patterns in chickpea. Front. Plant Sci. 2015, 6, 162. [Google Scholar] [CrossRef]
- Upadhyaya, H.D.; Bajaj, D.; Narnoliya, L.; Das, S.; Kumar, V.; Gowda, C.L.L.; Sharma, S.; Tyagi, A.K.; Parida, S.K. Genome-Wide Scans for Delineation of Candidate Genes Regulating Seed-Protein Content in Chickpea. Front. Plant Sci. 2016, 7, 302. [Google Scholar] [CrossRef] [PubMed]
- Varshney, R.K.; Thudi, M.; Roorkiwal, M.; He, W.; Upadhyaya, H.D.; Yang, W.; Bajaj, P.; Cubry, P.; Rathore, A.; Jian, J.; et al. Resequencing of 429 chickpea accessions from 45 countries provides insights into genome diversity, domestication and agronomic traits. Nat. Genet. 2019, 51, 857–864. [Google Scholar] [CrossRef] [PubMed]
- Moghaddam, S.M.; Mamidi, S.; Osorno, J.M.; Lee, R.; Brick, M.; Kelly, J.; Miklas, P.; Urrea, C.; Song, Q.; Cregan, P.; et al. Genome-Wide Association Study Identifies Candidate Loci Underlying Agronomic Traits in a Middle American Diversity Panel of Common Bean. Plant Genome 2016, 9, 1–21. [Google Scholar] [CrossRef] [PubMed]
- Varshney, R.K.; Saxena, R.K.; Upadhyaya, H.D.; Khan, A.W.; Yu, Y.; Kim, C.; Rathore, A.; Kim, D.; Kim, J.; An, S.; et al. Whole-genome resequencing of 292 pigeonpea accessions identifies genomic regions associated with domestication and agronomic traits. Nat. Genet. 2017, 49, 1082–1088. [Google Scholar] [CrossRef] [PubMed]
- Mather, K.A.; Caicedo, A.L.; Polato, N.R.; Olsen, K.; McCouch, S.; Purugganan, M.D. The Extent of Linkage Disequilibrium in Rice (Oryza sativa L.). Genet. 2007, 177, 2223–2232. [Google Scholar] [CrossRef] [PubMed]
- Chaurasia, S.; Singh, A.K.; Songachan, L.; Sharma, A.D.; Bhardwaj, R.; Singh, K. Multi-locus genome-wide association studies reveal novel genomic regions associated with vegetative stage salt tolerance in bread wheat (Triticumaestivum L.). Genomics 2020, 112, 4608–4621. [Google Scholar] [CrossRef] [PubMed]
- Nakamura, Y.; Koizumi, R.; Shui, G.; Shimojima, M.; Wenk, M.R.; Ito, T.; Ohta, H. Arabidopsis lipins mediate eukaryotic pathway of lipid metabolism and cope critically with phosphate starvation. Proc. Natl. Acad. Sci. USA 2009, 106, 20978–20983. [Google Scholar] [CrossRef]
- Pérez-Torres, C.-A.; López-Bucio, J.; Cruz-Ramírez, A.; Ibarra-Laclette, E.; Dharmasiri, S.; Estelle, M.; Herrera-Estrella, L. Phosphate Availability Alters Lateral Root Development in Arabidopsis by Modulating Auxin Sensitivity via a Mechanism Involving the TIR1 Auxin Receptor. Plant Cell 2009, 20, 3258–3272. [Google Scholar] [CrossRef] [PubMed]
- Devaiah, B.N.; Madhuvanthi, R.; Karthikeyan, A.S.; Raghothama, K.G. Phosphate Starvation Responses and Gibberellic Acid Biosynthesis are Regulated by the MYB62 Transcription Factor in Arabidopsis. Mol. Plant 2009, 2, 43–58. [Google Scholar] [CrossRef] [PubMed]
- Dai, X.; Wang, Y.; Yang, A.; Zhang, W.-H. OsMYB2P-1, an R2R3 MYB Transcription Factor, Is Involved in the Regulation of Phosphate-Starvation Responses and Root Architecture in Rice. Plant Physiol. 2012, 159, 169–183. [Google Scholar] [CrossRef] [PubMed]


| Traits | P Level | Mean ± SD | Range | CV (%) | Heritability | Relative Value | Combined ANOVA (Mean Sum of Squares) | ||
|---|---|---|---|---|---|---|---|---|---|
| G | P | G × P | |||||||
| TDW | NP | 0.225 ± 0.071 | 0.093–0.547 | 13.32 | 0.84 | 0.730 | 0.017 *** | 0.779 *** | 0.003 *** |
| LP | 0.159 ± 0.041 | 0.077–0.297 | 13.10 | 0.80 | |||||
| PC | NP | 7.240 ± 1.176 | 3.660–10.380 | 9.73 | 0.71 | 0.290 | 3.786 *** | 4763.627 *** | 1.581 *** |
| LP | 2.095 ± 0.638 | 0.600–4.605 | 17.56 | 0.73 | |||||
| TPU | NP | 1.630 ± 0.624 | 0.678–4.793 | 17.73 | 0.81 | 0.210 | 0.759 *** | 305.401 *** | 0.453 *** |
| LP | 0.328 ± 0.124 | 0.100–0.822 | 23.66 | 0.69 | |||||
| PUtE | NP | 0.143 ± 0.026 | 0.097–0.274 | 18.50 | 0.62 | 3.875 | 0.109 *** | 31.179 *** | 0.088 *** |
| LP | 0.559 ± 0.255 | 0.218–1.830 | 36.47 | 0.55 | |||||
| Trait a | Condition b | MLM | CMLM | R2 d | No. of SNPs Shared e | |||||
|---|---|---|---|---|---|---|---|---|---|---|
| Sig c | Average | Range | Sig c | Average | Range | Average (%) | Range (%) | |||
| log10(p) | log10(p) | |||||||||
| TDW | NP | 2 | 3.78 | 3.74–3.82 | 2 | 3.78 | 3.74–3.82 | 17.19 | 17.03–17.36 | 2 |
| LP | 12 | 4.03 | 3.50–4.91 | 12 | 4.03 | 3.50–4.91 | 15.75 | 13.62–19.43 | 12 | |
| LP/NP | 6 | 3.83 | 3.55–4.18 | 6 | 3.83 | 3.55–4.18 | 12.18 | 11.01–13.65 | 6 | |
| PC | NP | 18 | 3.80 | 3.51–4.20 | 18 | 3.80 | 3.51–4.20 | 15.32 | 14.17–16.95 | 18 |
| LP | 12 | 3.87 | 3.53–4.82 | 12 | 3.87 | 3.53–4.82 | 16.05 | 14.69–19.93 | 12 | |
| LP/NP | 2 | 3.70 | 3.59–3.81 | 2 | 3.70 | 3.59–3.81 | 13.72 | 13.26–14.18 | 2 | |
| TPU | NP | 11 | 3.78 | 3.56–4.28 | 17 | 3.85 | 3.53–4.30 | 14.89 | 13.76–16.85 | 10 |
| LP | 7 | 4.17 | 3.58–4.56 | 7 | 4.17 | 3.58–4.56 | 19.31 | 17.00–20.84 | 7 | |
| LP/NP | 5 | 3.79 | 3.54–4.07 | 5 | 3.79 | 3.54–4.07 | 13.26 | 12.21–14.41 | 5 | |
| PUtE | NP | 10 | 3.79 | 3.51–4.63 | 10 | 3.79 | 3.51–4.63 | 14.34 | 13.21–17.81 | 10 |
| LP | 23 | 4.11 | 3.53–5.02 | 23 | 4.11 | 3.53–5.02 | 17.28 | 14.94–21.02 | 23 | |
| LP/NP | 17 | 3.81 | 3.53–4.28 | 9 | 3.77 | 3.56–4.10 | 15.00 | 13.40–17.21 | 9 | |
| 125 | 123 | 116 | ||||||||
| Vigna radiata Gene ID | Arabidopsis Gene Orthologue ID | SNP ID | Protein Description | Arabidopsis Function | References |
|---|---|---|---|---|---|
| VRADI07G06240 | AT4G14410 | S7_13842360, S7_13842388, S7_13842524, S7_13842567 | Zinc finger CCCH domain-containing protein 48 like | Differentially expressed under short-term P-deprivation conditions in soybean leaves. | Zeng et al. 2018 [46] |
| VRADI08G11310 | AT5G01305 | S8_30169847 | bHLHdomain-containing proteins | Root hair formation and thereby increases P uptake under P starvation. | Giehl and Wiren, 2014 [47] |
| VRADI05G06040 | AT4G24730 | S5_11740295, S5_11740306, S5_11740502, S5_11740255, S5_11740269 | Metallophos domain-containing proteins | Acid phosphatases play a role in P uptake and utilization by releasing inorganic P. | Bhadouria et al. 2017 [48] |
| VRADI08G10870 | AT4G01995 | S8_29032405 | β-carotene isomerase proteins D27 | Strigolactones play a vital role in the development of roots and shoots under low P conditions. | Alder et al. 2012 [49] |
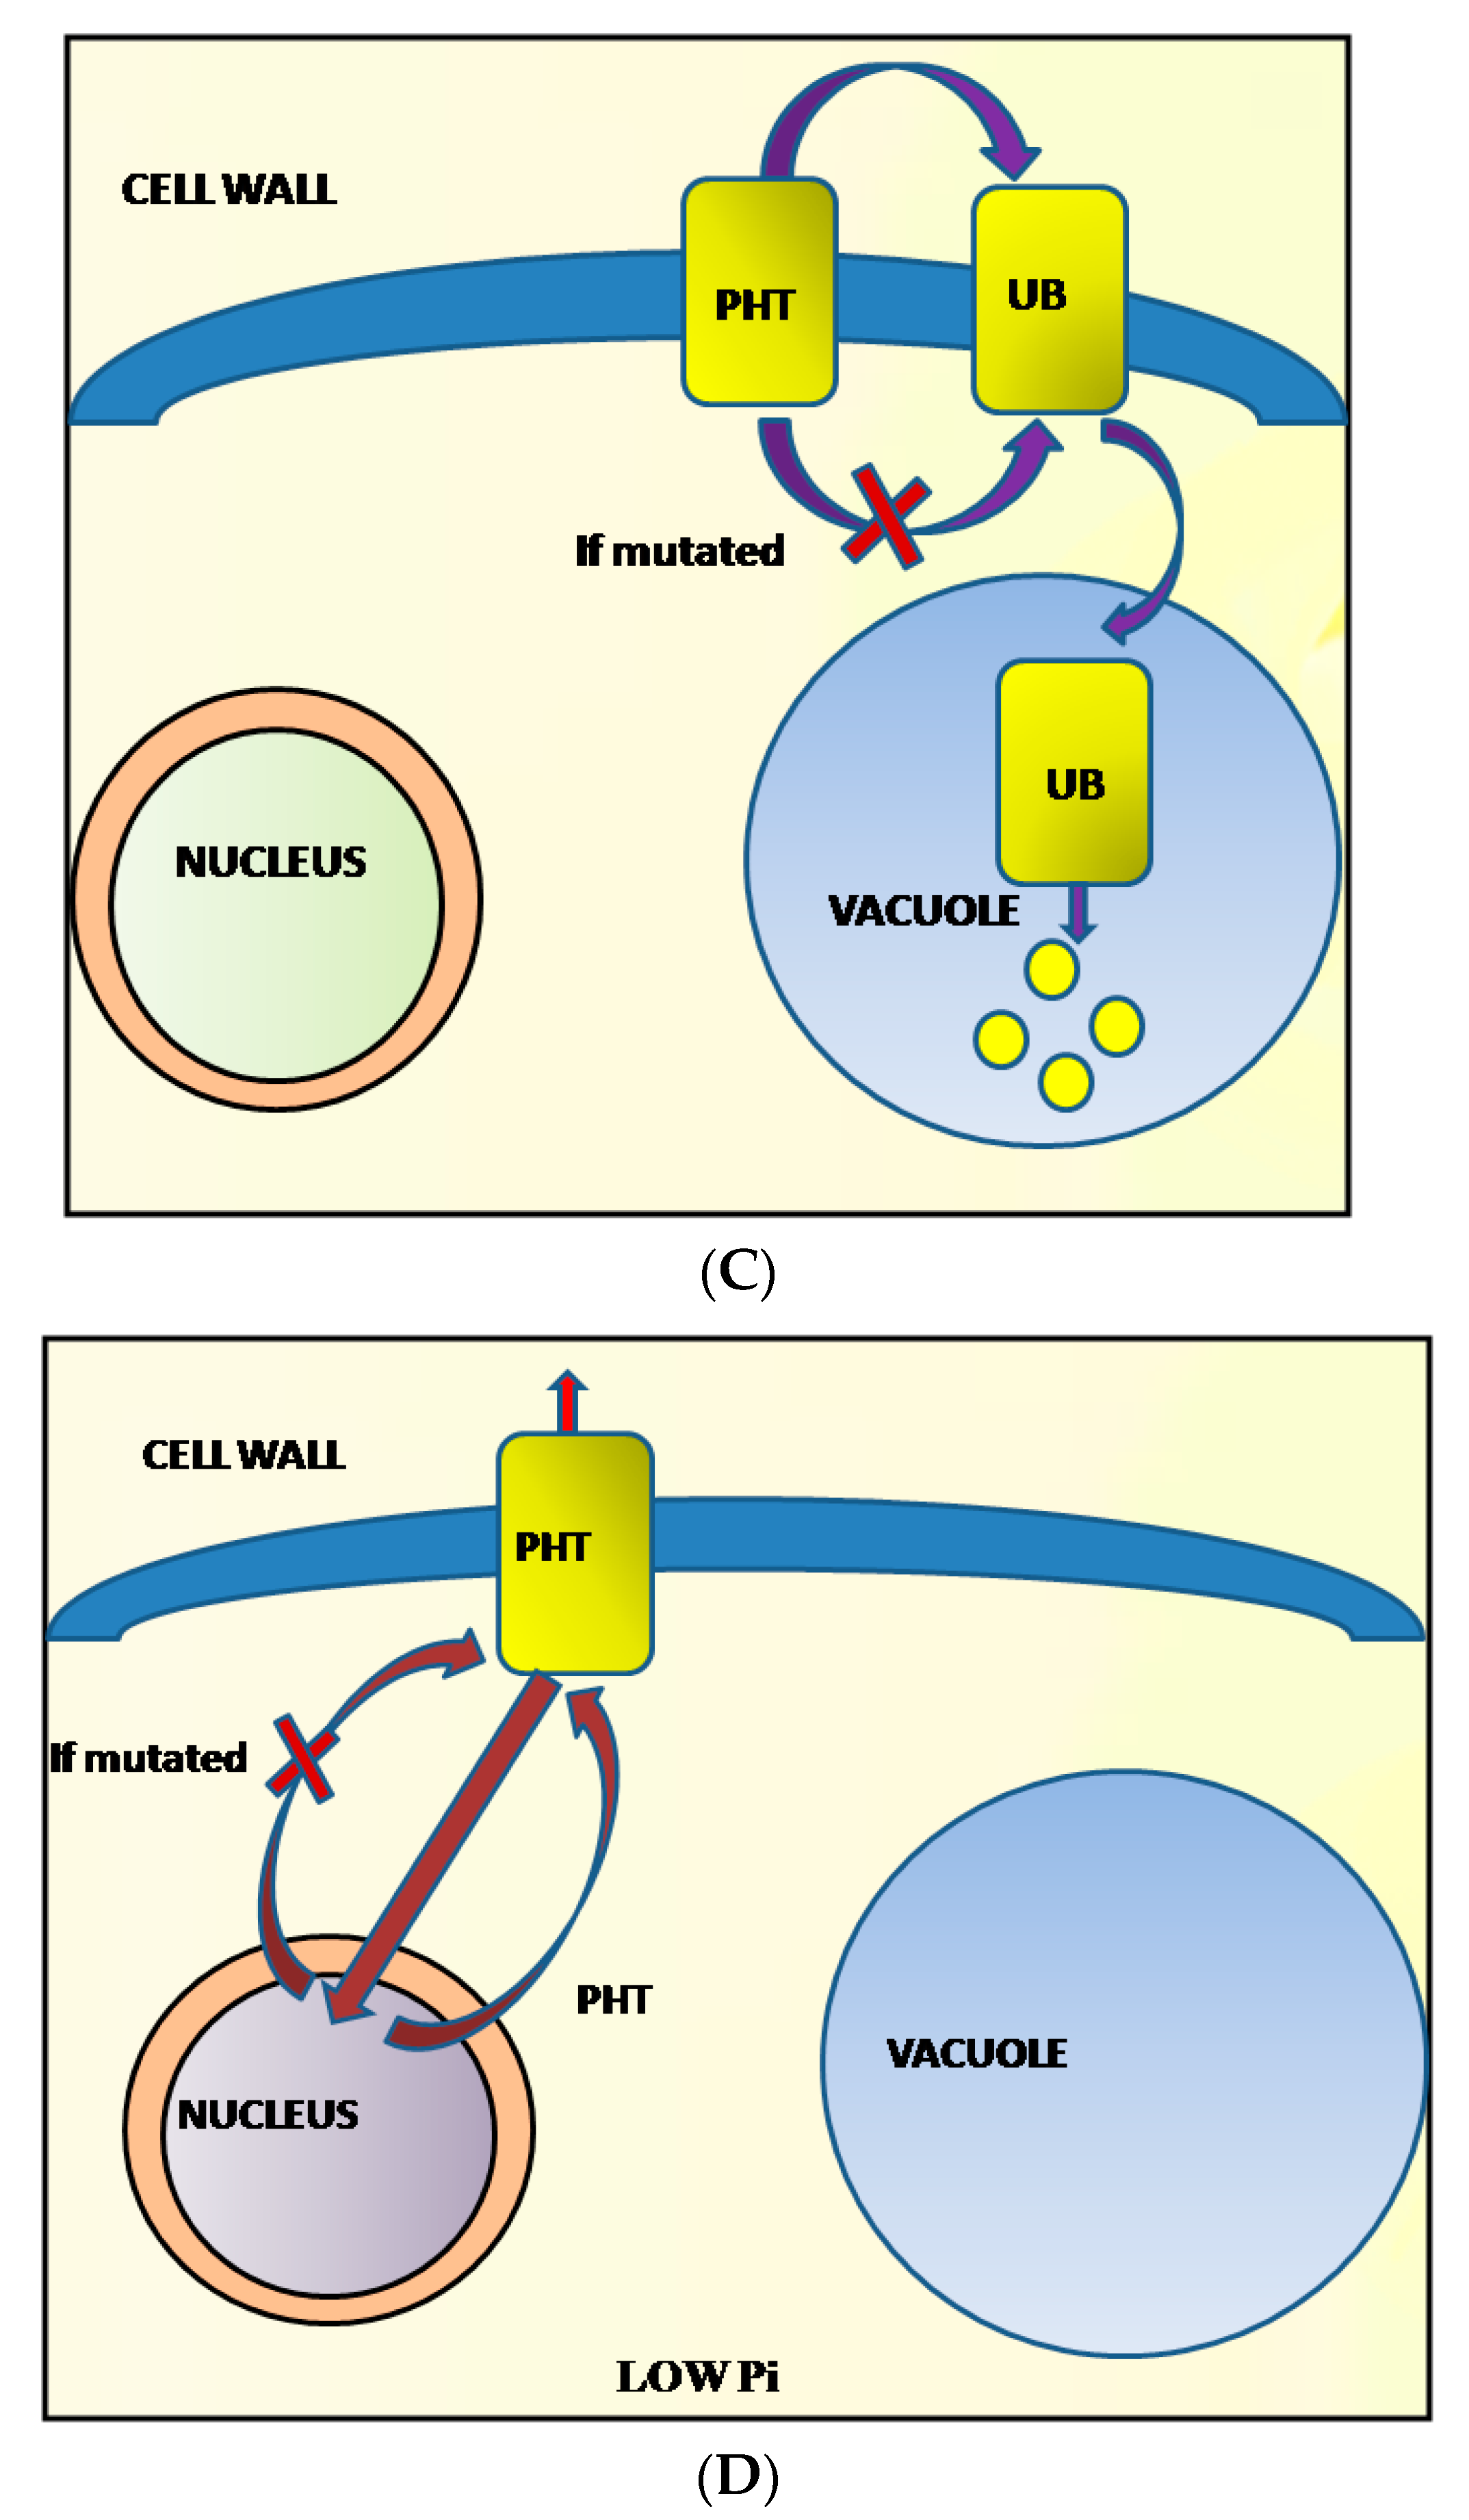
| VRADI08G20910 | AT1G49975 | S8_43013582 | The ubiquitin-conjugating enzyme, E3 | Ubiquitin-conjugating enzyme E3 gene, NLA was involved in PHT1 (P transporter) ubiquitination. | Hsieh et al. 2009 [50] |
| VRADI06G12490 | AT3G13560 | S6_30133081 | SPX domain-containing protein | SPX gene family is involved in P signaling and homeostasis by negatively regulating the activity of PHR(Phosphate starvation response regulator). | Liu et al. 2017 [51] |
| VRADI09G09030 | AT3G44700 | S9_17743262 | LRR receptor-like serine/threonine-protein kinase | Kinase gene present in PUP1 QTL (PSTOL1) region involved in promoting P uptake by enhancing early root growth in rice. | Gamuyao et al. 2012 [52] |
| VRADI07G24790 | AT3G16940 | S7_48141848 | Calmodulin binding transcription activator 5 | Involved in Ca+2 signaling and differentially expressed in roots of soybean under P stress conditions. | Zeng et al. 2015 [53] |
| VRADI06G14930 | AT1G47128 | S6_34944346, S6_34944402, S6_34944356, S6_34944400, S6_34944407, | Low temperature induced cysteine proteinase | Cysteine proteinase inhibitor activity results in the reduction of protein catabolism under P-deficient conditions. | Hammond et al. 2011 [54] |
| VRADI03G02620 | AT1G04120 | S3_3624245, S3_3624308, S3_3624244, S3_3624311 | ABC transporters | Involved in P deficiency-induced root architecture remodeling by modulating iron homeostasis. | Dong et al. 2016 [55] |
| VRADI06G03940 | AT3G27720 | S6_4461309, S6_4461289, S6_4461200, S6_4461398, S6_4461191, S6_4461373, | Heavy metal-associated isoprenylated plant protein 41-like | Involved in the transport of heavy metals and detoxification in plant cells. | Li et al. 2020 [56] |
| VRADI06G13450 | AT1G17680 | S6_32286556, S6_32286560 | Histone-lysine N-methyltransferase | Involved in DNA methylation and chromatin modification under P deficiency. | Sirohi et al. 2016 [57] |
| VRADI05G21880 | AT1G62700 | S5_33286862 | NAC domain-containing protein 7 | Regulator of various processes and overexpression improves the stress tolerance under the P deficiency condition. | Nuruzzaman et al. 2013 [58] |
| VRADI08G00070 | AT4G02650 | S8_133068 | protein SIEVE ELEMENT OCCLUSION B | Phosphatidyl inositol binding clathrin assembly protein 5A/B are recent paralogs with overlapping functions in recycling ANXUR proteins to the pollen tube membrane. | Muro et al. 2018 [59] |
| VRADI05G20860 | AT1G51700 | S5_32030786 | dof zinc finger protein DOF1.7 | ADOF1, DOF ZINC FINGER PROTEIN 1, DOF1 | Huang et al. 2016 [60] |
| VRADI01G04370 | AT3G18480 | S1_ 6743310 | Uncharacterized | Response to abscisic acid, response to singlet oxygen, photochemical quenching. | Renna et al. 2005 [61] |
Publisher’s Note: MDPI stays neutral with regard to jurisdictional claims in published maps and institutional affiliations. |
© 2021 by the authors. Licensee MDPI, Basel, Switzerland. This article is an open access article distributed under the terms and conditions of the Creative Commons Attribution (CC BY) license (https://creativecommons.org/licenses/by/4.0/).
Share and Cite
Reddy, V.R.P.; Das, S.; Dikshit, H.K.; Mishra, G.P.; Aski, M.S.; Singh, A.; Tripathi, K.; Pandey, R.; Bansal, R.; Pal Singh, M.; et al. Genetic Dissection of Phosphorous Uptake and Utilization Efficiency Traits Using GWAS in Mungbean. Agronomy 2021, 11, 1401. https://doi.org/10.3390/agronomy11071401
Reddy VRP, Das S, Dikshit HK, Mishra GP, Aski MS, Singh A, Tripathi K, Pandey R, Bansal R, Pal Singh M, et al. Genetic Dissection of Phosphorous Uptake and Utilization Efficiency Traits Using GWAS in Mungbean. Agronomy. 2021; 11(7):1401. https://doi.org/10.3390/agronomy11071401
Chicago/Turabian StyleReddy, Venkata Ravi Prakash, Shouvik Das, Harsh Kumar Dikshit, Gyan Prakash Mishra, Muraleedhar S. Aski, Akanksha Singh, Kuldeep Tripathi, Renu Pandey, Ruchi Bansal, Madan Pal Singh, and et al. 2021. "Genetic Dissection of Phosphorous Uptake and Utilization Efficiency Traits Using GWAS in Mungbean" Agronomy 11, no. 7: 1401. https://doi.org/10.3390/agronomy11071401
APA StyleReddy, V. R. P., Das, S., Dikshit, H. K., Mishra, G. P., Aski, M. S., Singh, A., Tripathi, K., Pandey, R., Bansal, R., Pal Singh, M., Gore, P. G., P. B., M., Kothari, D., Rai, N., & M. Nair, R. (2021). Genetic Dissection of Phosphorous Uptake and Utilization Efficiency Traits Using GWAS in Mungbean. Agronomy, 11(7), 1401. https://doi.org/10.3390/agronomy11071401