Article

Characterization of Interactions between the Soybean Salt-Stress Responsive Membrane-Intrinsic Proteins GmPIP1 and GmPIP2

1
Key Laboratory of Agricultural Environment in the Lower Reaches of Yangtze River Plain, Salt-Soil Agricultural Center, Institute of Agricultural Resources, Environment Jiangsu Academy of Agricultural Sciences (JAAS), Nanjing 210014, China
2
Institute of Botany, Jiangsu Province and Chinese Academy of Sciences, Nanjing 210014, China
3
Jiangsu Key Laboratory for Bioresources of Saline Soils, Jiangsu Synthetic Innovation Center for Coastal Bio-Agriculture, Yancheng Teachers University, Yancheng 224002, China
4
College of Environment and Safety Engineering, Qingdao University of Science & Technology, Qingdao 266000, China
5
State Key Laboratory of Crop Genetics & Germplasm Enhancement, Hybrid Cotton R & D Engineering Research Center, Ministry of Education, Nanjing Agricultural University, Nanjing 210095, China
*
Authors to whom correspondence should be addressed.
Jia Liu and Weicong Qi contribute equally to this work.
Agronomy 2021, 11(7), 1312; https://doi.org/10.3390/agronomy11071312
Submission received: 7 March 2021 / Revised: 8 June 2021 / Accepted: 9 June 2021 / Published: 28 June 2021
(This article belongs to the Special Issue Legumes Cultivars and Their Genetic Improvements)

Abstract

:
Salt tolerance is an important trait in soybean cultivation and breeding. Plant responses to salt stress include physiological and biochemical changes that affect the movement of water across the plasma membrane. Plasma membrane intrinsic proteins (PIPs) localize to the plasma membrane and regulate the water and solutes flow. In this study, quantitative real-time PCR and yeast two-hybridization were engaged to analyze the early gene expression profiles and interactions of a set of soybean PIPs (GmPIPs) in response to salt stress. A total of 20 GmPIPs-encoding genes had varied expression profiles after salt stress. Among them, 13 genes exhibited a downregulated expression pattern, including GmPIP1;6, the constitutive overexpression of which could improve soybean salt tolerance, and its close homologs GmPIP1;7 and 1;5. Three genes showed upregulated patterns, including the GmPIP1;6 close homolog GmPIP1;4, when four genes with earlier increased and then decreased expression patterns. GmPIP1;5 and GmPIP1;6 could both physically interact strongly with GmPIP2;2, GmPIP2;4, GmPIP2;6, GmPIP2;8, GmPIP2;9, GmPIP2;11, and GmPIP2;13. Definite interactions between GmPIP1;6 and GmPIP1;7 were detected and GmPIP2;9 performed homo-interaction. The interactions of GmPIP1;5 with GmPIP2;11 and 2;13, GmPIP1;6 with GmPIP2;9, 2;11 and GmPIP2;13, and GmPIP2;9 with itself were strengthened upon salt stress rather than osmotic stress. Taken together, we inferred that GmPIP1 type and GmPIP2 type could associate with each other to synergistically function in the plant cell; a salt-stress environment could promote part of their interactions. This result provided new clues to further understand the soybean PIP–isoform interactions, which lead to potentially functional homo- and heterotetramers for salt tolerance.

1. Introduction

Plasma membrane intrinsic proteins (PIPs) are aquaporins that localize to the plasma membrane (PM) and regulate the flow of water and solutes. PIPs can be clustered into two evolutionary subgroups, PIP1 and PIP2 [1]. The gene copy numbers of the PIP1 and PIP2 isoforms vary among species; for instance, there are 5 PIP1s and 4 PIP2s in Arabidopsis thaliana (Arabidopsis) [2], 10 PIP1s and 14 PIP2s genes in Glycine max and Brassica rapa [3,4], and 4 PIP1s and 5 PIP2s genes in Cicer arietinum L. [5]. Plant PIPs contain two conserved domains: transmembrane domains (TMDs) and asparagine–proline–alanine (NPA) motifs. These proteins vary in the lengths of their N- and C-terminal ends [1]. Biochemical and crystallography-based 3D structural analyses reported that PIPs could assemble into hetero- or homotetramers [5,6,7]. Harvengt et al. identified two aquaporin isoforms, PIP1 and PIP2, which belonged to the same oligomer in the membrane of protein-storage vacuoles in Lens culinaris Med. Seeds [8]. Studies on Zea may and Selaginella moellendorffii PIPs in Xenopus oocytes both suggested that the co-expression of PIP1 and PIP2 could help the aquaporins reach PM and increase the permeability coefficient (Pf) in comparison with expressing PIP1 or PIP2 alone [9,10]. Research on Arabidopsis showed that the interaction between PIP proteins enhanced the delivery of PIP2 from Golgi to PM [11]. In Arabidopsis halophitic relative Thellungiella halophila, the interaction between PIP1 and PIP2 triggered multiple physiological responses when the plant was exposed to salt stress [12]. Research in rice, tobacco, and vine grape showed that aquaporins PIP1 and PIP2 form a complex that regulates water transport [13,14,15]. On the other hand, studies on Beta vulgaris PIPs (BvPIPs) in Xenopus oocytes demonstrated that the co-expression of BvPIP1;1 and BvPIP2;2 enhanced PM water permeability [16], but BvPIP2;1 did not bind BvPIP1;1 or enhance its transportation to oocyte PM [17]. These results imply that PIP1 and PIP2 jointly working in a plant cell might form functional units facilitating solute transport [1]; PIPs’ interactions might have special functions in plant salt or drought tolerance, and the interaction should be specific, and not conserved in different isoforms.
Previous research on Glycine max demonstrated that several GmPIPs were involved in the process of plant responses to salt, drought, and osmotic stress [11,12,13,18,19,20]. Salt stress is an important abiotic stress factor in crop cultivation, including that of soybean [21]. It can affect many physiological processes negatively, and high-level salt stress may reduce the yield or even cause more severe loss [22,23,24]. As regards the PIPs interaction depicted above, protein–protein and protein–macromolecule interactions play crucial roles in maintaining various physiological activities and biological functions. However, to date, there is no research on GmPIPs’ interactions in response to salt stress. Hence, in the present study, soybean seedlings were subjected to salt stress, and the gene expression profiles of GmPIPs and the protein interaction were assayed. The results show that salt stress led to varied GmPIPs expression and influenced the proteins’ hetero- and homotetramerization, which might affect water channel activity and plant salt tolerance.

2. Materials and Methods

2.1. Soybean Plant Materials and Treatments

The seeds of soybean variety Willimas 82 (Glycine max) were from the seed stock of our lab, and they were grown in pots with vermiculite (14 cm dimeter, 20 cm height) for germination and seedling growth later. All the pots were kept in a climate chamber with the following growth conditions: 16 h/8 h light/dark photoperiod, light density 43.2 μmol ×m−2×S−1, 25 °C/20 °C day/night. Two-week-old seedlings were placed into 1/2 Hoagland solution for two days as an adjustment process. To detect the earlier salt response, the seedlings were subjected to the solution of 1/2 Hoagland with 200 mM NaCl for 0, 2, and 12 h, and the root samples were collected for RNA isolation [18]. The adjustment process and the treatment were carried out under the same condition as mentioned above.

2.2. RNA Extraction and cDNA Synthesis

A Promega RNA extraction kit was used for total RNA extraction from the root-tissue samples of soybean seedlings subjected to 200 mM NaCl for 0 (CK), 2 and 12 h, respectively. After the DNA removal through DNase I digestion, RNA quality and integrity were checked using 1.2% agarose gel electrophoresis. The cDNA synthesis was performed according to the procedure of the reverse transcription kit (HaoJia Technology Development Co., Ltd. Shanghai, China).

2.3. Gene Expression Analysis

Quantitative real-time PCR (qPCR) analysis was carried out to detect the expression level of GmPIP genes in response to salt stress. Primers (designed by Primer 3 software, Whitehead Institute, Cambridge, MA, USA) for each gene are listed in Table S1. Soybean GmTUBB3 (NM_001252709.2) and GmActin (NM_001289231.1) were used as internal references. All reactions were performed in the SYBR® Premix Ex Taq™ (Takara, China) reaction mixture using a Bio-Rad CFX connect Real-Time system (Bio-Rad Laboratories, Hercules, CA, USA) under the following conditions: 10 s at 95 °C, followed by 40 cycles of 5 s at 95 °C for denaturing and 30 s at 60 °C for annealing and extension. A melting curve analysis was performed to confirm the specificity of the PCR products. Similar results were obtained from the relative gene expression data calculated using the 2−ΔΔCt method, and the control plants (0 h) were used as the reference. There were three independently biological replications for each sample, and three technological repeats for each biological replication.

2.4. GmPIPs Gene Cloning and Constructs Preparation

Full-length ORFs of the selected GmPIPs were amplified from the root tissues of soybean (variety Willimas 82) seedlings using primers containing enzyme digestion sites (Table S2). PCR products were transferred to the pGEM-T Easy Vector. Every construct (pGEM-T–GmPIPs) was sequenced three times by Nanjing TSINGKE Biological Technology Co., Ltd. to validate the sequence. The pGADT7 and pGBKT7 vectors and pGEM-T-GmPIPs were digested using Nco I and EcoR I, then the digested vector and gene fragments were ligated using the T4 DNA ligase enzyme. After transformation, positive clone detection and sequencing validation for pGADT7-GmPIPs and pGBKT7-GmPIPs, they were ready for the following yeast two-hybrid assay.

2.5. Yeast Two-Hybrid Assay

The yeast two-hybridization assay was performed according to the protocol of the MatchmakerTM Gold Yeast Two-Hybrid System (Clontech, Cambridge, MA, USA). After the transformation of pGADT7-GmPIPs and pGBKT7-GmPIPs simultaneously, the yeast cell was cultivated in liquid medium until the OD value reached 1.5 (or adjusting with fresh medium). The cultivations were 10-, 100-, 1000-times diluted with autoclaved double-distilled water; then equal amounts of yeast clones were inoculated on the SD-Leu-Trp and SD-Leu-Trp-His-Ade+Aba+X-a-gal selective medium (solid plate), and the plates were incubated at 30 °C until the growth of visible colonies. Yeast cells carrying pGBKT7–53 and pGADT7-SV40 plasmids were used as positive controls, and those with pGBKT7-Lam and pGADT7-SV40 were used as negative controls. Meanwhile, the yeast clones were also plated on SD-Leu-Trp-His-Ade+AbA+X-a-gal containing 100 mM NaCl or 200 mM mannitol, respectively.

2.6. Bioinformatics Analysis of Soybean PIPs

To analyze the duplication events among soybean GmPIPs, the data were downloaded from PLANT GENOME DUPLICATION DATABASE (PGDD) [25] and the tandem and segmental duplication of GmPIPs were determined. The transmembrane region of GmPIPs was predicted using SMART online software [26]. The evolutional trees for GmPIPs and other plant species PIP proteins, downloaded from RiceFREND [27], were constructed using MEGA5.0 software [28]. The multiple alignment was performed using Cluxtal X and GeneDoc.

2.7. Statistical Analysis

The data are the average of three replicates ± stand derivation (SD) for each treatment. The data were analyzed by ANOVA using SPSS 20.0(IBM, NY, US). Values that are significantly different (p < 0.05) are indicated by different lowercase letters in the Figures.

3. Results

3.1. Sequence Analysis of Soybean GmPIPs

Soybean GmPIPs contain six TMDs and two conserved NPA motifs. Even though the TMD regions in the two types of PIPs shared high similarity, we found several differences in the amino acid sequences of TMD2 and TMD4 (Figure S1). The structural differences between PIP1 and PIP2 are limited to their N- and C-terminal ends [1]. The N-terminal ends of GmPIP1s are longer than those of GmPIP2s by about 15 amino acids. However, the C-terminal ends of GmPIP1s are shorter than those of GmPIP2s by about 8 amino acids (Figure S1). Phylogenetic analysis indicated that the GmPIP1s and the GmPIP2s could be clustered into two separated groups: GmPIP1;1 and 1;2, 1;4 and 1;5, and 1;6 and 1;7; and GmPIP2;1, 2;2, 2;3 and 2;4, 2;6 and 2;6, 2;7 and 2;8, and 2;10 and 2;11 had high similarity (Figure S2). When the homologs from other plant species, such as rice (OsPIPs) and Arabidopsis (AtPIPs), were integrated into the analysis, the clustering pattern stayed the same (Figure S3).

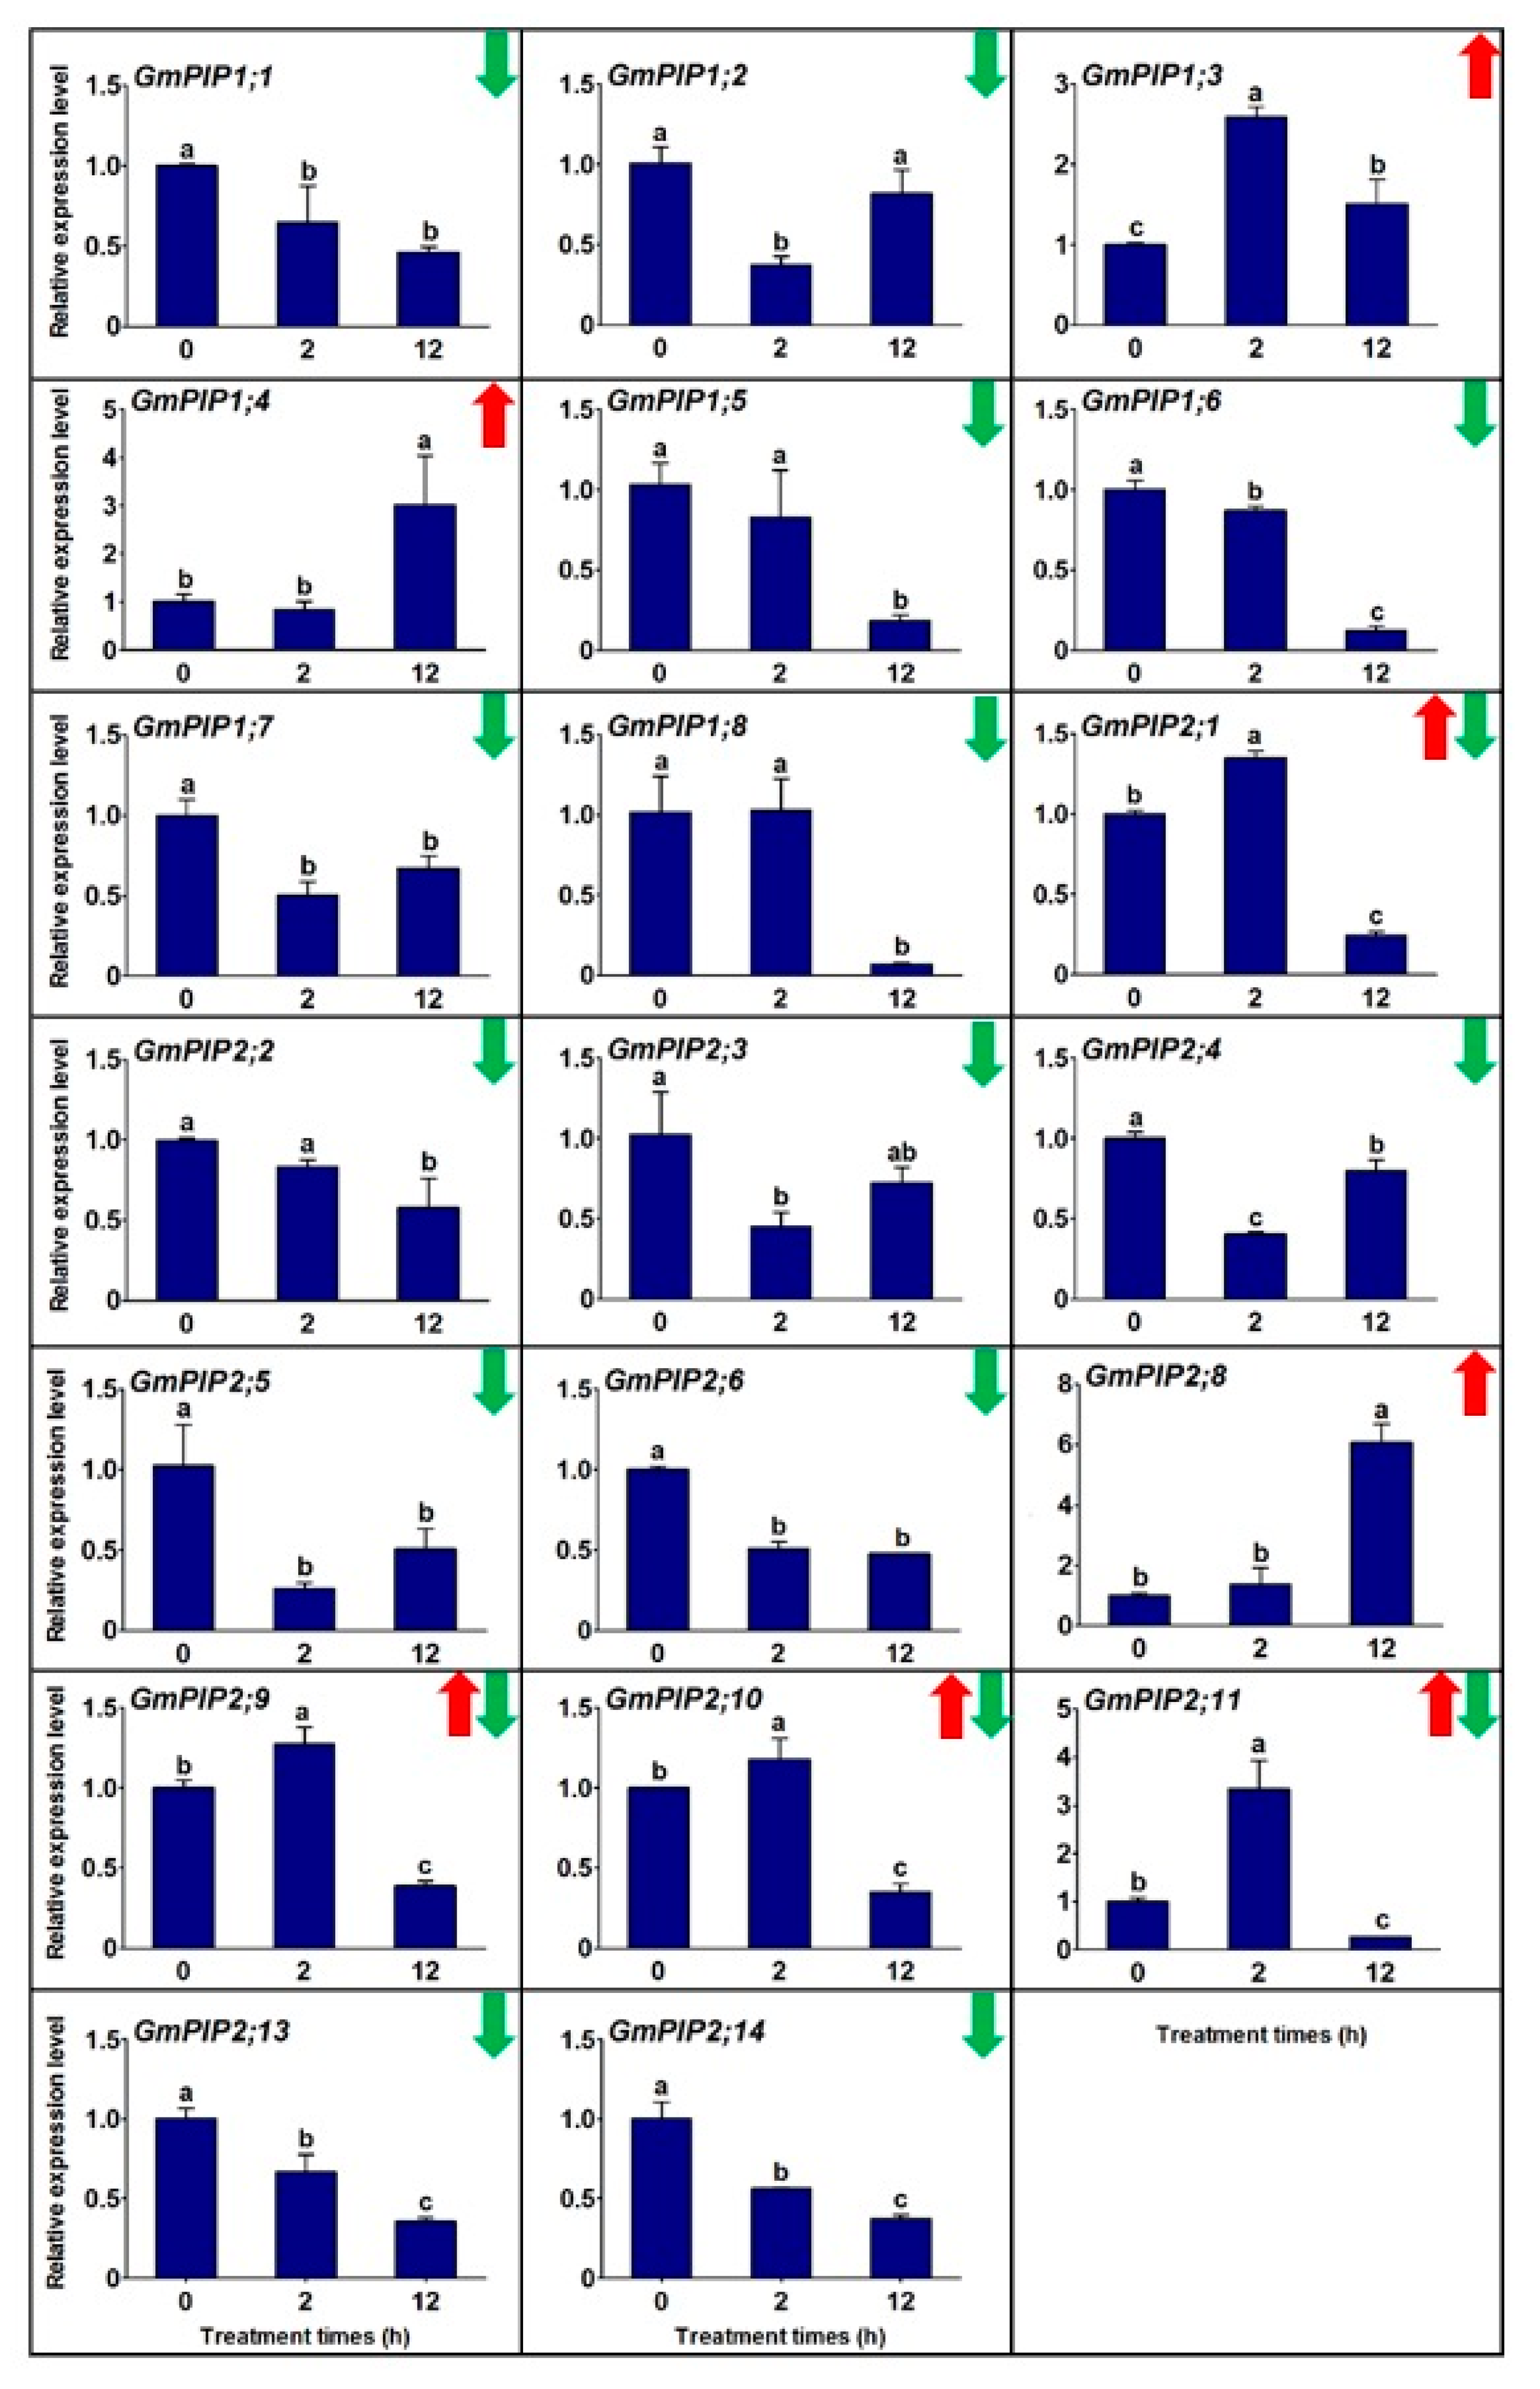
3.2. The Transcriptional Profiles of Gmpips under Salt Stress

The transcriptional profile of GmPIPs in the salt stress-treated (for 0, 2, and 12 h) soybean root tissue was assayed by qPCR. Most of the expression levels (EL) of these aquaporin coding genes were altered after NaCl treatment (Figure 1). There were seven GmPIPs (GmPIP1;3, GmPIP1;4, GmPIP2;1, GmPIP2;8, GmPIP2;9, GmPIP2;10 and GmPIP2;11) the Els of which were elevated significantly in response to salt-stress treatment. GmPIP2;1, GmPIP2;9, GmPIP2;10 and GmPIP2;11′s ELs increased at 2 h but decreased at 12 h to levels even lower than at 0 h. The ELs of GmPIP2;8 did not change at 2 h, but increased about six-fold at 12 h. On the other hand, there were ten genes (GmPIP1;1, GmPIP1;2, GmPIP,1;5, GmPIP1;6, GmPIP1;7, GmPIP2;3, GmPIP2;4, GmPIP2;5, GmPIP2;8 and GmPIP2;13) the ELs of which decreased after NaCl treatment. Among those down-regulated GmPIPs, the ELs of GmPIP1;5, GmPIP1;8, and GmPIP2;2 did not show change at 2 h, whereas they decreased at 12 h. Remarkably, the ELs of GmPIP1;2 and GmPIP2;4 decreased significantly at 2 h and then recovered at 12 h to the same levels as at 0 h. Finally, four of the examined genes (GmPIP1;9, GmPIP 1;10, GmPIP 2;7 and GmPIP 2;12) whose ELs were not altered after salt stress are not shown in Figure 2.

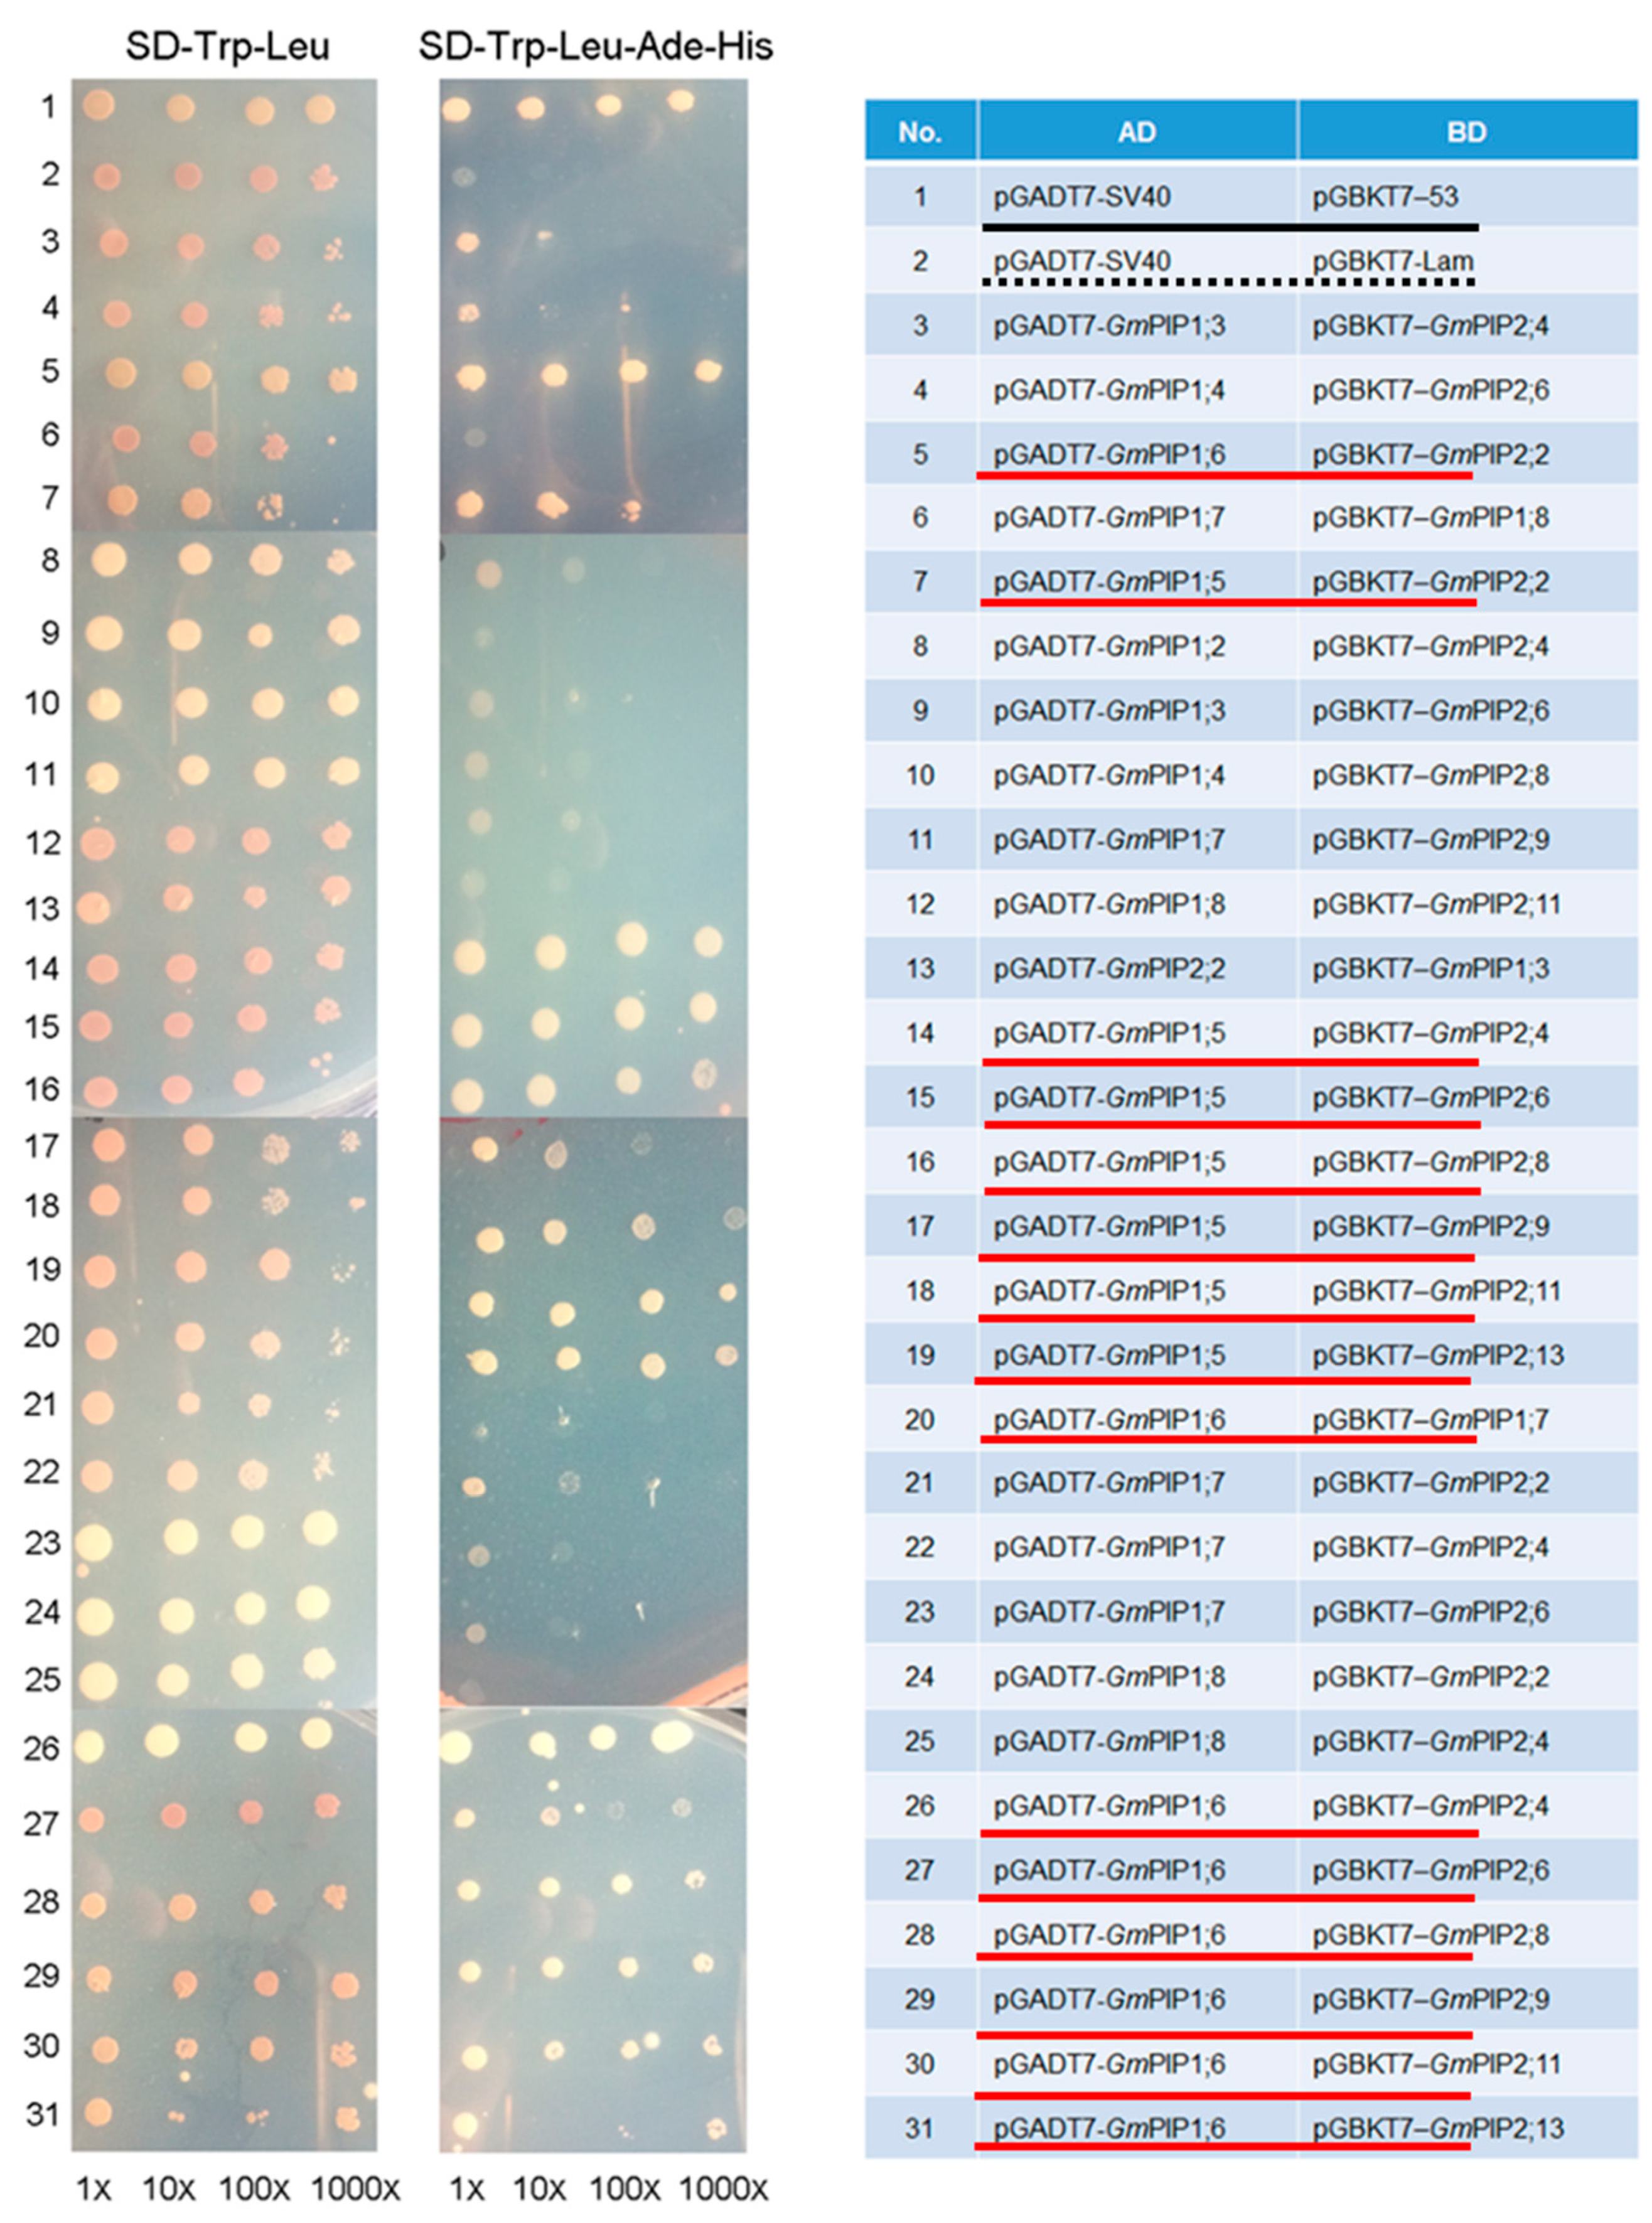
3.3. Hetero- and Homotetramerization in GmPIP1s and GmPIP2s

Based on the phylogenetic analysis (Figure S2) and qPCR result, we selected part of the GmPIPs for the yeast two-hybrid (Y2H) assays (as depicted in 3.1 and 3.2, also see the legend of Figure 2 and discussion for more information). In Figures S2 and S3, the selected GmPIPs are marked with a blue dot. A total of 255 PIP1–PIP1, PIP1–PIP2, and PIP2–PIP2 combinations were tested. As shown in Figure 2, the colonies on SD-Trp-Leu medium certify the success of bi-vector co-transformation. All of the bi-vector combinations were transformed into destiny yeast cells, as expected. The colony growth in SD-Trp-Leu-Ade-His showed the interaction between the aquaporins. The colony size after dilution indicates the interaction strength. Samples No.1, 2 were positive and negative controls, which are underlined with the solid and dotted lines in black, respectively. The cells of the negative control grew into a very light colony when without dilution, but nothing was produced after dilution. The Y2H tests between GmPIP1 and GmPIP2 showed that both GmPIP1;5 and GmPIP1;6 could strongly interact with GmPIP2;2, GmPIP2;4, GmPIP2;6, GmPIP2;8, GmPIP2;9, GmPIP2;11, and GmPIP2;13 (Figure 2, underlined in red). Among the PIP1–PIP1 combinations tested, we found strong interactions only between GmPIP1;6 and GmPIP1;7 (Figure 2, underlined in red).

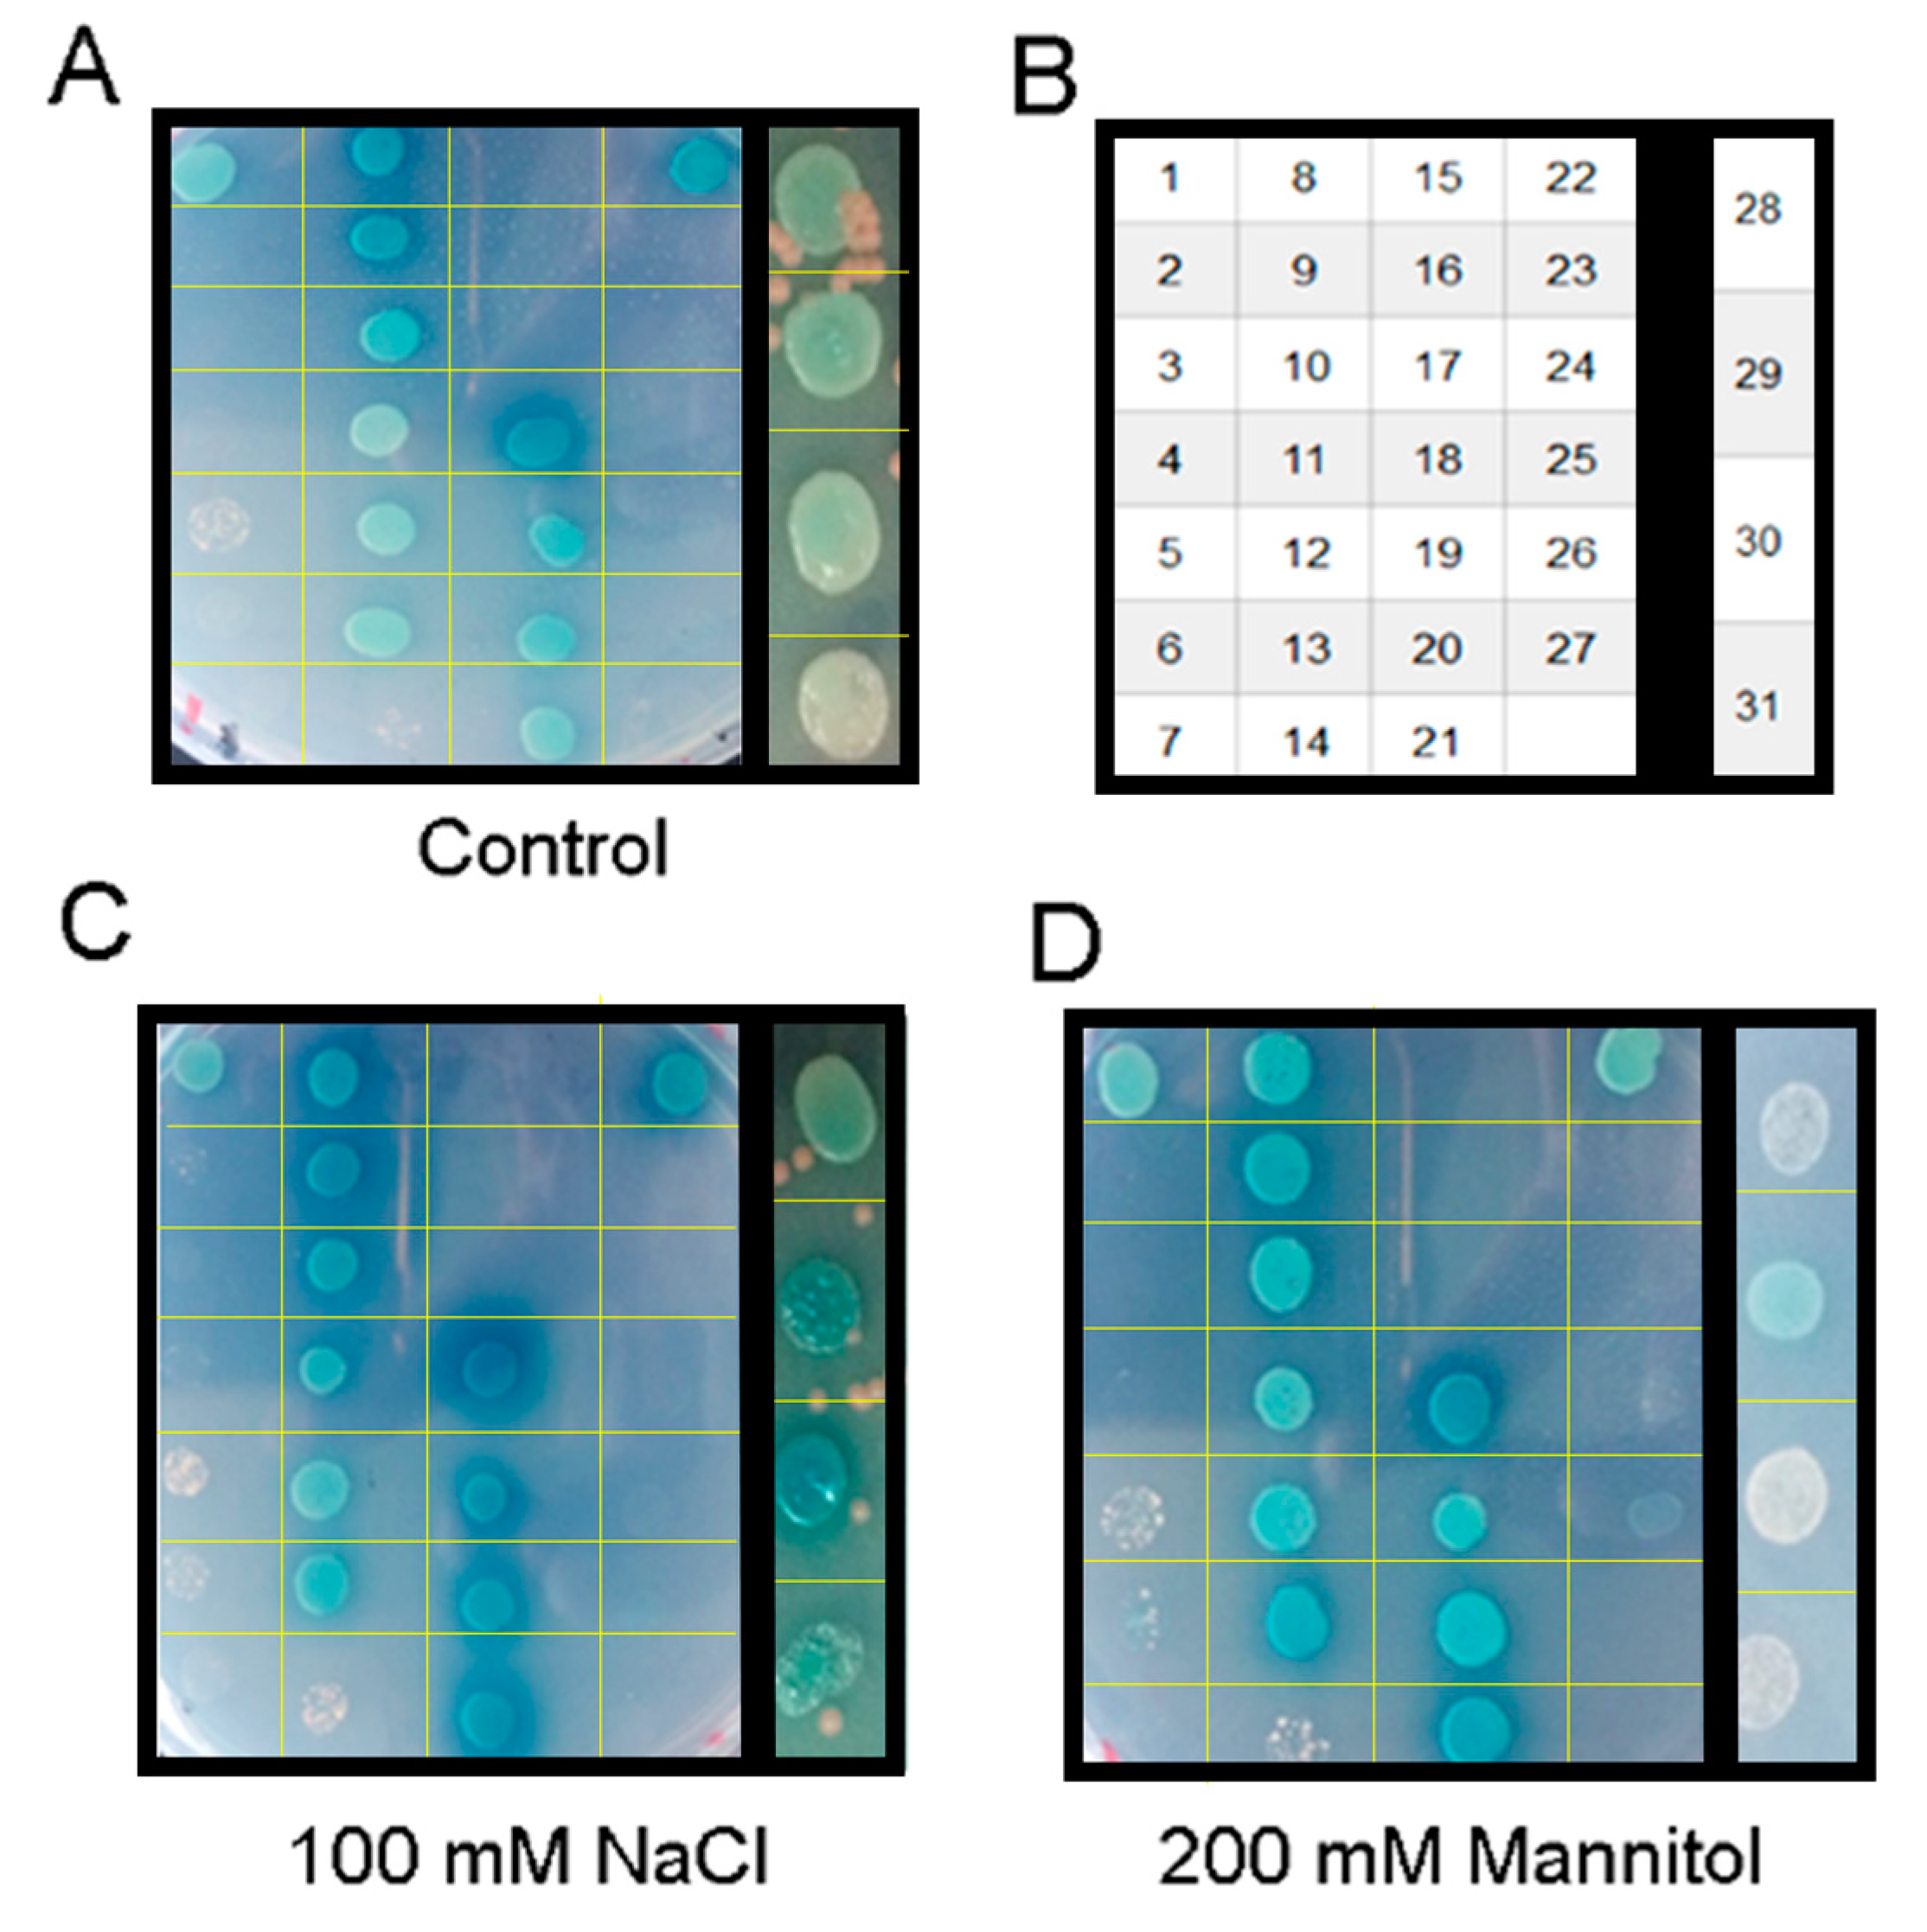
3.4. Salt-Stress Treatment Enhanced the Interactions of PIPs

Furthermore, the interactions between the aquaporins have been validated again via salt stress and osmotic stress treatments (Figure 3). The colonies grew from the cells without any dilutions; the intensity of their blue color denotes the interaction strength. Compared with the blank control, the salt treatment directly enhanced the blue color in combinations 18, 19 (GmPIP1;5 + GmPIP2;11, 2;13), 20 (GmPIP1;6 + GmPIP1;7), 21 (GmPIP1;7 + GmPIP2;2), and in 29, 30, and 31 (GmPIP1;6 + GmPIP2;9, 2;11, 2;13). On the other hand, in comparison with the control, no colony the color of which turned bluer was detected on the osmotic stress plate.

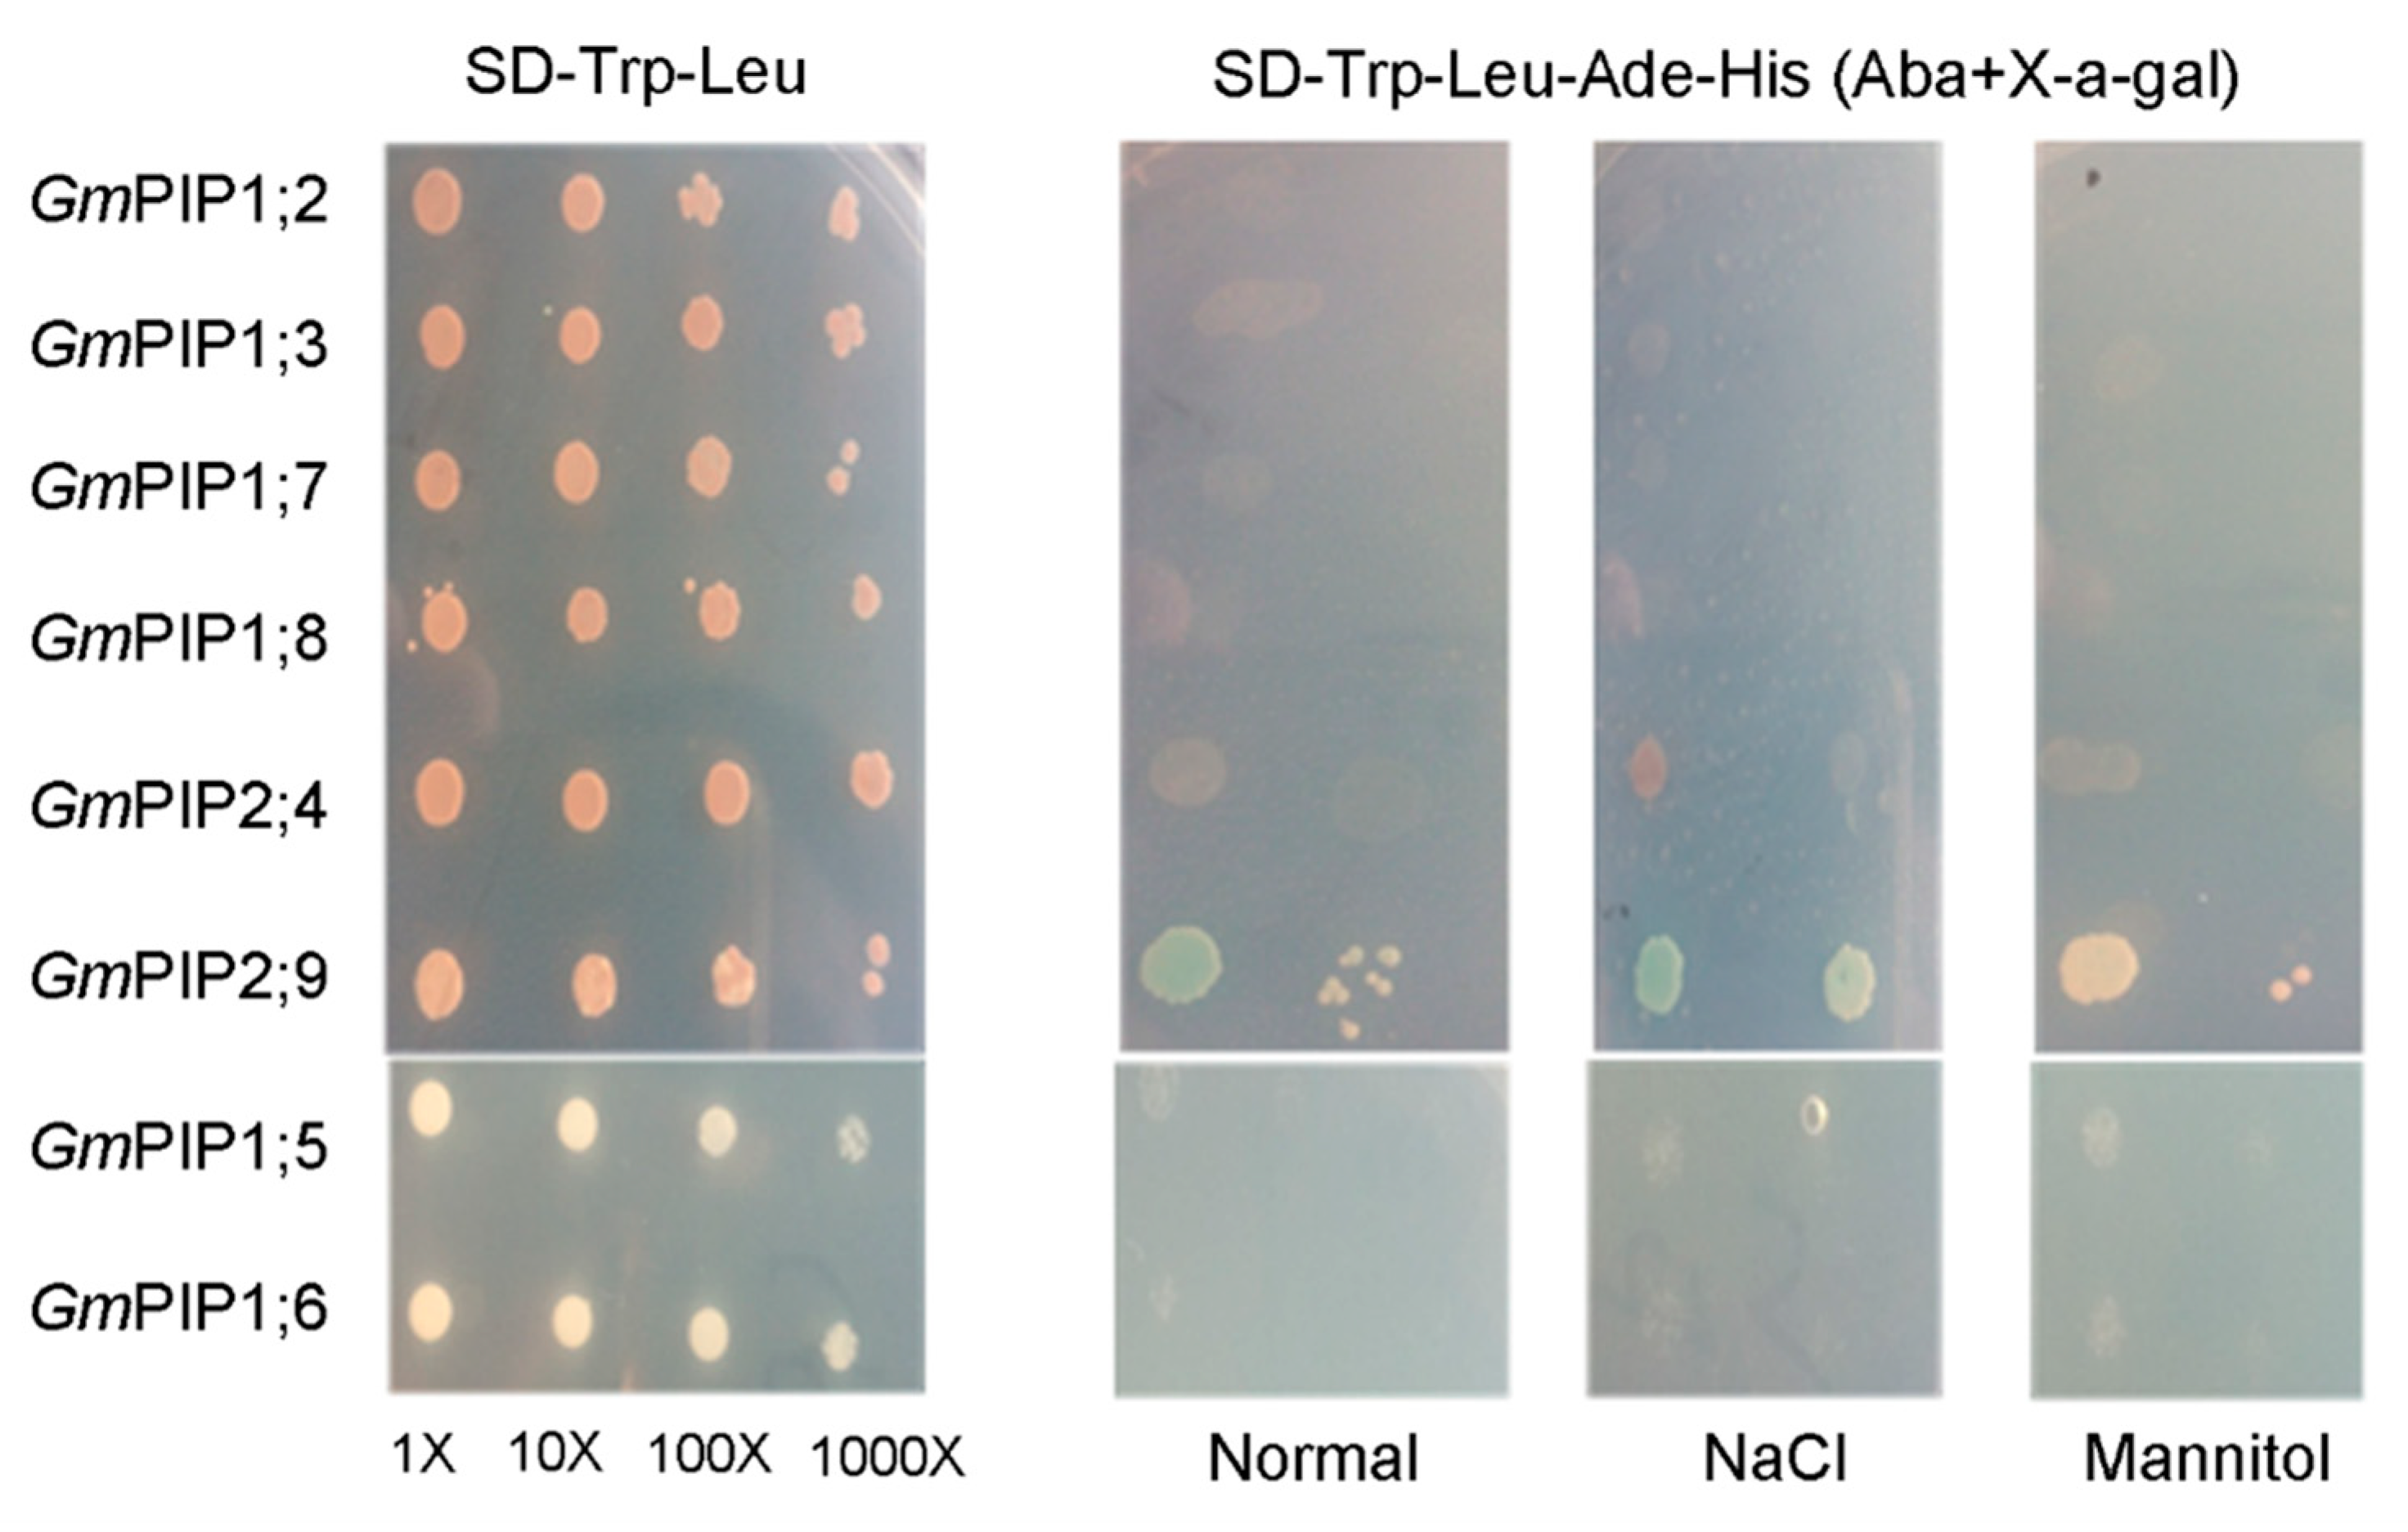
3.5. GmPIP2;9 Itself Could Form a Homodimer in Yeast Cells

Y2H tests on the homo-interaction in GmPIP1s and GmPIP2s showed that only the bi-vector combination of GmPIP2;9 formed obvious and reliable colonies (Figure 4). This means the GmPIP2;9 proteins could interact with each other and form a homotetramer. According to the size and the color of the colonies, the homo-interaction of GmPIP2;9 could be strengthened by salt stress, but not osmotic stress.
Summarily, the strong interactions between GmPIPs detected by Y2H are listed in Table 1. The interactions that could be strengthened by salt stress are marked as well.

4. Discussion

A larger number of genes have been identified to mediate plant stress tolerance and can be used for crop improvement [23,29,30,31]. Aquaporins play an important role in regulating plant growth because they can, for example, influence root water uptake and leaf gas exchange, as well as other physiological process. Aquaporins are abundant in all kingdoms and are organized in highly conserved tetrameric structures in cell membranes. Afzal et al. highlighted the involvement of several aquaporin homologs in response to various environmental stressors interrupting plant cell osmotic balance [32]. Aquaporin PIPs have also been considered as functional units that perform their physiological roles under different environmental stresses, such as salt and drought stress [3,12,13,20]. The interactions between PIP1 and PIP2 function as the main signal for cellular membrane water and salt exchange. To provide insight into the interactions of soybean PIPs responding to salt stress, we analyzed the soybean PIP orthologs and tested their interactions using the yeast two-hybrid system.
Soybean (Gm)PIP1;6 has been well characterized before now. Its function in growth regulation and salt tolerance was analyzed by constitutive overexpression [13]. PIP1 and PIP2 had highly conserved amino acid sequences; the main structural difference between them was the length of their N- and C-terminal ends [1]. In soybean, the N-terminal ends of GmPIP1 were longer than those of GmPIP2 (approximately 15 amino acids); however, the C-terminal ends of the GmPIP1 type are shorter than those of the GmPIP2 type (approximately 8 amino acids). Interestingly, the transmembrane domain (TMD) of both GmPIP1 and GmPIP2 nearly shares the same section (Figure S1). In the present study, the TMDs of GmPIPs were predicted by SMART software [27]. All GmPIPs contained six TMDs. GmPIP1;5 and GmPIP1;6 differed by two amino acids in TMD2 (D/Y) and TMD6 (H/Q). However, there were many differences in TMD2, TMD4, and TMD6 among GmPIP2;4, GmPIP2;6, GmPIP2;8, GmPIP2;9, GmPIP2;10, and GmPIP2;11. This indicates that the highly conserved sequences in TMD1, TMD3, and TMD5 might play a crucial role in the formation of PIP1–PIP2 pairs between GmPIP1 and GmPIP2 (the strong interactions are shown in Table 1). Using extensive amino acid substitution mutagenesis, Yoo et al. studied tetramer formation in Arabidopsis AtPIP2;1 [21]. They demonstrated that TMD1, TMD2, and TMD5 contained essential amino acid residues essential to tetramer formation.
In evolutionary progress, gene duplication events increase gene number by tandem- and segmental-duplication [22]. The expansion of aquaporin gene families via genome duplication events has been reported in plants [23]. Soybean (Glycine max (L.) Merr.) is a well-documented paleopolyploid and has undergone at least two rounds of large-scale duplication, approximately 14- and 42-million years ago [24]. In this study, we searched the database PGDD [25], and identified GmPIP1 and GmPIP2 families with ten and fourteen members, respectively. Ispolatov et al. proposed that duplicated proteins were more likely to interact among themselves than with other proteins, and that paralogous interactions were inherited from ancient homo-dimeric proteins, rather than established de novo after gene duplication [33]. The Y2H tests performed in the present research detected clear homo-interaction occurring between GmPIP2;9s. On the other hand, the result also shows GmPIP1;6 and 1;7 sharing high similarity, and they could strongly interact with each other as well. These results thus partially corroborate Ispolatov et al.’s hypothesis.
The transcriptional profiles of PIPs might provide evidence for their protein interactions. For example, a joint increase (or decrease) in the expression of specific PIP1PIP2 pairs in plants under stress may indicate shared functionality [16]. Thus, the formation of a heterotetramer composed of specific PIP1s and PIP2s could be affected by their mRNA abundance [1]. Transcriptional profiles in rice, maize, and Arabidopsis indicated interactions between PIP1–PIP2 pairs in these species [1]. Additionally, Zargar et al. developed a gene co-expression network of rice aquaporin genes (OsPIPs) and tonoplast intrinsic proteins (OsTIPs) using the Rice Friend server [34]. They found co-expressions of PIP1PIP2 pairs, indicating likely physical interactions between these proteins. In this study, the expression profiles of GmPIPs under salt stress also showed similar patterns in GmPIP1;5 and GmPIP1;6, and in GmPIP2;3, GmPIP2;4, GmPIP2;5 and GmPIP2;6, as well as in GmPIP2;9, GmPIP2;10, GmPIP2;11; GmPIP2;13 and GmPIP2;14. Most of the GmPIPs had high similarity (see the result 3.1), and also showed consistent gene expression patterns, except GmPIP1;4 and GmPIP1;5. We found physical interactions among GmPIPs using Y2H assays and detected both homotetramers and heterotetramers among these proteins. All the GmPIP1s and 2 heterotetramers involved GmPIP1;5 and GmPIP1;6 together with GmPIP2;4, 6, 8, 9, 11 and 13. GmPIP1 heterotetramers were detected only between GmPIP1;6 and GmPIP1;7, but no GmPIP2 heterotetramers were discovered. These findings indicate that the PIP1 type and PIP2 type might synergistically function in plant cells, which is consistent with the results reported in other species [9,13,14,15,16]. On the other hand, GmPIP2;9 was unique in its ability to form homotetramers. Except GmPIP2;8, 9 and 11, the rest of the hetero-interacting GmPIP-coding genes had similar expression profiles. Furthermore, the interactions between GmPIP1;5 and 2;11, GmPIP1;5 and 2;13, GmPIP1;6 and 2;9, GmPIP1;6 and 2;11, GmPIP1;6 and 2;13, and GmPIP1;6 and 1;7, as well as the GmPIP2;9 homo, could be enhanced by salt stress, but not the osmotic stress mimicked by mannitol. Similarly, the interaction between PIP1 and PIP2 triggered multiple physiological responses when the plant was exposed to salt stress in Thellungiella halophila [12], and our results also corroborate those of Bienert et al. [10], who reported PIP heterotetramerization under salt stress in Selaginella moellendorffii.
To date, many studies have implicated that aquaporins have multiple functions in plant responses to various stress factors disturbing the plant cell osmotic balance and nutrient homeostasis [1]. For instance, they were involved in the Arabidopsis response to drought stress [32], in leaves and roots of sugar beet under salt stress [15], and in rice’s tolerance to salt stress and cold stress [12]. The research on rice (Os)PIP performed by Liu et al. showed that in Xenopus oocyte, the expression of OsPIP1;3 alone led to OsPIP1;3 mislocalization to the endoplasmic reticulum, but not PM; when the co-expression of OsPIP1;3 with OsPIP2;2 recruited the protein to the PM, the water permeability of the Xenopus oocyte increased significantly [13]. As shown in Figure S3, OsPIP1;3 was the homolog of GmPIP1;4, 1;5, 1;6 and 1;7, and they were in the same branch; Y2H further showed the heterointeractions that occurred between GmPIP1;5 or 1;6 and part of GmPIP2s. This result thus corroborated the result for rice depicted above. GmPIP1;4, 1;5, 1;6 and 1;7 were also close orthologs to Arabidopsis (At)PIP1;2, which localizes to the Golgi apparatus and the membrane system. Hence, these PIPs might also play crucial roles in aquaporin trafficking from the Golgi apparatus to the membrane system in soybean. On the other hand, AtPIP1;2 was considered a functional water channel when it was expressed alone in Xenopus oocytes, and previous studies also implied that AtPIP1;2 might interact with itself, and form homotetramers [35]. In the present research, we did not detect self-interaction in GmPIP1s. However, GmPIP1;6 could interact with GmPIP1;7, which is its closest ortholog.

5. Conclusions

In this study, we analyzed the expression patterns of GmPIPs under salt stress and interactions among the encoded proteins. We found that GmPIP1;5 and GmPIP1;6 each formed heterotetramers with six GmPIP2-type aquaporins. GmPIP1;6 interacted with GmPIP1;7. Furthermore, GmPIP2;9 formed homotetramers. Some of these interactions were strengthened by salt stress, but not by osmotic stress. Most of the genes encoding interacting GmPIPs exhibited a similar expression pattern under salt stress. To date, no GmPIPs interaction in response to abiotic stress has been reported. The current research has provided the clue to further understand the probable molecular mechanisms of GmPIPs and their tetramerization in response to salt stress in soybean.

Supplementary Materials

The following are available online at https://www.mdpi.com/article/10.3390/agronomy11071312/s1, Table S1: The primers used for qRT-PCR, Table S2: The primers used for yeast two-hybrid assays (AD and BD) and Figures S1: Multiple alignment of soybean GmPIP1 type and GmPIP2 type aquaporins using Clustal X, Figure S2: The phylogenetic tree of GmPIPs, Figure S3: The phylogenetic tree of GmPIPs, AtPIPs and OsPIPs.

Author Contributions

Conceptualization, H.S., W.Q. and D.Z.; methodology, D.Z. and J.L.; software, D.Z.; validation, J.L.; formal analysis, D.Z. and J.L.; investigation, J.L.; writing—original draft preparation, D.Z. and J.L.; writing—review and editing, W.Q.; visualization, H.L.; supervision, D.Z. and H.S.; funding acquisition, W.Q. and H.S. All authors have read and agreed to the published version of the manuscript.

Funding

This study was sponsored by Natural Science Foundation of Jiangsu Province (BK20181244); Jiangshu Shuangchuang Talent Plan, the Excellent Scientist Plan of JAAS, and Jiangsu Agriculture Science and Technology Innovation Fund [CX(15)1005].

Institutional Review Board Statement

The study was conducted according to the guidelines of the Declaration of Helsinki, and approved by the Institutional Review Board of JIANGSU ACADEMY OF AGRICULTRURAL SCIENCES.

Informed Consent Statement

Not applicable.

Data Availability Statement

Data is contained within the article or supplementary materials.

Conflicts of Interest

The authors declare no conflict of interest.

References

  1. Yaneff, A.; Vitali, V.; Amodeo, G. PIP1 aquaporins: Intrinsic water channels or PIP2 aquaporin modulators? FEBS Lett. 2015, 589, 3508–3515. [Google Scholar] [CrossRef] [PubMed] [Green Version]
  2. Quigley, F.; Rosenberg, J.M.; Shachar-Hill, Y.; Bohnert, H.J. From genome to function: The Arabidopsis aquaporins. Genome Biol. 2001, 3, 1–17. [Google Scholar] [CrossRef] [PubMed]
  3. Zhang, D.; Ali, Z.; Wang, C.; Xu, L.; Yi, J.; Xu, Z.; Liu, X.; He, X.; Huang, Y.; Khan, I. Genome-wide sequence characterization and expression analysis of major intrinsic proteins in soybean (Glycine max L.). PLoS ONE 2013, 8, e56312. [Google Scholar] [CrossRef] [PubMed]
  4. Kayum, M.A.; Park, J.-I.; Nath, U.K.; Biswas, M.K.; Kim, H.-T.; Nou, I.-S. Genome-wide expression profiling of aquaporin genes confer responses to abiotic and biotic stresses in Brassica Rapa. BMC Plant Biol. 2017, 17, 23. [Google Scholar] [CrossRef] [PubMed] [Green Version]
  5. Deokar, A.A.; Tar'an, B. Genome-wide analysis of the aquaporin gene family in chickpea (Cicer arietinum L.). Front. Plant Sci. 2016, 7, 1802. [Google Scholar] [CrossRef] [PubMed] [Green Version]
  6. Beese-Sims, S.E.; Lee, J.; Levin, D.E. Yeast Fps1 glycerol facilitator functions as a homotetramer. Yeast 2011, 28, 815–819. [Google Scholar] [CrossRef] [PubMed]
  7. Gonen, T.; Sliz, P.; Kistler, J.; Cheng, Y.; Walz, T. Aquaporin-0 membrane junctions reveal the structure of a closed water pore. Nature 2004, 429, 193–197. [Google Scholar] [CrossRef] [PubMed]
  8. Harvengt, P.; Vlerick, A.; Fuks, B.; Wattiez, R.; Ruysschaert, J.M.; Homble, F. Lentil seed aquaporins form a hetero-oligomer which is phosphorylated by a Mg2+-dependent and Ca2+-regulated kinase. Biochem. J. 2000, 352, 183–190. [Google Scholar] [CrossRef] [PubMed]
  9. Fetter, K.; Wilder, V.V.; Menachem, M.; Chaumont, F. Interactions between plasma membrane aquaporins modulate their water channel activity. Plant Cell 2004, 16, 215–228. [Google Scholar] [CrossRef] [PubMed] [Green Version]
  10. Bienert, M.D.; Diehn, T.A.; Richet, N.; Chaumont, F.; Bienert, G.P. Heterotetramerization of plant PIP1 and PIP2 aquaporins is an evolutionary ancient feature to guide PIP1 plasma membrane localization and function. Front. Plant Sci. 2018, 9, 382. [Google Scholar] [CrossRef]
  11. Hachez, C.; Laloux, T.; Reinhardt, H.; Cavez, D.; Degand, H.; Grefen, C.; De Rycke, R.; Inzé, D.; Blatt, M.R.; Russinova, E. Arabidopsis SNAREs SYP61 and SYP121 coordinate the trafficking of plasma membrane aquaporin PIP2; 7 to modulate the cell membrane water permeability. Plant Cell 2014, 26, 3132–3147. [Google Scholar] [CrossRef] [Green Version]
  12. Qiang, X.; Yu, G.; Jiang, L.; Sun, L.; Zhang, S.; Wei, L.; Cheng, X. Thellungiella halophila ThPIP1 gene enhances the tolerance of the transgenic rice to salt stress. J. Integr. Agric. 2015, 14, 1911–1922. [Google Scholar] [CrossRef]
  13. Liu, S.; Fukumoto, T.; Gena, P.; Feng, P.; Sun, Q.; Li, Q.; Matsumoto, T.; Kaneko, T.; Zhang, H.; Zhang, Y.; et al. Ectopic expression of a rice plasma membrane intrinsic protein (OsPIP1;3) promotes plant growth and water uptake. Plant J. 2020, 102, 779–796. [Google Scholar] [CrossRef]
  14. Mahdieh, M.; Mostajeran, A.; Horie, T.; Katsuhara, M. Drought stress alters water relations and expression of PIP-type aquaporin genes in Nicotiana tabacum plants. Plant Cell Physiol. 2008, 49, 801–813. [Google Scholar] [CrossRef]
  15. Vandeleur, R.K.; Mayo, G.; Shelden, M.C.; Gilliham, M.; Kaiser, B.N.; Tyerman, S.D. The role of plasma membrane intrinsic protein aquaporins in water transport through roots: Diurnal and drought stress responses reveal different strategies between isohydric and anisohydric cultivars of grapevine. Plant Physiol. 2009, 149, 445–460. [Google Scholar] [CrossRef] [Green Version]
  16. Bellati, J.; Alleva, K.; Soto, G.; Vitali, V.; Jozefkowicz, C.; Amodeo, G. Intracellular pH sensing is altered by plasma membrane PIP aquaporin co-expression. Plant Mol. Biol. 2010, 74, 105–118. [Google Scholar] [CrossRef]
  17. Jozefkowicz, C.; Rosi, P.; Sigaut, L.; Soto, G.; Pietrasanta, L.I.; Amodeo, G.; Alleva, K. Loop A is critical for the functional interaction of two Beta vulgaris PIP aquaporins. PLoS ONE 2013, 8, e57993. [Google Scholar] [CrossRef] [Green Version]
  18. Zhang, D.; Tong, J.; He, X.; Xu, Z.; Xu, L.; Wei, P.; Huang, Y.; Brestic, M.; Ma, H.; Shao, H. A novel soybean intrinsic protein gene, GmTIP2;3, involved in responding to osmotic stress. Front. Plant Sci. 2016, 6, 1237. [Google Scholar] [CrossRef] [Green Version]
  19. Lu, L.; Dong, C.; Liu, R.; Zhou, B.; Wang, C.; Shou, H. Roles of soybean plasma membrane intrinsic protein GmPIP2; 9 in drought tolerance and seed development. Front. Plant Sci. 2018, 9, 530. [Google Scholar] [CrossRef] [Green Version]
  20. Zhou, L.; Wang, C.; Liu, R.; Han, Q.; Vandeleur, R.K.; Du, J.; Tyerman, S.; Shou, H. Constitutive overexpression of soybean plasma membrane intrinsic protein GmPIP1; 6 confers salt tolerance. BMC Plant Biol. 2014, 14, 181. [Google Scholar] [CrossRef] [Green Version]
  21. Dajic, Z. Salt stress. In Physiology and Molecular Biology of Stress Tolerance in Plants; Springer: Dordrecht, The Netherlands, 2006; pp. 41–99. [Google Scholar]
  22. Lv, X.; Jin, Y.; Wang, Y. De novo transcriptome assembly and identification of salt-responsive genes in sugar beet M14. Comput. Biol. Chem. 2018, 75, 1–10. [Google Scholar] [CrossRef]
  23. Wu, J.; Jiang, Y.; Liang, Y.; Chen, L.; Chen, W.; Cheng, B. Expression of the maize MYB transcription factor ZmMYB3R enhances drought and salt stress tolerance in transgenic plants. Plant Physiol. Biochem. 2019, 137, 179–188. [Google Scholar] [CrossRef]
  24. Shoemaker, R.C.; Schlueter, J.; Doyle, J.J. Paleopolyploidy and gene duplication in soybean and other legumes. Curr. Opin. Plant Biol. 2006, 9, 104–109. [Google Scholar] [CrossRef]
  25. Plant Genome Duplication Database. Available online: http://chibba.agtec.uga.edu/duplication/ (accessed on 8 August 2019).
  26. RiceFREND. Available online: http://ricefrend.dna.affrc.go.jp (accessed on 8 August 2019).
  27. SMART. Available online: http://smart.embl-heidelberg.de (accessed on 1 September 2019).
  28. Tamura, K.; Peterson, D.; Peterson, N.; Stecher, G.; Nei, M.; Kumar, S. MEGA5: Molecular evolutionary genetics analysis using maximum likelihood, evolutionary distance, maximum parsimony methods. Mol. Biol. Evol. 2011, 28, 2731–2739, MEGA 5. Available online: https://www.megasoftware.net/ (accessed on 23 August 2019). [CrossRef] [Green Version]
  29. Brito, C.; Dinis, L.-T.; Ferreira, H.; Rocha, L.; Pavia, I.; Moutinho-Pereira, J.; Correia, C.M. Kaolin particle film modulates morphological, physiological and biochemical olive tree responses to drought and rewatering. Plant Physiol. Biochem. 2018, 133, 29–39. [Google Scholar] [CrossRef]
  30. Pavia, I.; Roque, J.; Rocha, L.; Ferreira, H.; Castro, C.; Carvalho, A.; Silva, E.; Brito, C.; Gonçalves, A.; Lima-Brito, J. Zinc priming and foliar application enhances photoprotection mechanisms in drought-stressed wheat plants during anthesis. Plant Physiol. Biochem. 2019, 140, 27–42. [Google Scholar] [CrossRef]
  31. Sun, K.; Wang, H.; Xia, Z. The maize bHLH transcription factor bHLH105 confers manganese tolerance in transgenic tobacco. Plant Sci. 2019, 280, 97–109. [Google Scholar] [CrossRef]
  32. Afzal, Z.; Howton, T.; Sun, Y.; Mukhtar, M.S. The roles of aquaporins in plant stress responses. J. Dev. Biol. 2016, 4, 9. [Google Scholar] [CrossRef] [Green Version]
  33. Ispolatov, I.; Yuryev, A.; Mazo, I.; Maslov, S. Binding properties and evolution of homodimers in protein–protein interaction networks. Nucleic Acids Res. 2005, 33, 3629–3635. [Google Scholar] [CrossRef] [Green Version]
  34. Zargar, S.M.; Nagar, P.; Deshmukh, R.; Nazir, M.; Wani, A.A.; Masoodi, K.Z.; Agrawal, G.K.; Rakwal, R. Aquaporins as potential drought tolerance inducing proteins: Towards instigating stress tolerance. J. Proteom. 2017, 169, 233–238. [Google Scholar] [CrossRef]
  35. Tournaire-Roux, C.; Sutka, M.; Javot, H.; Gout, E.; Gerbeau, P.; Luu, D.-T.; Bligny, R.; Maurel, C. Cytosolic pH regulates root water transport during anoxic stress through gating of aquaporins. Nature 2003, 425, 393–397. [Google Scholar] [CrossRef] [PubMed]
Figure 1. Expression profiles of GmPIPs in response to salt stress. The relative transcript abundances of GmPIP genes in soybean seedling roots were quantified by qPCR, using soybean GmTubulin and GmActin as the internal control. Roots of 2-week-old soybean seedlings were used to investigate the changes in gene expression in response to salt stress (200 mM NaCl for 0, 2, and 12 h). The results are presented as column graphs, with means ± SD of three independent biological replications. Different letters on the bar indicate significant differences (p < 0.05, one-way ANOVA). The red and green arrow in the left upper corner of the chart mean significant up- and downregulation after salt stress, respectively. Red and green arrows together mean the expression level significantly increased at 2 h but decreased 12 h later.
Agronomy 11 01312 g001
Figure 2. The yeast two-hybrid (Y2H) assays show that GmPIP1s and GmPIP2s interact to form heterotetramers. Full-length GmPIP genes were cloned into pGADT7 (with the activation domain, AD) and pGBKT7 (with the DNA-binding domain, BD). Different combinations of pGADT7 and pGBKT7 constructs were co-transformed into the Y187 and Y2H gold yeast strains. Yeast cells were grown in liquid selective media to OD600 = 1.0, and then spotted at 1-, 10-, 100-, and 1000-fold dilutions on the SD-Leu-Trp and SD-Leu-Trp-Ade-His selective plates. All the plates were incubated at 30 °C for colony growth. Yeast cells harboring pGBKT7–53/pGADT7-SV40 plasmids were the positive control, and those with pGBKT7-Lam/pGADT7-SV40 were the negative control. The numbers 1–31 represent the AD and BK vectors listed in the table on the right. The GmPIPs were selected according to the results of phylogenetic and gene expression analyses depicted above. Those without significant changes in their gene Els were not picked up. The phylogenetic analysis indicated that GmPIP1;1 and 1;2, 1;4 and 1;5, and 1–6 and 1;7, and GmPIP2;1 and 2;2, 2;3 and 2;4, 2;6 and 2;6, 2;7 and 2;8, 2;10 and 2;11, and 2;13 and 2;14 had high similarity. In each pair, one GmPIP was selected for the Y2H assay. However, GmPIP1–4 and GmPIP1–5 were selected because in the qPCR assay, they showed opposite expression patterns in response to salt stress. Moreover, GmPIP1;6 and GmPIP1;7 were also chosen because previous research reported GmPIP1;6 was relevant to salt and drought tolerance [20]. Samples No.1, 2 were positive and negative controls, which are underlined by the solid and dotted lines in black, respectively. The combinations that showed strong interaction are underlined in red.
Agronomy 11 01312 g002
Figure 3. The effects of salt and osmotic stress on the interaction of GmPIP1s with GmPIP2s. (A) All the yeast clones mentioned in Figure 2 were plated on selective plates (SD-Leu-Trp-His-Ade) with AbA (100 ng × ml−1) and X-a-gal. (B) The position of the yeast clones on the plates. (C) The clones were spotted on the selective plates SD-Leu-Trp-His-Ade with AbA (100 ng × ml−1), X-a-gal and 100 mM NaCl. (D) The clones were spotted on the selective plates SD-Leu-Trp-His-Ade with AbA (100 ng × ml−1), X-a-gal, and 200 mM mannitol.
Agronomy 11 01312 g003
Figure 4. Y2H to test homotetramerization of GmPIPs. Six GmPIP1 and two GmPIP2 genes were selected to construct the pGADT7 and pGBKT7 vectors. The same genes expressed in AD and BD were co-transformed into the Y187 and Y2H gold yeast strain. The fresh yeast cells (OD600 = 1.0) were spotted in 1-, 10-, 100- and 1000-fold dilution media on the SD-Leu-Trp plates or on SD-Leu-Trp-His-Ade+AbA (100 ng × mL−1) + X-a-gal containing 100 mM NaCl or 200 mM mannitol.
Agronomy 11 01312 g004
Table 1. The strong interactions of GmPIPs detected by Y2H.
Strengthened by Salt Stress
Hetero-interaction between GmPIP1s and 2sGmPIP1;5GmPIP2;2
GmPIP1;5GmPIP2;4
GmPIP1;5GmPIP2;6
GmPIP1;5GmPIP2;8
GmPIP1;5GmPIP2;9
GmPIP1;5GmPIP2;11Yes
GmPIP1;5GmPIP2;13Yes
GmPIP1;6GmPIP2;2
GmPIP1;6GmPIP2;4
GmPIP1;6GmPIP2;6
GmPIP1;6GmPIP2;8
GmPIP1;6GmPIP2;9Yes
GmPIP1;6GmPIP2;11Yes
GmPIP1;6GmPIP2;13Yes
Hetero-interaction between GmPIP1sGmPIP1;6GmPIP1;7Yes
Hetero-interaction between GmPIP2sNot detected
Homo-interaction between GmPIPGmPIP2;9Yes
Publisher’s Note: MDPI stays neutral with regard to jurisdictional claims in published maps and institutional affiliations.

