
Reducing the Evaporative Demand Improves Photosynthesis and Water Use Efficiency of Indoor Cultivated Lettuce


Abstract
:1. Introduction
2. Materials and Methods
2.1. Plant Material and Growth Chamber Conditions
2.2. Determination of Plant Growth Parameters
2.3. Stomatal Traits Analysis
2.4. Determination of Gravimetric Indices
2.5. Leaf Gas Exchanges
2.6. Measurements of Chlorophyll “a” Fluorescence
2.7. Statistics
3. Results
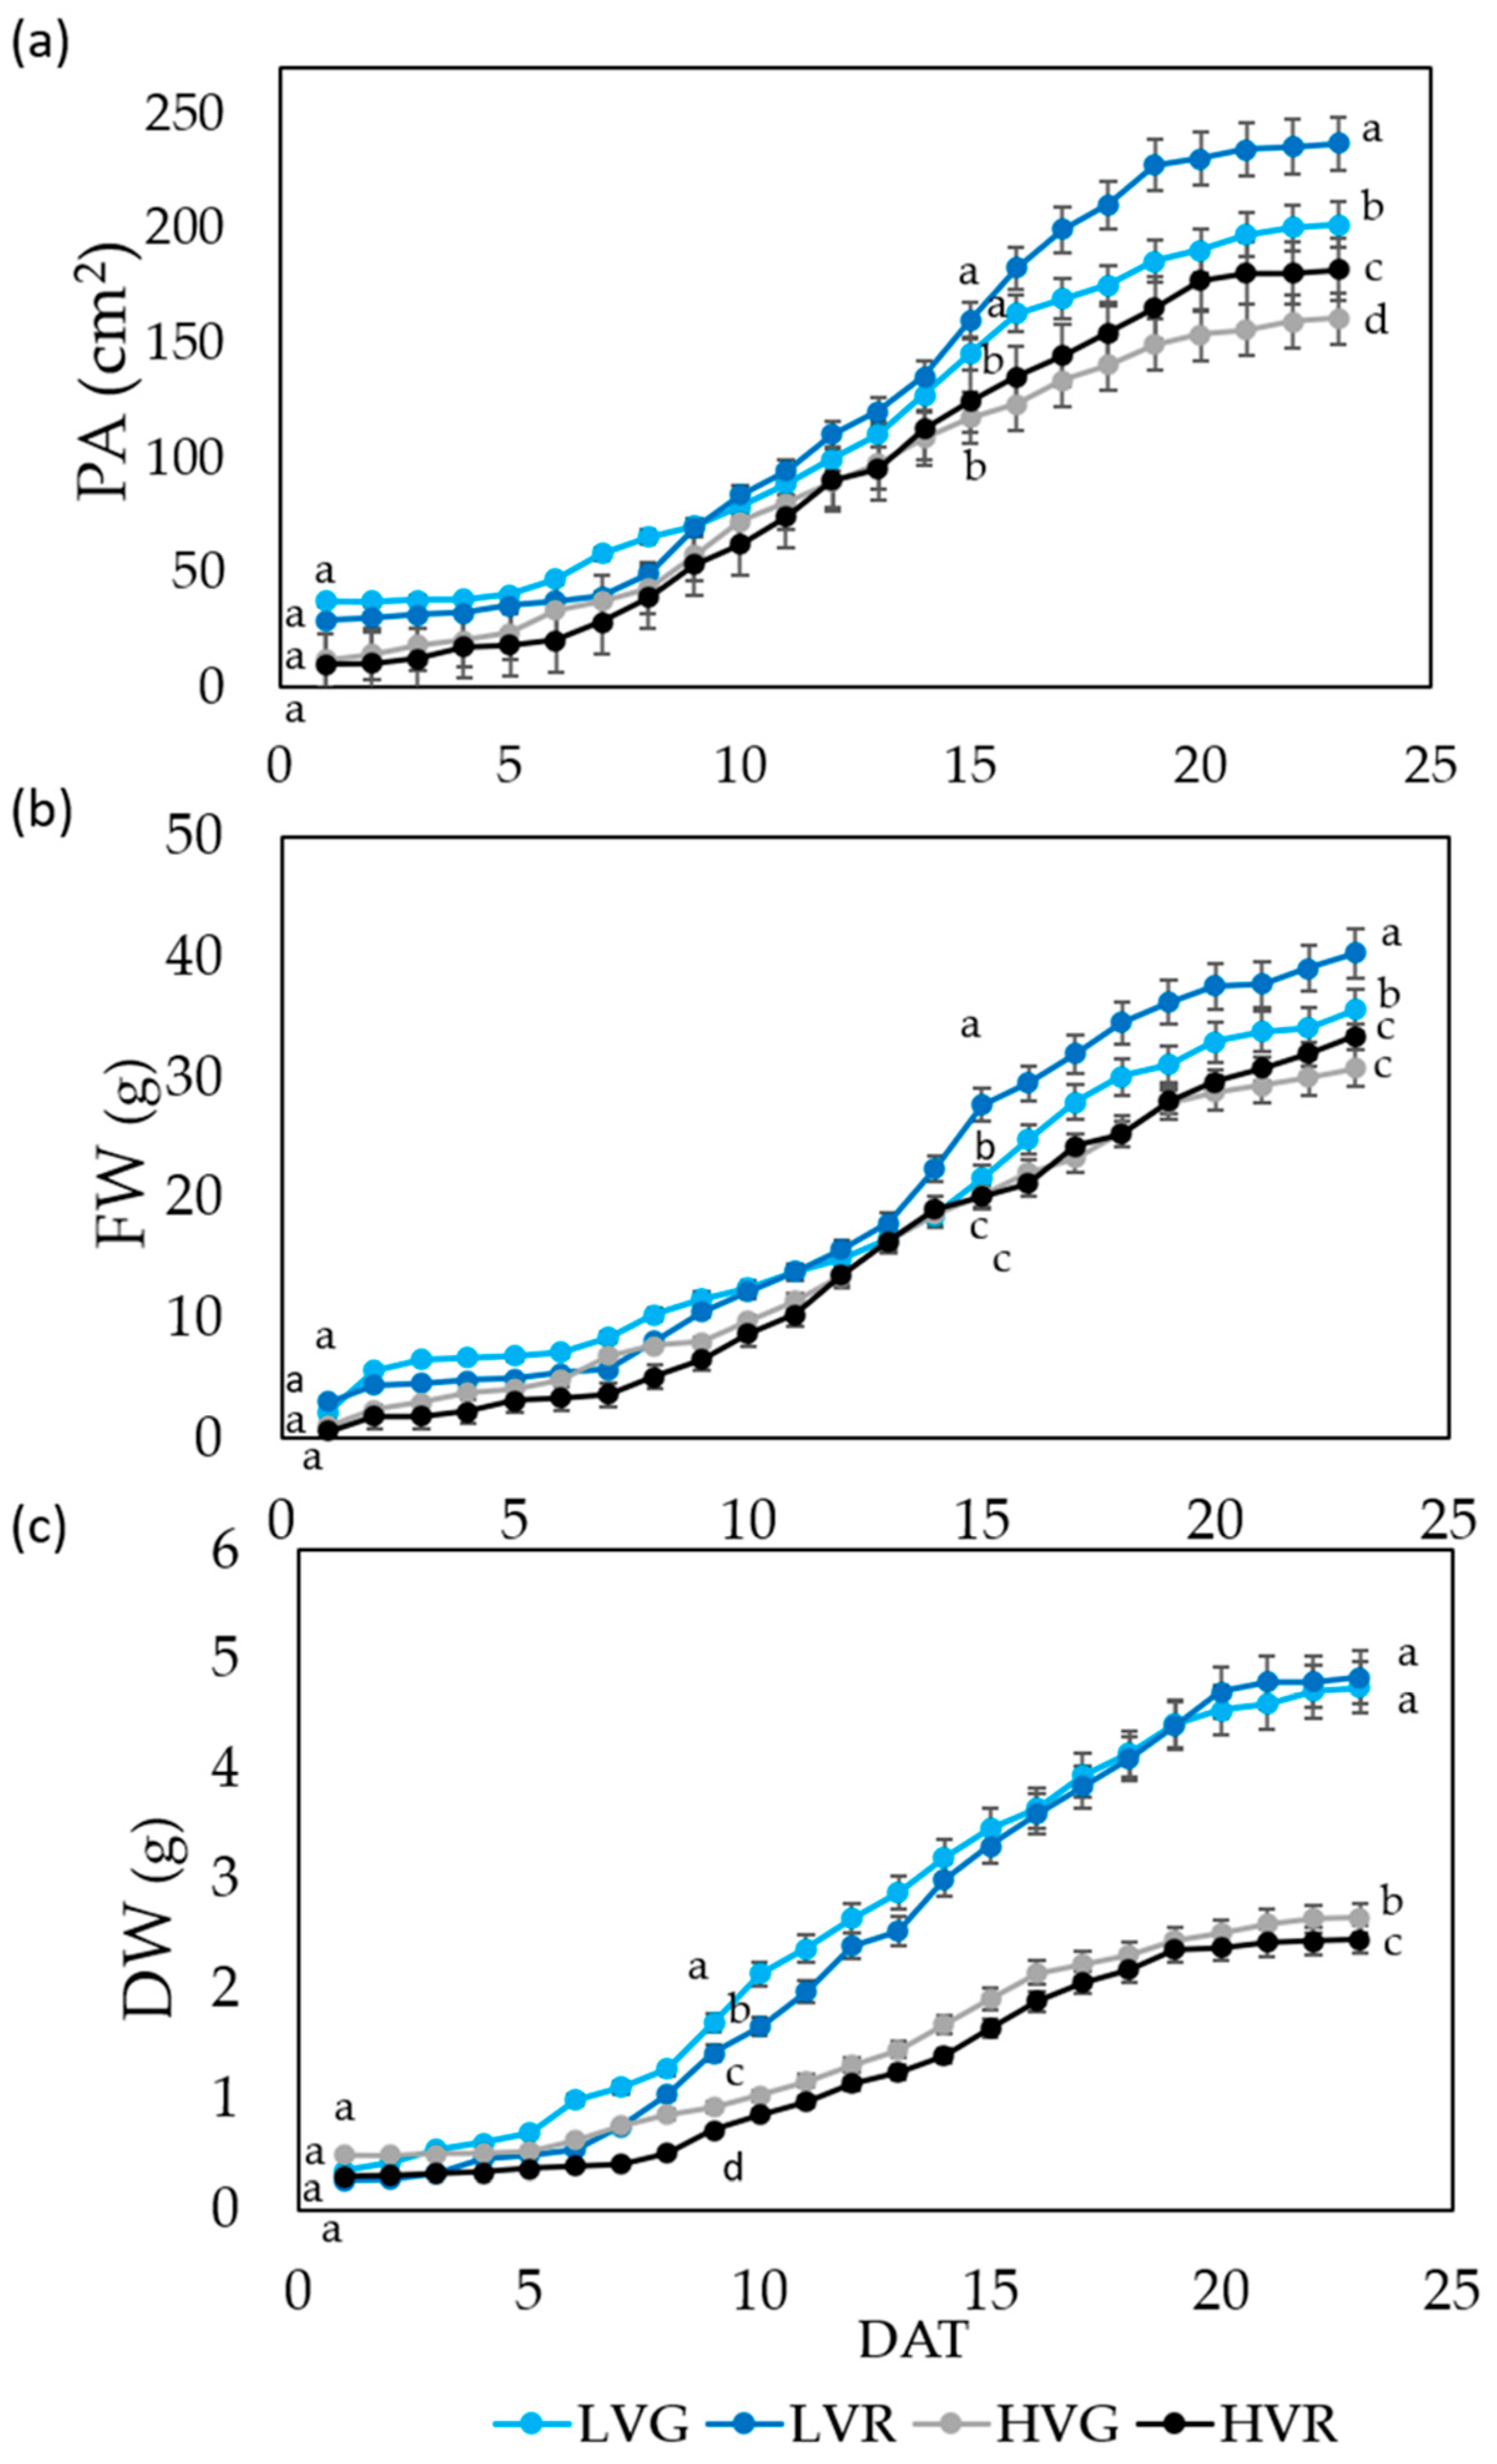
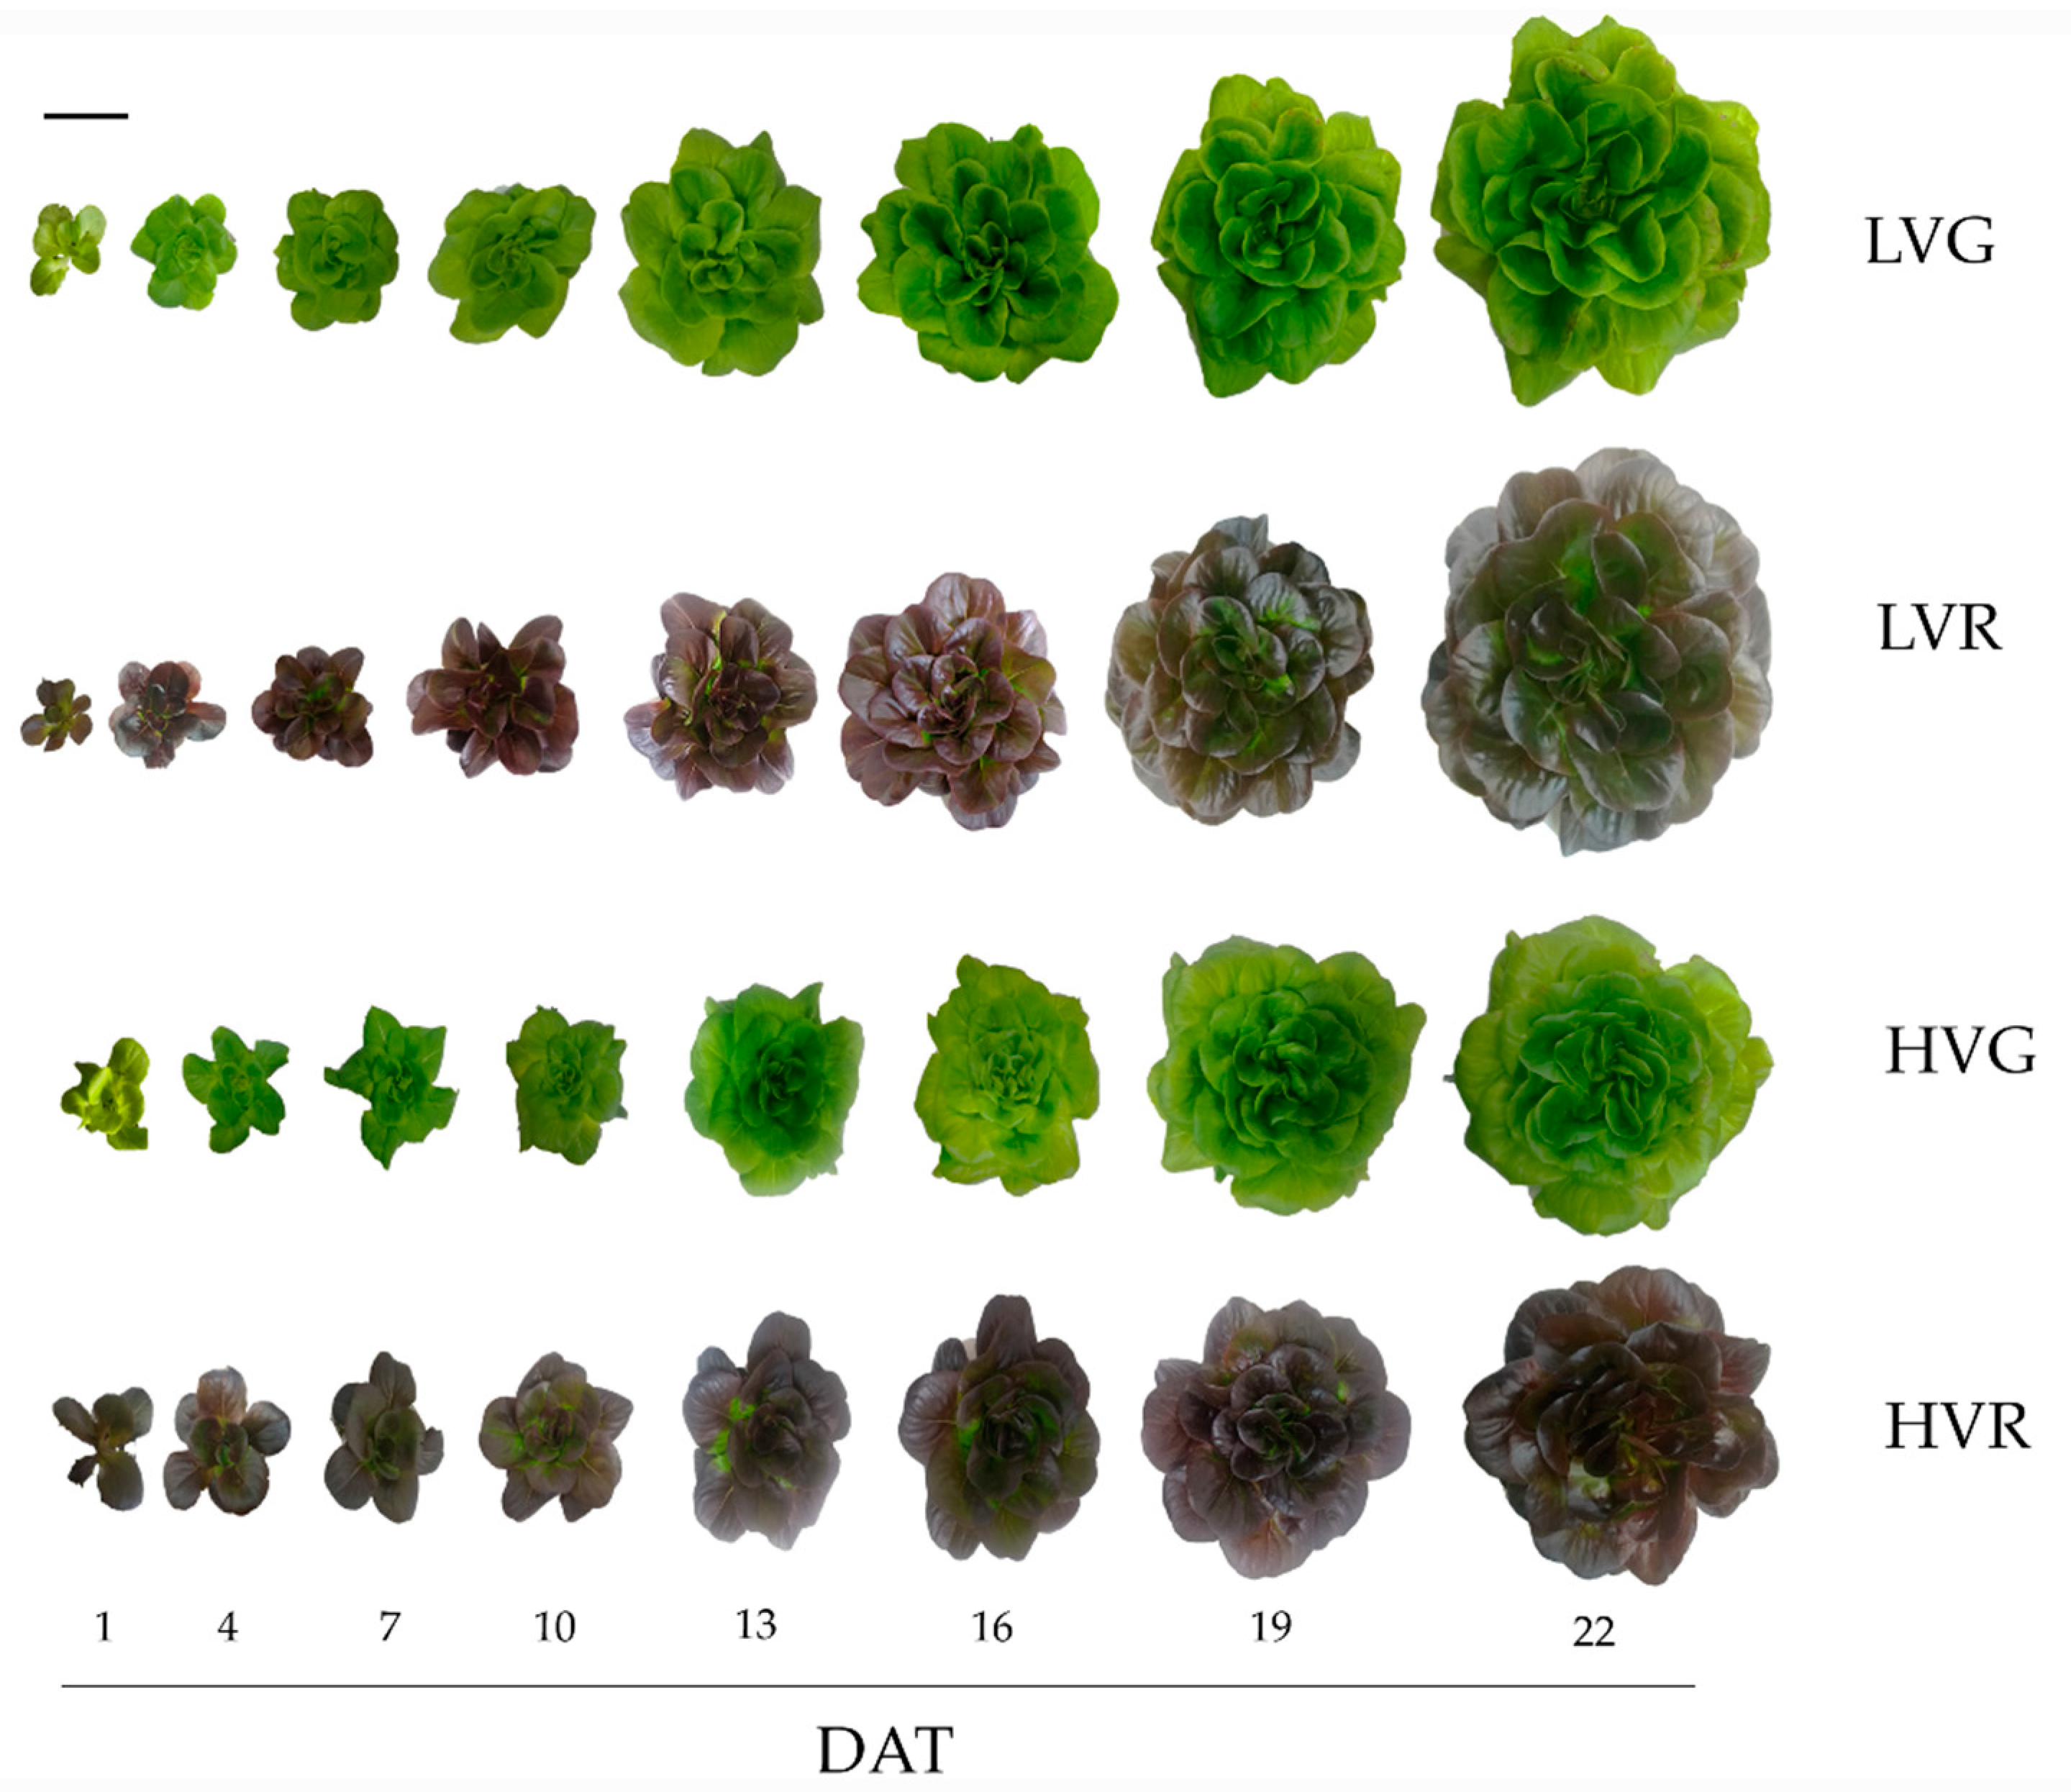
3.1. Growth Curves
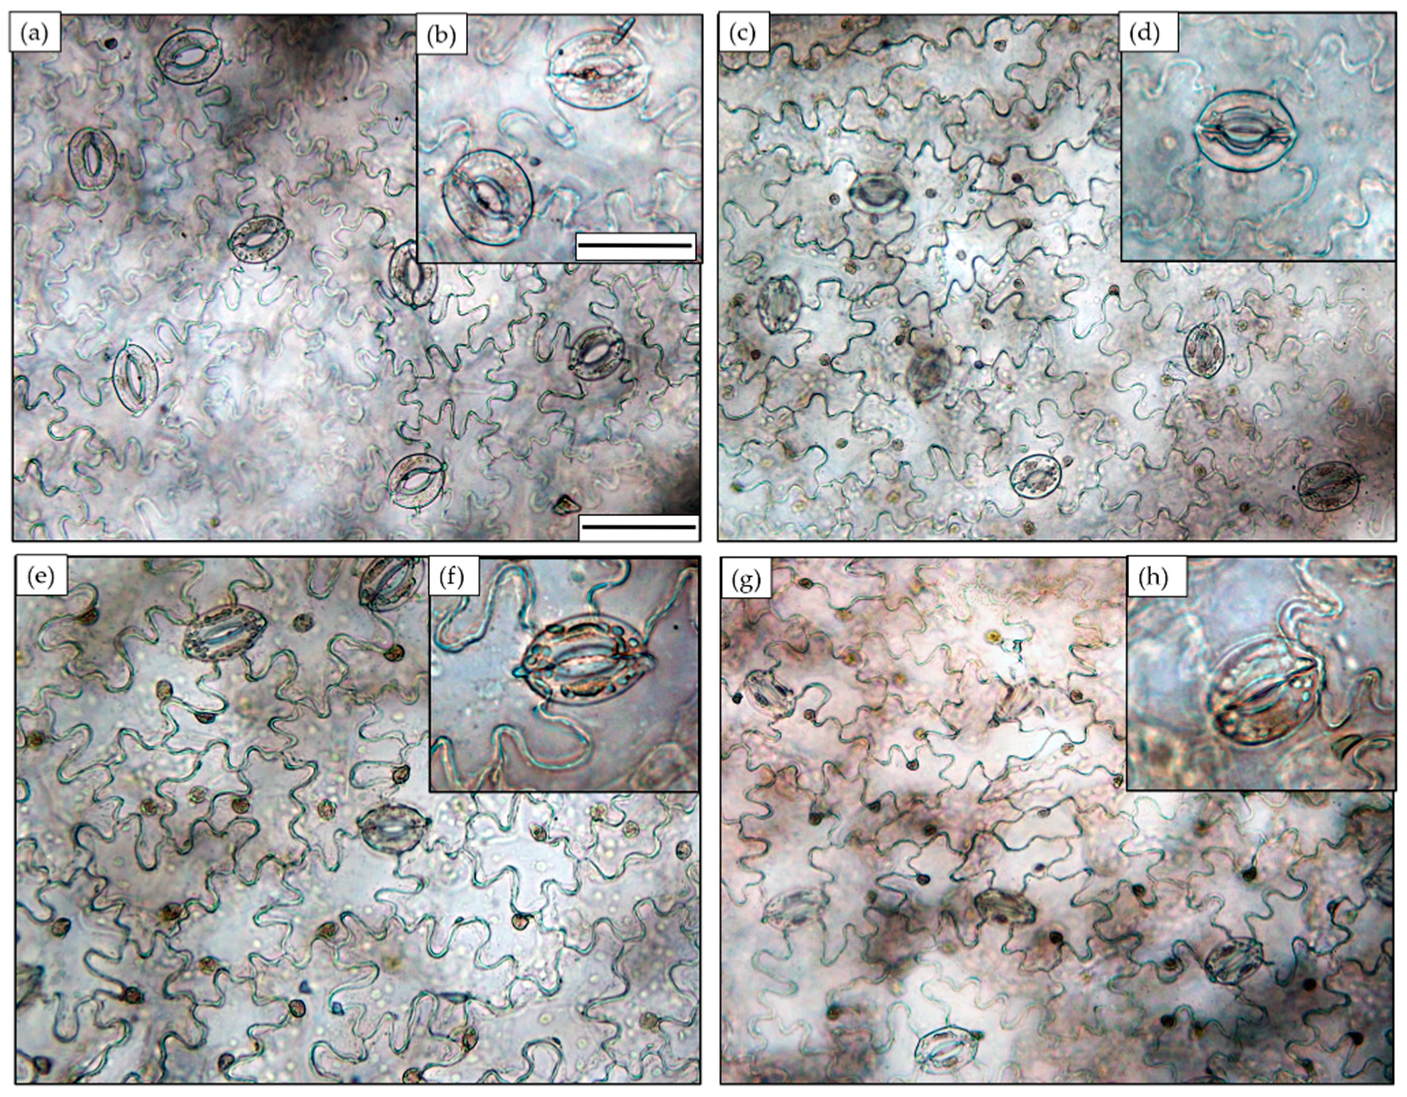
3.2. Stomatal Features
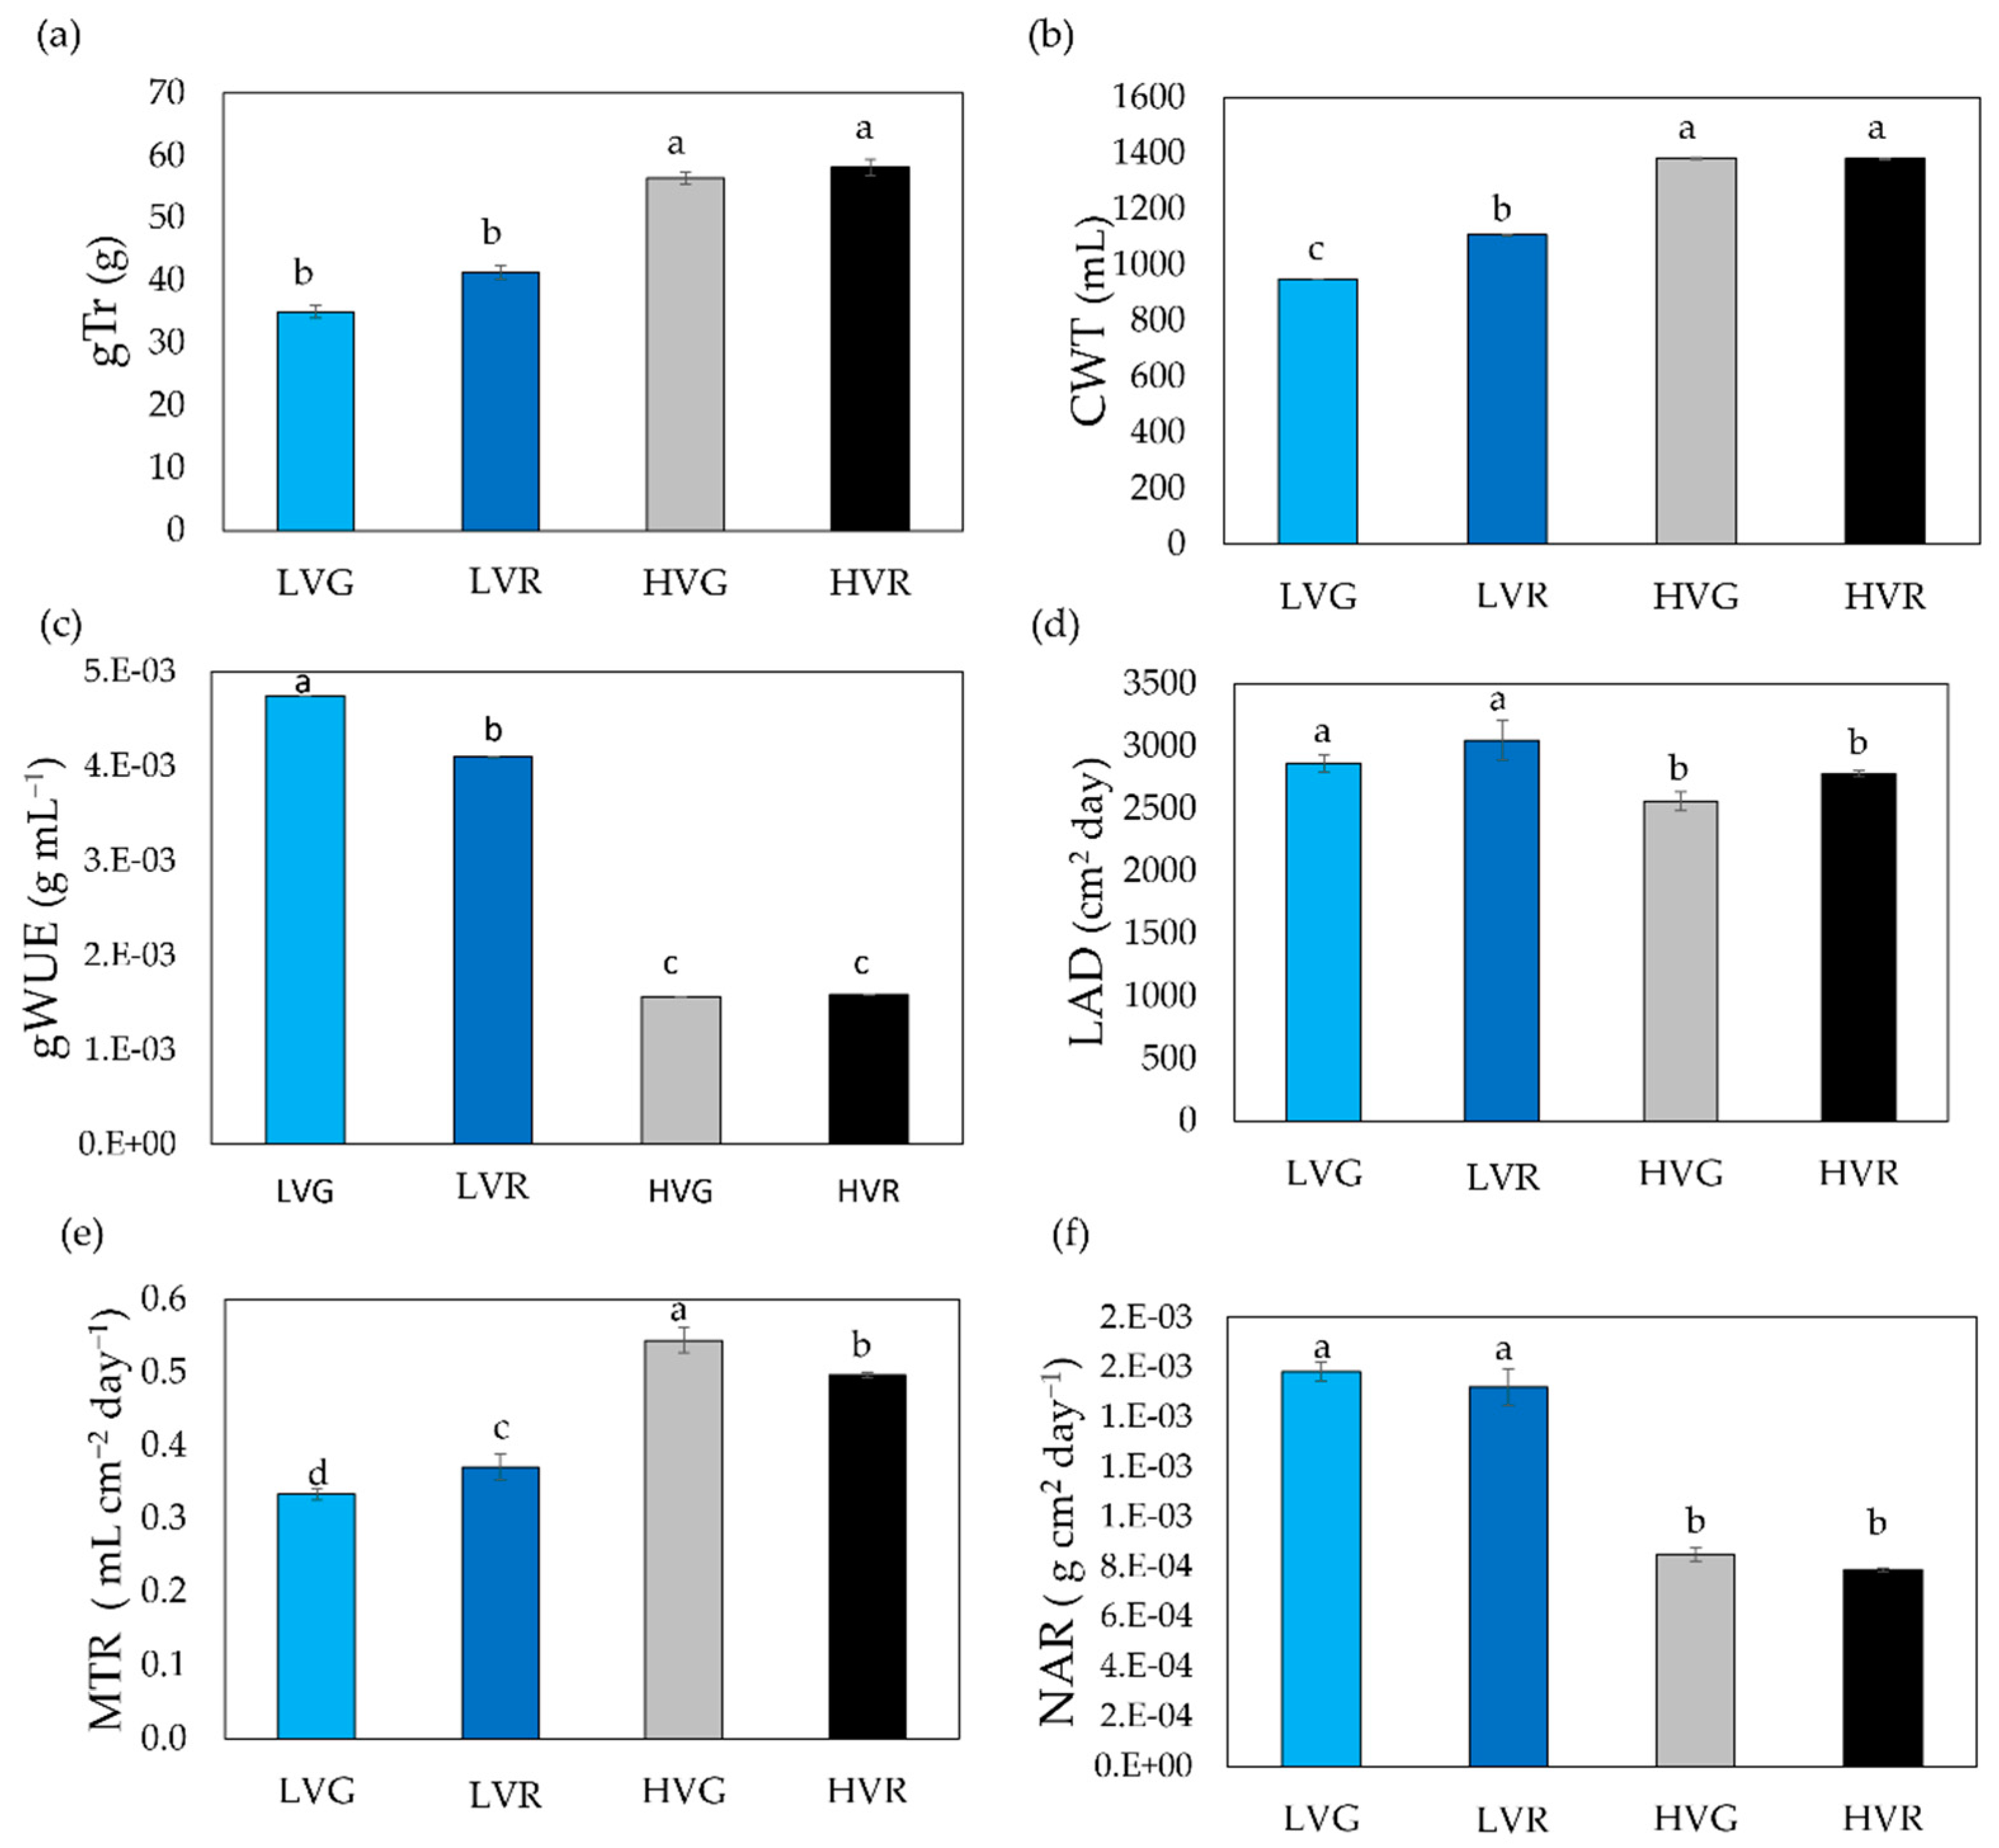
3.3. Daily Transpiration and Hydraulic-Related Traits
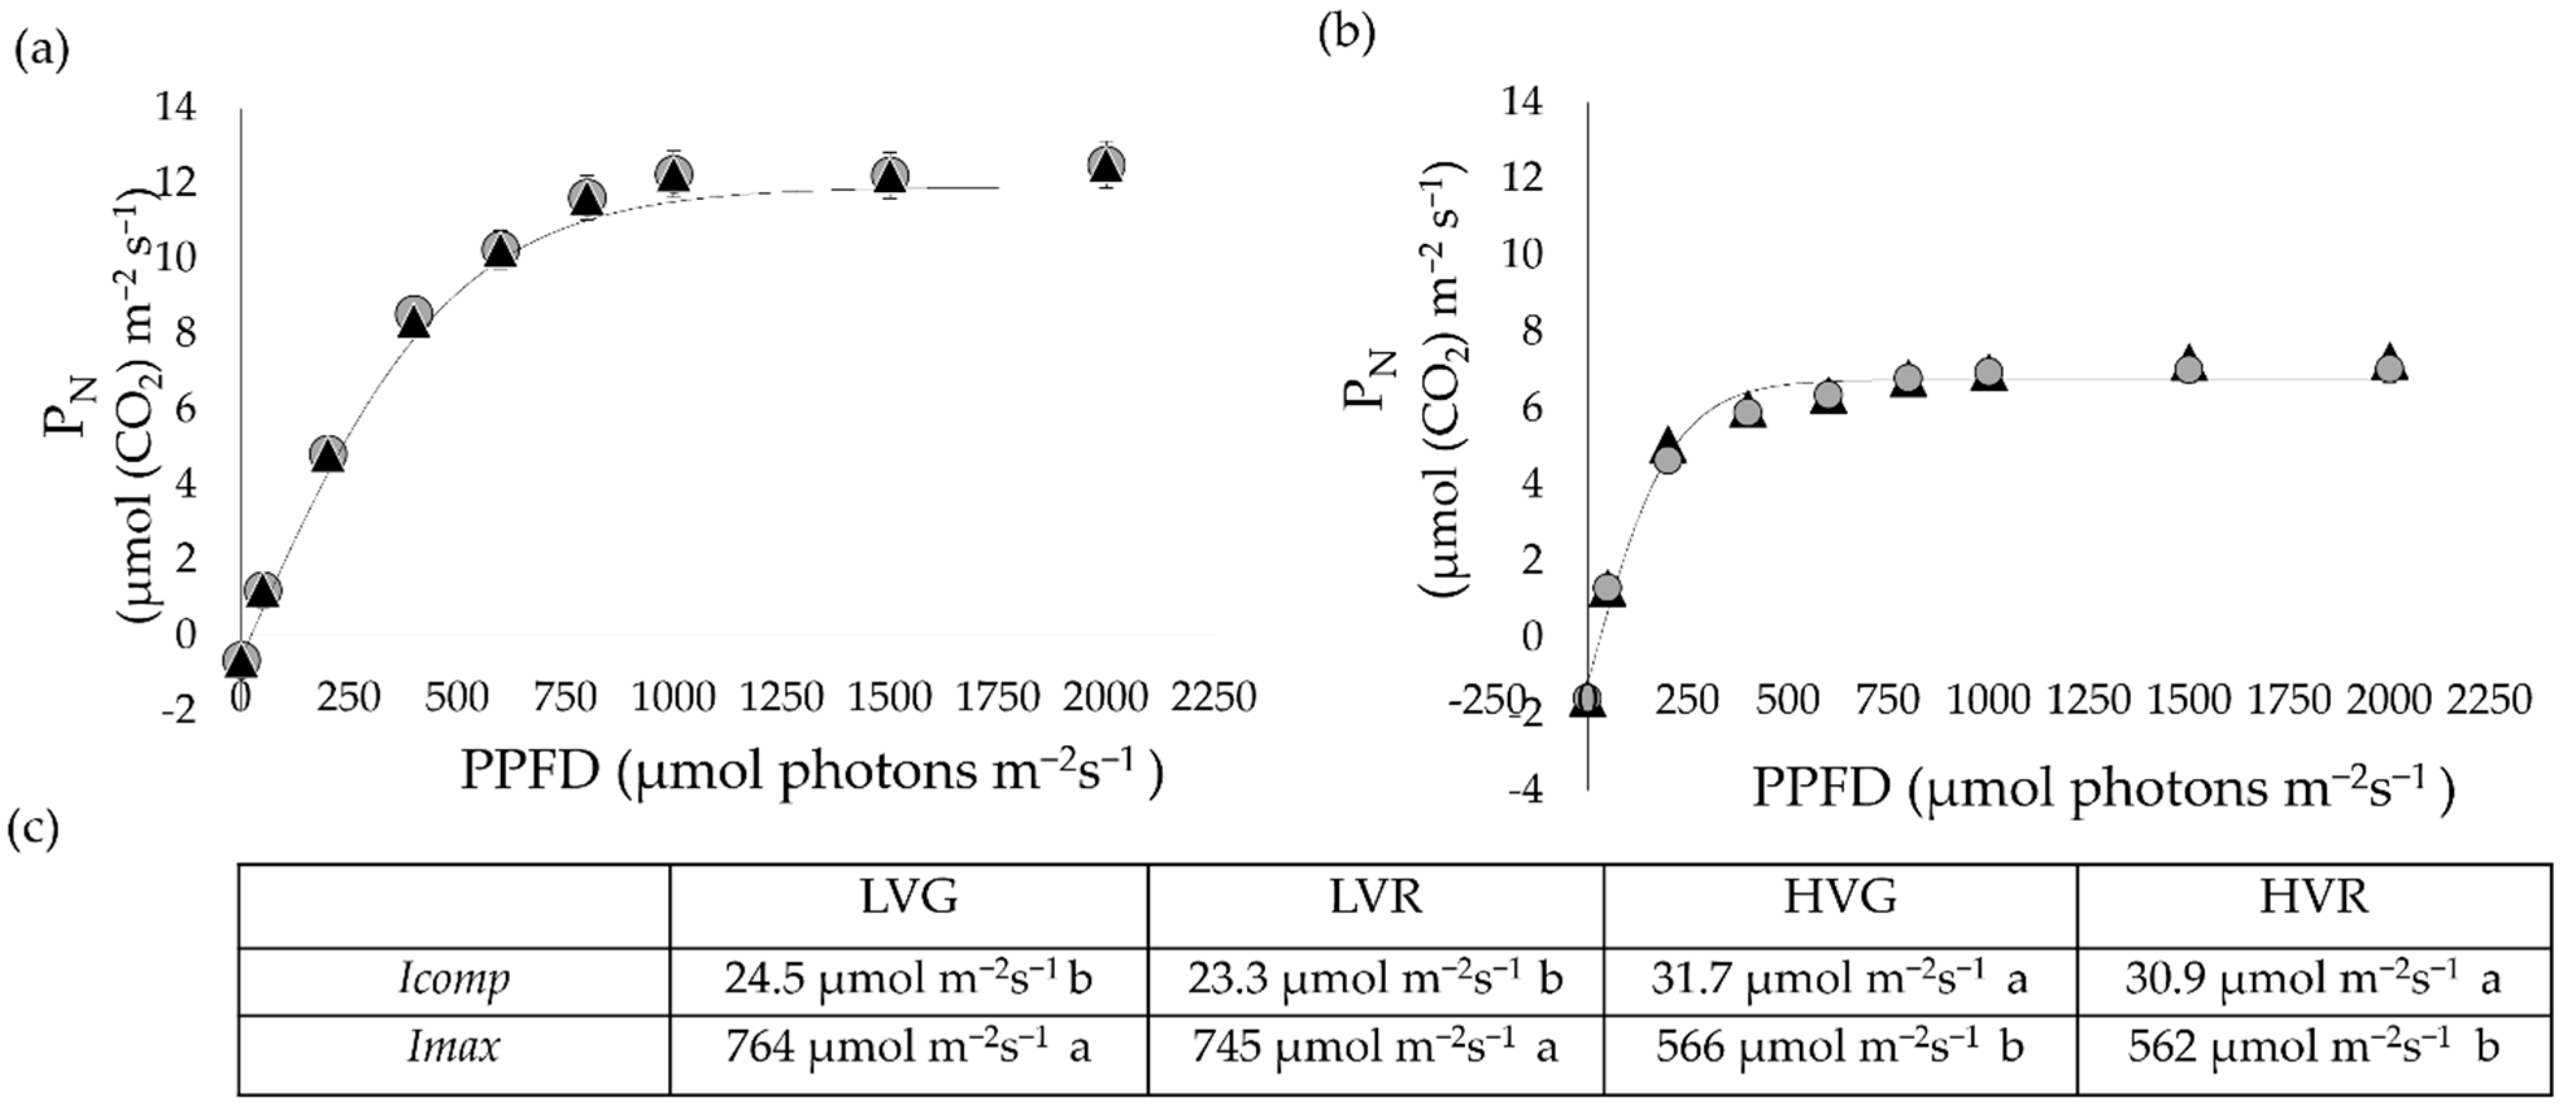
3.4. Leaf Gas Exchange, Chlorophyll Fluorescence and Photosynthetic Light Curves
4. Discussion
4.1. VPD Changes Stomatal Traits Influencing Crop Physiology
4.2. Tradeoff between Water Transpired and Plant Carbon Gain
5. Conclusions
Supplementary Materials
Author Contributions
Funding
Institutional Review Board Statement
Informed Consent Statement
Data Availability Statement
Acknowledgments
Conflicts of Interest
References
- Belko, N.; Zaman-Allah, M.; Diop, N.; Cisse, N.; Zombre, G.; Ehlers, J.; Vadez, V. Restriction of transpiration rate under high vapour pressure deficit and non-limiting water conditions is important for terminal drought tolerance in cowpea. Plant Biol. 2013, 15, 304–316. [Google Scholar] [CrossRef] [PubMed]
- Medina, S.; Vicente, R.; Nieto-Taladriz, M.T.; Aparicio, N.; Chairi, F.; Vergara-Diaz, O.; Araus, J.L. The plant-transpiration response to vapor pressure deficit (VPD) in durum wheat is associated with differential yield performance and specific expression of genes involved in primary metabolism and water transport. Front. Plant Sci. 2019, 9, 1994. [Google Scholar] [CrossRef] [Green Version]
- Zhang, D.; Jiao, X.; Du, Q.; Song, X.; Li, J. Reducing the excessive evaporative demand improved photosynthesis capacity at low costs of irrigation via regulating water driving force and moderating plant water stress of two tomato cultivars. Agric. Water Manag. 2018, 199, 22–33. [Google Scholar] [CrossRef]
- Shamshiri, R.R.; Jones, J.W.; Thorp, K.R.; Ahmad, D.; Che Man, H.; Taheri, S. Review of optimum temperature, humidity, and vapour pressure deficit for microclimate evaluation and control in greenhouse cultivation of tomato: A review. Int. Agrophys. 2018, 32, 287–302. [Google Scholar] [CrossRef]
- Grossiord, C.; Buckley, T.N.; Cernusak, L.A.; Novick, K.A.; Poulter, B.; Siegwolf, R.T.; Sperry, J.S.; McDowell, N.G. Plant responses to rising vapor pressure deficit. New Phytol. 2020, 226, 1550–1566. [Google Scholar] [CrossRef] [Green Version]
- Amitrano, C.; Arena, C.; Rouphael, Y.; De Pascale, S.; De Micco, V. Vapour pressure deficit: The hidden driver behind plant morphofunctional traits in controlled environments. Ann. Appl. Biol. 2019, 175, 313–325. [Google Scholar] [CrossRef]
- Brodribb, T.J. Bringing anatomy back into the equation. Plant Physiol. 2015, 168, 1461. [Google Scholar] [CrossRef]
- Athanasiou, K.; Dyson, B.C.; Webster, R.E.; Johnson, G.N. Dynamic acclimation of photosynthesis increases plant fitness in changing environments. Plant Physiol. 2010, 152, 366–373. [Google Scholar] [CrossRef] [PubMed] [Green Version]
- Lawson, T.; Blatt, M.R. Stomatal size, speed, and responsiveness impact on photosynthesis and water use efficiency. Plant Physiol. 2014, 164, 1556–1570. [Google Scholar] [CrossRef] [Green Version]
- Li, Q.; Wei, M.; Li, Y.; Feng, G.; Wang, Y.; Li, S.; Zhang, D. Effects of soil moisture on water transport, photosynthetic carbon gain and water use efficiency in tomato are influenced by evaporative demand. Agric. Water Manag. 2019, 226, 105818. [Google Scholar] [CrossRef]
- Buckley, T.N.; John, G.P.; Scoffoni, C.; Sack, L. How does leaf anatomy influence water transport outside the xylem? Plant Physiol. 2015, 168, 1616–1635. [Google Scholar] [CrossRef] [Green Version]
- Vialet-Chabrand, S.R.; Matthews, J.S.; McAusland, L.; Blatt, M.R.; Griffiths, H.; Lawson, T. Temporal dynamics of stomatal behavior: Modeling and implications for photosynthesis and water use. Plant Physiol. 2017, 174, 603–613. [Google Scholar] [CrossRef] [Green Version]
- Carins Murphy, M.R.; Jordan, G.J.; Brodribb, T.J. Acclimation to humidity modifies the link between leaf size and the density of veins and stomata. Plant Cell Environ. 2014, 37, 124–131. [Google Scholar] [CrossRef] [Green Version]
- Aliniaeifard, S.; Malcolm Matamoros, P.; van Meeteren, U. Stomatal malfunctioning under low VPD conditions: Induced by alterations in stomatal morphology and leaf anatomy or in the ABA signaling? Physiol. Plant. 2014, 152, 688–699. [Google Scholar] [CrossRef] [PubMed]
- Amitrano, C.; Arena, C.; Cirillo, V.; De Pascale, S.; De Micco, V. Leaf morpho-anatomical traits in Vigna radiata L. affect plant photosynthetic acclimation to changing vapor pressure deficit. Environ. Exp. Bot. 2021, 86, 104453. [Google Scholar] [CrossRef]
- De Micco, V.; Amitrano, C.; Stinca, A.; Izzo, L.G.; Zalloni, E.; Balzano, A.; Barile, R.; Conti, P.; Arena, C. Dust accumulation due to anthropogenic impact induces anatomical and photochemical changes in leaves of Centranthus ruber growing on the slope of the Vesuvius volcano. Plant Biol. 2019. [Google Scholar] [CrossRef]
- Carillo, P.; Cirillo, C.; De Micco, V.; Arena, C.; De Pascale, S.; Rouphael, Y. Morpho-anatomical, physiological and biochemical adaptive responses to saline water of Bougainvillea spectabilis Willd. trained to different canopy shapes. Agric. Water Manag. 2019, 212, 12–22. [Google Scholar] [CrossRef]
- Du, Q.; Jiao, X.; Song, X.; Zhang, J.; Bai, P.; Ding, J.; Li, J. The response of water dynamics to long-term high vapor pressure deficit is mediated by anatomical adaptations in plants. Front. Plant Sci. 2020, 11, 758. [Google Scholar] [CrossRef] [PubMed]
- Pautov, A.; Bauer, S.; Ivanova, O.; Krylova, E.; Yakovleva, O.; Sapach, Y.; Pautova, I. Influence of stomatal rings on movements of guard cells. Trees 2019, 33, 1459–1474. [Google Scholar] [CrossRef]
- López, J.; Way, D.A.; Sadok, W. Systemic effects of rising atmospheric vapor pressure deficit on plant physiology and productivity. Glob. Chang. Biol. 2021, 27, 1704–1720. [Google Scholar] [CrossRef]
- Latha, P.; Reddy, P. Determination of water use efficiency in groundnut by gravimetric method and its association with physiological parameters. Indian J. Plant Physiol. 2005, 10, 322. [Google Scholar]
- Zhang, D.; Zhang, Z.; Li, J.; Chang, Y.; Du, Q.; Pan, T. Regulation of vapor pressure deficit by greenhouse micro-fog systems improved growth and productivity of tomato via enhancing photosynthesis during summer season. PLoS ONE 2015, 10, e0133919. [Google Scholar] [CrossRef]
- Inoue, T.; Sunaga, M.; Ito, M.; Yuchen, Q.; Matsushima, Y.; Sakoda, K.; Yamori, W. Minimizing VPD fluctuations maintains higher stomatal conductance and photosynthesis, resulting in improvement of plant growth in lettuce. Front. Plant Sci. 2021, 12, 458. [Google Scholar] [CrossRef]
- Amitrano, C.; Chirico, G.B.; De Pascale, S.; Rouphael, Y.; De Micco, V. Application of a MEC model for the irrigation control in green and red-leaved lettuce in precision indoor cultivation. In Proceedings of the 2019 IEEE International Workshop on Metrology for Agriculture and Forestry (MetroAgriFor), Portici, Italy, 24–26 October 2019; pp. 196–201. [Google Scholar]
- Du, Q.; Liu, T.; Jiao, X.; Song, X.; Zhang, J.; Li, J. Leaf anatomical adaptations have central roles in photosynthetic acclimation to humidity. J. Exp. Bot. 2019, 70, 4949–4962. [Google Scholar] [CrossRef]
- Murphy, M.R.; Jordan, G.J.; Brodribb, T.J. Differential leaf expansion can enable hydraulic acclimation to sun and shade. Plant Cell Environ. 2012, 35, 1407–1418. [Google Scholar] [CrossRef]
- Amitrano, C.; Chirico, G.B.; De Pascale, S.; Rouphael, Y.; De Micco, V. Crop management in controlled environment agriculture (CEA) systems using predictive mathematical models. Sensors 2021, 20, 3110. [Google Scholar] [CrossRef] [PubMed]
- Bertolino, L.T.; Caine, R.S.; Gray, J.E. Impact of stomatal density and morphology on water-use efficiency in a changing world. Front. Plant Sci. 2019, 10, 225. [Google Scholar] [CrossRef] [Green Version]
- Sorrentino, M.C.; Capozzi, F.; Amitrano, C.; De Tommaso, G.; Arena, C.; Iuliano, M.; Giordano, S.; Spagnuolo, V. Facing metal stress by multiple strategies: Morphophysiological responses of cardoon (Cynara cardunculus L.) grown in hydroponics. Environ. Sci. Pollut. Res. 2021, 1–11. [Google Scholar] [CrossRef]
- Xu, Z.; Zhou, G. Responses of leaf stomatal density to water status and its relationship with photosynthesis in a grass. J. Exp. Bot. 2008, 59, 3317–3325. [Google Scholar] [CrossRef] [PubMed] [Green Version]
- Hermann, H.A.; Schwartz, J.M.; Johnson, G.N. From empirical to theoretical models of light response curves-linking photosynthetic and metabolic acclimation. Photosynth. Res. 2020, 145, 5–14. [Google Scholar] [CrossRef] [Green Version]
- Tsormpatsidis, E.; Henbest, R.; Battey, N.H.; Hadley, P. The influence of ultraviolet radiation on growth, photosynthesis and phenolic levels of green and red lettuce: Potential for exploiting effects of ultraviolet radiation in a production system. Ann. Appl. Biol. 2010, 156, 357–366. [Google Scholar] [CrossRef]
- Lobo, F.D.A.; De Barros, M.; Dalmagro, H.; Dalmolin, Â.; Pereira, W.; De Souza, E.; Vourlitis, G.; Ortíz, C.R. Fitting net photosynthetic light-response curves with Microsoft Excel—A critical look at the models. Photosynthetica 2013, 51, 445–456. [Google Scholar] [CrossRef]
- Korsakova, S.; Plugatar, Y.; Ilnitsky, O.; Karpukhin, Y. A research on models of the photosynthetic light response curves on the example of evergreen types of plants. Est. Univ. Life Sci. 2019, 17. [Google Scholar] [CrossRef]
- Genty, B.; Briantais, J.-M.; Baker, N.R. The relationship between the quantum yield of photosynthetic electron transport and quenching of chlorophyll fluorescence. Biochim. Biophys. Acta (BBA) Gen. Subj. 1989, 990, 87–92. [Google Scholar] [CrossRef]
- Krall, J.P.; Edwards, G.E. Relationship between photosystem II activity and CO2 fixation in leaves. Physiol. Plant. 1992, 86, 180–187. [Google Scholar] [CrossRef]
- Bilger, W.; Björkman, O. Role of the xanthophyll cycle in photoprotection elucidated by measurements of light-induced absorbance changes, fluorescence and photosynthesis in leaves of Hedera canariensis. Photosynth. Res. 1990, 25, 173–185. [Google Scholar] [CrossRef]
- Fanourakis, D.; Heuvelink, E.; Carvalho, S.M. A comprehensive analysis of the physiological and anatomical components involved in higher water loss rates after leaf development at high humidity. J. Plant Physiol. 2013, 170, 890–898. [Google Scholar] [CrossRef] [PubMed]
- Lu, N.; Nukaya, T.; Kamimura, T.; Zhang, D.; Kurimoto, I.; Takagaki, M.; Maruo, T.; Kozai, T.; Yamori, W. Control of vapor pressure deficit (VPD) in greenhouse enhanced tomato growth and productivity during the winter season. Sci. Hortic. 2015, 197, 17–23. [Google Scholar] [CrossRef]
- Franks, P.J.; Beerling, D.J. Maximum leaf conductance driven by CO2 effects on stomatal size and density over geologic time. Proc. Natl. Acad. Sci. USA 2009, 106, 10343–10347. [Google Scholar] [CrossRef] [Green Version]
- Kiani-Pouya, A.; Rasouli, F.; Rabbi, B.; Falakboland, Z.; Yong, M.; Chen, Z.-H.; Zhou, M.; Shabala, S. Stomatal traits as a determinant of superior salinity tolerance in wild barley. J. Plant Physiol. 2020, 245, 153108. [Google Scholar] [CrossRef]
- Lawson, T.; Vialet-Chabrand, S. Speedy stomata, photosynthesis and plant water use efficiency. New Phytol. 2019, 221, 93–98. [Google Scholar] [CrossRef] [Green Version]
- Patanè, C. Leaf area index, leaf transpiration and stomatal conductance as affected by soil water deficit and VPD in processing tomato in semi-arid Mediterranean climate. J. Agron. Crop Sci. 2011, 197, 165–176. [Google Scholar] [CrossRef]
- Wieland, F. Water transport and energy. Plant Cell Environ. 2017, 40, 977–994. [Google Scholar]
- Flexas, J.; Medrano, H. Drought-inhibition of photosynthesis in C3 plants: Stomatal and non-stomatal limitations revisited. Ann. Bot. 2002, 89, 183–189. [Google Scholar] [CrossRef] [PubMed] [Green Version]
- Hassiotou, F.; Evans, J.R.; Ludwig, M.; Veneklaas, E.J. Stomatal crypts may facilitate diffusion of CO2 to adaxial mesophyll cells in thick sclerophylls. Plant Cell Environ. 2009, 32, 1596–1611. [Google Scholar] [CrossRef]
- Nejad, A.R.; Van Meeteren, U. The role of abscisic acid in disturbed stomatal response characteristics of Tradescantia virginiana during growth at high relative air humidity. J. Exp. Bot. 2007, 58, 627–636. [Google Scholar] [CrossRef] [Green Version]
- Lake, J.A.; Woodward, F.I. Response of stomatal numbers to CO2 and humidity: Control by transpiration rate and abscisic acid. New Phytol. 2008, 179, 397–404. [Google Scholar] [CrossRef]
- Aliniaeifard, S.; van Meeteren, U. Can prolonged exposure to low VPD disturb the ABA signaling in stomatal guard cells? J. Exp. Bot. 2013, 64, 3551–3566. [Google Scholar] [CrossRef]
- El-Nakhel, C.; Petropoulos, S.A.; Pannico, A.; Kyriacou, M.C.; Giordano, M.; Colla, G.; Troise, A.D.; Vitaglione, P.; De Pascale, S.; Rouphael, Y. The bioactive profile of lettuce produced in a closed soilless system as configured by combinatorial effects of genotype and macrocation supply composition. Food Chem. 2020, 309, 125713. [Google Scholar] [CrossRef]
- Amitrano, C.; Rouphael, Y.; De Pascale, S.; De Micco, V. Modulating vapor pressure deficit in the plant micro-environment may enhance the bioactive value of lettuce. Horticulturae 2021, 7, 32. [Google Scholar] [CrossRef]
- Impa, S.; Nadaradjan, S.; Boominathan, P.; Shashidhar, G.; Bindumadhava, H.-Y.; Sheshshayee, M. Carbon isotope discrimination accurately reflects variability in WUE measured at a whole plant level in rice. Crop Sci. 2005, 45, 2517–2522. [Google Scholar] [CrossRef]
- Farquhar, G.D.; Lloyd, J. Carbon and oxygen isotope effects in the exchange of carbon dioxide between terrestrial plants and the atmosphere. In Stable Isotopes and Plant Carbon-Water Relations; Ehleringer, J., Hall, A., Farquhar, G., Eds.; Elsevier: Amsterdam, The Netherlands, 1993; pp. 47–70. [Google Scholar]
- Sorrentino, G.; Haworth, M.; Wahbi, S.; Mahmood, T.; Zuomin, S.; Centritto, M. Abscisic acid induces rapid reductions in mesophyll conductance to carbon dioxide. PLoS ONE 2016, 11, e0148554. [Google Scholar] [CrossRef] [PubMed] [Green Version]
- Haworth, M.; Killi, D.; Materassi, A.; Raschi, A.; Centritto, M. Impaired stomatal control is associated with reduced photosynthetic physiology in crop species grown at elevated [CO2]. Front. Plant Sci. 2016, 7, 1568. [Google Scholar] [CrossRef] [PubMed] [Green Version]
- Jiao, X.C.; Song, X.M.; Zhang, D.L.; Du, Q.J.; Li, J.M. Coordination between vapor pressure deficit and CO2 on the regulation of photosynthesis and productivity in greenhouse tomato production. Sci. Rep. 2019, 9, 8700. [Google Scholar] [CrossRef] [PubMed]
- Maxwell, K.; Johnson, G.N. Chlorophyll fluorescence—A practical guide. J. Exp. Bot. 2000, 51, 659–668. [Google Scholar] [CrossRef]
- Sorrentino, M.; Capozzi, F.; Amitrano, C.; Giordano, S.; Arena, C.; Spagnuolo, V. Performance of three cardoon cultivars in an industrial heavy metal-contaminated soil: Effects on morphology, cytology and photosynthesis. J. Hazard. Mater. 2018, 351, 131–137. [Google Scholar] [CrossRef]
- Baker, N.R. Chlorophyll fluorescence: A probe of photosynthesis in vivo. Annu. Rev. Plant Biol. 2008, 59, 89–113. [Google Scholar] [CrossRef] [Green Version]
- Chaves, M.; Oliveira, M. Mechanisms underlying plant resilience to water deficits: Prospects for water-saving agriculture. J. Exp. Bot. 2004, 55, 2365–2384. [Google Scholar] [CrossRef] [Green Version]
- Montanaro, G.; Dichio, B.; Xiloyannis, C. Shade mitigates photoinhibition and enhances water use efficiency in kiwifruit under drought. Photosynthetica 2009, 47, 363. [Google Scholar] [CrossRef]
- Ghorbanzadeh, P.; Aliniaeifard, S.; Esmaeili, M.; Mashal, M.; Azadegan, B.; Seif, M. Dependency of growth, water use efficiency, chlorophyll fluorescence, and stomatal characteristics of lettuce plants to light intensity. J. Plant Growth Regul. 2020, 1–17. [Google Scholar] [CrossRef]
- El-Nakhel, C.; Giordano, M.; Pannico, A.; Carillo, P.; Fusco, G.M.; De Pascale, S.; Rouphael, Y. Cultivar-specific performance and qualitative descriptors for butterhead Salanova lettuce produced in closed soilless cultivation as a candidate salad crop for human life support in space. Life 2019, 9, 61. [Google Scholar] [CrossRef] [PubMed] [Green Version]


| Treatments | SF | SS | SI |
|---|---|---|---|
| (n mm2) | (µm2) | (%) | |
| LVG | 86.01 ± 4.50 b | 179.3 ± 7.52 c | 12.65 ± 0.67 a |
| LVR | 93.72 ± 3.93 a | 148.8 ± 6.08 d | 13.67 ± 0.50 a |
| HVG | 64.19 ± 2.99 c | 208.3 ± 3.86 a | 7.68 ± 0.33 b |
| HVR | 71.89 ± 3.20 c | 192.8 ± 4.71 b | 7.64 ± 0.31 b |
| Treatments | ΦPSII | NPQ | ETR | iPN | igs | iWUE | iTr |
|---|---|---|---|---|---|---|---|
| (µmol CO2 m−2s−1) | (mmol H2O m−2s−1) | (iPN/iTr) | (mmol H2O m−2s−1) | ||||
| LVG | 0.70 ± 0.007 b | 1.18 ± 0.48 c | 55.96 ± 2.81 a | 7.43 ± 0.64 a | 0.18 ± 0.006 a | 5.11 ± 0.79 a | 1.59 ± 0.1 b |
| LVR | 0.71 ± 0.003 a | 0.79 ± 0.48 d | 45.17 ± 0.69 b | 7.74 ± 0.27 a | 0.20 ± 0.005 a | 4.55 ± 0.30 a | 1.68 ± 0.07 b |
| HVG | 0.67 ± 0.002 d | 1.46 ± 0.58 a | 45.67 ± 3.90 b | 5.89 ± 0.14 b | 0.07 ± 0.004 b | 2.87 ± 0.24 b | 2.15 ± 0.18 a |
| HVR | 0.68 ± 0.009 c | 1.28 ± 0.52 b | 43.72 ± 0.44 b | 6.50 ± 0.28 b | 0.08 ± 0.004 b | 3.52 ± 0.32 b | 1.99 ± 0.14 a |
Publisher’s Note: MDPI stays neutral with regard to jurisdictional claims in published maps and institutional affiliations. |
© 2021 by the authors. Licensee MDPI, Basel, Switzerland. This article is an open access article distributed under the terms and conditions of the Creative Commons Attribution (CC BY) license (https://creativecommons.org/licenses/by/4.0/).
Share and Cite
Amitrano, C.; Rouphael, Y.; Pannico, A.; De Pascale, S.; De Micco, V. Reducing the Evaporative Demand Improves Photosynthesis and Water Use Efficiency of Indoor Cultivated Lettuce. Agronomy 2021, 11, 1396. https://doi.org/10.3390/agronomy11071396
Amitrano C, Rouphael Y, Pannico A, De Pascale S, De Micco V. Reducing the Evaporative Demand Improves Photosynthesis and Water Use Efficiency of Indoor Cultivated Lettuce. Agronomy. 2021; 11(7):1396. https://doi.org/10.3390/agronomy11071396
Chicago/Turabian StyleAmitrano, Chiara, Youssef Rouphael, Antonio Pannico, Stefania De Pascale, and Veronica De Micco. 2021. "Reducing the Evaporative Demand Improves Photosynthesis and Water Use Efficiency of Indoor Cultivated Lettuce" Agronomy 11, no. 7: 1396. https://doi.org/10.3390/agronomy11071396
APA StyleAmitrano, C., Rouphael, Y., Pannico, A., De Pascale, S., & De Micco, V. (2021). Reducing the Evaporative Demand Improves Photosynthesis and Water Use Efficiency of Indoor Cultivated Lettuce. Agronomy, 11(7), 1396. https://doi.org/10.3390/agronomy11071396