
Effects of Cover Crop and Tillage Method Combinations on the Microbiological Traits of Spring Wheat (Triticum aestivum L.)


Abstract
:1. Introduction
2. Materials and Methods
2.1. A Field Experiment
2.2. Sampling and Measurements
2.3. Counts of Microorganisms and Analyses of Soil Enzyme Activity
- Total bacterial count—on ready-made Merck standard agar after 5 days of incubation at 25 °C;
- Moulds—on Martin agar [15] after 5 days of incubation at 24 °C;
- Copiotrophs—on nutrient agar (NA) [16] after 5 days of incubation at 25 °C;
- Oligotrophs—on diluted nutrient agar (DNA) [16] after 5 days of incubation at 25 °C;
- Actinobacteria—on Pochon agar after 5 days of incubation at 25 °C [17].
2.4. Weather Conditions
2.5. Statistical Analysis
3. Results
4. Discussion
5. Conclusions
Author Contributions
Funding
Institutional Review Board Statement
Informed Consent Statement
Data Availability Statement
Acknowledgments
Conflicts of Interest
References
- Al-Kaisi, M.M.; Yin, X.; Licht, M.A. Soil carbon and nitrogen changes as affected by tillage system and crop biomass in a corn-soybean rotation. Appl. Soil Ecol. 2005, 30, 174–191. [Google Scholar] [CrossRef]
- Mbuthia, L.W.; Martínez, V.A.; Schaeffer, J.S.D.; Tyler, D.; Odoi, E.; Mpheshea, M.; Walker, F.; Eash, N. Long term tillage, cover crop, and fertilization effects on microbial community structure, activity: Implications for soil quality. Soil Biol. Biochem. 2015, 89, 24–34. [Google Scholar] [CrossRef]
- Blanco-Canqui, H.; Shaver, T.M.; Lindquist, J.L.; Shapiro, C.A.; Elmore, R.W.; Francis, C.A.; Hergert, G.W. Cover crops and ecosystem services: Insights from studies in temperate soils. Agron. J. 2015, 107, 2449–2474. [Google Scholar] [CrossRef] [Green Version]
- Veum, K.S.; Goyne, K.W.; Kremer, R.J.; Miles, R.J.; Sudduth, K.A. Biological indicators of soil quality and soil organic matter characteristics in an agricultural management continuum. Biogeochemistry 2014, 117, 81–99. [Google Scholar] [CrossRef]
- Das, S.K.; Varma, A. Role of enzymes in maintaining soil health. In Soil Enzymology; Springer: Berlin/Heidelberg, Germany, 2010; pp. 25–42. [Google Scholar]
- Niewiadomska, A.; Majchrzak, L.; Borowiak, K.; Wolna-Maruwka, A.; Waraczewska, Z.; Budka, A.; Gaj, R. The influence of tillage and cover cropping on soil microbial parameters and spring wheat physiology. Agronomy 2020, 10, 200. [Google Scholar] [CrossRef] [Green Version]
- Yang, Y.; Ding, J.; Zhang, Y.; Wu, J.; Zhang, J.; Pan, X.; Gao, C.; Wang, Y.; He, F. Effects of tillage and mulching measures on soil moisture and temperature, photosynthetic characteristics and yield of winter wheat. Agric. Water Manag. 2018, 201, 299–308. [Google Scholar] [CrossRef]
- Bielińska, E.J.; Mocek-Płóciniak, A. Wpływ systemu uprawy na aktywność enzymatyczną gleby. Arch. Environ. Prot. 2012, 38, 75–82. [Google Scholar] [CrossRef]
- Natywa, M.; Majchrzak, L.; Sawicka, A. Wpływ sposobu uprawy roli na aktywność enzymatyczną gleby i plon kukurydzy. Ekol. Tech. 2009, 17, 171–177. [Google Scholar]
- Six, J.; Fray, S.D.; Thiet, R.K.; Batten, R.K. Bacterial and Fungal Contributions to Carbon Sequestration in Agroecosystems. Soil Sci. Soc. Am. J. 2006, 70, 555–559. [Google Scholar] [CrossRef]
- Blanco-Canqui, H.; Holman, J.D.; Schlegel, A.J.; Tatarko, J.; Shaver, T.M. Replacing fallow with cover crops in a semiarid soil: Effects on soil properties. Soil Sci. Soc. Am. J. 2013, 77, 1026–1034. [Google Scholar] [CrossRef] [Green Version]
- Blanco-Canqui, H.; Mikha, M.M.; Presley, D.R.; Claassen, M.M. Addition of cover crops enhances no-till potential for improving soil physical properties. Soil Sci. Soc. Am. J. 2011, 75, 1471–1482. [Google Scholar] [CrossRef]
- Cerecetto, V.; Smalla, K.; Nesme, J.; Garaycochea, S.; Fresia, P.; Sørensen, S.; Babi, D.; Leoni, C. Reduced tillage, cover crops and organic amendments affect soil microbiota and improve soil health in Uruguayan vegetable farming systems. FEMS Microbiol. Ecol. 2021, 97, fiab023. [Google Scholar] [CrossRef]
- Adetunji, A.T.; Ncube, B.; Mulidzi, R.; Lewu, F.B. Management impact and benefit of cover crops on soil quality: A review. Soil Tillage Res. 2020, 204, 104717. [Google Scholar] [CrossRef]
- Martin, J.P. Use of acid, rose bengal and streptomycin in the plate method for estimating soil fungi. Soil Sci. 1950, 69, 215–232. [Google Scholar] [CrossRef]
- Ohta, H.; Hattori, T. Bacteria sensitive to nutrient broth medium in terrestrial environments. Soil Sci. Plant Nutr. 1980, 26, 99–107. [Google Scholar] [CrossRef] [Green Version]
- Grabińska-Łoniewska, A. Laboratory Classes in General Microbiology; Oficyna Wydawnicza Politechniki: Warsaw, Poland, 1999. [Google Scholar]
- Thalmann, A. Zur Methodik der Bestimmung der Dehydrogenase aktivität im Boden mittels triphenytetrazoliumchlorid (TTC). Landwirtsch. Forsch. 1968, 21, 249–258. [Google Scholar]
- Tabatabai, M.A.; Bremner, J.M. Use of p-nitrophenyl phosphate for assay of soil phosphatase activity. Soil Biol. Biochem. 1969, 1, 301–307. [Google Scholar] [CrossRef]
- Ladd, J.N.; Butler, J.H.A. Humus–enzyme systems and synthetic organic polymer-enzyme analogs. In Soil Biochemistry; Paul, E.A., McLaren, A.D., Eds.; Marcel Dekker: New York, NY, USA, 1975; pp. 143–193. [Google Scholar]
- Stachowski, P. Evaluation of meteorological droughts in post-mining areas in Poland in Konin area. Central Pomeranian Scientific Society for Environmental Protection. Ann. Set. Environ. Protect. 2010, 12, 587–606. [Google Scholar]
- Shapiro, S.S.; Wilk, M.B. An analysis of variance test for normality (complete samples). Biometrika 1965, 52, 591–611. [Google Scholar] [CrossRef]
- Bocianowski, J.; Majchrzak, L. Analysis of effects of cover crop and tillage method combinations on the phenotypic traits of spring wheat (Triticum aestivum L.) using multivariate methods. Appl. Ecol. Environ. Res. 2019, 17, 15267–15276. [Google Scholar] [CrossRef]
- Rencher, A.C. Interpretation of canonical discriminant functions, canonical variates, and principal components. Am. Stat. 1992, 46, 217–225. [Google Scholar]
- Mahalanobis, P.C. On the generalized distance in statistics. Proc. Natl. Inst. Sci. 1936, 12, 49–55. [Google Scholar]
- Seidler-Łożykowska, K.; Bocianowski, J. Evaluation of variability of morphological traits of selected caraway (Carum carvi L.) genotypes. Ind. Crop. Prod. 2012, 35, 140–145. [Google Scholar] [CrossRef]
- Swędrzyńska, D.; Małecka-Jankowiak, I. The Impact of Tillaging Spring Barley on Selected Chemical, Microbiological, and Enzymatic Soil Properties. Pol. J. Environ. Stud. 2017, 26, 303–313. [Google Scholar] [CrossRef]
- Yao, R.J.; Yang, J.S.; Zhang, T.J.; Gao, P.; Yu, S.P.; Wang, X.P. Short-term effect of cultivation and crop rotation systems on soil quality indicators in a coastal newly reclaimed farming area. J. Soils Sediments 2013, 13, 1335–1350. [Google Scholar] [CrossRef]
- Kim, N.; Zabaloy, M.C.; Guan, K.; Villamil, M.B. Do cover crops benefit soil microbiome? A meta-analysis of current research. Soil Biol. Biochem. 2020, 142, 107701. [Google Scholar] [CrossRef]
- Wang, Z.; Li, T.; Wen, X.; Liu, Y.; Han, J.; Liao, Y.; DeBruyn, J.M. Fungal communities in rhizosphere soil under conservation tillage shift in response to plant growth. Front. Microbiol. 2017, 8, 1301. [Google Scholar] [CrossRef] [Green Version]
- Kurm, V.; van der Putten, W.H.; de Boer, W.; Naus-Wiezer, S.; Hol, W.H.G. Low abundant soil bacteria can be metabolically versatile and fast growing. Ecology 2017, 98, 555–564. [Google Scholar] [CrossRef] [PubMed] [Green Version]
- Bocianowski, J.; Szulc, P.; Nowosad, K. Analysis of effects of nitrogen and magnesium fertilization combinations of phenotypic traits of two maize (Zea mays L.) cultivars using multivariate methods. Pol. J. Agron. 2016, 26, 3–8. [Google Scholar]
- Lahuta, L.B.; Ciak, M.; Rybiński, W.; Bocianowski, J.; Börner, A. Diversity of the composition and content of soluble carbohydrates in seeds of the genus Vicia (Leguminosae). Genet. Resour. Crop Evol. 2018, 65, 541–554. [Google Scholar] [CrossRef] [Green Version]
- Daryanto, S.; Fu, B.; Wang, L.; Jacinthe, P.A.; Zhao, W. Quantitative synthesis on the ecosystem services of cover crops. Earth Sci. Rev. 2018, 185, 357–373. [Google Scholar] [CrossRef]
- Hupe, A.; Schulz, H.; Bruns, C.; Haase, T.; Heß, J.; Joergensen, R.G.; Wichern, F. Even flow? Changes of carbon and nitrogen release from pea roots over time. Plant Soil 2018, 431, 143–157. [Google Scholar] [CrossRef]
- Piazza, G.; Ercoli, L.; Nuti, M.; Pellegrino, E. Interaction between conservation tillage and nitrogen fertilization shapes prokaryotic and fungal diversity at different soil depths: Evidence from a 23-year field experiment in the mediterranean area. Front. Microbiol. 2019, 10. [Google Scholar] [CrossRef] [Green Version]
- Kardol, P.; Cregger, M.A.; Company, C.E.; Classen, A.T. Soil ecosystem functioning under climate change: Plant species and community effects. Ecology 2010, 91, 767–781. [Google Scholar] [CrossRef]
- Yuan, B.C.; Li, Z.Z.; Liu, H.; Gao, M.; Zhang, Y.Y. Microbial biomass and activity in salt affected soils under arid conditions. Appl. Soil Ecol. 2007, 35, 319–328. [Google Scholar] [CrossRef]
- Borowik, A.; Wyszkowska, J. Soil moisture as a factor affecting the microbiological and biochemical activity of soil. Plant Soil Environ. 2016, 62, 250–255. [Google Scholar] [CrossRef]
- Walker, T.S.; Bais, H.P.; Grotewold, E.; Vivanco, J.M. Root exudation and rhizosphere biology. Plant Physiol. 2003, 132, 44–51. [Google Scholar] [CrossRef] [PubMed] [Green Version]
- Wyszkowska, J.; Borowik, A.; Olszewski, J.; Kucharski, J. Soil bacterial community and soil enzyme activity depending on the cultivation of Triticum aestivum, Brassica napus, and Pisum sativum ssp. arvense. Diversity 2019, 11, 246. [Google Scholar] [CrossRef] [Green Version]
- Kim, S.Y.; Lee, S.H.; Freeman, C.; Fenner, N.; Kang, H. Comparative analysis of soil microbial communities and their responses to the short-term drought in bog, fen, and riparian wetlands. Soil Biol. Biochem. 2008, 40, 2874–2880. [Google Scholar] [CrossRef]
- Kumar, P. Significance of soil-root system and aquaporins for water homeostasis in plant-a review. Adv. Plant Physiol. 2014, 15, 324. [Google Scholar]
- Ahmadi, A.; Baker, D. The effect of water stress on the activities of key regulatory enzymes of the sucrose to starch pathway in wheat. Plant Growth Regul. 2001, 35, 81–91. [Google Scholar] [CrossRef]
- Jiang, M.G.; Zhang, J.H. Water stress-induced abscisic acid accumulation triggers the increased generation of reactive oxygen species and up-regulates the activities of antioxidant enzymes in maize leaves. J. Exp. Bot. 2002, 53, 2401–2410. [Google Scholar] [CrossRef] [PubMed] [Green Version]


| Years | Total Rainfall (mm) | |||
|---|---|---|---|---|
| April | May | June | July | |
| 2011 | 13.9 | 34.0 | 15.4 | 175.4 |
| 2012 | 22.9 | 77.2 | 69.8 | 197.6 |
| 2013 | 15.4 | 163.0 | 125.3 | 67.3 |
| Mean (1961–2010) | 38.0 | 57.4 | 61.8 | 77.5 |
| Monthly Demand for Rainfall (mm) | ||||
| Demand for rainfall | 45 | 66 | 83 | 89 |
| Term | 1st Term before Sowing of Spring Wheat | 2nd Term—Tillering Phase (BBCH 23) | 3rd Term—2nd Node (BBCH 32) | 4th Term—Heading (BBCH 55) | 5th Term—Post-Harvest | |||||
|---|---|---|---|---|---|---|---|---|---|---|
| Factor | Wilks’ lambda | Rao F | Wilks’ lambda | Rao F | Wilks’ lambda | Rao F | Wilks’ lambda | Rao F | Wilks’ lambda | Rao F |
| Year (Y) | 0.00004 | 1347 *** | 0.00004 | 1355 *** | 0.00134 | 213.4 *** | 0.00004 | 1231 *** | 0.00027 | 487.8 *** |
| Cover crop (Cc) | 0.00475 | 109.6 *** | 0.00381 | 123.3 *** | 0.00083 | 273.4 *** | 0.00472 | 110.0 *** | 0.00746 | 85.8 *** |
| Tillage method (TM) | 0.00672 | 90.82 *** | 0.00832 | 80.84 *** | 0.00289 | 142.7 *** | 0.00826 | 81.16 *** | 0.01038 | 71.52 *** |
| Y × Cc | 0.00005 | 101.4 *** | 0.00006 | 95.3 *** | 0.00001 | 162.6 *** | 0.00001 | 147.5 *** | 0.00008 | 86.34 *** |
| Y × TM | 0.00026 | 61.91 *** | 0.00052 | 49.84 *** | 0.00006 | 95.46 *** | 0.00013 | 75.76 *** | 0.00233 | 30.93 *** |
| Cc × TM | 0.00014 | 74.39 *** | 0.00024 | 62.79 *** | 0.00001 | 169.3 *** | 0.00004 | 104.4 *** | 0.00058 | 48.25 *** |
| Y × Cc × TM | 0 | 71.51 *** | 0 | 42.11 *** | 0 | 59.87 *** | 0 | 63.98 *** | 0 | 39.52 *** |
| Term | Source of Variation | Year (Y) | Cover Crop (Cc) | Tillage Method (TM) | Y × Cc | Y × TM | Cc × TM | Y × Cc × TM |
|---|---|---|---|---|---|---|---|---|
| d.f. | 2 | 2 | 2 | 4 | 4 | 4 | 8 | |
| I | DHA | 219.33 *** | 15.14 *** | 26.5 *** | 19.1 *** | 16.08 *** | 7.1 *** | 3.88 *** |
| PAC | 624.79 *** | 9.97 *** | 0.53 | 2.71 * | 2.4 | 4.91 ** | 3.95 *** | |
| Azotobacter | 300.33 *** | 15.4 *** | 1.47 | 12.17 *** | 5.88 *** | 13.71 *** | 4.39 *** | |
| PR | 106.19 *** | 21.13 *** | 16.73 *** | 82.56 *** | 102.15 *** | 361.81 *** | 330.33 *** | |
| Moulds | 2368.83 *** | 40.72 *** | 130.37 *** | 45.47 *** | 102.28 *** | 80.48 *** | 141.38 *** | |
| Copiotrophic bacteria | 13.57 *** | 3.08 | 1.68 | 2.97 * | 2.74 * | 1.43 | 2.17 * | |
| Oligotrophic bacteria | 4648.49 *** | 588.09 *** | 233.67 *** | 798.11 *** | 126.55 *** | 204.84 *** | 377.75 *** | |
| Actinobacteria | 3761.66 *** | 19.05 *** | 257.02 *** | 117.02 *** | 38.49 *** | 67.59 *** | 328.35 *** | |
| Total bacterial count | 2500.69 *** | 587.71 *** | 209.53 *** | 319.86 *** | 316.96 *** | 74.96 *** | 221 *** | |
| II | DHA | 41.37 *** | 5.99 ** | 17.78 *** | 9.65 *** | 5.07 ** | 3.99 ** | 0.95 |
| PAC | 957.61 *** | 11.45 *** | 8.43 *** | 2.59 * | 3.11 * | 3.94 ** | 2.45 * | |
| Azotobacter | 627.97 *** | 41.91 *** | 27.37 *** | 63.43 *** | 18.79 *** | 50.07 *** | 23.34 *** | |
| PR | 92.9 *** | 242.42 *** | 450.42 *** | 553.58 *** | 154.86 *** | 109.46 *** | 387.7 *** | |
| Moulds | 1155.73 *** | 202.18 *** | 57.77 *** | 149.13 *** | 48.04 *** | 79.33 *** | 68.58 *** | |
| Copiotrophic bacteria | 1860.08 *** | 80.08 *** | 66.99 *** | 85.48 *** | 116.94 *** | 76.9 *** | 41.16 *** | |
| Oligotrophic bacteria | 2356.37 *** | 329.44 *** | 13.44 *** | 322.56 *** | 35.95 *** | 19.11 *** | 73.74 *** | |
| Actinobacteria | 3354.9 *** | 141.96 *** | 346.29 *** | 125.08 *** | 98.17 *** | 213.08 *** | 69.76 *** | |
| Total bacterial count | 869.37 *** | 97.67 *** | 53.1 *** | 3.76 ** | 85.23 *** | 116.78 *** | 39.55 *** | |
| III | DHA | 173.87 *** | 3.61 * | 4.75 * | 2.52 * | 5.63 *** | 12.82 *** | 7.16 *** |
| PAC | 121.49 *** | 0.51 | 15.18 *** | 3.4 * | 4.04 ** | 6.18 *** | 10.65 *** | |
| Azotobacter | 319.79 *** | 208.53 *** | 91.58 *** | 164.94 *** | 151.36 *** | 273.66 *** | 107.44 *** | |
| PR | 142.9 *** | 217.11 *** | 489.77 *** | 254.67 *** | 2.06 | 363.89 *** | 41.93 *** | |
| Moulds | 18.35 *** | 98.29 *** | 32.76 *** | 74.73 *** | 32.1 *** | 27.08 *** | 49.27 *** | |
| Copiotrophic bacteria | 1141.73 *** | 622 *** | 371.21 *** | 561.65 *** | 522.67 *** | 183.65 *** | 185.84 *** | |
| Oligotrophic bacteria | 516.58 *** | 22.4 *** | 174.62 *** | 187.85 *** | 36.16 *** | 129.73 *** | 211.85 *** | |
| Actinobacteria | 103.57 *** | 18.96 *** | 107.02 *** | 511.66 *** | 150.9 *** | 275.48 *** | 94.46 *** | |
| Total bacterial count | 413.62 *** | 1013.95 *** | 61.15 *** | 111.19 *** | 245.4 *** | 285.4 *** | 239.12 *** | |
| IV | DHA | 101.28 *** | 0.82 | 12.93 *** | 10.18 *** | 10.5 *** | 1.43 | 3.65 ** |
| PAC | 679.34 *** | 6.09 ** | 4.64 * | 14.81 *** | 9.44 *** | 2.29 | 5.28 *** | |
| Azotobacter | 1357.72 *** | 42.39 *** | 18.16 *** | 58.19 *** | 3.1 * | 47.01 *** | 106.56 *** | |
| PR | 134.57 *** | 402.16 *** | 210.58 *** | 484.22 *** | 120.46 *** | 390.36 *** | 72.31 *** | |
| Moulds | 3670.45 *** | 296.67 *** | 104.09 *** | 242.56 *** | 257.32 *** | 316.32 *** | 298.66 *** | |
| Copiotrophic bacteria | 50.51 *** | 10.24 *** | 12.04 *** | 95.38 *** | 38.35 *** | 31.1 *** | 34.27 *** | |
| Oligotrophic bacteria | 251.64 *** | 206.29 *** | 107.73 *** | 378.18 *** | 239.23 *** | 315.98 *** | 44.97 *** | |
| Actinobacteria | 2973.18 *** | 362.64 *** | 291.05 *** | 197.92 *** | 64.42 *** | 436.18 *** | 94.3 *** | |
| Total bacterial count | 1100.32 *** | 17.15 *** | 132.76 *** | 112.01 *** | 40.25 *** | 50.72 *** | 165.16 *** | |
| V | DHA | 26.34 *** | 10.85 *** | 10.47 *** | 6.67 *** | 0.78 | 5.06 ** | 2.56 * |
| PAC | 537 *** | 3.56 * | 1.17 | 9.67 *** | 14.44 *** | 15.26 *** | 15.96 *** | |
| Azotobacter | 23.69 *** | 3.54 * | 18.3 *** | 41.62 *** | 20.25 *** | 11.47 *** | 18.65 *** | |
| PR | 456.91 *** | 415.18 *** | 304.43 *** | 51.11 *** | 80.45 *** | 146.34 *** | 16.98 *** | |
| Moulds | 213.75 *** | 53.13 *** | 72.2 *** | 54.75 *** | 66.44 *** | 10.39 *** | 73.45 *** | |
| Copiotrophic bacteria | 259.03 *** | 15.94 *** | 48.5 *** | 23.63 *** | 35.66 *** | 10.25 *** | 17.56 *** | |
| Oligotrophic bacteria | 337.75 *** | 34.15 *** | 411.79 *** | 237.82 *** | 4.15 ** | 207.19 *** | 304.04 *** | |
| Actinobacteria | 2155.41 *** | 416.72 *** | 31.68 *** | 363.97 *** | 12.09 *** | 29.26 *** | 38.19 *** | |
| Total bacterial count | 2165.47 *** | 99.64 *** | 19.75 *** | 270.38 *** | 125.82 *** | 153.33 *** | 188.13 *** |
| Trait | Term | DHA | PAC | Azotobacter | PR | Moulds | Copiotrophic Bacteria | Oligotrophic Bacteria | Actinobacteria |
|---|---|---|---|---|---|---|---|---|---|
| PAC | I | 0.62 *** | |||||||
| II | −0.42 *** | ||||||||
| III | 0.17 | ||||||||
| IV | −0.51 *** | ||||||||
| V | −0.36 *** | ||||||||
| Azotobacter | I | 0.27 ** | 0.54 *** | ||||||
| II | 0.20 * | −0.56 *** | |||||||
| III | −0.11 | −0.27 ** | |||||||
| IV | −0.04 | −0.30 ** | |||||||
| V | −0.40 *** | 0.07 | |||||||
| PR | I | 0.12 | −0.12 | −0.08 | |||||
| II | 0.30 ** | 0.02 | 0.14 | ||||||
| III | −0.05 | 0.1 | 0.08 | ||||||
| IV | 0.06 | 0.21 * | −0.04 | ||||||
| V | −0.05 | 0.41*** | 0 | ||||||
| Moulds | I | −0.46 *** | −0.14 | 0.43 *** | −0.24 * | ||||
| II | 0.15 | 0.28 ** | 0 | −0.16 | |||||
| III | 0.09 | 0.25 * | 0.20 * | 0.41 *** | |||||
| IV | 0.38 *** | −0.60 *** | 0.04 | −0.33 *** | |||||
| V | −0.12 | 0.32 *** | −0.08 | 0.36 *** | |||||
| Copiotrophic bacteria | I | −0.23 * | −0.05 | 0.32 *** | 0.01 | 0.50 *** | |||
| II | 0.17 | −0.12 | 0.53 *** | −0.02 | 0.39 *** | ||||
| III | −0.24 * | −0.38 *** | −0.15 | −0.11 | −0.20 * | ||||
| IV | −0.09 | 0.25 ** | 0.20 * | 0.13 | −0.28 ** | ||||
| V | 0.45 *** | −0.54 *** | −0.07 | −0.17 | −0.38 *** | ||||
| Oligotrophic bacteria | I | −0.46 *** | −0.32 *** | 0.07 | −0.22 * | 0.72 *** | 0.29 ** | ||
| II | 0.35 *** | −0.34 *** | 0.63 *** | 0.08 | 0.27 ** | 0.70 *** | |||
| III | 0.44 *** | 0.14 | 0.01 | 0.20 * | 0.32 *** | −0.24 * | |||
| IV | 0.16 | −0.20 * | 0.14 | −0.01 | 0.20 * | −0.11 | |||
| V | −0.06 | 0.21 * | −0.16 | 0.14 | 0.14 | 0.18 | |||
| Actinobacteria | I | −0.49 *** | −0.75 *** | −0.42 *** | −0.13 | 0.26 ** | 0.09 | 0.44 *** | |
| II | −0.06 | 0.52 *** | 0 | −0.02 | 0.53 *** | 0.50 *** | 0.38 *** | ||
| III | 0.24 * | −0.04 | 0.06 | 0.28 ** | 0.28 ** | 0.11 | 0.39 *** | ||
| IV | −0.22 * | −0.01 | 0.49 *** | −0.08 | −0.1 | −0.01 | 0.52 *** | ||
| V | 0.29 ** | −0.40 *** | 0.05 | −0.35 *** | −0.32 *** | 0.33 *** | −0.24 * | ||
| Total bacterial count | I | −0.50 *** | −0.36 *** | 0.14 | 0 | 0.66 *** | 0.57 *** | 0.55 *** | 0.41 *** |
| II | 0.03 | 0.42 *** | −0.02 | −0.09 | 0.64 *** | 0.54 *** | 0.34 *** | 0.75 *** | |
| III | 0.23 * | 0.11 | 0 | 0.12 | −0.01 | −0.13 | 0.19 | 0.14 | |
| IV | −0.23 * | 0.04 | 0.51 *** | −0.06 | −0.21 * | 0.36 *** | 0.29 ** | 0.73 *** | |
| V | 0.16 | −0.37 *** | 0.13 | −0.33 *** | −0.35 *** | 0.36 *** | −0.07 | 0.77 *** |
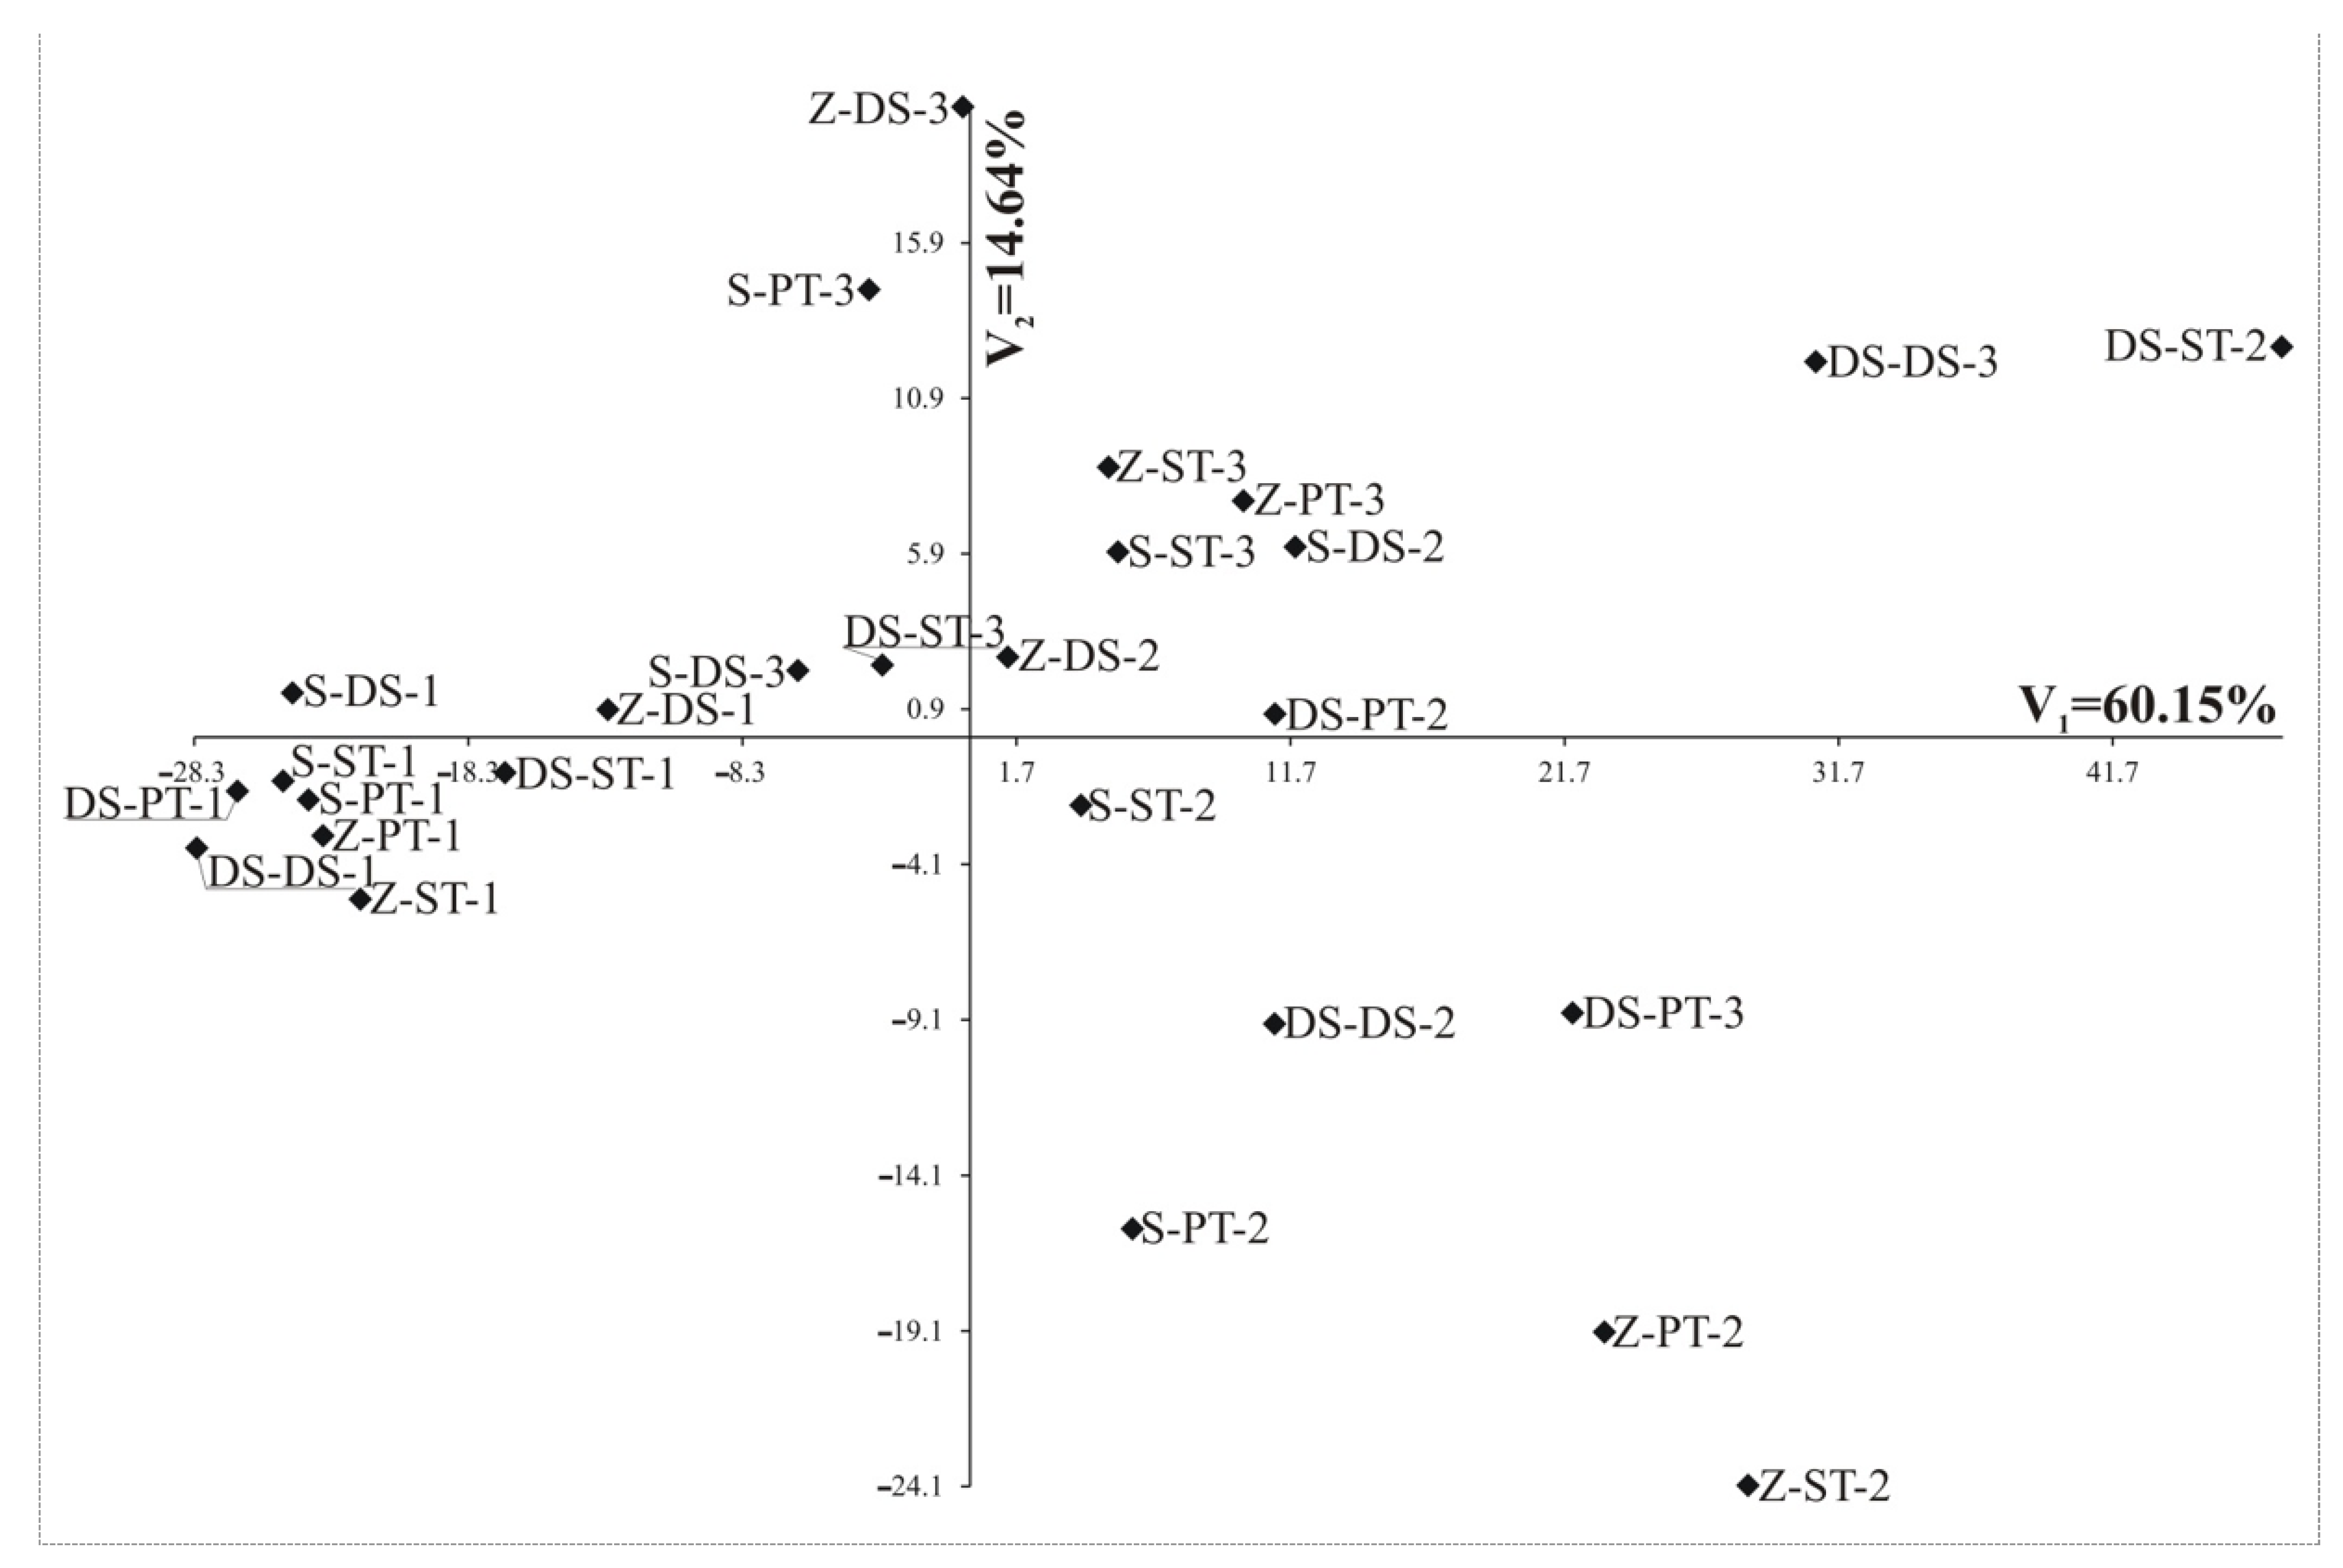
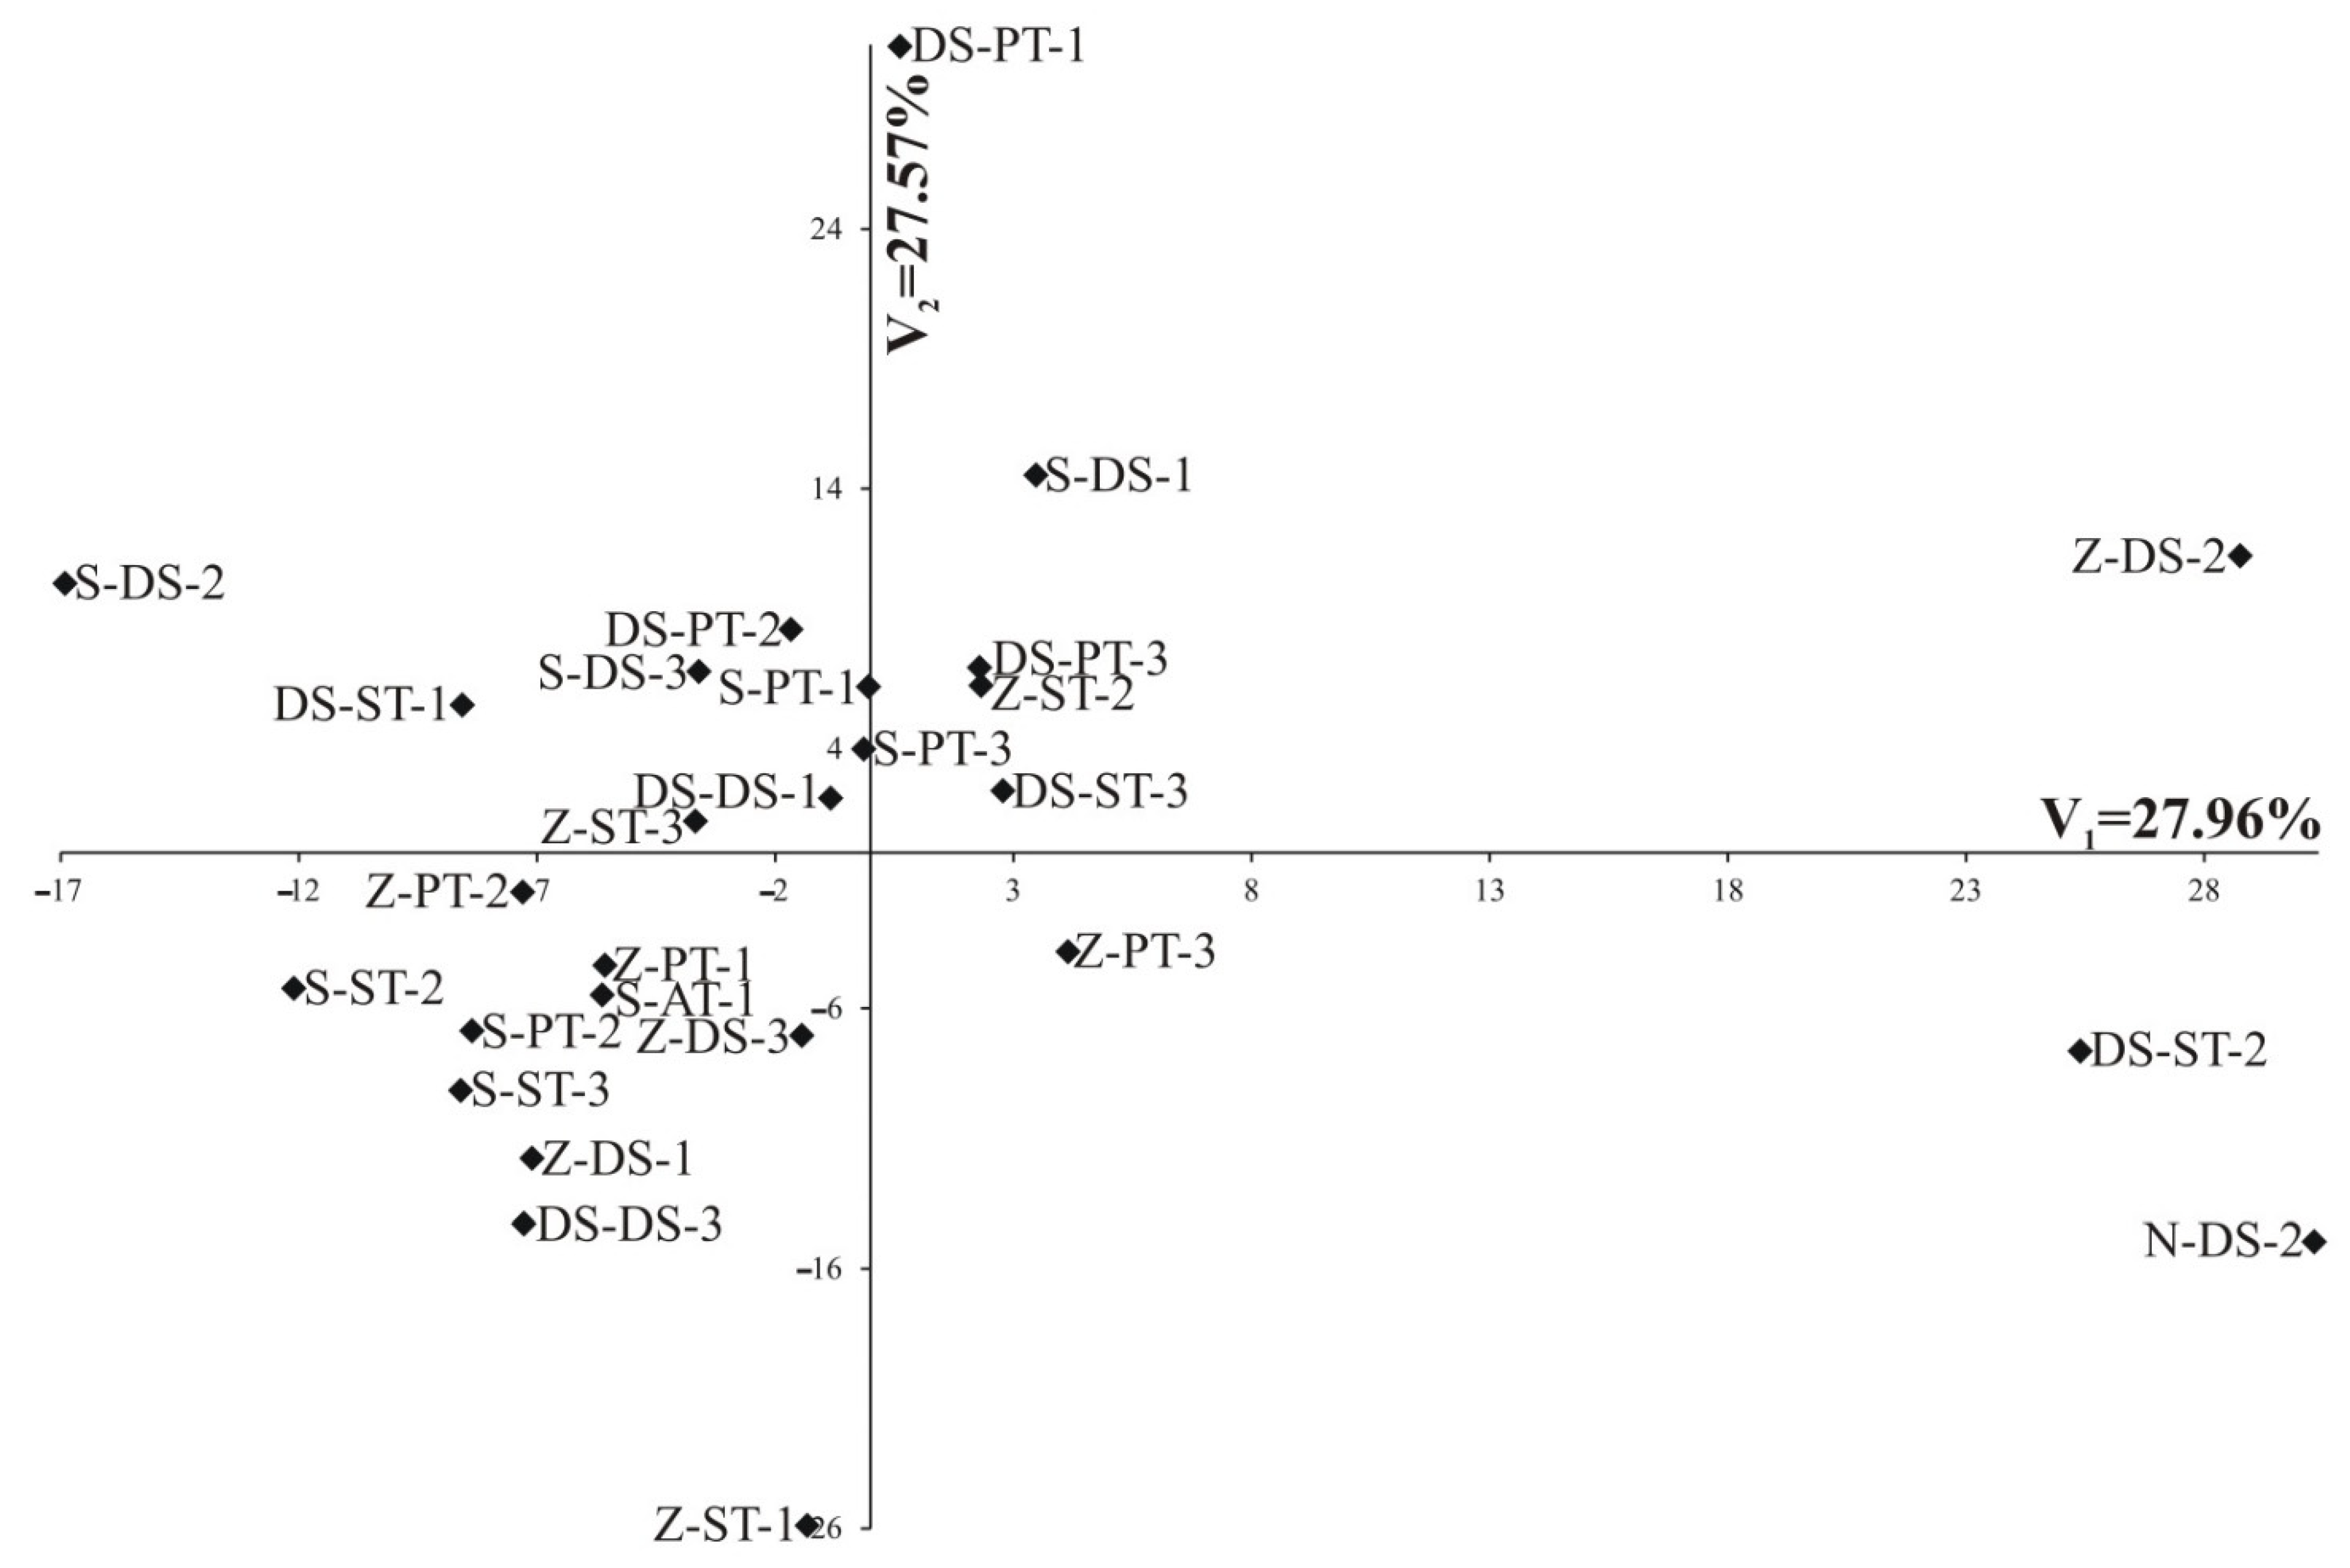
| Term | I | II | III | IV | V | |||||
|---|---|---|---|---|---|---|---|---|---|---|
| Trait | V1 | V2 | V1 | V2 | V1 | V2 | V1 | V2 | V1 | V2 |
| DHA | −0.66 *** | −0.07 | 0.16 | −0.16 | −0.06 | 0.24 | −0.3 | 0.39 * | −0.34 | −0.02 |
| PAC | −0.55 ** | −0.40 * | 0.35 | 0.68 *** | −0.31 | 0.07 | 0.13 | −0.68 *** | 0.57 ** | 0.02 |
| Azotobacter | 0.03 | −0.34 | 0.24 | −0.61 *** | −0.34 | 0.23 | 0.65 *** | 0.27 | −0.06 | 0.22 |
| PR | −0.15 | 0.39 * | 0.16 | 0.55 ** | 0 | 0.61 *** | 0.19 | −0.42 * | 0.44 * | 0.06 |
| Moulds | 0.79 *** | −0.33 | 0.66 *** | −0.05 | −0.15 | 0.61 *** | −0.35 | 0.91 *** | 0.38 | −0.13 |
| Copiotrophic bacteria | 0.69 *** | 0.09 | 0.73*** | −0.50 ** | 0.93 *** | −0.18 | 0.27 | −0.28 | −0.34 | −0.28 |
| Oligotrophic bacteria | 0.82 *** | −0.51 ** | 0.63 *** | −0.59 ** | 0 | 0.58 ** | 0.37 | 0.47 * | 0.40 * | −0.87 *** |
| Actinobacteria | 0.66 *** | 0.39 * | 0.89 *** | 0.16 | 0.35 | 0.73 *** | 0.88 *** | 0.28 | −0.93 *** | −0.05 |
| Total bacterial count | 0.88 *** | 0.22 | 0.83 *** | 0.05 | 0.02 | −0.21 | 0.88 *** | 0.12 | −0.88 *** | −0.36 |
| Variation percentage | 60.15 | 14.64 | 54.26 | 18.84 | 27.96 | 27.57 | 39.27 | 30.7 | 53.03 | 20.65 |
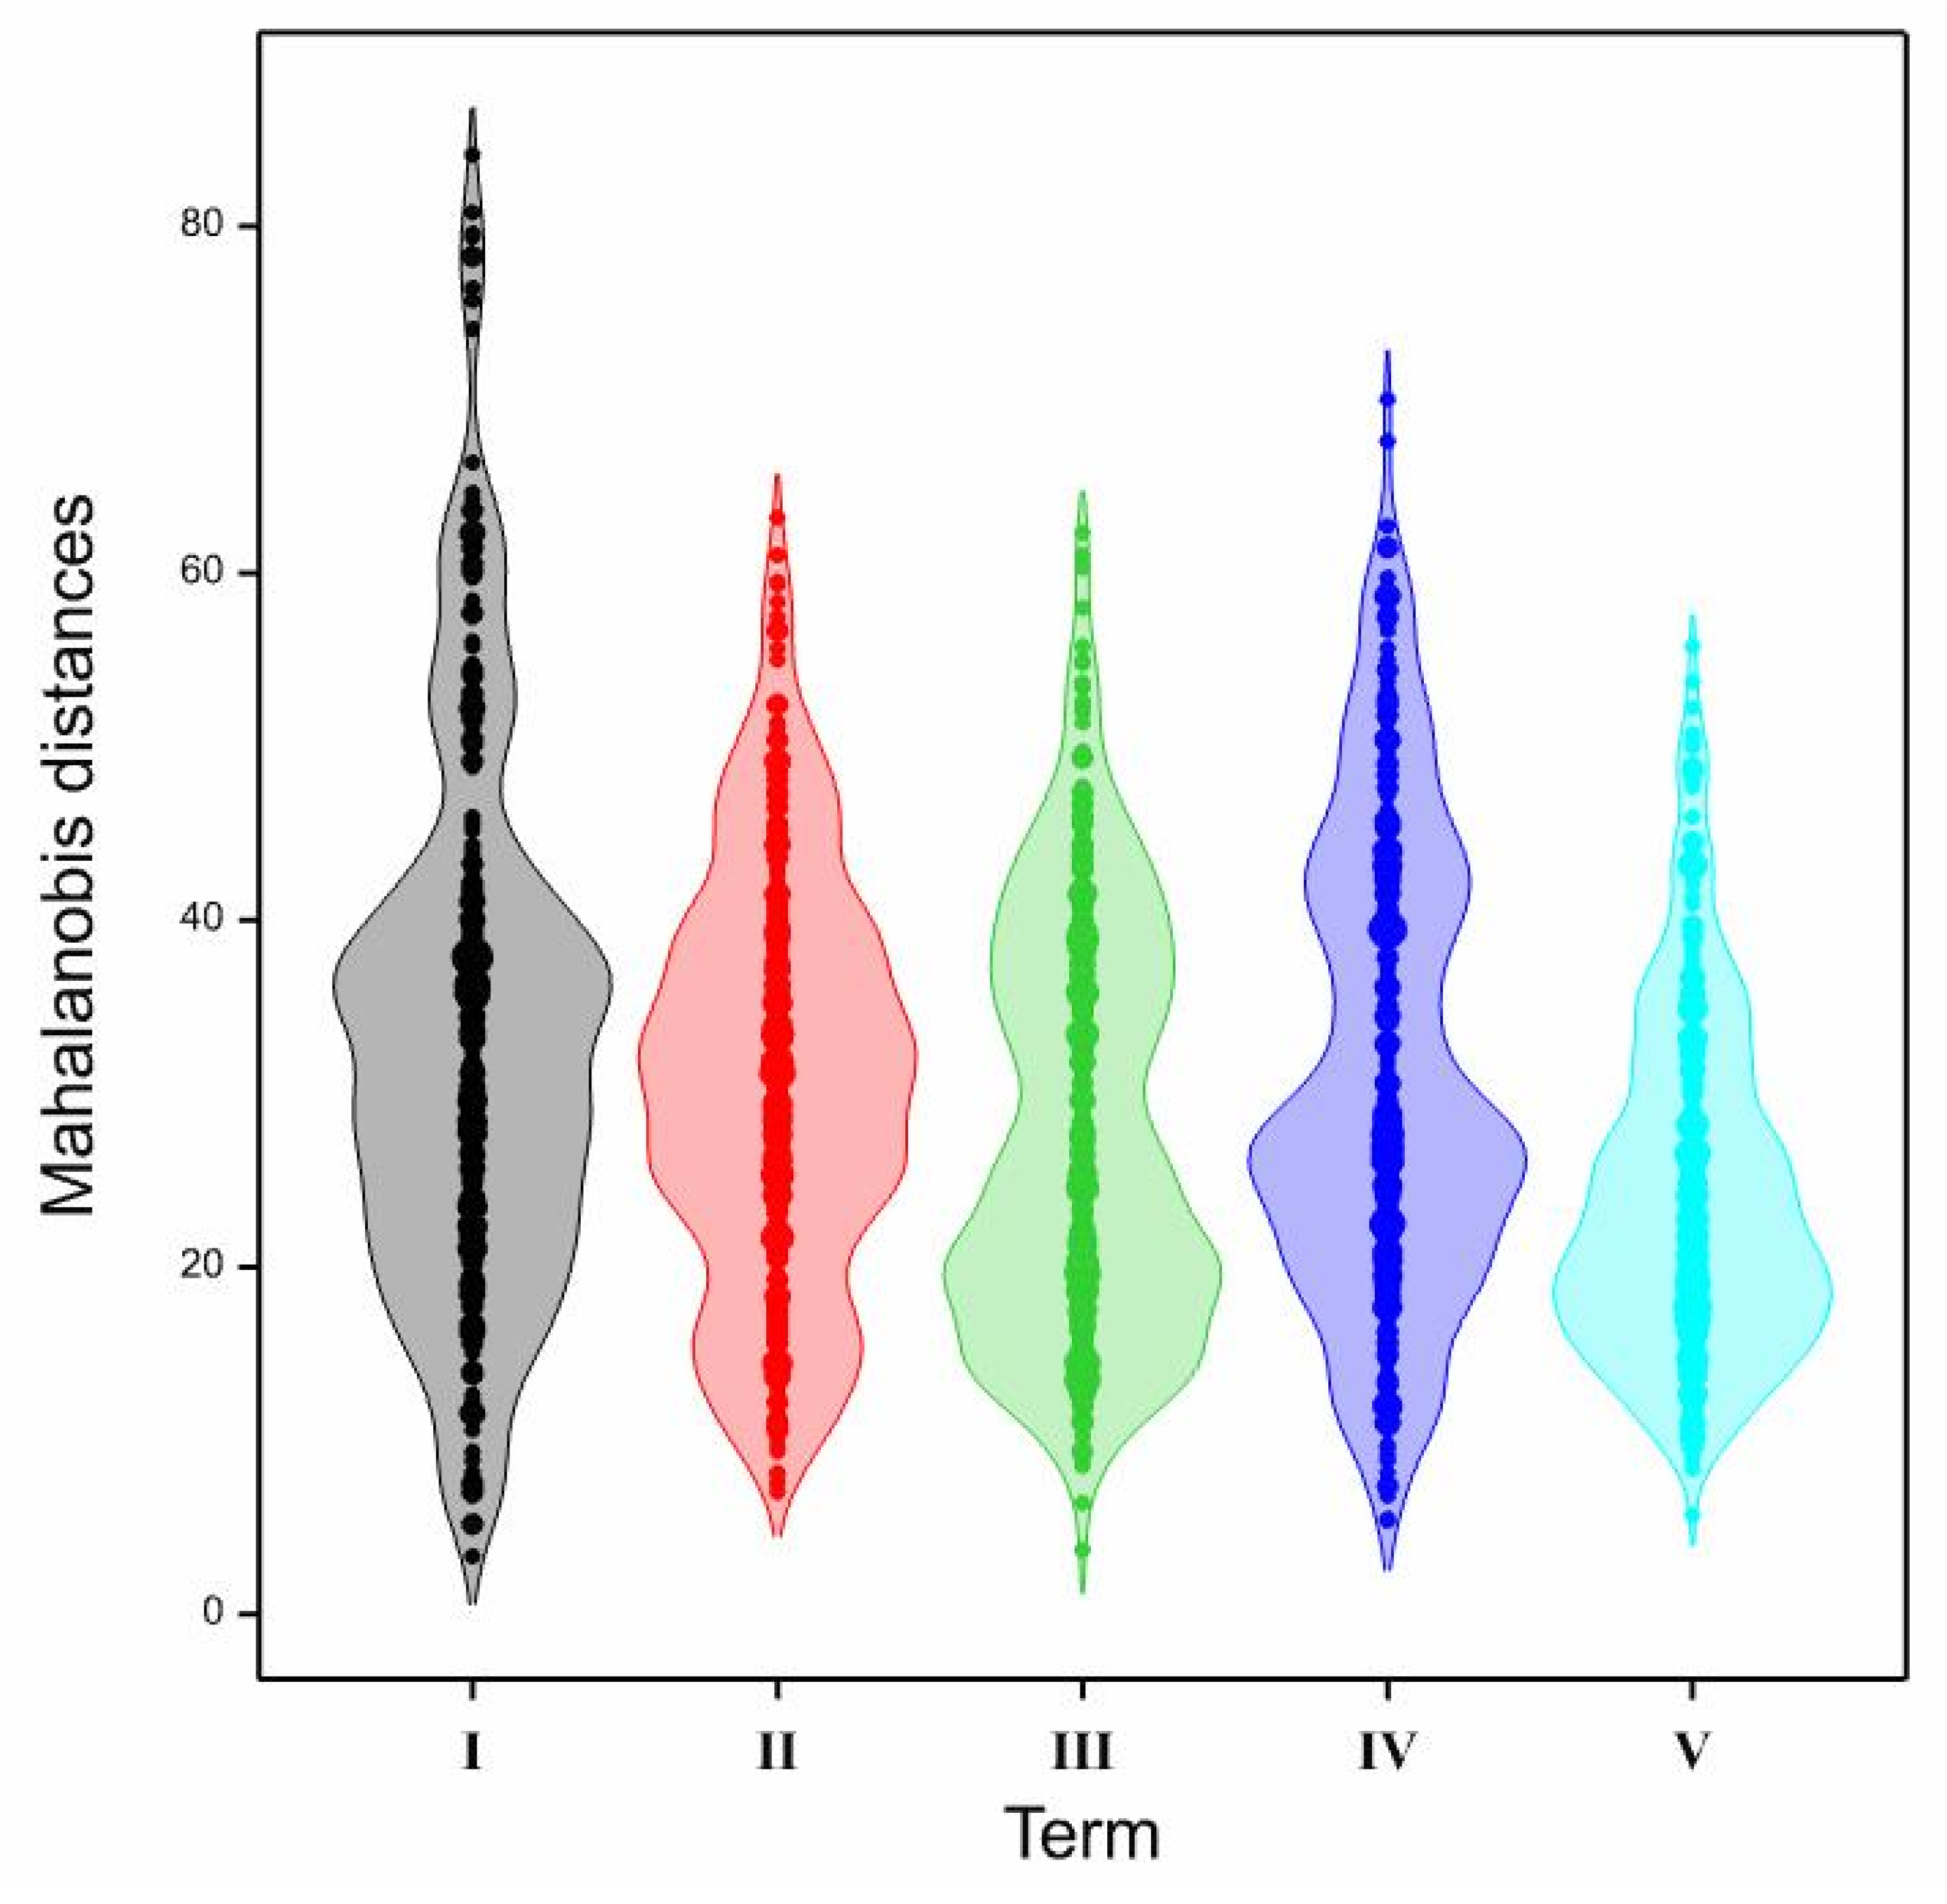
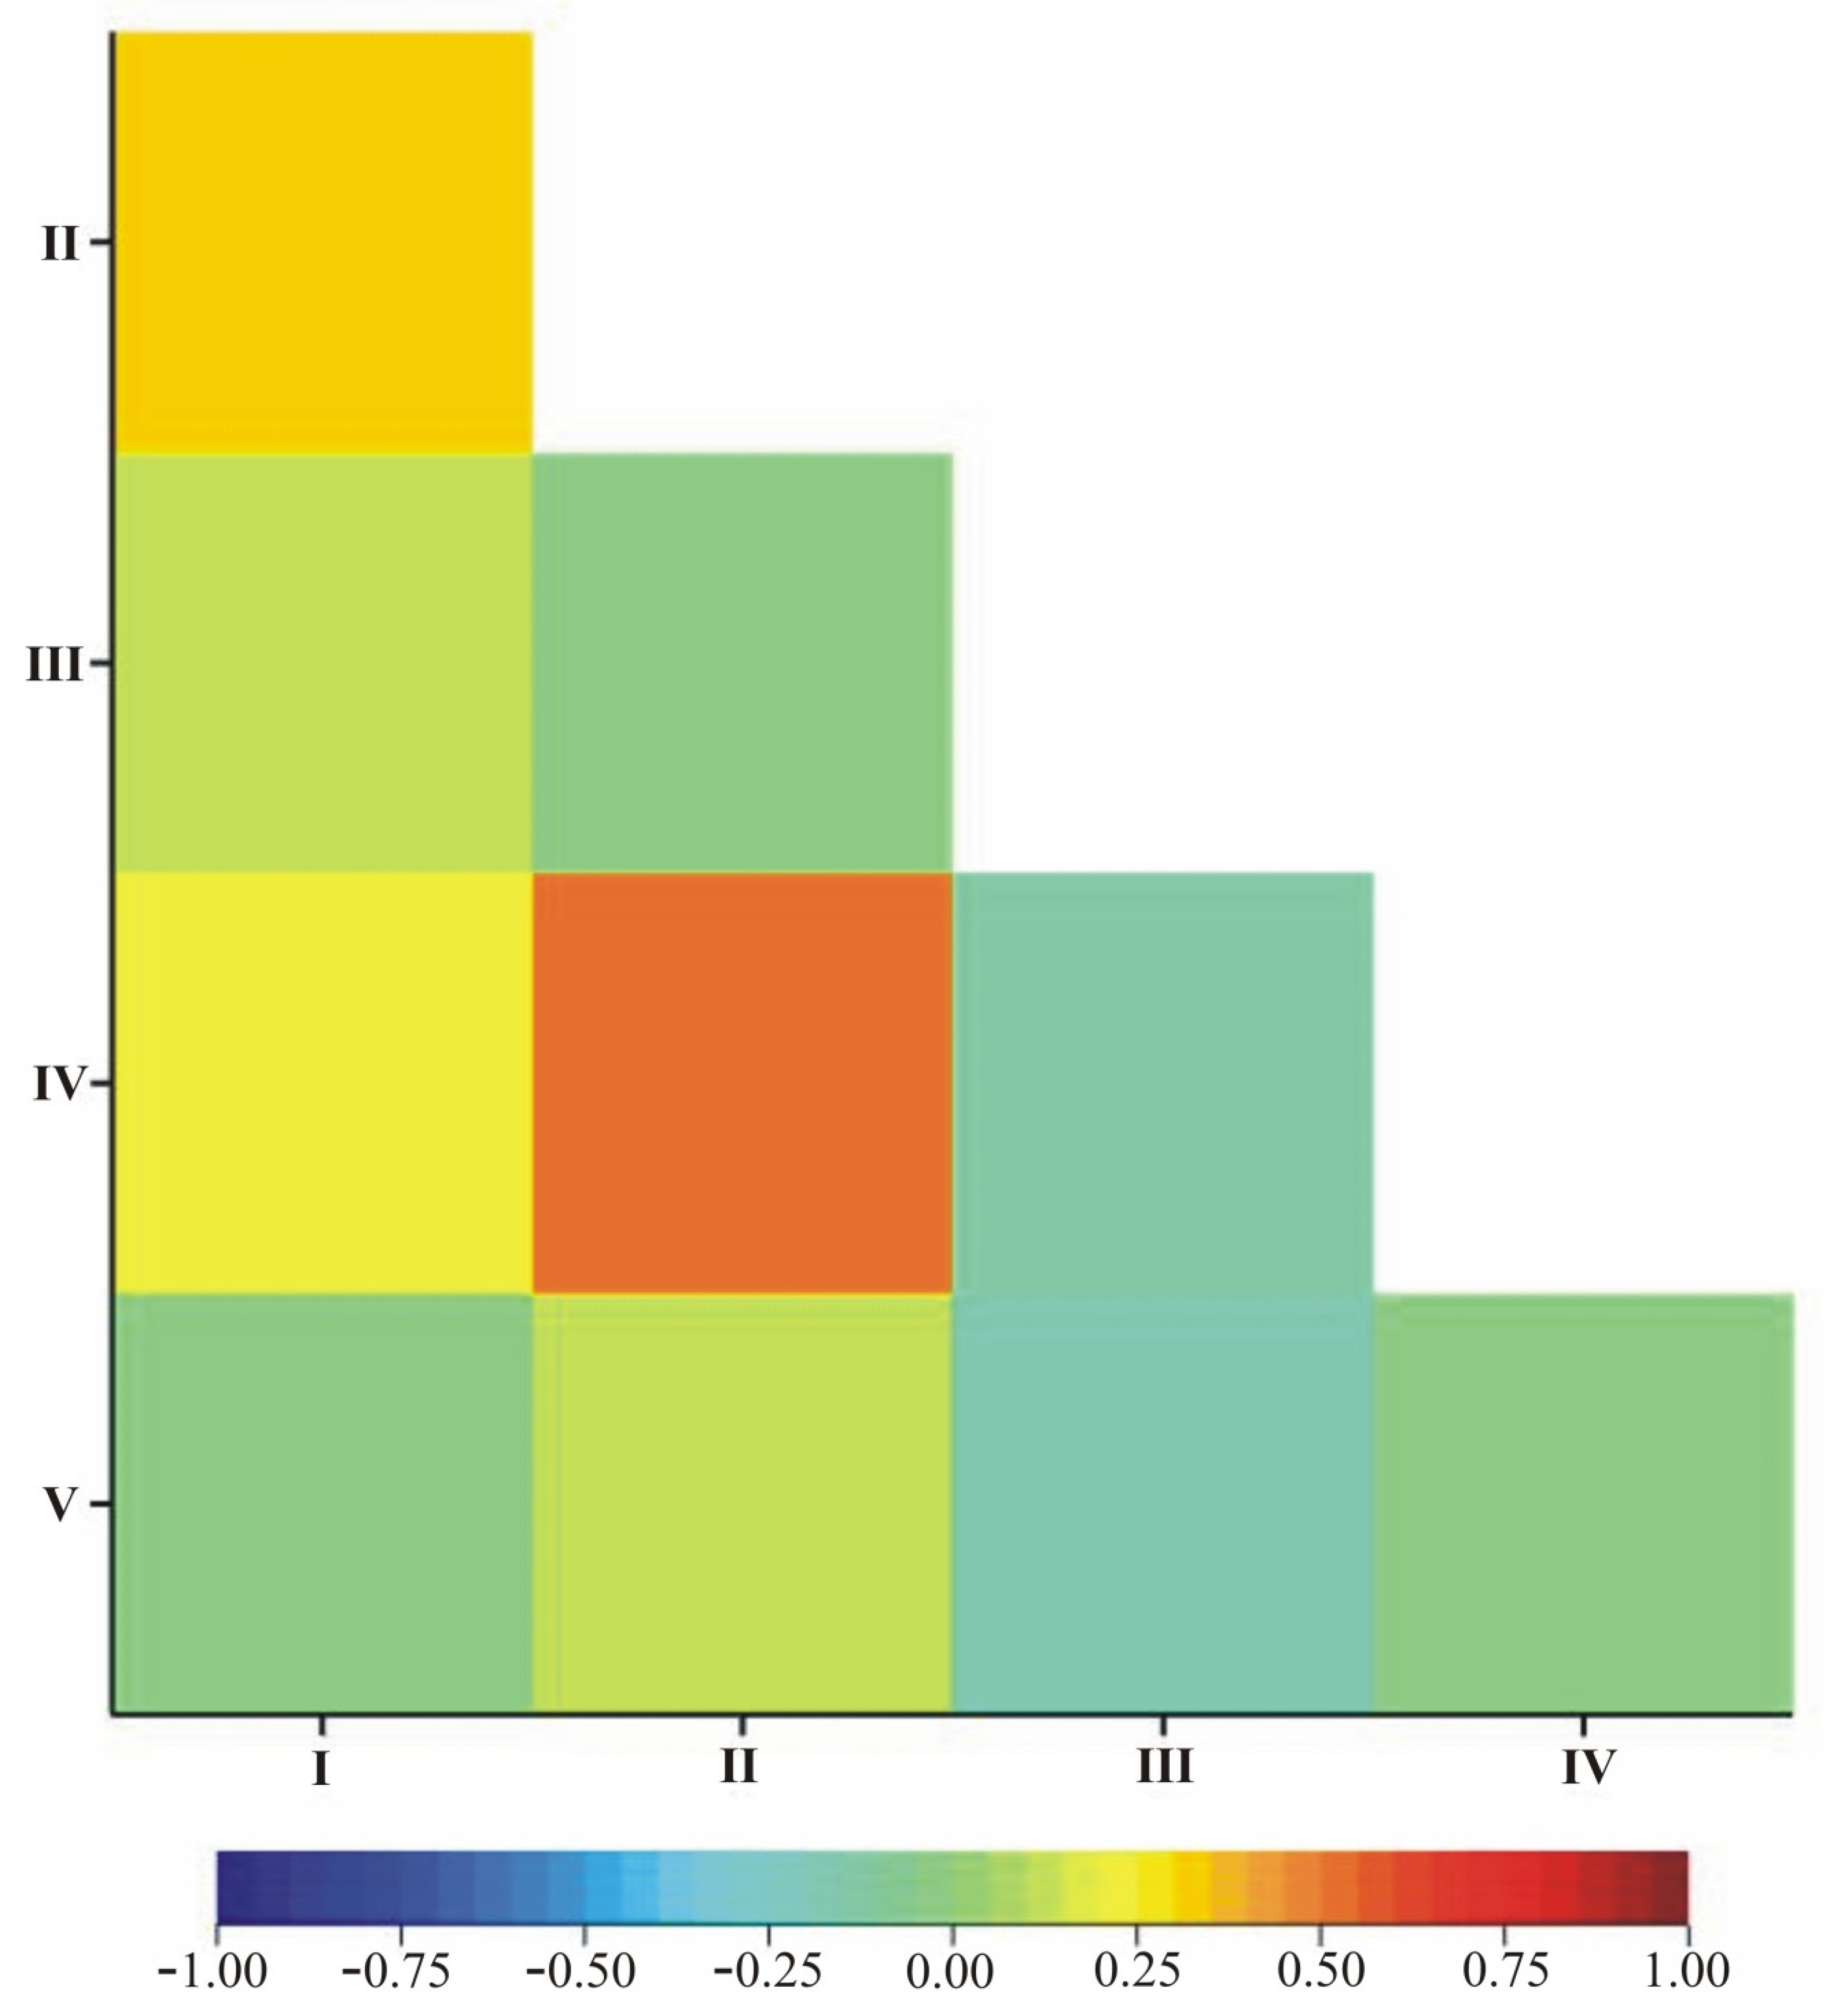
| Term | I | II | III | IV | V |
|---|---|---|---|---|---|
| I | 1 | ||||
| II | 0.3011 *** | 1 | |||
| III | 0.1176 * | −0.0492 | 1 | ||
| IV | 0.2258 *** | 0.511 *** | −0.1195 * | 1 | |
| V | −0.0261 | 0.1079 * | −0.1988 *** | −0.0211 | 1 |
Publisher’s Note: MDPI stays neutral with regard to jurisdictional claims in published maps and institutional affiliations. |
© 2021 by the authors. Licensee MDPI, Basel, Switzerland. This article is an open access article distributed under the terms and conditions of the Creative Commons Attribution (CC BY) license (https://creativecommons.org/licenses/by/4.0/).
Share and Cite
Majchrzak, L.; Bocianowski, J.; Niewiadomska, A. Effects of Cover Crop and Tillage Method Combinations on the Microbiological Traits of Spring Wheat (Triticum aestivum L.). Agronomy 2021, 11, 1390. https://doi.org/10.3390/agronomy11071390
Majchrzak L, Bocianowski J, Niewiadomska A. Effects of Cover Crop and Tillage Method Combinations on the Microbiological Traits of Spring Wheat (Triticum aestivum L.). Agronomy. 2021; 11(7):1390. https://doi.org/10.3390/agronomy11071390
Chicago/Turabian StyleMajchrzak, Leszek, Jan Bocianowski, and Alicja Niewiadomska. 2021. "Effects of Cover Crop and Tillage Method Combinations on the Microbiological Traits of Spring Wheat (Triticum aestivum L.)" Agronomy 11, no. 7: 1390. https://doi.org/10.3390/agronomy11071390
APA StyleMajchrzak, L., Bocianowski, J., & Niewiadomska, A. (2021). Effects of Cover Crop and Tillage Method Combinations on the Microbiological Traits of Spring Wheat (Triticum aestivum L.). Agronomy, 11(7), 1390. https://doi.org/10.3390/agronomy11071390