Article

Integrated Building Energy Simulation–Life Cycle Assessment (BES–LCA) Approach for Environmental Assessment of Agricultural Building: A Review and Application to Greenhouse Heating Systems

1
Department of Rural Systems Engineering, Research Institute for Agriculture and Life Sciences, College of Agriculture and Life Sciences, Seoul National University, Gwanakno 1, Gwanakgu, Seoul 08826, Korea
2
Department of Agricultural and Biosystems Engineering, College of Engineering, Mariano Marcos State University, Batac City 2906, Ilocos Norte, Philippines
3
Research Institute for Agriculture and Life Sciences, College of Agriculture and Life Sciences, Seoul National University, Gwanakno 1, Gwanakgu, Seoul 08826, Korea
*
Author to whom correspondence should be addressed.
Agronomy 2021, 11(6), 1230; https://doi.org/10.3390/agronomy11061230
Submission received: 30 April 2021 / Revised: 25 May 2021 / Accepted: 31 May 2021 / Published: 17 June 2021

Abstract

:
A substantial reduction in the environmental impacts related to the construction and operation of agricultural buildings is needed to adapt to the continuing development of agriculture. The life cycle assessment (LCA) is a methodology used to quantify the environmental impact of different processes involved in the production and therefore has been increasingly applied to assess the environmental burden. However, most LCA-related research studies have focused on the overall environmental impact of the entire system without considering the energy load of the agricultural buildings. By integrating the LCA tool with other design tools such as the building energy simulation (BES), the identification of environmental hotspots and the mitigation options become possible during the design process. Thus, the objective of the paper was to identify the current integration approaches used to combine BES and LCA results to assess the environmental impact of different heating systems such as absorption heat pump (AHP) using energy from thermal effluent, electricity-powered heat pump and kerosene-powered boilers used in a conventional multi-span Korean greenhouse. The assessment result revealed that the environmental impact caused using a kerosene-powered boiler is largest in terms of the acidification potential (AP), global warming potential (GWP) and Eutrophication Potential (EP) of 1.15 × 100 kg SO2-eq, 1.13 × 10² kg CO2-eq and 1.62 × 10⁻¹ kg PO4-eq, respectively. Detailed analysis of the result showed that the main contributor for greenhouse gas emission was caused by the type, amount and source of energy used to heat the greenhouse, which contributed to a maximum of 86.59% for case 1, 96.69% for case 2 and a maximum of 96.47% for case 3, depending on the type of greenhouse gas being considered.

1. Introduction

Greenhouse production is now becoming the major crop production system in countries with four distinct seasons. Developed countries such as South Korea are becoming more dependent on protective agriculture to support the needs of the growing population. To increase the crop production rate, an optimum environmental condition must be maintained inside the greenhouse through the installation of high-efficiency heating and cooling systems. A heating and cooling system is used to control the stored heat inside the greenhouse buildings, which is very crucial in maintaining the desired air temperature during both extreme seasons. Approximately 85% of greenhouse owners in Korea use fossil fuel as an energy source for heating to maintain the optimum environment inside the greenhouse facilities [1,2]. Thus, the South Korean government has been strongly promoting alternative ways to reduce the dependence on fossil fuel through the establishment of acts such as the Energy Act and Energy Use Rationalization promoting the use of renewable energy sources for greenhouse crop production. Evidence of this can be seen in the increase of generated renewable energy from 21,751 thousand tonnes of oil equivalent (TOE) in 1995 to 51,427 thousand TOE in 2019, showing an increase of 57.77% [3].
The modern trend in greenhouse energy conservation practice utilized renewable energy to operate the greenhouse. In particular, the wasted heat energy from effluent generated by the thermal or nuclear power plants was being tapped to heat the greenhouse buildings. Thermal effluent refers to the heated seawater used to cool down the engine of the nuclear plant during its operation. During the cooling process, the seawater absorbs a large amount of thermal energy, resulting in a huge amount of energy loss from the power plant. Traditionally, the thermal effluent is 7 °C higher than the average temperature of normal seawater [4]. The current practice of farm owners was to utilize the heat from thermal effluent for heating the greenhouse to maintain the optimum growing environment. As of 2020, a total of 30 units of thermal power plants that were generating a total power of 30,116 MW were strategically placed throughout South Korea, discharging a total of 47.3 billion tons of thermal effluent [5].
As mentioned in many studies, the highest energy consumption and the largest source of environmental impact for greenhouse crop production is accounted for by its heating and cooling systems [6,7,8]. However, there have been very few studies related to environmental impact assessment of heating and cooling systems in greenhouses since published papers usually relate heating and cooling systems to residential, commercial or industrial buildings and other applications [9,10,11,12]. The application of environmental impact tools to assess the burden in a conventional greenhouse was also limited in number. The common research studies concerning greenhouse building structures were usually focused on the environmental impact of crops produced in a controlled environment and were usually compared with the traditional crop production practice such as in open field production. Additionally, the understanding of the qualitative amount of gas emission to the atmosphere of different heating and cooling systems for crop production used in the greenhouse is also inadequate. Thus, a tool capable of qualitatively estimating the amount of gas emitted from the greenhouse structure is deemed important.
The Life Cycle Assessment (LCA) is a potent tool used to calculate the environmental impact caused by the different processes involved in the entire life cycle [13]. During the assessment, the materials and energy flow used during the different product phases (raw material extraction, construction, operation, disposal, etc.) are evaluated in detail. According to Hendricks [14], LCA is capable of identifying the environmental hotspot for different environmental impacts allowing the conservation of energy, carbon and water. The application of LCA has become widespread in the field of food and agriculture in recent years, such as in building construction [15,16,17], livestock or crop production [18,19,20,21,22]. However, LCA also has main drawbacks, including the dependency on quality and availability of data used affecting the accuracy of the assessment result. Moreover, LCA-related studies only consider the actual energy used during a certain period of production only. Considering the life span of building considered in LCA research studies, information related to energy load for the entire life span may not be available or not properly documented.
This limitation can be solved using the Building Energy Simulation (BES), which is a tool known to estimate the total energy gain and losses through building internal loads such as facility equipment and crops [23,24,25,26]. Very often, the BES tool was used to promote energy conservation building design and upgrade building energy code. In spite of the increasing numbers of related studies regarding the use of LCA and building models, at present, current literature for the integrated BES–LCA is poor due to limited research. The integration of the BES and LCA approaches permits improved assessment of different alternatives that can be used in the system. However, the method, gap and principles of combining these tools at different phases are still not well established. Thus, the final goal of this paper is to discuss the standard practice using LCA and identify the application limitation. Further, it aims to combine BES tools and LCA to facilitate integrated environmental assessment. Lastly, the integrated BES–LCA design approach was used to assess the environmental impact caused by different heating systems in a conventional multi-span Korean greenhouse facility.

2. Review of Literatures

Past BES and LCA Studies

The application of BES and LCA has been constantly growing in the field of building construction and agriculture. As evidence, several papers have been published related to agriculture. In particular, the buildings, either for commercial, residential or agricultural purposes, have directly or indirectly used energy throughout their life cycle (from manufacturing and operation to decommissioning). Consequently, the building designers and engineers must identify the thermal behaviour of the building to suitably establish retrofitting measures to be adopted in the building construction. Thus, a BES tool that is capable of predicting indoor air temperature needs for heating and cooling is considered necessary. This demand can be resolved using BES software. BES software is a widely used tool that estimates the total energy use of commercial, industrial and agricultural buildings for real-time building control and operation. These tools have also been used by researchers to predict and analyzed the energy demand of building design alternatives for code compliance and green building certification [27,28,29]. Presently the BES tools used differ in many ways such as the thermodynamic models used, their purpose and their ability to interchange data with other software [30]. In the field of agriculture, the EnergyPlus software was used by Stadler et al. [31] to simulate the onsite generation of an agricultural building. Energy Plus was also used to analyze the energy load of other agricultural and commercial buildings [32,33]. Al-ajmi and Hanby [34] calculated the inside air temperature considering the wall type and window location. Hong et al. [35], on the other hand, used the Transient Systems Simulation Program (TRNSYS) software to analyze the heating load of a naturally ventilated broiler house. Vadiee and Martin [36] analyzed the thermal flow in a large-scale commercial greenhouse using TRNSYS software. Rasheed et al. [25] evaluated the influence of greenhouse building design, including the roof shape, orientation, coverings, etc., on the building energy conservation capacity.
In terms of building environmental impact, literature has usually been subdivided according to the type of application such as heating, ventilation and air conditioning (HVAC) systems [37,38,39,40,41] and greenhouse crop production [42,43,44,45]. Further, most of the above-mentioned related studies discussed the three main greenhouse gases contributing to environmental burdens such as the global warming potential (CO2-eq), acidification potential (SO2-eq) and eutrophication potential (PO4-eq) that were known to cause great environmental danger in the long run.
For instance, in the case of heating and cooling systems, Koroneos and Nanaki [46] studied the environmental gas emission of ground source heat pump (GSHP) used for heating and cooling of townhall in Thessalonokki, Greece. The authors concluded that the extraction of the raw materials for HVAC systems was the primary contributor of CO2, SO2 and NOx. This is in contrast with the claim of Saner et al. [47], who state that the operation phase of the system is the highest contributor to gas emission. Carvalho [48] assessed the heating system of a residential house and concluded that when a GSHP was used, a 60% CO2 reduction was predicted by 2050. Blumsack et al. [38] mentioned that GSHP used in a residential house in Pennsylvania decreased CO2 by 62%, increased SO2 by 3% and increased NOx by 1%, whereas an electrically driven heat pump used in a conventional residential building in Germany was able to reduce the amount of CO2 emission by 45% compared with an oil broiler [49]. Bayer et al. [50] claimed that the calculated CO2 emission from burning fossil fuels can be reduced by 30% and that all the heating systems in the target region will be replaced. According to Shah et al. [37], the environmental impact of utilizing heat pump systems in a 181 m2 residential house has a lower environmental impact when equated with using a furnace or boiler. The same conclusion was derived in the study of Saner et al. [47] for a 200 m2 residential house. It was further emphasized that about 23% of gas emissions affected the quality of ecosystems. As stated by Bayer et al. [50], the use of coal to operate the GSHP in a residential house contributed to about 80% of the increase in GHG emissions.
Canaj et al. [51] emphasized that in typical crop production in the greenhouse, one of the major environmental factors that affect and contribute to the emission of environmental greenhouse gases was the greenhouse infrastructure. Thus, a number of published papers have focused on the analysis of building structures alone. Similarly, Santos and Costa [41] also claimed that the building was found to contribute to about 40% of the energy consumption and 36% of carbon dioxide. Further, Salehpour et al. [52] studied the different environmental impacts of growing primrose in a greenhouse, showing that about 0.206 kg CO2-eq was emitted per piece of flower produced. Zarei et al. [53] compared the environmental impact of producing cucumber and tomato in a greenhouse and open field. The result of the analysis showed that the use of diesel fuel and natural gas was the major contributor to all impact categories in greenhouse and electricity, and nitrogen-based fertilizers had the highest contribution to all impact categories.

3. Materials and Methods
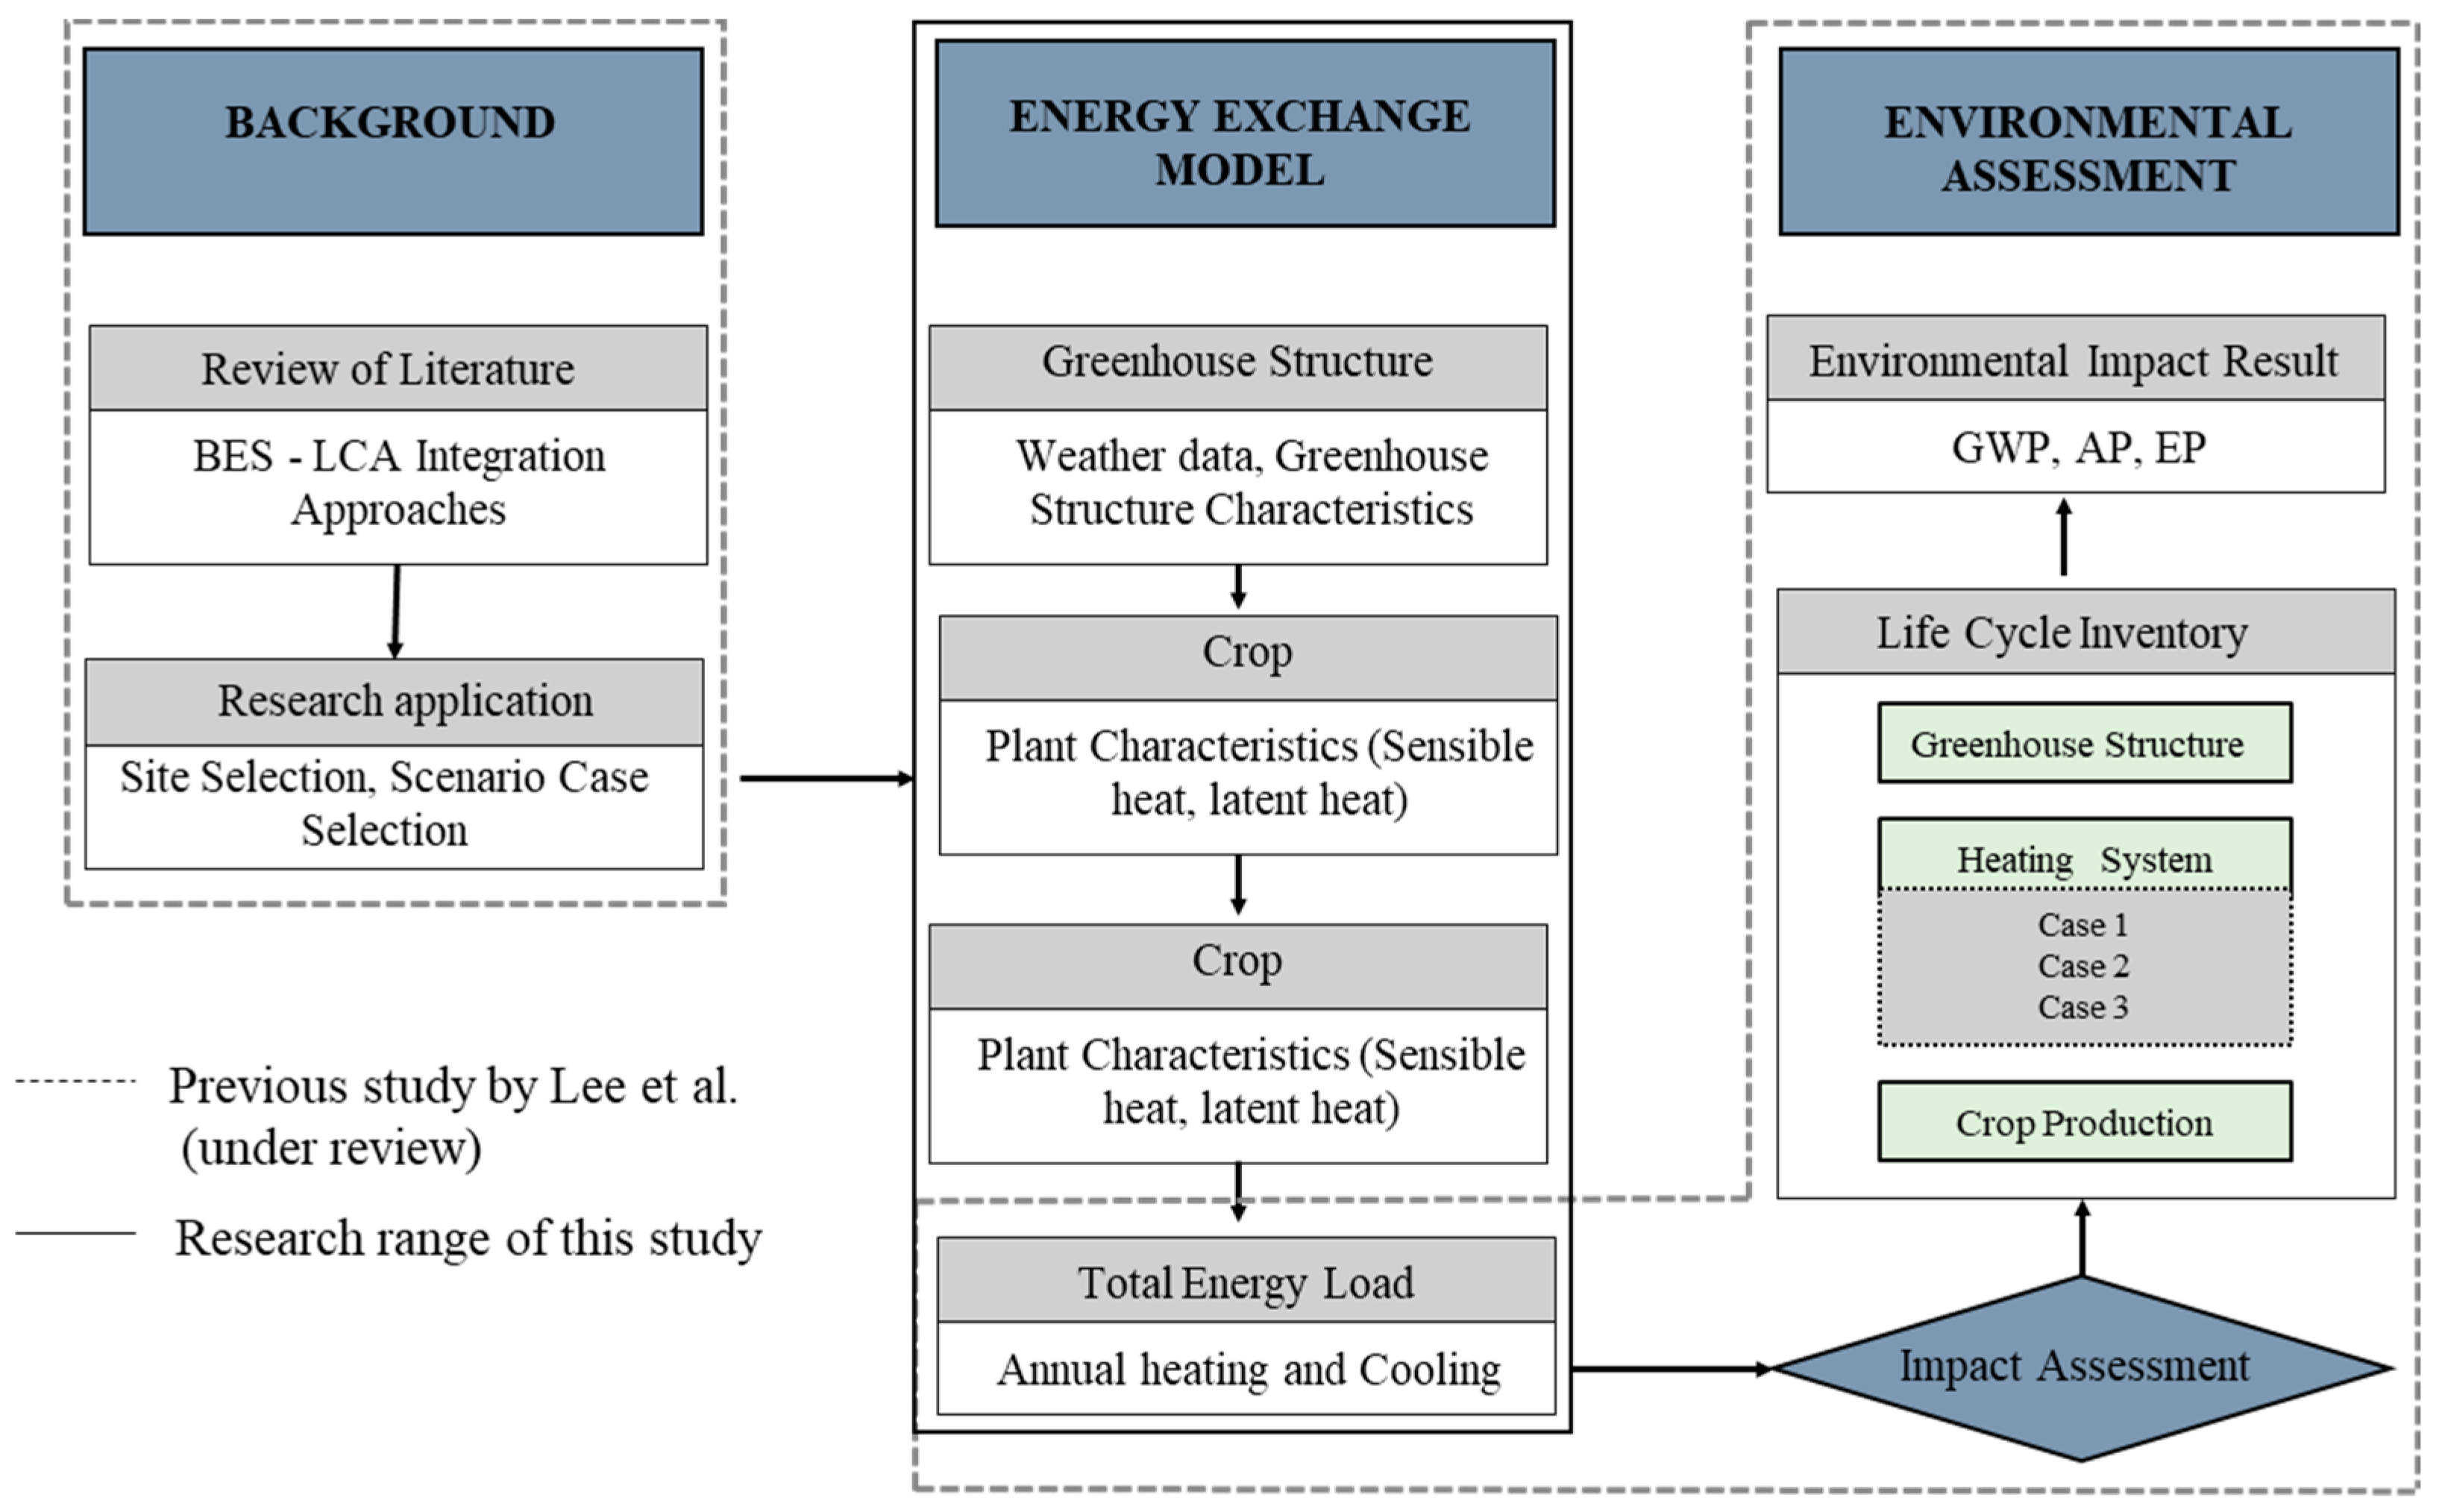
3.1. Research Flow

Figure 1 showed the research flow followed for integrating the BES tool with the LCA software. The first steps include the selection of the target experimental greenhouse and case scenarios. The next step is to determine the annual total energy load from the target experimental greenhouse building using BES software. Prior to simulation, the different energy exchange models such as greenhouse, heating and cooling, and crops to predict the annual energy load were modeled and combined. The detailed description of each model was discussed in Lee et al. [54]. The computed annual energy was converted to annual primary energy use by applying annual average conversion factors. The subsequent step includes the LCA analysis to calculate the environmental impact.

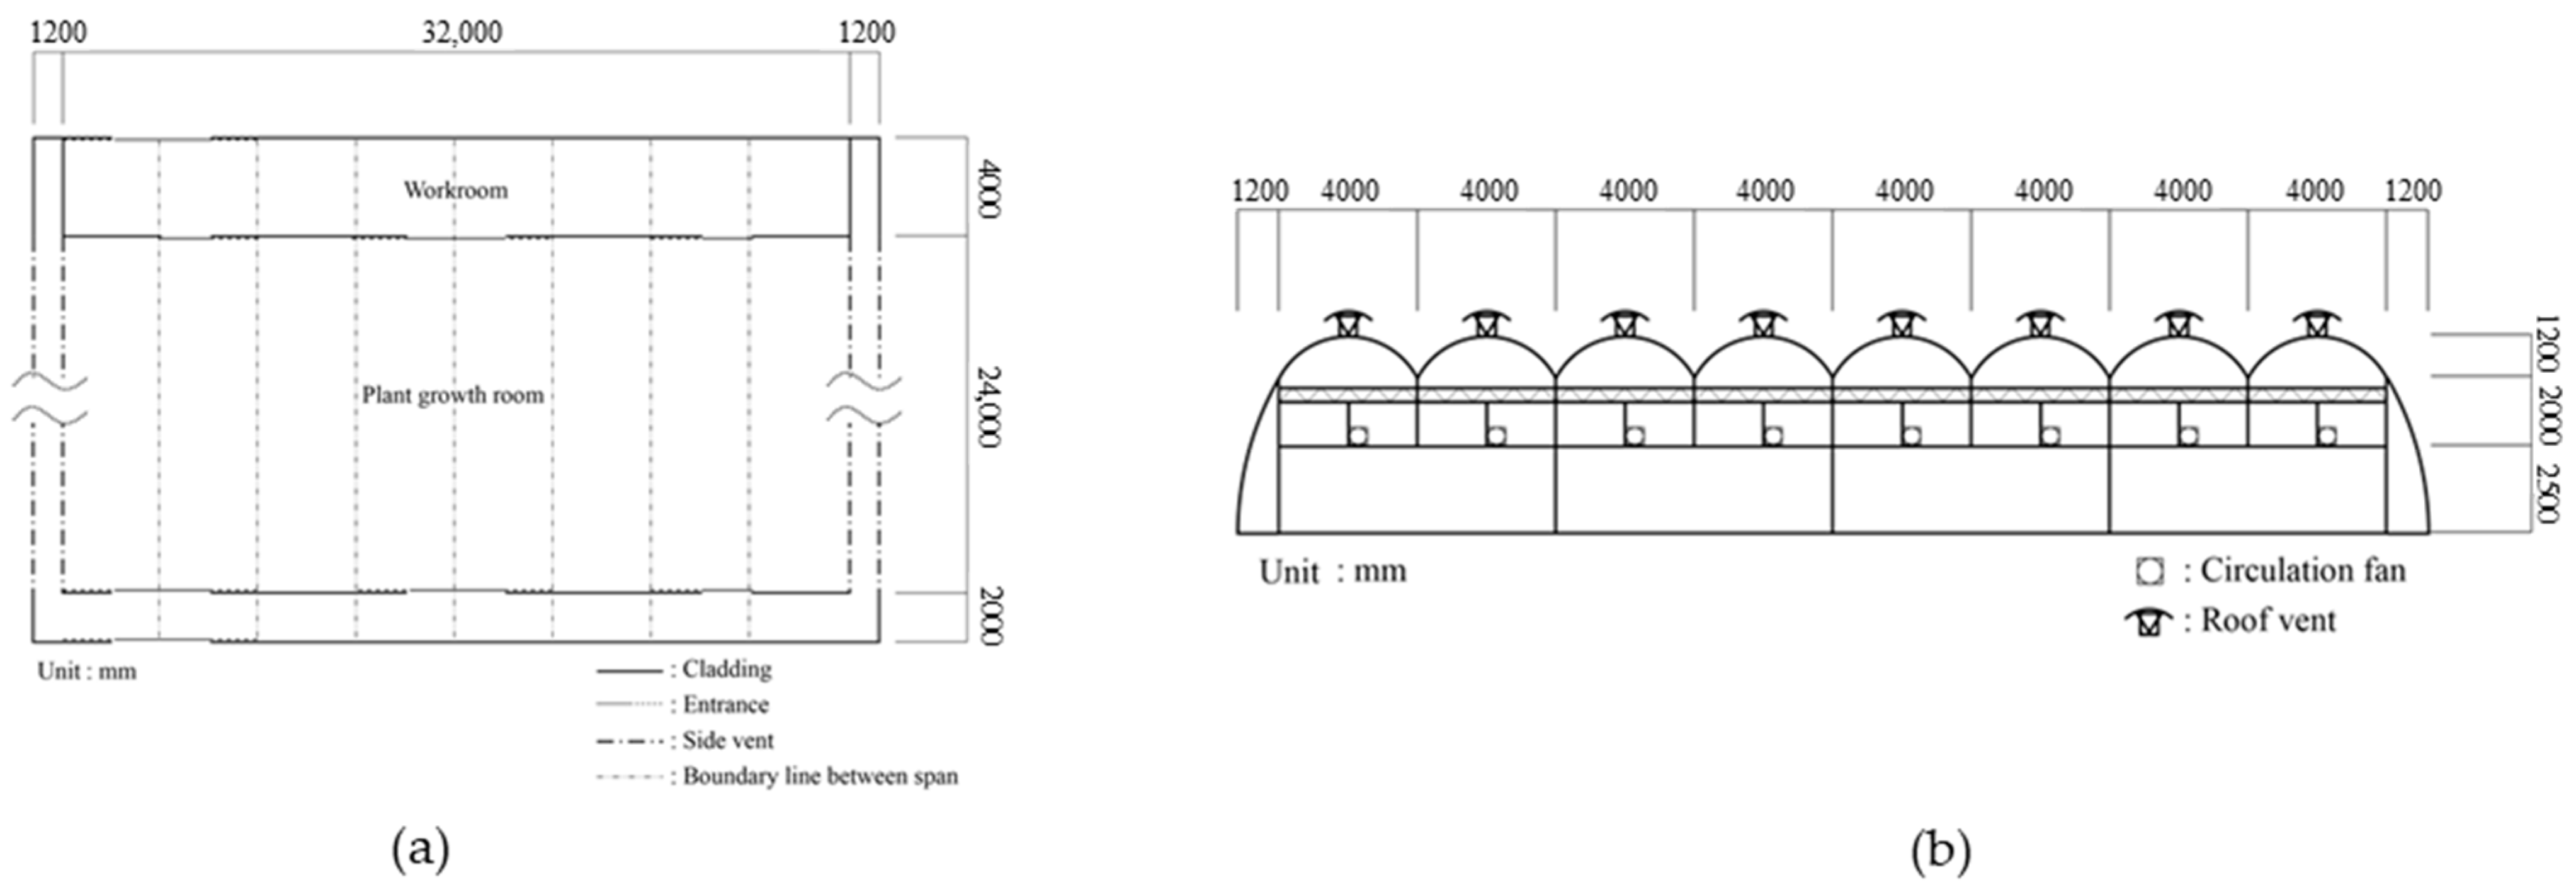
3.2. Target Experimental Greenhouse

The target experimental greenhouse is located in Chungcheongnam-do Province, South Korea. The facility is located in the western part of Boryeong Power Plant. The Boryeong power plant discharges thermal effluent at around 3 billion tons per year [1]. The greenhouse grows a fixed number of Irwin mangoes and is intended for research purposes only. The greenhouse is divided into two partitions: plant growth room (762 m2) and workroom (128 m2), as shown in Figure 2a. The plant growth room is occupied by 100 potted (7.68 m2 spacing) Irwin mango trees pruned at the height of 1.5 m. To equalize the light interception, these mango trees were structured into a globular shape. The optimum growing environment for the mangoes inside the greenhouse was set at 20 °C. However, to bear fruit, the temperature must be lower than the optimum temperature. The experimental greenhouse has a total of 8 spans with a dimension of 34.2 m × 30.0 m (length × width) with a maximum ridge height of 5.7 m and eave height of 4.5 m (Figure 2b). The greenhouse was covered with 0.15 mm-thick single layer polyolefin film.
Shown in Figure 3 is the different equipment installed inside the greenhouse to facilitate an appropriate growing environmental condition. The structure was equipped with an absorption heat pump system where thermal effluent coming from the Boryeong power plant was used as an energy source for heating the greenhouse. In particular, air ducts and 16 circulation fans with 35 m3/min per unit capacity were strategically installed throughout the building to allow a uniform distribution of heat during the cold season. As can be seen from the figure, the main air duct (60 cm diameter) is directly attached to the heat pump, and the sub-air duct (40 cm diameter) is located near each tree pots.

3.3. Softwares and Tools

3.3.1. Building Total Energy Demand

In recent years, there was an increase in published researches for utilizing the different BES software for greenhouse buildings [23,26]. The TRNSYS software (Version 18, Solar Energy Laboratory, University of Wisconsin-Madison, Madison, WI, USA) was used to calculate the energy exchange of the experimental greenhouse. TRNSYS refers to commercially available BES software used to predict the energy load of a building. It is a transient simulation software tool where small components such as heat systems can be designed individually and then be combined with the multi-zone building complex. It also offers a wide range of source code and a large component library. Considering this, many energy simulation studies utilized this software for convenience and accuracy.
Since the experimental greenhouse has thin cladding and plants, the target greenhouse was prone to changes in environmental conditions. Therefore, the energy loads were calculated using a dynamic analysis method. As emphasized by Lee et al. [54], a dynamic model refers to a method of calculating the energy load of the building considering the variable change due to the time factor. To calculate the thermal behavior in the experimental greenhouse, the domain was divided into several zones according to Equation (1):
Qi = Qsurf + Qinf + Qvent + Qishcci + Qsolar + Q(g,c) + Qcplg
where Qi is the total heat gain of zone I (kJ), Qsurf is the convective heat gain or loss from surfaces (kJ hr−1), Qinf is the heat gain or loss by infiltration (kJ hr−1), Qvent is the heat gain or loss by ventilation (kJ hr−1), Qishcci is the absorbed solar radiation on all internal shading devices of the zone and directly transferred as a convective gain to the internal air (kJ hr−1), Qsolar is the fraction of solar radiation entering a zone (kJ hr−1), Q(g,c) is the internal convective gains (kJ hr−1) and Qcplg is the heat gain or loss due to connective air flow from the adjacent zone (kJ hr−1).
However, unlike the expected energy requirement where a lower energy load is required during the early stage of crop production and higher energy load is needed at the later stage of crops, in this study, the computed annual energy in the greenhouse was assumed to remain constant for the entire life span of the systems. Specifically, as previously mentioned, the temperature requirement for different growth stages of mango differs, resulting in different energy requirements. A total of three dynamic energy exchange models were adopted to estimate the annual building energy load of the greenhouse facility, namely the greenhouse structure, the crop energy exchange and heating systems. Shown in Figure 4 is the combined design of the BES model used for calculating the energy load of the greenhouse

3.3.2. Greenhouse Facility Environmental Impact Assessment

In this study, the current versions of OpenLCA (Version 1.10.3, GreenDelta GmbH, Berlin, Germany) and Ecoinvent database (Version 3.6) were used to analyze the environmental impact of the greenhouse, the heating systems and the crop production materials. LCA follows the ISO standard 14040 up to 14044. As previously defined, LCA is a tool known to quantify the economic burden of inputs and outputs over the entire life cycle. In particular, the LCA study comprised four general phases: the Goal and Scope Definition (ISO 14041), the Inventory Analysis (ISO 14041), the Impact Assessment (ISO 14042) and the Interpretation (ISO 14043). The goal definition determines the purpose of the study, while the scope definition process defines the boundaries of the systems being studied. The inventory analysis was considered to be the most laborious part of the LCA study. In this step, all the major components of the products were listed, and the equivalent unit used was determined either by field experiment data or through a series of literature data. A careful selection of the input inventory data must be done to ensure that all the required input and processes were included in the system. The impact assessment involves the selection of an appropriate inventory assessment method. Under this step, the potential environmental effects of all the processes were considered. Finally, the last step in LCA, where the key findings are presented systematically, was to present the critical sources of impact and the options to reduce these impacts.
The life cycle of a system is typically broken down into five stages: manufacturing, transportation, installation, operation and end-of-life treatment. In terms of economic analysis, the net present value (NPV) was adopted. As described by Pombo et al. [55], an energy-efficient building structure could increase energy and cost-saving throughout the entire life cycle. In particular, the author further emphasized that to make a certain product profitable, the energy cost saved over the lifespan must be an investment cost. Thus, in the calculation, all the costs related to the investment were considered negative and all the energy savings were considered positive. Throughout the economic analysis of this research, the following values were used: the annual inflation rate was set at 4%, annual discount rate was 12%, electricity rate was 40.1 KRW/kWh based on agricultural electricity price, and kerosene price was set at an average of price of 1291 Krw/liter. The NPV, which is the difference between the present value of cash inflows and the present value of cash outflows over a period of time, is expressed in Equation (2) as:
N P V = i = 1 n R t ( 1 + r ) i i n i t i a l   i n v e s t m e n t
where NPV is the net present value, Rt is the net cash inflow during a single period, i is equal to the interest rate in present study and t is the number of time periods.

3.4. Introduction to Scenario Cases

The initial step in the study is to calculate the total energy load that considers the energy exchange between the greenhouse facility, the heating systems and the crops inside the target experimental greenhouse. Summarized in Table 1 is the computed total energy load using the BES model. A detailed description of the simulation procedure is discussed in Lee et al. [54]. The final stage of this study was to use the TRNSYS BES simulation result values through integration to OpenLCA software and apply the data to the selected scenario cases.
  • Case 1: Thermal effluent heat-powered absorption heat pump (AHP). When using an AHP as a heating system inside the experimental greenhouse, additional equipment must be installed. This includes but is not limited to the availability of water storage tanks, heat storage tanks and fan coil units.
    The thermal effluent from the power plant flows into the heat pump inside the greenhouse. From the manufacturers’ data, the heat pump has a 43,276 W in maximum cooling capacity and 36,786 W in maximum heating capacity. The energy efficiency (COP) for cooling and heating were 4.68 and 4.61, respectively. Storage tanks of 40 m3 (cold) and 80 m3 (hot) were also constructed to store the water flowing into the system. The fan coil has a power unit of 18,000 (kcal h−1) for cooling and 30,000 (kcal h−1) for heating. In the environmental assessment, the life span of the heat pump was assumed to be 20 years and was in continuous operation for 24 h a day during the entire winter season. As described in Figure 4, circulation fans and air ducts were installed to maintain the uniformity of heating distribution throughout the whole building.
  • Case 2: Electric-powered heat pump. The electric-powered heat pump included in the hypothetical case study with a maximum cooling capacity of 61.6 KW (−5 to 48 °C) and a maximum heating capacity of 69.3 KW (−20 to 24 °C). The unit has COP and power consumption of 3.55 and 17.35 KW for cooling and 4.15 and 16.70 KW for heating. Similar to the AHP (case 1), the electric-powered heat pump (case 2) used air ducts and fans to uniformly distribute heat throughout the building. Unlike case 1, the case 2 scenario does not require additional installation of facility such as storage tanks unlike those of case 1 since the heat source is electricity. The principle of heating involved in this kind of heat pump allows the heat to move from lower temperature to high temperature. Under this case, the heat transferred in the fan coil provides a higher temperature to the surrounding. The electric-powered heat pump was set to have an expected life span of 15 years.
  • Case 3: Kerosene-powered boiler. The second hypothetical case includes the utilization of a natural kerosene-powered boiler. Like the heat pump, the boiler heating system also comprised a various component which includes the burner, chamber, heat exchanger, etc. The basic working principle of a boiler is to store water in a closed vessel and heated by burning fuel in a furnace to produce hot gases. The boiler used in the analysis was assumed to be manufactured abroad with a rated heating of 50 KW and fuel consumption of 5 L/hr. The boiler was also assumed to have 63% operational efficiency. The boiler has a stainless heat exchanger and brass gas burner. Given this material component, the boiler was assumed to be operational for the span of 30 years. Moreover, the kerosene used to power the power was set to have a heating value of 46.20 MJ/kg of kerosene fuel.

3.5. Environmental Assessment Process

The following subsections present different phases of an LCA on greenhouse facilities. In this section, the sequential flow of LCA analysis was presented following the four general phases of LCA.

3.5.1. Goal and Scope

As previously mentioned, the goal of the research is to determine the optimum heating systems inside the greenhouse. To reach this goal, two hypothetical case studies (electric-powered system and kerosene-powered boiler) were added in the scenario case and were assumed to be used as a source of heating system of the target greenhouse. The functional unit, which is the basis for the comparative analysis, was defined as 1 m2 of heated and cooled greenhouse floor area for the duration of 1 year. The scope of this work was restricted by omitting all processes that are not related to the function of the greenhouse and in particular those that can be separated from the operation of the greenhouse facilities such as the installation of greenhouse equipment including the microclimate sensors, vents, lightings and fixtures, etc. Moreover, the analysis was performed using a process-based approach wherein the life cycle of the systems is divided into distinct phases: extraction of raw materials, production and disposal.

3.5.2. Data Input Inventory

As previously mentioned, the Ecoinvent 3.6 database was utilized to assess the environmental impact of greenhouse production, heating system and crop production. Accordingly, the dataset used for the greenhouse was set to a 25 years life span and represents the production up to the disposal of a 1 m2 greenhouse with film covering. The building also included a fertigation system, CO2 injection system and storage facilities. For the different heating systems, the datasets for diffusion absorption heat pumps, brine-water heat pump and oil boilers were used. In the case of the energy used, the reduced energy consumption of 59% was assumed considering the study result conducted by Cecconet et al. [54] for heat energy recovery of wastewater. Due to the absence of Irwing mango variety in the Ecoinvent 3.6 database for mango production, this study used a dataset that considered the Tommy Atkins, Palmer Keitt, Kent and Palmar mango varieties instead. These databases were adjusted accordingly to suit the condition of the actual experimental greenhouse. The detailed data inventory was supplemented in Appendix A.

3.5.3. Life Cycle Impact Assessment (LCIA)

Technically, most greenhouse gases naturally occur within the Earth’s surface; however, the emission was intensified by various human activities, which in turn caused climate change. Therefore, in this study, the CML 2001 method was used to evaluate and compare the impacts of the three heating systems. Specifically, acidification potential (kg SO2-eq), the global warming potential (kg CO2-eq) and eutrophication potential (kg PO4-eq) were used to compare the environmental impact of each case. The AP refers to the different acidifying contaminants, including sulfur dioxide (SO2), nitrogen oxides (NOx) and nitrogen monoxide (NO), that caused acid deposition on both soil and water [56]. On the other hand, Bird et al. [13] and Kumar et al. [57] cited that the CO2-eq, which causes climate change, not only represents CO2 emissions but also represents the non-CO2 greenhouse gases such as methane (CH4) and nitrous oxide (N2O) and have an equivalent factor that is dependent on average residence time in the atmosphere. The same definition and procedure as the GWP was employed when estimating the total PO4-eq emission from the entire life cycle. According to Jan et al. [58], the EP assessed the environmental burden caused by greenhouse gases such as nitrogen (N) and phosphorus (P) to the aquatic and terrestrial ecosystems.

4. Results and Discussion

4.1. Case Scenario Environmental Analysis and Life Cycle Interpretation

The environmental impact caused by every process in the boundary system was studied by using the inventory dataset. Summarized in Figure 5a is the overall relative indicator results of the simulated scenario cases. As can be seen, the environmental impact caused by the kerosene-powered boiler had the largest contribution among all LCIA criteria. These may be caused by all the output gas emitted during the burning process of kerosene fuel to power the boiler system. The next highest environmental impact was attributed to case 2, which used electricity to provide heat to the entire facility, while case 1 showed the least environmental burden due to less dependency on energy used. Since the main goal of this paper is to analyze the emissions of the major greenhouse gas dispersed into the atmosphere, as previously mentioned, the AP, GWP and EP were the only environmental burdens that are discussed in the following subsections.
Figure 5b, on the other hand, shows the percent contribution of the different systems components used in the assessment. Specifically, it was found that the energy used for heating (source of heat) contributed to the highest environmental burdens with about 43.95% to 96.47, 86.59% to 95.73% and 40.59% to 89.47% for AP, GWP and EP, respectively. However, the construction and maintenance of greenhouse buildings were shown to contribute a maximum of 40.86% when a heat pump was used (case 2) and only 4.94% when a kerosene-powered boiler was utilized. The low contribution of greenhouse building to environmental burdens in case 3 was due to the very high impact of burning kerosene fuel during the operation of the heating systems. Subsequently, the materials used for the production of different heating systems have the least environmental burden at 0.88% to 6.01% contribution, 0.89% to 7.69% contribution, 0.36% to 1.94% contribution for case 1, case 2 and case 3, respectively. This is because the heat pumps and boilers used in the analysis have a long life span. This means that a unit of heat pump or boiler can be used for several years.
Table 2 shows the total quantitative impact categories of different heating systems used inside the greenhouse. The use of case 1 reduces the AP to 4.954 × 10⁻² (kg SO2-eq), a very small emission compared to case 3. However, in the case of the GWP in case 1 and case 2, it was greatly reduced from 1.13954 × 10² kg CO2-eq when case 3 was used. In addition to a higher CO2 emission generated when operating the systems, based on the analysis of the results, the materials used to produce and operate one unit of electricity-powered heat pump also contributed to the high GWP, resulting in a difference in GWP with that of case 1. Lastly, the EP of case 3 was largest by an average of 1.47954 × 10⁻¹ kg PO4-eq when compared with case 1 and case 2.
Summarized in Table 3 is the detailed quantitative LCIA result of the three case scenarios. From the environmental point of view, it can be observed that the energy used to operate the greenhouse had the highest influence on the assessment result. This is caused by the different processes involved to generate 1 MJ of energy. In the case of greenhouse building and mango production, constant input and output values were given to each case considering that the heating systems were assumed to be the only factor that changes in the boundary system.
The additional potential of LCA is its capability to execute environmental impact contribution analysis on the specific material or process. Presented in Figure 6 are different illustrations showcasing the specific impact contribution of the input materials for the construction and maintenance of the greenhouse building. It must be noted that the materials shown in each figure reflect only the dominant materials causing environmental impact and those with very little contribution were summed and coined as “others”. Moreover, those materials with less than 1% contribution were not labeled for better visualization. The top five main contributors of environmental burdens include the use of zinc coating coils, the low alloyed steel used for constructing the greenhouse frame, polyvinyl fluoride and ethyl vinyl which were both used for greenhouse covering and lastly the chromium steel.

4.2. Economic Analysis

The target greenhouse was assumed to be used for research purposes, and therefore there was no economic gain during the entire life cycle of both greenhouse building and heating systems. This means that only the cash outflows were included in the NPV calculation. Ideally, if the NPV has a positive value, it means that the income generated was higher compared with all the accumulated cost. However, a negative NPV indicates that there is an economic loss in the investment. Considering the assumptions made in Section 3.3.2 and the initial cost of KRW 4.4 million for heat pumps and KRW 6.3 million for boiler, the NPV was calculated. The NPV calculation result of different heating systems showed that case 1 has −120,685,762.44, case 2 has an NPV of −131,489,523.75 and case 3 has −317,437,668.47. From this, it can be concluded that utilizing the heat pump system (case 1 and case 2) has a lower negative NPV compared with the use of a boiler. This calculation result accounted for the high maintenance cost of the boiler system, and a continuous hike in the price of kerosene to power the boiler resulted in the highest cash outflows.

4.3. Discussion on the Comparison of Different Heating Systems

The choice between a heat pump (case 1 or case 2) and boilers (case 3) should be made based on what is most important to the farm owner, the budget and the location of the greenhouse farm. When comparing the physical properties of different heating systems, case 1 and case 2 are effective and efficient heating systems due to high heating efficiency. As cited in many studies, many older boilers are only low heating efficiency of 50–75%. This means that a large amount of energy used for the operation was not utilized and wasted. As claimed by several authors and manufacturing companies, the current boilers available on the market can achieve a high efficiency of 92% where only 8% of energy is wasted. Accordingly, to attain a high-efficiency boiler, it was suggested to replace the oil boilers used with a new modern model. However, the drawback of utilizing case 1 and case 2 as heating as a heating option is its lower lifespan which only lasted for about 15 to 20 years compared with boilers, which can last up to 30 years. Secondly, the installation of case 1 and case 2 required the utilization of outside space. This is specifically true for case 1, which needs to have a larger space for the construction of a hot and cold water storage tank, which adds to the initial economic cost. For case 2, a smaller outside space was needed, and in some cases, there will also be an indoor unit including the heat exchanger. In case 3, a typical kerosene-powered boiler is considerably more compact compared with the previously mentioned heating systems.
One of the goals of this paper is to assess the environmental impact caused by different heating systems used in a greenhouse. The analysis revealed that the use of an electric-powered heat pump (case 2) resulted in a higher environmental impact when compared with the use in case 1 of thermal effluent heat-powered AHP). However, this result may be different if the source of electricity is obtained from renewable sources such as wind, solar, tidal or hydropower energy source. The main factor that was found to give this assessment result is that a higher amount of heat energy from electric sources was being utilized to operate the system. Moreover, it was also found that case 3 had the highest environmental burden. This is agreed by the conclusion stated by [37,49,58] which stated that a boiler has the highest carbon footprint compared to a different type of heat pumps systems. Especially, according to Greening and Azapagic [59], in the case of GWP, heat pumps can save up to 36% of CO2-eq. Nevertheless, the case 1 and case 2 systems have higher efficiency, which makes them the far more environmentally friendly choice.
In the case of the economic aspect, although heat pumps use electricity to run, which is around four times the price of gas, the fact that the heat pump is so efficient means that it uses very little electricity and the running costs are therefore comparable. An emphasis should also be given to the use of thermal effluent heat-powered AHP (case 1) as a source of heat since the amount of heat extracted from the thermal effluent greatly reduces the amount of energy required to maintain the optimum environment of the target greenhouse. For case 3, it was shown that a lower investment cost was possible using this heating system. However, due to over-exploitation of fossil fuels like gas and oil continuously resulting in energy resource depletion, it is likely that these prices will continue to rise in the future, resulting in a higher economic burden to farm owners.

5. Conclusions

This study aims to assess and compare both the environmental and economic impact of different heating systems typically used in conventional Korean greenhouse facilities. In the first part of the research, the total energy load needed for crop production on the target experimental greenhouse was calculated using the Building Energy Simulation (BES) software. The average total annual heating load obtained from the calculation was used as the reference for the heating requirement for the life cycle analysis. Three scenario cases were analyzed in the study, which included case 1 (thermal effluent heat powered absorption heat pump (AHP)), case 2 (electric powered heat pump) and case 3 (kerosene powered boiler). The OpenLCA free source software and Ecoinvent 3.6 database was used in the study. The result showed that the use of case 3 as a heating source offers significant environmental disadvantages. Specifically, the environmental assessment revealed that the environmental impact caused by this system is largest in terms of the acidification potential (AP), global warming potential (GWP) and Eutrophication Potential (EP) of 1.15 × 100 kg SO2-eq, 1.13 × 10² kg CO2-eq and 1.62 × 10⁻¹ kg PO4-eq, respectively. Among the three cases, the thermal effluent heat-powered AHP was found to have a lower environmental burden. Specifically, the AP of case 1 was 38.99 to 95.70%, GWP was 32 to 76% to 75.33% and EP was 16.63% to 90.92% lower compared with case 2 and case 3. Detailed analysis of the results showed that the main contributor to greenhouse gas emission was caused by the type, amount and source of energy used to heat the greenhouse, which contributed to a maximum of 86.59% for case 1, 96.69% for case 2 and a maximum of 96.47% for case 3, depending on the type of gas being considered. The contribution of greenhouse gas emissions caused by building construction, operation and maintenance can also contribute to up to 40.86% of the environmental burden. Finally, the economic analysis of three cases showed that case 1 tends to give a lesser economic burden compared with the other two cases. The finding obtained from this study can be used to support decision making on the selection of the appropriate heating system to be used in the greenhouse. However, further evaluation is mandated considering other types of heating systems typically used in the greenhouse.

Author Contributions

Conceptualization, C.D.-V., U.-H.Y., S.-Y.L.; Methodology, C.D.-V.; software, C.D.-V.; data curation, C.D.-V., S.-Y.L.; writing—original draft preparation, C.D.-V., writing—review and editing, I.-B.L., U.-H.Y.; S.-Y.L.; J.-G.K., S.-J.P., Y.-B.C., J.-H.C., visualization, H.-H.J.; supervision, I.-B.L.; All authors have read and agreed to the published version of the manuscript.

Funding

This research received no external funding.

Institutional Review Board Statement

Not applicable.

Informed Consent Statement

Not applicable.

Data Availability Statement

All the data used in the manuscript was attached in the appendix table. This dataset was extracted on ecoinvent database (mentioned in the materials and method chapter) and modified according to our selected functional unit.

Conflicts of Interest

The authors declare no conflict of interest.

Appendix A

Table A1. Material inventory data for the Greenhouse.
FlowAmountUnit
Input
acrylic varnish, without water, in 87.5% solution state1.39 × 10−3kg
agricultural machinery, unspecified9.50 × 10−3 kg
aluminum scrap, post-consumer−8.00 × 10⁻³ kg
aluminum, cast alloy8.00 × 10−3 kg
bitumen seal1.25 × 10−4 kg
blow molding3.96 × 10−3kg
calendering, rigid sheets1.25 × 10−3 kg
concrete block4.17 × 10−2 kg
concrete block9.20 × 10−2kg
copper8.10 × 10−4kg
diesel, burned in building machine4.67 × 10−1MJ
electricity, low voltage2.35 × 10−3kWh
electronics, for control units2.00 × 10−5kg
ethylene vinyl acetate copolymer1.53 × 10−1kg
extrusion, plastic film2.12 × 10−1kg
extrusion, plastic pipes9.28 × 10−2kg
glass-fiber-reinforced plastic, polyamide, injection molded1.02 × 10−4 kg
injection molding2.95 × 10−2 kg
iron scrap, unsorted−3.51 × 10⁻¹ kg
polycarbonate1.25 × 10−3 kg
polyester resin, unsaturated1.71 × 10−3 kg
polyethylene, high-density, granulate5.99 × 10−2 kg
polyethylene, linear low density, granulate5.95 × 10−2 kg
polymer foaming6.13 × 10−3 kg
polypropylene, granulate3.77 × 10−2 kg
polystyrene, expandable6.13 × 10−3 kg
polyvinylfluoride2.99 × 10−2 kg
section bar extrusion, aluminium8.00 × 10−3 kg
section bar rolling, steel2.82 × 10−1 kg
sheet rolling, steel4.44 × 10−2 kg
silicone product1.50 × 10−4 kg
steel, chromium steel 18/84.30 × 10−2 kg
steel, low-alloyed3.07 × 10−1 kg
synthetic rubber3.75 × 10−4 kg
tractor, 4-wheel, agricultural1.90 × 10−2 kg
wire drawing, copper2.25 × 10−3 kg
zinc coat, coils2.93 × 10−2 m2
Output
waste concrete1.19 × 10−0 kg
waste electric and electronic equipment8.30 × 10−4 kg
waste plastic, mixture1.41 × 10−3 kg
waste polyvinylchloride1.07 × 10−4 kg
waste rubber, unspecified3.60 × 10−4 kg
Table A2. Material inventory data for mango production.
FlowAmountUnit
Input
application of plant protection product, by field sprayer4.51 × 10−3ha
carbon dioxide, in air4.01 × 100kg
chlorine dioxide3.45 × 10−7kg
cobalt1.09 × 10−4kg
dolomite5.23 × 10−3kg
energy, gross calorific value, in biomass3.26 × 101MJ
ethoxylated alcohol (AE > 20)6.33 × 10⁻⁵kg
gypsum, mineral1.66 × 10−1kg
harvesting, forestry harvester1.25 × 10−4h
irrigation1.07 × 10−2m3
lime2.62 × 10−4kg
magnesium oxide2.96 × 10−2kg
mancozeb1.73 × 10−4kg
manganese concentrate1.39 × 10−3kg
mango seedling, for planting4.71 × 10−3Item(s)
molybdenum trioxide6.35 × 10−5kg
nitrogen fertilizer, as N3.70 × 10−2kg
occupation, permanent crop, irrigated3.76 × 100m2 * a
packaging, for fertilizers7.91 × 10−1kg
packaging, for pesticides5.49 × 10−2kg
pesticide, unspecified2.71 × 10−3kg
phenol1.98 × 10−5kg
phosphate fertiliser, as P2O52.64 × 10−2kg
planting with starter fertilizer, by no-till planter1.25 × 10−5ha
polydimethylsiloxane1.15 × 10−5kg
potassium fertiliser, as K2O7.71 × 10−2kg
sulfur1.93 × 10−2kg
tap water4.26 × 10−5kg
tillage, harrowing, by offset leveling disc harrow2.50 × 10−5ha
tillage, subsoiling, by subsoiler plow1.25 × 10−5ha
transformation, from permanent crop, irrigated1.88 × 10−1m2
weed control, by brush cutter, pasture2.25 × 10−3ha
zinc oxide3.66 × 10−3kg
Output
Abamectin1.58 × 10−6kg
Ammonia3.68 × 10−3kg
Azoxystrobin7.32 × 10−5kg
Cadmium1.13 × 10−6kg
Cadmium, ion1.58 × 10−8kg
Cadmium, ion3.53 × 10−9kg
Carbon dioxide, fossil2.55 × 10−2kg
Chloride3.45 × 10−7kg
Chromium9.36 × 10−6kg
Chromium, ion7.40 × 10−6kg
Chromium, ion3.92 × 10−7kg
Copper2.40 × 10−12kg
Copper, ion1.12 × 10−6kg
Copper, ion2.92 × 10−7kg
Difenoconazole6.61 × 10−5kg
Dinitrogen monoxide8.95 × 10−4kg
Ethephon9.65 × 10−5kg
Indoxacarb1.19 × 10−5kg
Lead4.48 × 10−7kg
Mancozeb1.73 × 10−4kg
Nickel1.98 × 10−6kg
Nitrate6.80 × 10−2kg
Nitrogen oxides1.46 × 10−3kg
Pesticides, unspecified1.94 × 10−3kg
Phosphorus1.67 × 10−5kg
Pyraclostrobin (prop)3.67 × 10⁻⁵kg
Spinosad5.48 × 10−8kg
Tebuconazole1.06 × 10−4kg
Thiophanat-methyl3.63 × 10−4kg
Trifloxystrobin1.05 × 10−5kg
waste wood, untreated4.58 × 10−1kg
Water3.11 × 100m3
Zinc1.08 × 10−5kg
Zinc, ion5.76 × 10−6kg
Table A3. Material inventory data for thermal effluent heat source AHP (Case 1).
FlowAmountUnit
Input
aluminum, wrought alloy4.30 × 10−3kg
ammonia, liquid2.93 × 10−4kg
building, hall, steel construction1.74 × 10−6m2
building, multi-story1.04 × 10−5m3
copper9.77 × 10−4kg
electricity, low voltage7.81 × 10−3kWh
electricity, medium voltage2.60 × 10−2kWh
electronics, for control units1.95 × 10−5kg
helium7.81 × 10−4kg
injection moulding3.13 × 10−4kg
Occupation, industrial area, built up7.81 × 10−4m2 * a
polyethylene, high density, granulate3.22 × 10−2kg
reinforcing steel6.25 × 10−3kg
sheet rolling, chromium steel3.22 × 10−2kg
sheet rolling, steel6.25 × 10−3kg
steel, chromium steel 18/8, hot rolled1.56 × 10−3kg
stone wool, packed6.25 × 10−6kg
Transformation, from unknown6.25 × 10−6m2
Transformation, to industrial area, built up3.91 × 10−2m2
tube insulation, elastomere7.81 × 10−4kg
water, completely softened4.18 × 10−4kg
water, completely softened5.59 × 10−4kg
Water, unspecified natural origin5.96 × 10−5m3
zinc coat, coils2.93 × 10−3m2
Output
electronics scrap from control units7.81 × 10−4kg
waste mineral wool1.11 × 10−3kg
waste mineral wool4.55 × 10−4kg
waste polyethylene/polypropylene product4.41 × 10−4kg
waste polyethylene/polypropylene product1.12 × 10−3kg
wastewater, from residence1.99 × 10−5m3
Table A4. Material inventory data for electric heat pump (Case 2).
FlowAmountUnit
Input
copper5.73 × 10−3kg
electricity, medium voltage3.65 × 10−2kWh
lubricating oil4.43 × 10−4kg
polyvinylchloride, bulk polymerized2.60 × 10−4kg
refrigerant R134a8.05 × 10−4kg
reinforcing steel1.95 × 10−2kg
steel, low-alloyed, hot rolled5.21 × 10−3kg
tube insulation, elastomere2.60 × 10−3kg
Water, unspecified natural origin1.84 × 10−4m3
Output
ethane, 1,1,1,2-tetrafluoro-, HFC-134a9.20 × 10−1kWh
waste plastic, mixture1.59 × 101MJ
water1.42 × 10−1m3
water8.02 × 10−1m3
Table A5. Material inventory data for kerosene powered boiler (Case 3).
FlowAmountUnit
Input
alkyd paint, white, without solvent, in 60% solution state2.17 × 10−3kg
aluminum, cast alloy1.30 × 10−2kg
brass4.34 × 10−5kg
brazing solder, cadmium free5.21 × 10−3kg
copper2.17 × 10−2kg
corrugated board box1.01 × 10−1kg
corrugated board box8.58 × 10−3kg
polyethylene, high density, granulate1.22 × 10−3kg
steel, chromium steel 18/8, hot rolled2.17 × 10−2kg
steel, low-alloyed, hot rolled4.21 × 10−1kg
stone wool, packed1.65 × 10−2kg
tap water6.43 × 10−1kg
waste paperboard, unsorted−8.68 × 10⁻³kg
Output
hazardous waste, for incineration1.69 × 10−3kg
hazardous waste, for incineration3.52 × 10−3kg
waste mineral wool, for final disposal9.39 × 10−3kg
waste mineral wool, for final disposal7.10 × 10−3kg
waste plastic, mixture1.35 × 10−4kg
waste plastic, mixture9.46 × 10−4kg
waste plastic, mixture1.15 × 10−4kg
waste plastic, mixture3.73 × 10−6kg
waste plastic, mixture6.83 × 10−7kg
waste plastic, mixture9.03 × 10−6kg
waste plastic, mixture3.54 × 10−6kg
waste plastic, mixture1.51 × 10−6kg
wastewater from pig iron production6.22 × 10−5m3
wastewater from pig iron production4.72 × 10−4m3
Water9.65 × 10−5m3
Water1.29 × 10−5m3
Table A6. Inventory for energy source used for heating the greenhouse.
FlowAmountUnit
Input
heat, district or industrial, natural gas4.34 × 102MJ
heat, district or industrial, natural gas1.06 × 103MJ
kerosene2.29 × 101kg

References

  1. Lee, S. Design of a Greenhouse Energy Model Including Energy Exchange of Internal Plants and Its Application for Energy Loads Estimation. Master’s Thesis, Seoul National University, Seoul, Korea, 2017. [Google Scholar]
  2. Greenhouse Horticulture in Korea. 2016. Available online: https://www.agroberichtenbuitenland.nl/binaries/agroberichtenbuitenland/documenten/rapporten/2016/06/22/greenhouse-horticulture-in-korea/Greenhouse-Horticulture-in-South-KoreaJune-2016.pdf (accessed on 28 January 2021).
  3. KEEI. Korea Energy Review Monthly; Energy Statistics Analysis Div.: Ulsan, Korea, 2020. [Google Scholar]
  4. Institute, K.R.E. Feasibility for Commercial Use of Nuclear Hot Water; Korea Rural Economic Research Institute: Seoul, Korea, 2005. [Google Scholar]
  5. KEPCO. Available online: Home.kepco.co.kr (accessed on 28 January 2021).
  6. D’Arpa, S.; Colangelo, G.; Starace, G.; Petrosillo, I.; Bruno, D.E.; Uricchio, V.; Zurlini, G. Heating requirements in greenhouse farming in southern Italy: Evaluation of ground-source heat pump utilization compared to traditional heating systems. Energy Effic. 2015, 9, 1065–1085. [Google Scholar] [CrossRef]
  7. Zhang, L.; Xu, P.; Mao, J.; Tang, X.; Li, Z.; Shi, J. A low cost seasonal solar soil heat storage system for greenhouse heating: Design and pilot study. Appl. Energy 2015, 156, 213–222. [Google Scholar] [CrossRef]
  8. Shen, Y.; Wei, R.; Xu, L. Energy Consumption Prediction of a Greenhouse and Optimization of Daily Average Temperature. Energies 2018, 11, 65. [Google Scholar] [CrossRef] [Green Version]
  9. Koroneos, C.; Tsarouhis, M. Exergy analysis and life cycle assessment of solar heating and cooling systems in the building environment. J. Clean. Prod. 2012, 32, 52–60. [Google Scholar] [CrossRef]
  10. Beccali, M.; Cellura, M.; Longo, S.; Nocke, B.; Finocchiaro, P. LCA of a solar heating and cooling system equipped with a small water–ammonia absorption chiller. Sol. Energy 2012, 86, 1491–1503. [Google Scholar] [CrossRef]
  11. Beccali, M.; Cellura, M.; Longo, S.; Guarino, F. Solar heating and cooling systems versus conventional systems assisted by photovoltaic: Application of a simplified LCA tool. Sol. Energy Mater. Sol. Cells 2016, 156, 92–100. [Google Scholar] [CrossRef]
  12. Hosseini-Fashami, F.; Motevali, A.; Nabavi-Pelesaraei, A.; Hashemi, S.J.; Chau, K.W. Energy-Life cycle assessment on applying solar technologies for greenhouse strawberry production. Renew. Sustain. Energy Rev. 2019, 116. [Google Scholar] [CrossRef]
  13. Bird, N.; Cowie, A.; Cherubini, F.; Jugmeier, G. Using A Life Cycle Assessment Approach to Estimate the Net Greenhouse Gas Emissions of Bioenergy; IEA Bioenergy: Rotorua, New Zealand, 2011. [Google Scholar]
  14. Hendricks, P. Life Cycle Assessment of Greenhouse Tomato (Solanum lycopersicum L.) Production in Southwestern Ontario. Master’s Thesis, University of Guelph, Guelph, ON, Canada, 2012. [Google Scholar]
  15. Singh, A.; Berghorn, G.; Joshi, S.; Syal, M. Review of Life-Cycle Assessment Applications in Building Construction. J. Archit. Eng. 2011, 17, 15–23. [Google Scholar] [CrossRef]
  16. Röck, M.; Hollberg, A.; Habert, G.; Passer, A. LCA and BIM: Visualization of environmental potentials in building construction at early design stages. Build. Environ. 2018, 140, 153–161. [Google Scholar] [CrossRef]
  17. Rodrigues, V.; Martins, A.A.; Nunes, M.I.; Quintas, A.; Mata, T.M.; Caetano, N.S. LCA of constructing an industrial building: Focus on embodied carbon and energy. Energy Procedia 2018, 153, 420–425. [Google Scholar] [CrossRef]
  18. Nguyen, T.T.H. Life Cycle Assessment of Cattle Production: Exploring Practices and System Changes to Reduce Environmental Impacts. Ph.D. Thesis, Université Blaise Pascal, Aubière, France, 2013. [Google Scholar]
  19. Liao, W.; van der Werf, H.M.; Salmon-Monviola, J. Improved Environmental Life Cycle Assessment of Crop Production at the Catchment Scale via a Process-Based Nitrogen Simulation Model. Environ. Sci. Technol. 2015, 49, 10790–10796. [Google Scholar] [CrossRef]
  20. Niero, M.; Ingvordsen, C.H.; Jørgensen, R.B.; Hauschild, M.Z. How to manage uncertainty in future Life Cycle Assessment (LCA) scenarios addressing the effect of climate change in crop production. J. Clean. Prod. 2015, 107, 693–706. [Google Scholar] [CrossRef] [Green Version]
  21. Zhang, H.; Burr, J.; Zhao, F. A comparative life cycle assessment (LCA) of lighting technologies for greenhouse crop production. J. Clean. Prod. 2017, 140, 705–713. [Google Scholar] [CrossRef]
  22. Asem-Hiablie, S.; Battagliese, T.; Stackhouse-Lawson, K.R.; Alan Rotz, C. A life cycle assessment of the environmental impacts of a beef system in the USA. Int. J. Life Cycle Assess. 2018, 24, 441–455. [Google Scholar] [CrossRef] [Green Version]
  23. Ha, T.; Lee, I.B.; Kwon, K.S.; Hong, S.W. Computation and field experiment validation of greenhouse energy load using building energy simulation model. Int. J. Agric. Biol. Eng. 2015. [Google Scholar] [CrossRef]
  24. Ha, T.; Kwon, K.-S.; Hong, S.-W.; Choi, H.-C.; Lee, J.-Y.; Lee, D.-H.; Woo, S.; Yang, K.-Y.; Kim, R.-W.; Yeo, U.-H.; et al. Estimation of THI index to evaluate thermal stress of animal occupied zone in a broiler house using BES method. In Proceedings of the 10th International Livestock Environment Symposium (ILES X), Omaha, Nebraska, 25–27 September 2018. [Google Scholar]
  25. Rasheed, A.; Lee, J.; Lee, H. Development and Optimization of a Building Energy Simulation Model to Study the Effect of Greenhouse Design Parameters. Energies 2018, 11, 2001. [Google Scholar] [CrossRef] [Green Version]
  26. Rasheed, A.; Na, W.H.; Lee, J.W.; Kim, H.T.; Lee, H.W. Optimization of Greenhouse Thermal Screens for Maximized Energy Conservation. Energies 2019, 12, 3592. [Google Scholar] [CrossRef] [Green Version]
  27. Kumar, P.; Martani, C.; Morawska, L.; Norford, L.; Choudhary, R.; Bell, M.; Leach, M. Indoor air quality and energy management through real-time sensing in commercial buildings. Energy Build. 2016, 111, 145–153. [Google Scholar] [CrossRef]
  28. Ramírez-Villegas, R.; Eriksson, O.; Olofsson, T. Assessment of renovation measures for a dwelling area–Impacts on energy efficiency and building certification. Build. Environ. 2016, 97, 26–33. [Google Scholar] [CrossRef]
  29. Wei, W.; Wargocki, P.; Zirngibl, J.; Bendžalová, J.; Mandin, C. Review of parameters used to assess the quality of the indoor environment in Green Building certification schemes for offices and hotels. Energy Build. 2020, 209. [Google Scholar] [CrossRef]
  30. Maile, T.; Fischer, M.; Barjanaz, V. Building energy performance simulation tools—A life-cycle and interoperable perspective. Cent. Integr. Facil. Eng. Work. Pap. 2007, 107, 1–49. [Google Scholar]
  31. Stadler, M.; Firestone, R.; Curtil, D.; Marnay, C. On-Site Generation Simulation with EnergyPlus for Commercial Buildings. In Proceedings of the 2006 ACEEE Summer Study on Energy Efficiency in Buildings, Asilomar, CA, USA, 13–18 August 2006. [Google Scholar]
  32. Fabrizio, E. Energy reduction measures in agricultural greenhouses heating: Envelope, systems and solar energy collection. Energy Build. 2012, 53, 57–63. [Google Scholar] [CrossRef]
  33. Boyano, A.; Hernandez, P.; Wolf, O. Energy demands and potential savings in European office buildings: Case studies based on EnergyPlus simulations. Energy Build. 2013, 65, 19–28. [Google Scholar] [CrossRef]
  34. Al-ajmi, F.F.; Hanby, V.I. Simulation of energy consumption for Kuwaiti domestic buildings. Energy Build. 2007, 40, 1101–1109. [Google Scholar] [CrossRef]
  35. Hong, S.W.; Lee, I.B.; Hong, H.K.; Seo, I.H.; Hwang, H.S.; Bitog, J.P.; Yoo, J.I.; Kwon, K.S.; Ha, T.H.; Kim, K.S. Analysis of Heating Load of a Naturally Ventilated Broiler House using BES Simulation. J. Korean Soc. Agric. Eng. 2008, 50, 39–47. [Google Scholar] [CrossRef]
  36. Vadiee, A.; Martin, V. Energy analysis and thermoeconomic assessment of the closed greenhouse–The largest commercial solar building. Appl. Energy 2013, 102, 1256–1266. [Google Scholar] [CrossRef]
  37. Shah, V.P.; Debella, D.C.; Ries, R.J. Life cycle assessment of residential heating and cooling systems in four regions in the United States. Energy Build. 2008, 40, 503–513. [Google Scholar] [CrossRef]
  38. Blumsack, S.; Brownson, J.; Witmer, L. Efficiency, Economic and Environmental Assessment of Ground-Source Heat Pumps in Central Pennsylvania. In Proceedings of the 42nd Hawaii International Conference on System Sciences, Waikoloa, HI, USA, 5–8 January 2009. [Google Scholar]
  39. Rodriguez Droguett, B. Embodied Carbon of Heating, Ventilation, Air Conditioning and Refrigerants (HVAC+R) Systems. Ph.D. Thesis, University of Washington, Seattle, WA, USA, 2019. [Google Scholar]
  40. Ylmén, P.; Peñaloza, D.; Mjörnell, K. Life Cycle Assessment of an Office Building Based on Site-Specific Data. Energies 2019, 12, 2588. [Google Scholar] [CrossRef] [Green Version]
  41. Santos, R.; Costa, A. BIM in LCA/LCEA Analysis: Comparative analysis of Multi-family House and Single-family. In Proceedings of the CIB World Building Congress 2016, Tampere, Finland, 30 May–3 June 2016. [Google Scholar]
  42. Sanyé-Mengual, E.; Oliver-Solà, J.; Montero, J.I.; Rieradevall, J. An environmental and economic life cycle assessment of rooftop greenhouse (RTG) implementation in Barcelona, Spain. Assessing new forms of urban agriculture from the greenhouse structure to the final product level. Int. J. Life Cycle Assess. 2015, 20, 350–366. [Google Scholar] [CrossRef] [Green Version]
  43. Bartzas, G.; Zaharaki, D.; Komnitsas, K. Life cycle assessment of open field and greenhouse cultivation of lettuce and barley. Inf. Process. Agric. 2015, 2, 191–207. [Google Scholar] [CrossRef] [Green Version]
  44. Benis, L.; Vicente, R.; Ferrão, P.; Fernández, J.E. Rooftop Greenhouses: LCA and Energy Simulation. In Proceedings of the CISBAT 2015 International Conference “Future Buildings and Districts—Sustainability from Nano to Urban Scale”, Lausanne, Switzerland, 9–11 September 2015. [Google Scholar]
  45. Perez Neira, D.; Soler Montiel, M.; Delgado Cabeza, M.; Reigada, A. Energy use and carbon footprint of the tomato production in heated multi-tunnel greenhouses in Almeria within an exporting agri-food system context. Sci. Total Environ. 2018, 628, 1627–1636. [Google Scholar] [CrossRef]
  46. Koroneos, C.J.; Nanaki, E.A. Environmental impact assessment of a ground source heat pump system in Greece. Geothermics 2017, 65, 1–9. [Google Scholar] [CrossRef]
  47. Saner, D.; Juraske, R.; Kübert, M.; Blum, P.; Hellweg, S.; Bayer, P. Is it only CO2 that matters? A life cycle perspective on shallow geothermal systems. Renew. Sustain. Energy Rev. 2010, 14, 1798–1813. [Google Scholar] [CrossRef]
  48. Carvalho, A. High Efficiency Ground Source Heat Pump Systems for Sustainable Building Space Conditioning. Ph.D. Thesis, Combria University, Coimbra, Portugal, 2015. [Google Scholar]
  49. Blum, P.; Campillo, G.; Münch, W.; Kölbel, T. CO2 savings of ground source heat pump systems—A regional analysis. Renew. Energy 2010, 35, 122–127. [Google Scholar] [CrossRef]
  50. Bayer, P.; Saner, D.; Bolay, S.; Rybach, L.; Blum, P. Greenhouse gas emission savings of ground source heat pump systems in Europe: A review. Renew. Sustain. Energy Rev. 2012, 16, 1256–1267. [Google Scholar] [CrossRef]
  51. Canaj, K.; Mehmeti, A.; Cantore, V.; Todorovic, M. LCA of tomato greenhouse production using spatially differentiated life cycle impact assessment indicators: An Albanian case study. Environ. Sci. Pollut. Res. Int. 2020, 27, 6960–6970. [Google Scholar] [CrossRef]
  52. Salehpour, T.; Khanali, M.; Rajabipour, A. Environmental impact assessment for ornamental plant greenhouse: Life cycle assessment approach for primrose production. Environ. Pollut. 2020, 266, 115258. [Google Scholar] [CrossRef]
  53. Zarei, M.J.; Kazemi, N.; Marzban, A. Life cycle environmental impacts of cucumber and tomato production in open-field and greenhouse. J. Saudi Soc. Agric. Sci. 2019, 18, 249–255. [Google Scholar] [CrossRef]
  54. Lee, S.Y.; Lee, I.B.; Lee, S.N.; Kim, R.W.; Yeo, U.K.; Kim, J.G.; Decano-Valentin, C.V. Dynamic energy exchange modelling for a plastic-coverded multi-span greenhouse utilizing a thermal effluent from power plant. Agrononomy. on review.
  55. Pombo, O.; Allacker, K.; Rivela, B.; Neila, J. Sustainability assessment of energy saving measures: A multi-criteria approach for residential buildings retrofitting—A case study of the Spanish housing stock. Energy Build. 2016, 116, 384–394. [Google Scholar] [CrossRef] [Green Version]
  56. Cecconet, D.; Raček, J.; Callegari, A.; Hlavínek, P. Energy Recovery from Wastewater: A Study on Heating and Cooling of a Multipurpose Building with Sewage-Reclaimed Heat Energy. Sustainability 2019, 12, 116. [Google Scholar] [CrossRef] [Green Version]
  57. Kumar, A.; Sharma, M.P.; Yang, T. Estimation of carbon stock for greenhouse gas emissions from hydropower reservoirs. Stoch. Environ. Res. Risk Assess. 2018, 32, 3183–3193. [Google Scholar] [CrossRef]
  58. Jan, P.; Dux, D.; Lips, M.; Alig, M.; Dumondel, M. On the link between economic and environmental performance of Swiss dairy farms of the alpine area. Int. J. Life Cycle Assess. 2012, 17, 706–719. [Google Scholar] [CrossRef] [Green Version]
  59. Greening, B.; Azapagic, A. Domestic heat pumps: Life cycle environmental impacts and potential implications for the UK. Energy 2012, 39, 205–217. [Google Scholar] [CrossRef]
Figure 1. Research flow for integrated BES–LCA approach for environmental assessment of greenhouse heating system.
Agronomy 11 01230 g001
Figure 2. (a) Description of the greenhouse floor plan; (b) front view of structural characteristics of the target greenhouse, (Reprinted with permission from ref. [1]).
Agronomy 11 01230 g002
Figure 3. Equipment for heat distribution inside the greenhouse (a) main air duct, (b) sub air duct near crop surface, (c) circulation fan and (d) heat pump unit.
Agronomy 11 01230 g003
Figure 4. Design of BES model for calculating the energy loads of the greenhouse (adapted from [54]).
Agronomy 11 01230 g004
Figure 5. (a) Detailed LCIA result and (b) distribution of environmental category based on system components.
Agronomy 11 01230 g005
Figure 6. Impact distribution for greenhouse building (a) AP, (b) GWP and (c) EP.
Agronomy 11 01230 g006
Table 1. Annual energy loads of the experimental greenhouse [54].
YearAnnualTotal Load
Heating (MJ)(kWh)
2009~2010838,243.37315,960.47
2010~2011825,247.94312,197.47
2011~2012802,653.62297,472.02
2012~2013901,318.95332,306.58
2013~2014786,186.39306,118.99
2014~2015813,409.80297,472.27
2015~2016782,307.87290,323.42
2016~2017793,454.47300,480.89
2017~2018813,209.88300,179.06
2018~2019755,980.29322,996.59
Average811,201.26307,550.78
Table 2. Total environmental impact of three scenario cases.
AP
(kg SO2-eq)
GWP
(kg CO2-eq)
EP
(kg PO4-eq)
Case 14.96 × 10−22.79 × 1011.47 × 10−2
Case 28.12 × 10−24.15 × 1011.77 × 10−2
Case 31.16 × 1001.14 × 102 1.63 × 10⁻¹
Table 3. Detailed impact environmental assessment results in the three scenario cases.
ImpactDescriptionCase 1Case 2Case 3
Acidification Potential
(kg SO2-eq)
Energy2.28 × 10−2 5.40 × 10⁻² 1.11 × 10−0
Greenhouse building2.03 × 10−2 2.02 × 10⁻² 2.02 × 10⁻²
Mango production4.12 × 10−3 4.11 × 10⁻³ 1.63 × 10⁻²
Heat pump/Boiler production2.43 × 10−3 2.81 × 10⁻³ 4.11 × 10⁻³
Global Warming Potential
(kg CO2-eq)
Energy2.42 × 101 3.75 × 101 1.08 × 10²
Greenhouse building3.07 × 100 3.06 × 100 3.06 × 100
Mango production4.29 × 10−1 4.28 × 10⁻¹ 1.33 × 100
Heat pump/Boiler production2.46 × 10−1 3.68 × 10⁻¹ 4.28 × 10⁻¹
Eutrophication Potential
(kg PO4-eq)
Energy5.97 × 10−3 7.16 × 10⁻³ 1.45 × 10⁻¹
Greenhouse building4.71 × 10−3 5.96 × 10⁻³ 7.99 × 10⁻³
Mango production3.15 × 10−3 3.14 × 10⁻³ 5.96 × 10⁻³
Heat pump/Boiler production8.81 × 10−4 1.35 × 10⁻³ 3.14 × 10⁻³
Publisher’s Note: MDPI stays neutral with regard to jurisdictional claims in published maps and institutional affiliations.

