Article

The Impact of Herbage Mass on Perennial Ryegrass Swards in Autumn on Autumn and over Winter Production and Characteristics

1
Teagasc, Animal & Grassland Research and Innovation Centre, Moorepark, Fermoy, P61 C996 Cork, Ireland
2
School of Biological, Earth and Environmental Sciences and Environmental Research Institute, University College Cork, Distillery Fields, North Mall, P61 P302 Cork, Ireland
*
Author to whom correspondence should be addressed.
Agronomy 2021, 11(6), 1140; https://doi.org/10.3390/agronomy11061140
Submission received: 23 April 2021 / Revised: 27 May 2021 / Accepted: 28 May 2021 / Published: 3 June 2021
(This article belongs to the Special Issue Grazing Effects on the Nutritive Value in Grassland Ecosystems)

Abstract

:
Accumulating herbage mass to facilitate the extension of the grazing season in autumn is commonly practised. The objective of the current study was to investigate the effect of accumulating varying target herbage masses (THM) in autumn and imposing different defoliation dates (DD), on herbage mass, sward quality and water-soluble carbohydrates in autumn and the subsequent spring. A 4 × 3 factorial split plot design was assigned with four THM (Low ≈ 500 kg·DM·ha−1, Medium ≈ 1500 kg·DM·ha−1, High ≈ 2000 kg·DM·ha−1 and Very high ≈ 3000 kg·DM·ha−1) and three DD (DD1—15 October, DD2—7 November and DD3—21 November), across two years. Measurements were carried out at each DD and in spring. Differences in sward quality were found between each THM on different DD. Sward quality reduced from DD2 to DD3 in the high THM (−13 g·kg−1 DM CP, p < 0.001). The very high THM had the lowest sward quality from DD1 (206 g·kg−1 DM CP, p < 0.001 and 787 g·kg−1 DM DMD, p < 0.05). This study has identified the defoliation date of THM in autumn as key to improving autumn management strategies for increased utilisation and sward quality.

1. Introduction

Temperate oceanic climatic zones have the potential to support a competitive and sustainable pasture-based production system [1]. Perennial ryegrass (Lolium perenne L.; PRG) is the central species in temperate pasture-based systems [2], as it can produce large quantities of high-quality herbage [3] and can persist under intensive grazing [4]. To improve environmental [5] and economic [6,7] sustainability within a pasture-based system, the production and utilisation of grazed grass must be maximised. Grazed grass has been identified as the cheapest feed source available within ruminant production systems [8], and as such, increasing the proportion of grazed grass in the diet of animals [9] is a key objective of pasture-based dairy production systems. The efficient utilisation of swards was defined as the proportion of green leaf tissue that is removed by grazing animals before entering the senescent state [10].
Extending the autumn grazing season has been recognised as one of the key objectives for reducing agricultural greenhouse gas emissions in the Marginal Abatement Cost Curve for Irish agriculture [11] as it has been positively correlated with the reduced carbon footprint of milk [12] and increased on-farm profitability [7]. A 300-day grazing season length has been identified as a key strategy in improving utilisation in temperate climates [13]; however, in Ireland, the current average length of the grazing season in Ireland is only 223 days [14,15]. It has previously been reported in animal studies that maintaining grazed grass in the diet of animals in late autumn can help to maintain or increase milk protein output [16,17] and reduce costs due to the lower supplementation requirement [14]. Specific grazing management targets are required in autumn to achieve an extension in the grazing season, as growth rates decline during this period [18] Typically, the grazing rotation length is extended to allow for large quantities of herbage to be built up from August, prior to the decline of grass growth, to facilitate the extension of the grazing season for the final rotation (approximately 15 October–21 November) [17,18,19].
Increasing the level of herbage mass in swards at any point during the vegetative phase can have negative implications on the PRG plant. Herbage mass continues to accumulate when temperatures are low, albeit at a slower rate, and continues to increase yield until swards have reached a ceiling yield [20]. The ceiling yield is when no further increase of herbage occurs, as green leaf production is matched or surpassed by leaf senescence, and the high herbage mass results in limited light entering to the base of the sward [21]. It was reported that swards with high herbage masses did not increase herbage mass from early November, as they had reached ceiling yield [22]. The longer a sward remains undefoliated for, once ceiling yield is reached, the more senescence progresses [23], particularly if there are relatively high temperatures (>5 °C) over winter [18] and if the sward is post-vernalisation [20,24]. Previous studies investigating the impact of carrying high herbage masses over winter reported that the level of senescent material in the sward increases resulting in a lower sward quality in spring [25,26]. High herbage masses (>2000 kg·DM·ha−1) can result in shading at the base of the sward, which can reduce tiller production and hinder tiller establishment and survival [27]. Reduced tiller production can impact herbage production by decreasing the number of growing points in the sward [28]. However, to date, there has been little research on the impact of different lengths of defoliation interval, over the autumn period, on varying herbage masses.
It has widely been acknowledged that the autumn closing date is one of the main controllable factors contributing to the accumulation of herbage over the winter months [18,26]. Earlier closing of swards in autumn results in greater herbage mass available the following spring [18,22,26,29]. However, the research has been limited on the management prior to defoliation in autumn, identifying the optimal herbage masses to defoliate at different stages of the final rotation could be beneficial to improved autumn grazing management, as has previously been identified for mid-season management [19]. It is important that autumn grazing management practices to facilitate the extension of the grazing season should not compromise herbage availability the following spring. Previous research has been limited mainly to the autumn closing date, and further research is warranted on the management practices recommended to achieve the extension of the grazing season in autumn and how they influence PRG swards both in the autumn, over winter and into the spring. The current gaps in research on extending the grazing season in autumn, by accumulating high levels of herbage mass, warrant further investigating on the impacts on sward production and finding the optimal dates for defoliation of different herbage masses to improve decision making on-farm to allow for efficient utilisation of swards and the extension of the grazing season without compromising over winter herbage production.
The objective of this study was to investigate the effect of accumulating herbage mass in autumn and imposing different defoliation dates in the final grazing rotation to determine the impact on herbage mass, sward quality and water soluble carbohydrates (WSC) in the stubble in autumn and the subsequent carryover to spring.

2. Materials and Methods

2.1. Experimental Site

A plot trial was conducted at the Teagasc, Animal and Grassland Research and Innovation Centre, Moorepark, Fermoy, Ireland (Latitude 50°07′ N, Longitude 08°16′ W) from 15 October 2018 to 1 April 2019 (Year 1) and 15 October 2019 to 1 April 2020 (Year 2). The soil type was a free-draining acid brown earth of sandy to loam texture. Soils had a pH of 6.4, phosphorus (P) Index of 4 (8.5 mg/L) and potassium (K) Index of 3 (125 mg/L) (±0.8; scale 1 to 4; 1 = deficient, 4 = no response to application of nutrient) [30]. The experimental site was of south-facing aspect and located approximately 40 m above sea level. Swards were made up of PRG (>90%) predominantly, with the remaining 10% made of mainly annual weed grass (Poa annua L.) and broadleaved plants. Meteorological data were recorded at the experimental site over the experimental period (October to April). Average daily air temperature (°C), soil temperature to a depth of 100 mm (°C), total monthly rainfall (mm), and average solar radiation are shown for the measurement periods in each experimental year (Table 1).

2.2. Experimental Design

The experimental design was a 4 × 3 factorial split plot design with 4 replicates, resulting in a total of 48 plots of 1.5 m × 6 m. Four target herbage masses (THM; Low ≈ 500 kg·DM·ha−1, Medium ≈ 1500 kg·DM·ha−1, High ≈ 2000 kg·DM·ha−1 and Very high ≈ 3000 kg·DM·ha−1) were targeted to be achieved by 15 October; these were achieved through different defoliation strategies from early August. The 3 defoliation dates (DD; DD1—15 October, DD2—7 November and DD3—21 November) were chosen to reflect Irish autumn grazing management practices [19] and examined on each of the 4 THM. Measurements were carried out on each autumn DD1, DD2 and DD3 and on all plots in spring for the 1st defoliation (21 February), and on the 2nd defoliation in spring (1 April), where only herbage mass (kg·DM·ha−1; >3.5 cm) was measured. Outside of the experimental period, plots were defoliated using an Etesia mower (Etesia UK Ltd., Warwick, UK) to a residual of 4 cm when they reached a pre-grazing herbage mass of 1500 kg·DM·ha−1 between April and July. In August, plot defoliation interval was tailored to allow each THM to be achieved by 15 October. In year 1 and year 2 over the experimental period, nitrogen (N) was applied in early August at a rate of 35 kg·N·ha−1 in the form of calcium ammonium nitrate (CAN; 27% N). Phosphorus and potassium were applied in February as 30 kg·ha−1 of 0-7-30 fertiliser (5.67 kg·ha−1 P; 24.33 kg·ha−1 K). At the end of January, N was applied at a rate of 28 kg·N·ha−1 in the form of urea (46% N). For the remainder of the year, N was applied, post-defoliation, as 20 kg·N·ha−1 as CAN, with a total of 200 kg·N·ha−1 applied each year.

2.3. Sward Measurements

2.3.1. Sward Height

A total of 10 sward height measurements were recorded in each plot pre- and post-defoliation using a Grasshopper (Grasshopper, True North Technologies, Shannon, Co. Clare, Ireland) [31].

2.3.2. Herbage Mass

The entire plot was harvested using the Etesia mower (Etesia UK Ltd., Warwick, UK) >3.5 cm (targeted residual). The mown herbage from the plot was collected and weighed. A sample of approximately 300 g was collected from each cut strip. A subsample of 100 g was weighed and dried for 16 h at 60 °C to determine dry matter (DM) content and milled through a 1 mm sieve and stored for analysis.

2.3.3. Tiller Density

Two turves (0.1 m × 0.1 m) were cut to a depth of 0.05 m and removed from each sward in February (1st defoliation). Turves were removed randomly within the plot to take into account the heterogeneity of the swards [32]. The grass tillers in each turf were separated into PRG and other grass species (mainly meadow grass, Poa annua L.) and counted. From these turves, an overall average tiller density per m2 was calculated.

2.4. Chemical Analysis

2.4.1. Herbage Quality Analysis

The milled samples were analysed for dry-matter digestibility (DMD) and crude protein (CP) concentration using the near-infrared spectrometry machine (NIRS, Model 6500, FOSS-NIR System, 3400 Hillerød, Denmark) and the equation derived [33].

2.4.2. Water Soluble Carbohydrates

Water soluble carbohydrates in the stubble were measured on all plots prior to their respective defoliation dates in autumn and on the first defoliation in spring. A total of 45 mature tillers with no visible daughter tiller were cut to ground level, using a scalpel, from each plot within 3 h of sunrise (approximately 7 am for the experimental period), in order to avoid any diurnal changes that occur from sunrise to mid-afternoon. Tillers were washed to remove excess soil and each tiller was cut from ground level to 3.5 cm (targeted post-grazing residual stubble). The stubble (<3.5 cm) was weighed and dried at 60 °C in a pre-heated oven for 48 h and the dried samples were weighed to determine DM content and milled using a 1 mm sieve. Samples were stored in a dry, dark location until analysis.
Water soluble carbohydrates (mg·g−1 Dry Weight (DW)) present in 45 tillers from each treatment were determined using the anthrone method [34]. Soluble carbohydrates were extracted from samples by adding 9.9 mL of cold water to 0.1 g of dried and milled herbage. The samples were then shaken mechanically for 1 h and filtered. Samples were prepared for the auto analyser by diluting the filtrate to 1 in 10 using a pre-set Hamilton diluter. The auto analyser was prepared by pumping water through for 20 min, then 76% sulphuric acid for 10 min and finally anthrone reagent for 15 min. Once the bubble pattern and baseline reading (<5%) were satisfactory, prepared samples were placed into the auto analyser and heated with anthrone in sulphuric acid under standard conditions in an auto analyser, forming a blue complex. This complex was then used to determine the concentration of carbohydrates spectrophotometrically at 630 nm.

2.5. Statistical Analysis

Statistical analyses were carried out using SAS 9.4 (SAS Institute Inc., Cary, NC, USA, 2002). The effect of THM and DD on sward height, herbage mass, herbage quality (DMD and CP), tiller density and WSC (>3.5 cm) was determined using the PROC MIXED procedure in SAS, with DD, and THM used in the model. Plot was the experimental unit, with year the random factor and measurement date (MD) was the repeated measure. Data were presented as least square means ± standard error. Variables were analysed using the following model:
Y j k l = μ + t a r g e t   h e r b a g e   m a s s j + d e f o l i a t i o n   d a t e k + y e a r l +
( t a r g e t   h e r b a g e   m a s s j × d e f o l i a t i o n   d a t e k ) + ( y e a r l × t a r g e t   h e r b a g e   m a s s j ) + ( y e a r l × d e f o l i a t i o n   d a t e k ) × e j k l m
where:
  • µ = mean value for the variable
  • ejkl = residual error term
  • Yjkl = herbage yield (kg·DM·ha−1), sward height (cm), DMD (g·kg·DM−1) and CP (g·kg·DM −1), tiller density (m2) and WSC (>3.5 cm; mg·g−1 DW)

3. Results

3.1. Autumn Period

3.1.1. Herbage Mass

There was a significant (p < 0.001) interaction between DD and year on herbage mass. In year 1, DD2 and DD3 (2366 ± 108.1 kg·DM·ha−1) had a greater herbage mass than DD2 (1800 ± 108.6 kg·DM·ha−1) and DD3 (1547 ± 108.6 kg·DM·ha−1) in year 2. In year 1 (1601 ± 108.6 kg·DM·ha−1) and year 2 (1554 ± 108.6 kg·DM·ha−1), DD1 did not have a significantly different herbage mass. The very high THM treatment resulted in a greater herbage mass (p < 0.001) than all other THM (Table 2). The medium and high THM treatments both resulted in greater herbage mass than the low THM. Defoliating swards earlier (DD1) in the autumn resulted in a significantly (p < 0.001) lower herbage mass compared to DD2 and DD3. Herbage mass was significantly (p < 0.001) greater in year 1 (2172 ± 62.7 kg·DM·ha−1) compared to year 2 (1634 ± 62.7 kg·DM·ha−1).

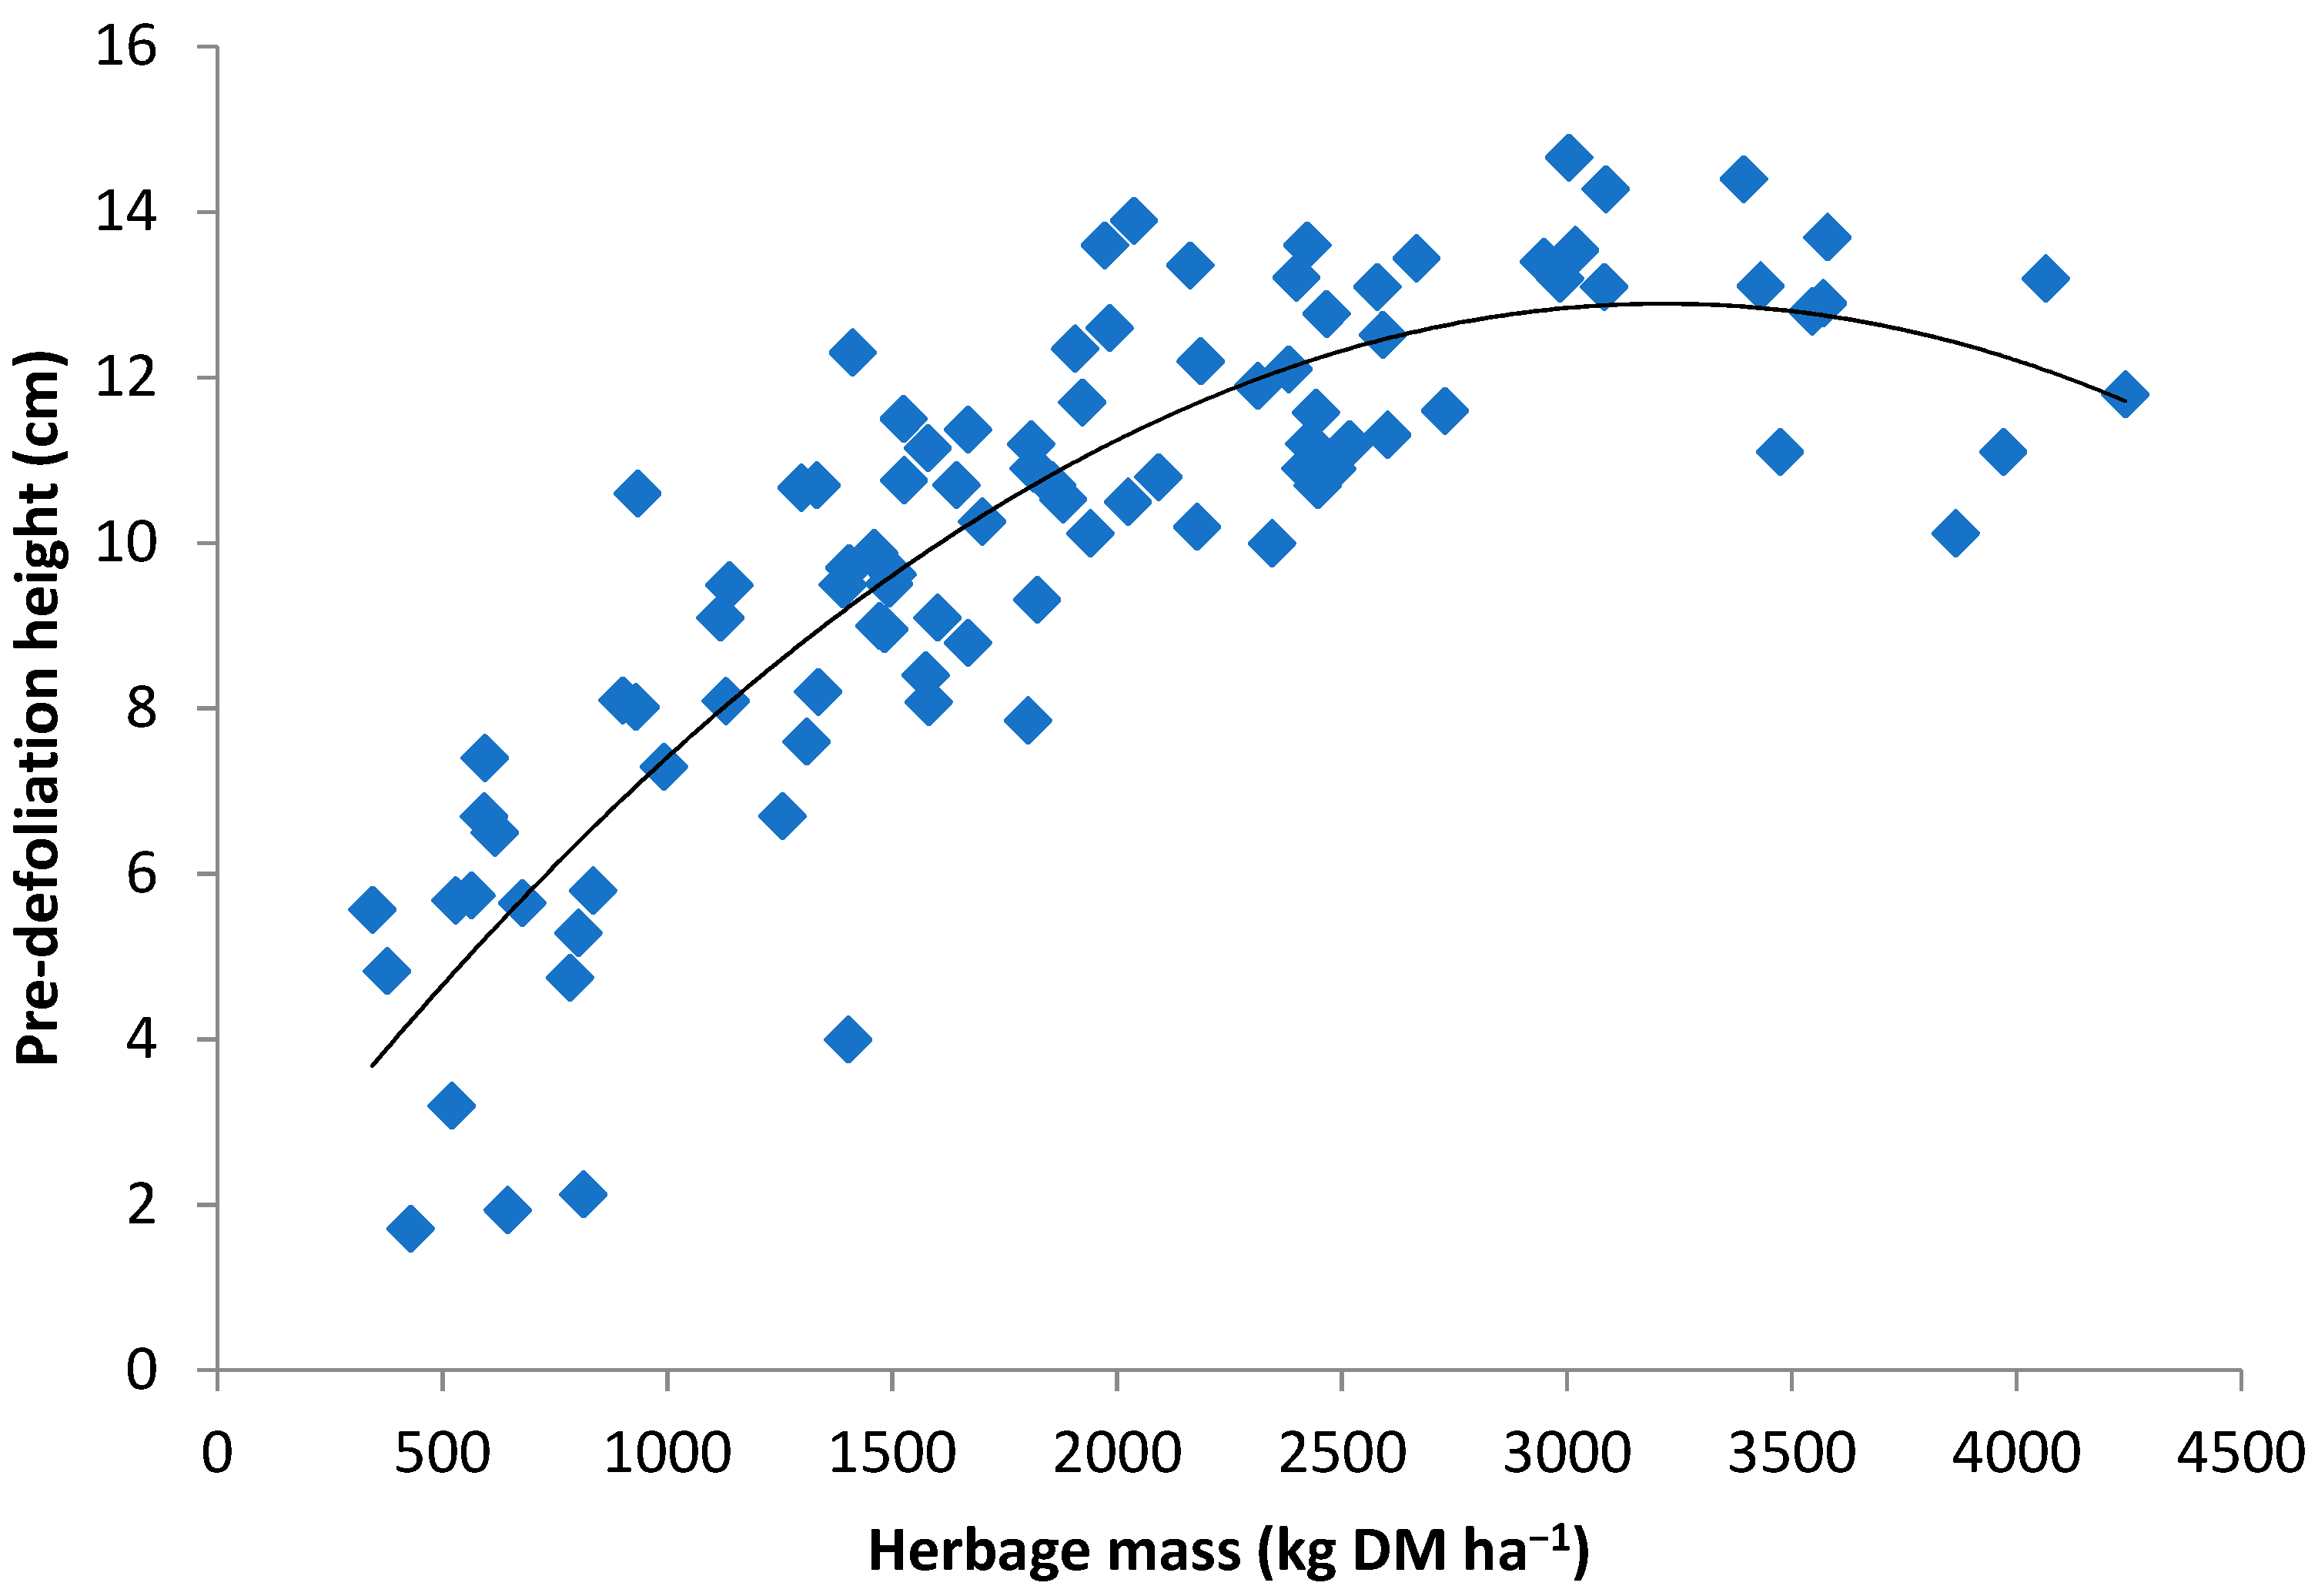
3.1.2. Pre-Defoliation Height

There was a significant (p < 0.001) effect of THM and DD on pre-defoliation height in autumn (Table 2); defoliating earlier (DD1) in the low and medium THM had a lower pre-defoliation height than defoliating later (DD2 and DD3). There was a significant (p < 0.001) effect of THM and year on pre-defoliation height; the low and medium THM were greater in year 1 (8.5 and 10.3 ± 0.26 cm, respectively) compared to year 2 (4.4 and 8.5 ± 0.26 cm, respectively). The very high THM had the greatest pre-defoliation height, followed by the high, then medium and the low THM had the lowest pre-defoliation height (p < 0.001; Table 2). Earlier (DD1) defoliation in the autumn had a significantly (p < 0.001) lower pre-defoliation height than DD2 and DD3 (Table 2). Year 1 (10.9 ± 0.13 cm) had a significantly (p < 0.001) greater pre-defoliation height than year 2 (9.1 ± 0.13 cm). There was a correlation of R2 = 0.71 between pre defoliation height and herbage mass in autumn (Figure 1). As herbage mass increased pre defoliation height increased until herbage mass surpassed 2000 kg·DM·ha−1, when pre defoliation height no longer increases in line with herbage mass.

3.1.3. Sward Quality

Crude Protein

There was a significant (p < 0.001) effect of THM and DD on sward CP concentration (Table 3). When the low, medium and high THM, were defoliated earlier (DD1) in the autumn they had a higher CP concentration compared to later (DD2 and DD3). The very high THM CP concentration increased when defoliated later (DD 2 and DD3) compared to early (DD1) rotation. The low THM had the greatest CP concentration, followed by the medium and high THM, with the very high THM the lowest (p < 0.001; Table 3). Defoliating earlier (DD1) in the autumn resulted in a significantly (p < 0.01) higher CP concentration than later (DD2 and DD3; Table 3). In year 2 CP concentration (225 ± 2.1 g·kg−1 DM) was significantly (p < 0.01) greater than in year 1 (214 ± 2.1 g·kg−1 DM).

Dry Matter Digestibility

The very high THM led to a significantly (p < 0.05) lower DMD concentration than the low and medium THM, with the high THM intermediate (Table 3). There was no significant (p > 0.05) effect of DD (798 ± 3.4 g·kg−1 DM; Table 3) or year (801 ± 3.4 g·kg−1 DM) on DMD concentration.

3.1.4. Water Soluble Carbohydrates in the Stubble

There was a significant (p < 0.05) effect of THM and DD on WSC. The low THM had a lower WSC in DD1 compared to all other DDs and THM (Table 4). There was a significant (p < 0.001) effect of DD and year on WSC concentration in autumn; year 2 had a greater WSC compared to year 1 when defoliated in DD2 (37.8 and 29.6 ± 0.92 mg·g−1 DW) compared to DD3 (44.5 and 29.9 ± 0.92 mg·g−1 DW). The high THM had a significantly (p < 0.01) greater WSC concentration than the low, with the medium and very high THM intermediate to both (Table 4). Defoliating swards earlier (DD1) in the autumn resulted in a significantly (p < 0.01) greater WSC concentration than later defoliation (DD2 and DD3; Table 4). Year 2 (38.3 ± 0.76 mg·g−1 DW) had a significantly (p < 0.001) greater WSC than year 1 (269 ± 7.6 mg·g−1 DW).

3.2. 1st Defoliation of Spring Period (21 February)

3.2.1. Herbage Mass

There was no effect (p > 0.05) of autumn THM on spring herbage mass (769 ± 27.5 kg·DM·ha−1). Defoliating earlier (DD1) in autumn resulted in a significantly (p < 0.001) greater herbage mass in spring than later defoliations (DD2 and DD3; Table 5). Spring herbage mass was significantly (p < 0.001) greater in year 1 (993 ± 19.5 kg·DM·ha−1) than year 2 (541 ± 19.5 kg·DM·ha−1).

3.2.2. Pre-Defoliation Height

There was a significant (p < 0.05) effect of autumn THM and DD on pre-defoliation height in spring; the medium, high and very high THM had a greater pre-defoliation height in spring when defoliated earlier (DD1; 7.4, 7.7 and 7.6 ± 0.22 cm, respectively) in the autumn than later defoliations (DD2; 6.9, 6.0 and 6.1 ± 0.22 cm, respectively) and (DD3; 5.8, 5.7 and 5.8 ± 0.22 cm, respectively), with the low THM similar in all DD (6.2 ± 0.22 cm). There was no significant (p > 0.05) effect of autumn THM on pre-defoliation height in spring (6.3 ± 0.12 cm). Defoliating earlier in autumn (DD1) led to a significantly (p < 0.001) greater pre-defoliation height in spring compared to the later defoliation (DD2 and DD3; Table 5). Pre-defoliation height in spring was significantly (p < 0.001) greater in year 1 (7.7 ± 0.09 cm) compared to year 2 (5.0 ± 0.09 cm).

3.2.3. Sward Quality

Crude Protein

There was no effect (p > 0.05) of autumn THM on sward CP concentration in spring (255 ± 1.1 g·kg−1 DM). Defoliating swards earlier (DD1) in the autumn resulted in a significantly (p < 0.001) lower CP concentration in spring, followed by DD2 and the greatest CP concentration on DD3 (Table 5). Sward CP concentration in spring was significantly (p < 0.001) greater in year 2 (261 ± 0.8 g·kg−1 DM) compared to year 1 (250 ± 0.8 g·kg−1 DM).

Dry Matter Digestibility

The low and high autumn THM had a significantly (p < 0.05) lower spring DMD concentration (807 ± 1.2 g·kg−1 DM) than the medium and very high THM (811 ± 1.2 g·kg−1 DM). Defoliating swards earlier in the autumn (DD1) resulted in a significantly (p < 0.05) lower DMD concentration in spring than defoliation later (DD3) in autumn (Table 5). There was no effect (p > 0.05) of year on spring DMD concentration (809 ± 0.8 g·kg−1 DM).

3.2.4. Water Soluble Carbohydrate in the Stubble

There was no effect (p > 0.05) of THM, DD or year on WSC concentration in spring (average 24.5 ± 0.50 mg·g−1 DW; Table 5).

3.2.5. Spring Tiller Density

There was no significant (p > 0.05) effect of THM (3324 ± 285.8 tillers·m−2), DD (3325 ± 202.1 tillers·m−2) on spring tiller density (Table 5).

3.3. 2nd Rotation in Spring

Herbage Mass

There was no significant (p > 0.05) effect of autumn DD and THM on herbage mass in the 2nd rotation in spring (1629 ± 24.4 kg·DM·ha−1). Year 1 (1765 ± 18.5 kg·DM·ha−1) had a significantly (p < 0.001) greater herbage mass compared to year 2 (1494 ± 18.5 kg·DM·ha−1) for the 2nd defoliation in spring.

4. Discussion

The current study investigated the advantages and disadvantages of defoliating varying herbage masses across different autumn defoliation dates between mid-October and the end of November. Results from the current study highlighted that herbage masses should be accumulated prior to 15 October, to allow for a longer grazing season, as growth rates hereafter are significantly reduced (+ 23 kg·DM·ha−1·day−1, DD1–DD3), caused by a decline in temperatures [35] and reduced solar radiation [36]. In the current study, swards with herbage masses >2100 kg·DM·ha−1 did not continue to accumulate herbage from early November (DD2) to late November (DD3), with a decline in herbage mass by 11 kg·DM·ha−1·day−1 until late November. This can be accounted for in that these herbage masses reached a ceiling yield [37], and the rates of leaf senescence surpassed the green leaf appearance [18]. Additionally, as herbage mass surpasses 2000 kg·DM·ha−1, the pre-defoliation height (cm) begins to decline (Figure 1), indicating that these swards had reached a ceiling yield [29]. In this study, the loss of herbage did not occur until early November (DD2) and could be a result of greater growth rates between mid-October and early November over the two years. A previous study [18] reported a similar loss of herbage in swards compared to the current study, however, they reported those losses in swards with a greater herbage mass (>2500 kg·DM·ha−1) prior to November. Leaf extension and leaf appearance are continuously occurring and accumulating herbage, even in swards with high herbage masses [20,38]. In the current study, leaf extension could have been greater or matched the leaf senescence rates resulting in a continued accumulation of herbage mass in the swards.
Selecting a time point at which to defoliate a specific herbage mass in autumn has not previously been defined in grazing management recommendations [19]. Using the results of the current study, the optimal time for the defoliation of low, medium, high and very high THM in autumn rotation are reported based upon herbage mass, WSC and sward quality. Swards with a low THM (500–1000 kg·DM·ha−1) continue to accumulate herbage mass from into late November (DD2–DD3; +9 kg·DM·ha−1·day−1) and achieved herbage masses of approximately 1088 kg·DM·ha−1 by the end of November (DD3), a 67% increase in herbage mass from October (DD1). This is probably a result of continuous leaf appearance and extension of swards in response to temperatures above 5 °C [35]. However, leaf appearance occurs at a slower rate between October and November (average 25 days) [35]. The number of days of growth between DD1 and DD2 (approximately 37 days) indicates that the plants would not have reached the three-leaf stage at the time of defoliation. As a result, the plant material would not have begun senescing, as new green leaf material would be continuously appearing [35]. This continued growth seen throughout the final rotation in low THM can allow for later defoliation in autumn, which can help accommodate an extension of the grazing season. In the medium THM average growth rates between mid-October and early November were greater (DD1–DD2; +42 kg·DM·ha−1·day−1) than the average growth rates overall in the experimental period (+23 kg·DM·ha−1·day−1). The medium THM possibly had a greater leaf extension rate and a low level of leaf senescence [37,38]. This allows some flexibility with defoliation in autumn. However, the medium THM swards reached their ceiling yield (>2000 kg·DM·ha−1) from the beginning of November (DD2), and from then approximately 18 kg·DM·ha−1·day−1 was lost as senescent material [18] by DD3. Higher herbage masses tend to have increased leaf senescence [37,38] and, as a result, have a greater proportion of dead material below the grazing horizon [22] leading to lower herbage accumulation [20,35]. This was reported in the high and very high herbage masses within the current study; the high and very herbage masses had reduced growth rates (+22 and +14 kg·DM·ha−1·day−1, respectively) between mid October and early November (DD1 and DD2) compared to the low and medium and began to lose herbage from early November to late November (DD2 and DD3; −18.2 and −11 kg·DM·ha−1·day−1, respectively). As a result, swards with very high THM should be grazed earlier in autumn to avoid any significant losses in herbage mass on these swards.
Overall the WSC in the stubble was an average of 34.1 ± 3.69 mg·g−1 DW across all THM and DD. However, a significantly lower WSC (27.6 mg·g−1 DW) was reported in the low herbage mass (650 kg·DM·ha−1) when they were defoliated in October (DD1); these swards had not reached the ‘three-leaf stage’ and defoliating at this stage could potentially have impacted the regrowth potential [39]. Positively, the current study showed if defoliation of a sward with a low herbage mass did happen in mid-October (DD1), the regrowth potential for the following spring was not impacted, as long as there was a long regrowth interval (minimum 92 days in this experiment) to recover. This could be a result of the high WSC levels experienced over winter compared to the rest of the grazing season [40] and the long regrowth interval length between autumn and spring defoliations, which allowed swards to accumulate WSC [39]. Similar to the experiment by Fulkerson and Donaghy (2001), the WSC increased as herbage mass increased until the end of November (DD3).
The quality of the grazing sward, when facilitating the extension of the grazing season in autumn, needs to meet the majority of the energy requirements of the late lactation dairy cow [41]. Grazed grass is of superior nutritional quality when compared to grass silage (696 g·kg−1 DMD) [9], and as a result, will lead to an improvement in animal performance [17] In the current study, the low and medium THM swards maintained a high sward quality (805 g·kg−1 DMD), across all DD, due to the presence of green material [42]. The medium herbage mass swards maintained sward quality (DMD and CP), from DD2 to DD3, which can allow for grazing later in November. High and very high THM continued to accumulate herbage from DD1 to DD2 (+23 kg·DM·ha−1 day−1; +13 kg·DM·ha−1·day−1), however, herbage mass reduced from DD2 to DD3 (−18.2 kg·DM·ha−1·day−1; −11.4 kg·DM·ha−1·day−1) and this reduction was probably due to a reduction in green leaf material [25]. These high and very high THM can have an increased level of senescent material leading to reduced quality [43]. This was shown in the study where very high herbage mass swards had the lowest sward quality (CP 206 g·kg−1·DM; DMD 787 g·kg−1·DM) from the middle of October. Sward quality of the high herbage mass swards began to reduce from the beginning of November (CP—13 g·kg−1·DM; DMD—9 g·kg−1·DM). Because of this, high and very high herbage masses should be defoliated by early November (DD1 and DD2) to maintain a greater quality of feed for grazing animals. However, despite the lower sward quality in the high and very high THM, the quality of feed was still far superior to that of grass silage (696 g·kg−1·DM) [9], and as such is still beneficial in the diet of late lactation animals [17].
There was a greater herbage mass in year 1 (+538 kg·DM·ha−1) of the current study, despite the fact that soil and air temperatures experienced were similar between both years (Table 1). This could be accounted for compensatory growth experienced after an extended period of drought in the summer of 2018 [44], prior to the experimental period [45,46]. A previous experiment [45] reported 60% higher compensatory growth rates in swards that had experienced drought stress (24 kg·DM·ha and 15 kg·DM·ha−1, respectively). In the current experiment the compensatory growth rates were 38% greater after the drought in year 1 (+16 kg·DM·ha−1·day−1; Year 1—58 kg·DM·ha−1; Year 2—42 kg·DM·ha−1) after the period of drought.
Target herbage masses in autumn did not affect the growth rates of swards over winter or spring grass availability, despite the lower WSC concentration on the medium and low THM swards. This is extremely beneficial in terms of autumn grazing management practices as it allows for the accumulating of herbage masses to facilitate the extension of the grazing season with no negative implications on over winter growth or spring grass availability. Autumn DD, however, had a much greater impact on over winter growth rate and spring grass availability, similar to other experiments [18,22,26,29]. Spring grass availability reduced by 24% between DD1 and DD2 and 6% between DD2 and DD3. This has a much greater impact on spring grass, and, therefore, a greater emphasis should be placed on the closing date of swards in autumn to better match spring grass requirements.
It has previously been reported that closing swards earlier in autumn can have a negative effect on tiller density in spring [18,26]. However, the current study reported no negative effect of autumn management on tiller density in spring. Adequate light entered the base of the sward to maintain tiller production in all swards [27]. This is an important factor for the extension of the grazing season in autumn, as prior to the experiment, multiple factors associated with carrying high herbage masses were identified as inhibitors of over winter regrowth as the potential to impact the sward’s ability to recover after defoliation in autumn to achieve required grass in spring [18,25,26].

5. Conclusions

Accumulating herbage on swards to facilitate the extension of the grazing season in autumn can be carried out successfully, under mowing conditions, without impacting herbage availability and tiller density in spring. However, the date on which swards are defoliated in autumn can have a significant impact on herbage available in spring, with a 24% reduction in swards defoliated in DD2 compared to DD1. In autumn, herbage masses need to be accumulated prior to early October, as growths decline thereafter (+23 kg·DM·ha−1·day−1, average), impacting a swards ability to continue to accumulate herbage. Once a THM is accumulated in autumn, defoliation needs to optimise the swards ability to continue to accumulate herbage and maintain sward quality. In high and very high THM, ceiling yield is reached at the beginning of November, resulting in a decline in sward quality and a loss of herbage mass until defoliated. These should be defoliated by early November to minimise any potential losses in herbage. Swards with a low THM can be defoliated later in autumn, as these swards continue to accumulate herbage to the end of November, while still maintaining a high sward quality. The medium THM reduced in herbage from November but continued to maintain sward quality, and as such these swards can be grazed later in November, while prioritising high and very high THM for grazing earlier in autumn. Results from the current study provide information to improve autumn grazing management guidelines and optimise utilisation of herbage masses accumulated for the extension of the grazing season through a more appropriate defoliation strategy in autumn.

Author Contributions

Conceptualization C.L., A.W. and M.E.; methodology, C.L.; software, C.L.; validation, C.L., A.W. and M.E.; formal analysis, C.L.; investigation, C.L.; data curation, C.L.; writing—original draft preparation, C.L.; writing—review and editing, C.L., A.W. and M.E.; visualization, C.L. and M.E.; supervision, M.E. and A.W.; project administration, M.E.; funding acquisition, M.E. All authors have read and agreed to the published version of the manuscript.

Funding

This experiment was funded by the Irish Dairy Levy Funding administered by Dairy Research Ireland and the Teagasc Walsh Scholarship programme.

Institutional Review Board Statement

Not applicable.

Informed Consent Statement

Not applicable.

Data Availability Statement

Not applicable.

Acknowledgments

The authors wish to thank D. Hennessy and M. O. Donovan for their valuable input on the experiment and M. Liddane, A. McGrath, T. Casey, and P. O. Connor for their technical assistance and all the staff and students of Moorepark research farm for their assistance with measurements during the experiment.

Conflicts of Interest

The authors declare no conflict of interest.

References

  1. Hennessy, D.; Delaby, L.; van den Pol-van Dasselaar, A.; Shalloo, L. Increasing grazing in dairy cow milk production systems in Europe. Sustainability 2020, 12, 2443. [Google Scholar] [CrossRef] [Green Version]
  2. Grogan, D.; Gilliland, T.J. A review of perennial ryegrass variety evaluation in Ireland. Ir. J. Agric. Food Res. 2011, 50, 65–81. [Google Scholar]
  3. Finneran, E.; Crosson, P.; O’kiely, P.; Shalloo, L.; Forristal, P.D.; Wallace, M. Economic modelling of an integrated grazed and conserved perennial ryegrass forage production system. Grass Forage Sci. 2012, 67, 162–176. [Google Scholar] [CrossRef]
  4. Robson, M.J.; Ryle, G.J.A.; Woledge, J. The grass plant—Its form and function. In The Grass Crop; Springer: Dordrecht, The Netherlands, 1988; pp. 25–83. [Google Scholar]
  5. Donnellan, T.; Hanrahan, K.; Lanigan, G. Future Scenarios for Irish Agriculture: Implications for Greenhouse Gas and Ammonia Emissions; Teagasc: Athenry, Ireland, 2018. [Google Scholar]
  6. MacDonald, K.; Glassey, C.; Rawnsley, R. The emergence, development and effectiveness of decision rules for pasture based dairy systems. In Proceedings of the Australasian Dairy Science Symposium: Meeting the Challenges for Pasture-Based Dairying, Christchurch, New Zealand, 31 August–2 September 2010. [Google Scholar]
  7. Hanrahan, L.; McHugh, N.; Hennessy, T.; Moran, B.; Kearney, R.; Wallace, M.; Shalloo, L. Factors associated with profitability in pasture-based systems of milk production. J. Dairy Sci. 2018, 101, 5474–5485. [Google Scholar] [CrossRef] [PubMed] [Green Version]
  8. Finneran, E.; Crosson, P.; O’kiely, P.; Shalloo, L.; Forristal, D.; Wallace, M. Simulation modelling of the cost of producing and utilising feeds for ruminants on Irish farms. J. Farm Manag. 2010, 14, 95–116. [Google Scholar]
  9. Kennedy, E.; O’Donovan, M.; Murphy, J.P.; Delaby, L.; O’Mara, F. Effects of grass pasture and concentrate-based feeding systems for spring-calving dairy cows in early spring on performance during lactation. Grass Forage Sci. 2005, 60, 310–318. [Google Scholar] [CrossRef]
  10. Lemaire, G.; Chapman, D. Tissue flows in grazed plant communities. In The Ecology and Management of Grazing Systems; CAB International: Oxfordshire, UK, 1996. [Google Scholar]
  11. Schulte, R.; Crosson, P.; Donnellan, T.; Farrelly, N.; Finnan, J.; Lalor, S.; O’Mara, F. A marginal abatement cost curve for Irish agriculture. In Teagasc Submission to the National Climate Policy Development Consultation; Teagasc: Carlow, Ireland, 2012. [Google Scholar]
  12. O’Brien, D.; Hennessy, T.; Moran, B.; Shalloo, L. Relating the carbon footprint of milk from Irish dairy farms to economic performance. J. Dairy Sci. 2015, 98, 7394–7407. [Google Scholar] [CrossRef] [PubMed] [Green Version]
  13. O’Donovan, M.; Lewis, E.; O’Kiely, P. Requirements of future grass-based ruminant production systems in Ireland. Ir. J. Agric. Food Res. 2011, 50, 1–21. [Google Scholar]
  14. Läpple, D.; Hennessy, T.; O’Donovan, M. Extended grazing: A detailed analysis of Irish dairy farms. J. Dairy Sci. 2012, 95, 188–195. [Google Scholar] [CrossRef] [PubMed] [Green Version]
  15. Teagasc. Grass10 Newsletter. Available online: https://www.teagasc.ie/publications/2020/grass10-newsletter---22nd-september-2020.php (accessed on 31 May 2021).
  16. Dillon, P.; Crosse, S.; Roche, J.R. The effect of grazing intensity in late summer/autumn on sward characteristics and milk production of spring-calving dairy cows. Ir. J. Agric. food Res. 1998, 37, 1–15. [Google Scholar]
  17. Claffey, A.; Delaby, L.; Boland, T.; Egan, M. Implications of adapting autumn grazing management on spring herbage production–the effect on late lactation milk production and the subsequent response in early lactation animal performance. Livest. Sci. 2020, 231, 103870. [Google Scholar] [CrossRef]
  18. Hennessy, D.; O’Donovan, M.; French, P.; Laidlaw, A. Effects of date of autumn closing and timing of winter grazing on herbage production in winter and spring. Grass Forage Sci. 2006, 61, 363–374. [Google Scholar] [CrossRef]
  19. Teagasc. Grazing Guide. 2011. Available online: https://www.teagasc.ie/animals/beef/grassland/grassland-management (accessed on 31 May 2021).
  20. Brereton, A.; Carton, O.; O’Keeffe, W. Tissue turnover in perennial ryegrass (Lolium perenne L.) during winter. Ir. J. Agric. Res. 1985, 24, 49–62. [Google Scholar]
  21. Parsons, A.; Chapman, D. The principles of pasture growth and utilization. In Grass: Its Production and Utilization; Hopkins, A., Ed.; Blackwell Science Ltd.: Oxford, UK, 2000; pp. 31–89. [Google Scholar]
  22. Lawrence, D.C.; O’Donovan, M.; Boland, T.M.; Kennedy, E. Effects of autumn and spring defoliation management on the dry-matter yield and herbage quality of perennial ryegrass swards throughout the year. Grass Forage Sci. 2017, 72, 38–49. [Google Scholar] [CrossRef]
  23. Davies, A.; Simons, R. Effect of autumn cutting regime on developmental morphology and spring growth of perennial ryegrass. J. Agric. Sci. 1979, 92, 457–469. [Google Scholar] [CrossRef]
  24. Wingler, A.; Hennessy, D. Limitation of grassland productivity by low temperature and seasonality of growth. Front. Plant Sci. 2016, 7, 1130. [Google Scholar] [CrossRef] [Green Version]
  25. Hennessy, D.; O’Donovan, M.; French, P.; Laidlaw, A. Factors influencing tissue turnover during winter in perennial ryegrass dominated swards. Grass Forage Sci. 2008, 63, 202–211. [Google Scholar] [CrossRef]
  26. Looney, C.; Hennessy, D.; Wingler, A.; Claffey, A.; Egan, M. An examination of the effect of autumn closing date on over-winter herbage production and on spring yield. Ir. J. Agric. Food Res. 2021. [Google Scholar]
  27. Laidlaw, A.; Mayne, C. Setting management limits for the production and utilization of herbage for out-of-season grazing. Grass Forage Sci. 2000, 55, 14–25. [Google Scholar] [CrossRef]
  28. Garay, A.H. Tiller size/density compensation in perennial ryegrass miniature swards subject to differing defoliation heights and a proposed productivity index. Grass Forage Sci. 1999, 54, 347–356. [Google Scholar] [CrossRef]
  29. Ryan, W.; Hennessy, D.; Murphy, J.; Boland, T. The effects of autumn closing date on sward leaf area index and herbage mass during the winter period. Grass Forage Sci. 2010, 65, 200–211. [Google Scholar] [CrossRef]
  30. Alexander, S.; Black, A.; Boland, A.; Burke, J.; Carton, O.T.; Coulter, B.S.; Humphreys, J. Major and Micro Nutrient Advice for Productive Agricultural Crops, 50th ed.; Teagasc: Carlow, Ireland, 2008. [Google Scholar]
  31. McSweeney, D.; Foley, C.; Halton, P.; O’Brien, B. Calibration of an automated grass height measurement tool equipped with global positioning system to enhance the precision of grass measurement in pasture-based farming systems. In Proceedings of the 18th EGF Symposium on ‘Grassland and Forages in High Output Dairy Farming Systems’, Wageningen, The Netherlands, 15–17 June 2015; Volume 20, pp. 265–267. [Google Scholar]
  32. Jewiss, O. Shoot development and number. In Sward Measurement Handbook; The British Grassland Society: Reading, UK, 1993; pp. 99–120. [Google Scholar]
  33. Burns, G.; Gilliland, T.; Grogan, D.; Watson, S.; O’Kiely, P. Assessment of herbage yield and quality traits of perennial ryegrasses from a national variety evaluation scheme. J. Agric. Sci. 2013, 151, 331–346. [Google Scholar] [CrossRef]
  34. Thomas, T. An automated procedure for the determination of soluble carbohydrates in herbage. J. Sci. Food Agric. 1977, 28, 639–642. [Google Scholar] [CrossRef]
  35. Peacock, J.M. Temperature and leaf growth in Lolium perenne III factors affecting seasonal differences. J. Appl. Ecol. 1975, 12, 685–697. [Google Scholar] [CrossRef]
  36. Hurtado-Uria, C.; Hennessy, D.; Shalloo, L.; O’Connor, D.; Delaby, L. Relationships between meteorological data and grass growth over time in the south of Ireland. Ir. Geogr. 2013, 46, 175–201. [Google Scholar] [CrossRef] [Green Version]
  37. Carton, O.T.; Brereton, A.J.; O’Keeffe, W.F.; Keane, G.P. Effects of autumn closing date and grazing severity in a rotationally grazed sward during winter and spring: 1. Dry matter production. Ir. J. Agric. Res. 1988, 27, 141–150. [Google Scholar]
  38. Carton, O.T.; Brereton, A.J.; O’Keeffe, W.F.; Keane, G.P. Effects of autumn closing date and grazing severity in a rotationally grazed sward during winter and spring: 2. Tissue turnover. Ir. J. Agric. Res. 1988, 27, 151–165. [Google Scholar]
  39. Fulkerson, W.J.; Donaghy, D.J. Plant-soluble carbohydrate reserves and senescence-key criteria for developing an effective grazing management system for ryegrass-based pastures: A review. Aust. J. Exp. Agric. 2001, 41, 261–275. [Google Scholar] [CrossRef]
  40. Fulkerson, W.J.; Slack, K.; Hennessy, D.W.; Hough, G.M. Nutrients in ryegrass (Lolium spp.), white clover (Trifolium repens) and kikuyu (Pennisetum clandestinum) pastures in relation to season and stage of regrowth in a subtropical environment. Aust. J. Exp. Agric. 1998, 38, 227–240. [Google Scholar] [CrossRef]
  41. Kavanagh, S. Feeding the dairy cow. In Teagasc Dairy Manual; Teagasc: Carlow, Ireland, 2016. [Google Scholar]
  42. Tuñon, G.; Kennedy, E.; Horan, B.; Hennessy, D.; Lopez-Villalobos, N.; Kemp, P.; O’Donovan, M. Effect of grazing severity on perennial ryegrass herbage production and sward structural characteristics throughout an entire grazing season. Grass Forage Sci. 2014, 69, 104–118. [Google Scholar] [CrossRef]
  43. Binnie, R.; Mayne, C.; Laidlaw, A. The effects of rate and timing of application of fertilizer nitrogen in late summer on herbage mass and chemical composition of perennial ryegrass swards over the winter period in Northern Ireland. Grass Forage Sci. 2001, 56, 46–56. [Google Scholar] [CrossRef]
  44. Egan, M. The effect of supplementation type on animal performance in mid lactation during periods of reduced pasture growth. Ir. Dairy Grow. Sustain. 2019, 92–93. [Google Scholar]
  45. Korte, C.J.; Chu, A.C.P. Some effects of drought on perennial ryegrass swards. Proc. N. Z. Grassl. Assoc. 1983, 44, 211–216. [Google Scholar] [CrossRef]
  46. Barker, D.J.; Chu AC, P.; Korte, C.J. Some effects of spring defoliation and drought on perennial ryegrass swards. Proc. N. Z. Grassl. Assoc. 1985, 46, 57–63. [Google Scholar] [CrossRef]
Figure 1. The relationship between the herbage mass (kg·DM·ha−1) and the pre- defoliation height for autumn defoliation. The relationship is described by the equation y = −1 × 10−6x2 + 0.072x + 1.34. R2 = 0.74.
Agronomy 11 01140 g001
Table 1. Average daily air temperature (°C), monthly rainfall (mm), solar radiation, and mean soil temperature to a depth of 100 mm (°C) between August and April for Year 1 (2018/2019), Year 2 (2019/2020) and the 10-year average (2006–2016) at the experimental site.
Aug *SeptOctNovDecJanFebMarApril
Average daily air temp ** (°C)
Year 1—2018/201915.612.49.98.18.56.57.77.59.1
Year 2—2019/202015.613.69.77.166.16.56.39.8
10-year average14.813.310.97.65.75.45.56.48.7
Monthly rainfall (mm)
Year 1—2018/201943.360.072.4167.1168.265.956.7117.9108.9
Year 2—2019/2020106.871.5155.0141.0115.289.7113.347.964.8
10-year average81.767.5105.5116.8113.2122.582.668.758.8
Solar radiation
Year 1—2018/2019132910746912671762474849371316
Year 2—2019/2020137611016542702032974478911391
10-year average ***13479645603201922494088251314
Mean soil temp to a depth of 100 mm (°C)
Year 1—2018/201918.014.610.87.88.06.87.38.310.6
Year 2—2019/202017.515.210.97.45.95.75.96.711.0
10-year average17.015.011.97.95.45.05.46.910.2
* Aug = August, Sept = September, Oct = October, Nov = Nov, Dec = December, Jan = January, Feb = February, Mar = March. ** temp = temperature. *** Data presented from 2008–2016.
Table 2. Effect of the interaction of target herbage mass (Low—500 kg·DM·ha−1, Medium—1500 kg·DM·ha−1, High—2000 kg·DM·ha−1 and Very high—3000 kg·DM·ha−1) and defoliation dates (DD; DD1—15 October, DD2—7 November and DD3—21 November) at defoliation in autumn on the herbage mass (kg·DM·ha−1) and the pre- grazing sward height (cm).
Target Herbage MassLowMediumHighVery HighDefoliation Date AverageS.E.Significance
Herbage mass (kg·DM·ha−1) THMDDTHM × DD
Defoliation date 16501210169527581578 a153.6******NS
Defoliation date 29622172218730772100 b
Defoliation date 310881823193229171940 b
Target herbage mass average900 11735 21938 22917 3
Pre-defoliation height (cm)Defoliation date average
Defoliation date 14.68.211.013.69.4 a0.32********
Defoliation date 27.010.111.312.910.3 b
Defoliation date 37.710.010.912.910.4 b
Target herbage mass average6.4 19.4 211.1 313.2 4
p > 0.05 NS, p < 0.01 **, p < 0.001 ***. Alphabetic superscripts within columns denote different superscripts differ significantly for defoliation date. Numeric superscripts within row denote different superscripts differ significantly for target herbage mass.
Table 3. Effect of the interaction of target herbage mass (Low—500 kg·DM·ha−1, Medium—1500 kg·DM·ha−1, High—2000 kg·DM·ha−1 and Very high—3000 kg·DM·ha−1) and defoliation dates (DD; DD1—15 October, DD2—7 November and DD3—21 November) at defoliation in autumn on the crude protein (g·kg−1 DM) and dry matter digestibility (DMD; g·kg−1 DM).
Target Herbage MassLowMediumHighVery HighDefoliation Date AverageS.E.Significance
Crude Protein (g·kg−1 DM) THMDDTHM × DD
Defoliation date 1255224225199226 a2.9********
Defoliation date 2232215212209217 b
Defoliation date 3229225213209219 b
Target herbage mass average238 1221 2217 22063
Dry Matter Digestibility (g·kg−1 DM)Defoliation date average
Defoliation date 18007958007837943.4*NSNS
Defoliation date 2812813791794803
Defoliation date 3802802794784796
Target herbage mass average805 1805 1794 1,2787 2
p > 0.05 NS, p < 0.05 *, p < 0.01 **, p < 0.001 ***. Alphabetic superscripts within columns denote different superscripts that differ significantly for defoliation date. Numeric superscripts within row denote different superscripts that differ significantly for target herbage mass.
Table 4. Effect of the interaction of target herbage mass (Low—500 kg·DM·ha−1, Medium—1500 kg·DM·ha−1, High—2000 kg·DM·ha−1 and Very high—3000 kg·DM·ha−1) and defoliation dates (DD; DD1—15 October, DD2—7 November and DD3—21 November) at defoliation in autumn on the water soluble carbohydrates (WSC; mg·g−1 DW) in the stubble (<3.5 cm) and the light interception (%) to the base of the sward.
Target Herbage MassLowMediumHighVery HighDefoliation Date AverageS.E.Significance
Water Soluble Carbohydrate in stubble (mg·g−1 DW) THMDDTHM × DD
Defoliation date 127.635.839.833.134.0 a1.30******
Defoliation date 233.130.631.435.532.6 b
Defoliation date 331.131.435.034.633.0 b
Target herbage mass average30.6 132.6 1,235.4 234.4 2
p > 0.05 NS, p < 0.05 *, p < 0.01 **, p < 0.001 ***. Alphabetic superscripts within columns denote different superscripts that differ significantly for defoliation date. Numeric superscripts within row denote different superscripts that differ significantly for target herbage mass.
Table 5. Effect of the interaction of target herbage mass (Low—500 kg·DM·ha−1, Medium—1500 kg·DM·ha−1, High—2000 kg·DM·ha−1 and Very high—3000 kg·DM·ha−1) and defoliation dates (DD; DD1—15 October, DD2—7 November and DD3—21 November) at autumn defoliation on the spring herbage mass (kg·DM·ha−1), pre-defoliation sward height (cm), tiller density (tillers·m−2) water soluble carbohydrates (WSC; mg·g−1 DW) in the stubble (<3.5 cm), light interception (%), crude protein (g·kg−1 DM) and dry matter digestibility (DMD; g·kg−1 DM).
Defoliation Date
VariableDD1DD2DD3S.E.Significance
Herbage mass (kg·DM·ha−1)932 a711 b659 b23.8***
Pre-defoliation height (cm)7.3 a6.1 b5.8 c0.11***
Tiller density (tillers·m−2)336632733334247.5NS
WSC in the stubble (mg·g−1 DW)24.525.024.20.50NS
Crude Protein (g·kg−1 DM)249 a257 b260 c1.0***
Dry matter digestibility (g·kg−1 DM)807 1809 12811 21.0*
p > 0.05 NS, p < 0.05 *, p < 0.001 ***. Alphabetic superscripts within columns denote different superscripts that differ significantly for defoliation date. Numeric superscripts within row denote different superscripts that differ significantly for target herbage mass.
Publisher’s Note: MDPI stays neutral with regard to jurisdictional claims in published maps and institutional affiliations.

