Article

Exploring Suitable Biochar Application Rates with Compost to Improve Upland Field Environment

Department of Agricultural Life Sciences & Interdisciplinary Program in IT-Bio Convergence System, Sunchon National University, Suncheon 57922, Korea
*
Author to whom correspondence should be addressed.
Agronomy 2021, 11(6), 1136; https://doi.org/10.3390/agronomy11061136
Submission received: 11 May 2021 / Revised: 28 May 2021 / Accepted: 31 May 2021 / Published: 2 June 2021
(This article belongs to the Special Issue The Effects of Biochar on Organisms)

Abstract

:
A field experiment was carried out to investigate crop productivity, emissions of carbon dioxide (CO2) and nitrous oxide (N2O), and soil quality of an upland field treated with compost and varying rates of biochar (BC) derived from soybean stalks during crop growing periods in a corn and Chinese cabbage rotation system. Compost was supplemented with BC derived from soybean stalks at varying rates of 5, 10, 15, and 20 t ha−1 (BC5, BC10, BC15, and BC20, respectively); the control (BC0) area was untreated. Our results reveal that crop productivity and emissions of CO2 and N2O varied significantly with the biochar application rate. Moreover, irrespective of the biochar application rate, crop productivity was improved after BC application as compared to the control treatment area, by 11.2–29.3% (average 17.0 ± 8.3%) for corn cultivation and 10.3–39.7% (average 27.8 ± 12.7%) for Chinese cabbage cultivation. Peak emissions of CO2 and N2O were mainly observed in the early period of crop cultivation, whereas low CO2 and N2O emissions were determined during the fallow period. Compared to the control area, significant differences were obtained for CO2 emissions produced by the different biochar application rates for both crops. During the two cropping periods, the overall N2O emission was significantly decreased with BC5, BC10, BC15, and BC20 applications as compared to the control, ranging from 11.1 to 13.6%, 8.7 to 15.4%, 23.1 to 26.0%, and 15.0 to 19.6%, respectively (average 16.9% decrease in the corn crop period and 16.3% in the Chinese cabbage crop period). Soil quality results after the final crop harvest show that bulk density, soil organic carbon (SOC), pH, and cation exchange capacity (CEC) were significantly improved by biochar application, as compared to the control. Taken together, our results indicate that compost application supplemented with biochar is potentially an appropriate strategy for achieving high crop productivity and improving soil quality in upland field conditions. In conclusion, appropriate application of biochar with compost has the concomitant advantages of enriching soil quality for long-term sustainable agriculture and reducing the use of inorganic fertilizers.

1. Introduction

Fertilizers are substances applied to the soil for nourishing plants and benefitting their growth. Based on their convenience and efficacy, chemical fertilizers are important materials that contribute to increasing the crop yield and securing stable crop productivity [1]. However, overuse of chemical fertilizers on agricultural land results in an imbalance of nutrients in the soil and lowers the soil organic matter content [2]. In particular, a decrease in the organic matter content of agricultural soils degrades the physical, chemical, and biological properties of the soil, thereby reducing soil fertility [3]. Consequently, the continued use of chemical fertilizers affects crop production by decreasing the soil quality [4].
Chemical fertilizers are regularly applied to maintain the stability of crop production in South Korea, resulting in a considerable increase in usage, from 233 in 2010 to 268 kg ha−1 in 2016 [5]. Currently, the use of chemical fertilizers per hectare in South Korea is classified as high, as compared to usage in the major Organization for Economic Cooperation and Development (OECD) countries. In addition, intensive summer rainfall and frequent tillage further deteriorate the soil quality, resulting in the need for better soil management [6].
Biochar can be produced at different temperatures without or with limited oxygen conditions through the pyrolysis of organic wastes such as straw, stalk, manure, shells, and sludge [1,7,8]. Biochar has been applied for various purposes, including improvement in soil fertility and carbon sequestration and mitigation of climate change, and in renewable energy production [9,10,11]. In addition, biochar is very useful in the agricultural environment due to its inherent unique characteristics, including pH, cation exchange capacity (CEC), specific surface area, and bulk density, when produced under different pyrolysis methods [12,13,14]. In particular, in the field of agriculture, there is an abundant interest to examine the effect of biochar application on soil improvement and crop productivity. Furthermore, biochar application is also being explored for the reduction in greenhouse gas emissions, such as methane (CH4) and N2O, which are largely associated with global warming [13,15,16,17]. Hence, over the long term, it is necessary to study the application of biochar as a method to maintain the soil environment and soil quality and also to lower the global warming potential of agricultural practices.
In the current study, the combination of biochar and compost application was investigated for improving crop productivity and for conservation of the soil quality, in a corn and Chinese cabbage crop rotation cultivation system in an upland field. Compost contains various nutrients essential for crop production, and it is therefore very important for providing a nutrient supply and improving soil fertility. In particular, livestock manure compost contains several essential nutrients including nitrogen, phosphorus, and potassium. Hence, its application as a fertilizer to replace chemical fertilizers, and as an organic fertilizer, can contribute to the improvement in soil structure. This approach has positive effects on the crop yield and soil quality and, additionally, reduces emissions of greenhouse gases, thereby encouraging the conservation of the agricultural environment. Finally, this study evaluated the crop productivity and soil factors including soil bulk density, soil organic carbon (SOC), pH, CEC, CO2 (soil respiration), and N2O emission as they are affected by different biochar application rates with compost.

2. Materials and Methods

2.1. Preparation of Biochar and Compost

Soybean stalks were used as the raw feedstock to produce biochar. The stalks were dried in an oven at 75 °C for 48 h before conversion to biochar. Soybean stalk biochar (BC) was produced through pyrolysis under anaerobic, oxygen-limited conditions in a covered stainless-steel container and pyrolyzed in a furnace supplied with injection of a continuous flow of N2 gas. The furnace controller was programmed to increase the internal biomass chamber to 600 °C at the rate of 3 °C min−1, after which the peak temperature was sustained for 1 h. The properties of BC are presented in Table 1.
Livestock manure compost was applied as the raw compost used in this study, comprising cow and poultry manures along with sawdust. The total carbon (TC), total nitrogen (TN), P2O5, K2O, CaO, and MgO contents of the compost were 41.8%, 1.82%, 2.06%, 1.80%, 1.69%, and 0.28%, respectively.

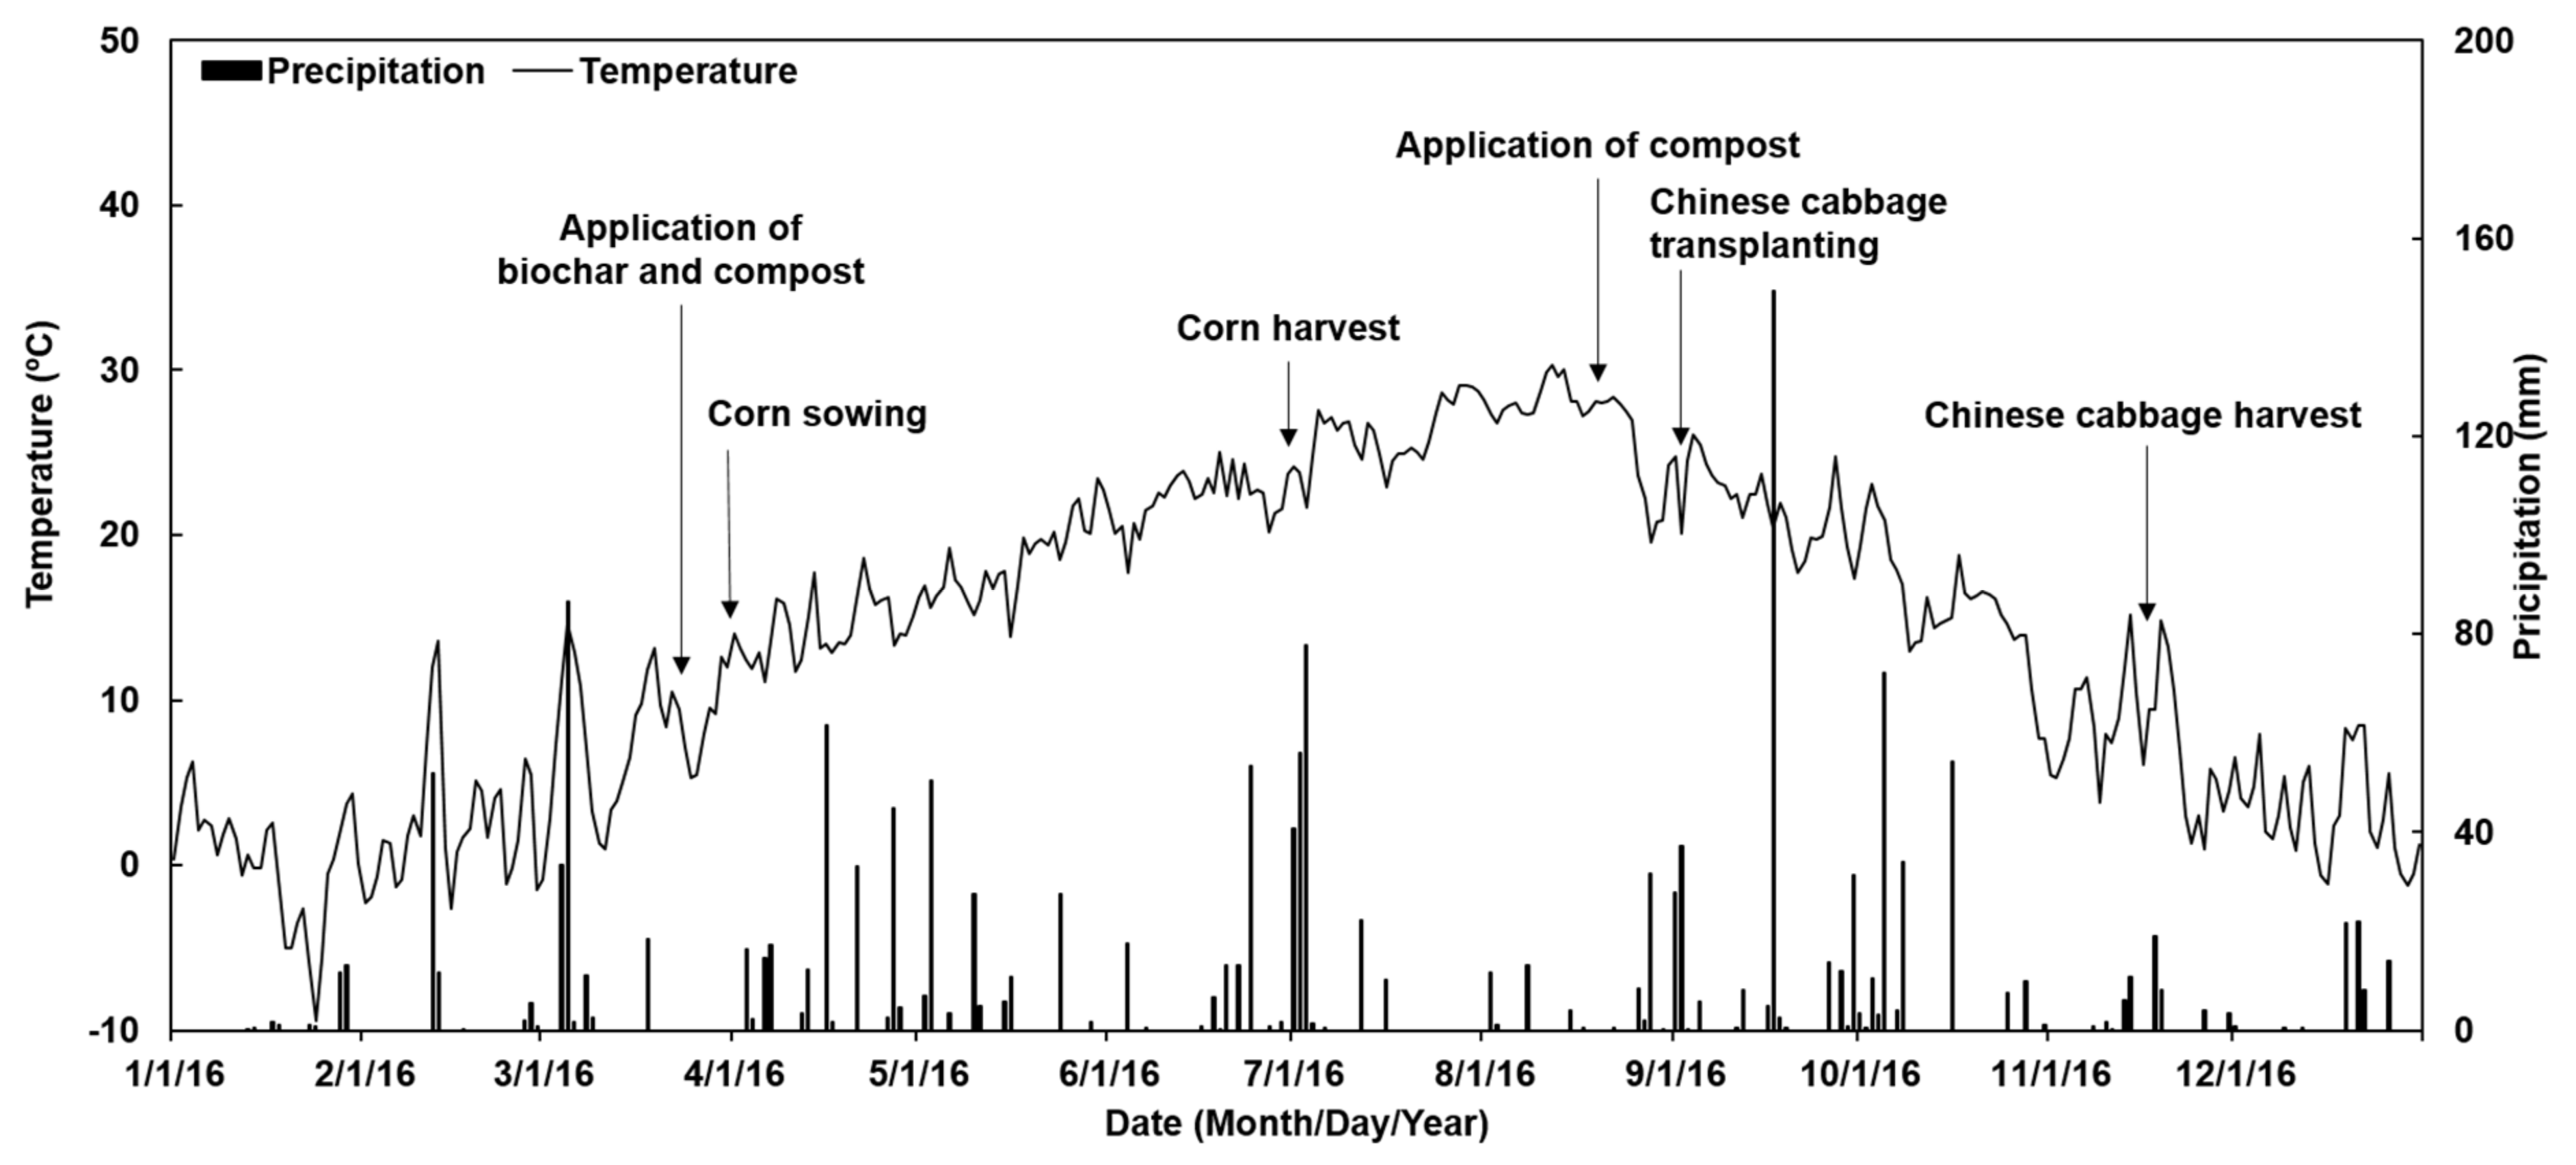
2.2. Site Description and Design

The field experiment was conducted from March 2016 to November 2016 on an upland field (34°56′21″ N, 127°33′53″ E) located at Sepung-ri, Gwangyang-eup, Gwangyang-si, Jeollanam-do, South Korea. The study field cultivated corn and Chinese cabbage through a crop rotation system, where Chinese cabbage was transplanted after corn harvesting. The experimental site experienced a mild oceanic climate with mean annual precipitation of 1615 mm, and a mean temperature of 13.9 °C (Figure 1). This region has a total possible mean sunshine duration of 12.2 h and mean sunshine duration of 5.7 h. The field soil was a sandy loam having a bulk density of 1.30 Mg m−3, pH of 5.31, electrical conductivity (EC) of 0.27 dS m−1, organic matter (OM) of 26.5 g kg−1, TN of 1.74 g kg−1, and CEC of 8.65 cmolc kg−1.
The treatment conditions included the application of BC at varying rates of 0, 5, 10, 15, and 20 t ha−1 (BC0 (control), BC5, BC10, BC15, and BC20, respectively). The compost applied was the same for all treatment groups (10 t ha−1). Prior to sowing of corn, BC and compost were simultaneously sprayed on the field; thereafter, only compost was applied to the field before Chinese cabbage transplanting. The experiment was conducted in a randomized complete block design with a factorial arrangement and three replications. A total of 15 plots, each measuring 4 m2, were used during the experiment. Plots were separated by 0.25 m, and each replicate was separated by 0.25 m to avoid an edge effect.
Corn was the first crop sowed in each plot on 25 March 2016 and was harvested on 1 July 2016. The second crop, Chinese cabbage, was transplanted into each plot on 2 September 2016 and harvested on 18 November 2016.

2.3. Soil Sampling and Analysis

Soil samples from each treatment plot were collected after final crop harvesting. Samples were collected from the surface layer (15 cm depth), air dried, and passed through a 2 mm mesh. The physicochemical properties of the sieved soils were analyzed by applying standard methods [18].

2.4. Measurement of CO2 and N2O

The monitoring of CO2 and N2O fluxes was achieved using a static chamber. Gas sampling was performed between 10 and 11 a.m. every 7 days. Gas samples were collected using a syringe, at 0, 20, and 40 min after chamber closure. The CO2 and N2O levels were simultaneously analyzed on a gas chromatograph (GC-2014, Shimadzu, Japan) equipped with a flame ionization detector (FID) and an electron capture detector (ECD), with the protocol performed as described in the manufacturer’s manual. During gas analysis, the temperature was maintained at 55 °C for the column, 100 °C for the injector, and 230 °C for the detector in the FID; in the ECD, temperatures were 50 °C for the column and 310 °C for the detector. The CO2 and N2O flux amounts were calculated using the following equation [19] (1), where F is CO2 and N2O flux, ρ is CO2 and N2O density, V is volume of chamber (m3), A is area of chamber (m2), Δc/Δt is average increase in gas concentration, and T is 273 + mean temperature in the chamber (°C):
F = ρ × (V/A) × (Δc/Δt) × (273/T)
The total CO2 and N2O fluxes for the entire crop cultivation were computed as described in [19] (2), where Ri is the rate of CO2 or N2O emission in the sampling interval, Di is the number of days in the sampling interval, and n is the number of sampling intervals:
Total   CO 2   and   N 2 O   flux = i n   Ri   ×   Di

2.5. Statistical Analysis of Data

Statistical analyses of all data, including crop, soil, and greenhouse gases, were performed by applying the JMP software with SAS (version 14.2). The mean values were measured as an average of three replicates, and the standard deviation was obtained from the result. Efficacy of the treatments subsequent to biochar application rates on parameters measured (including crop productivity, fluxes of CO2 and N2O, and soil characteristics) was evaluated using one-way analysis of variance (ANOVA), and comparison of the treatments was obtained by Tukey’s test. Tukey’s test was used for mean separation at a 95% confidence level. Regression analyses (linear vs. polynomial) were performed to determine the associations of soil bulk density, SOC, pH, and CEC. All figures were drawn using Sigma plot 12.5 (SYSTAT Software Inc., San Jose, CA, USA).

3. Results

3.1. Crop Productivity

Results of the field-based experiment to evaluate varying rates of biochar application on the growth of corn and Chinese cabbage reveal that the effects were more pronounced on the second crop (Chinese cabbage) than the first crop (corn), as presented in Figure 2.
The mean corn grain yields obtained at BC0 (control), BC5, BC10, BC15, and BC20 treatments were 4.15, 4.61, 5.36, 4.70, and 4.73 t ha−1, respectively. Relative to the control treatment, increases in the corn grain yields were 11.2% (BC5), 29.3% (BC10), 13.3% (BC15), and 14.0% (BC20). The fresh weight of Chinese cabbage obtained was highest with BC15 and BC20 treatments; this weight was 33.8–40.0%, 21.3–26.7%, and 4.8–9.5% higher than cabbages grown under BC0, BC5, and BC10 treatment conditions, respectively.

3.2. Changes in CO2 and N2O Emissions

Alterations in the gas emission rates during the crop growing period and the cumulative flux of CO2 and N2O during the crop growing and fallow periods are presented in Figure 3 and Figure 4.
Overall, CO2 emission rates during the sampling period tended to increase with the increasing rate of biochar application. In particular, differences in CO2 emission rates between crop growing and fallow periods were remarkable (Figure 3). Regardless of the biochar application rates, the CO2 emission rate ranged from 50.6 to 803 mg m−2 h−1 during the corn growing period, and 121 to 706 mg m−2 h−1 during the Chinese cabbage growing period. The pattern of the CO2 emission rate for the first crop period for all treatments showed a rapid increase until 7 days after sowing, and a gradual decrease thereafter until corn harvesting. Similarly, for the second crop, the pattern of the CO2 emission rate in all treatments showed a rapid increase until 14 days after transplanting; thereafter, there was a gradual decrease in the CO2 emission until harvesting of the Chinese cabbage. In the growing periods for both corn and Chinese cabbage, the average rates of CO2 emission for the various treatments were 260 and 276 (BC0), 292 and 306 (BC5), 308 and 344 (BC10), 328 and 384 (BC15), and 374 and 367 (BC20) mg m−2 h−1, respectively.
In addition, we also investigated changes in the N2O emission rates under different biochar applications during the crop cultivation period (Figure 4). Regardless of biochar application rates, the N2O emission rate ranged from 1.35 to 517 μg m−2 h−1 during the corn growing period, and 16.1 to 447 μg m−2 h−1 during the Chinese cabbage growing period. The N2O emission rates in the corn and Chinese cabbage growing periods increased to peak levels (411–517 μg m−2 h−1 range) at 14 days after sowing of the corn crop, and in the range 306–447 μg m−2 h−1 at 21 days after Chinese cabbage transplantation. Thereafter, the N2O emission rate in both crop growing periods gradually decreased until harvesting.
During the two fallow periods, the emission rates of CO2 and N2O were in the range of 24.2–236 mg m−2 h−1 and 2.52–77.2 μg m−2 h−1, respectively, for all treatment groups. These results show relatively small variations, compared to variations obtained in the crop growing periods.

3.3. Total Fluxes of CO2 and N2O

The total fluxes of CO2 and N2O showed significant differences between the biochar application treatments and control (Table 2). In addition, total CO2 and N2O fluxes were significantly higher during the crop growing periods than the fallow periods. In this study, regardless of treatment conditions, the annual total fluxes of CO2 and N2O ranged from 43.9 to 47.5% and 47.7 to 53.2%, respectively, for the corn growing period, 11.9 to 14.7% and 12.6 to 14.9%, respectively, for fallow periods, and 39.9 to 44.2% and 34.1 to 39.7%, respectively, for the Chinese cabbage growing period. The BC20 treatment during the corn growing period showed a significantly greater total CO2 flux and a lower total N2O flux than other BC treatments. Similar to results obtained during the corn growing period, emissions of CO2 and N2O in the Chinese cabbage growing period were significantly influenced by the biochar application rate, with the total N2O flux tending to increase with increasing biochar concentrations. In contrast, total fluxes of CO2 and N2O were not significantly affected by the biochar applications during the fallow periods.

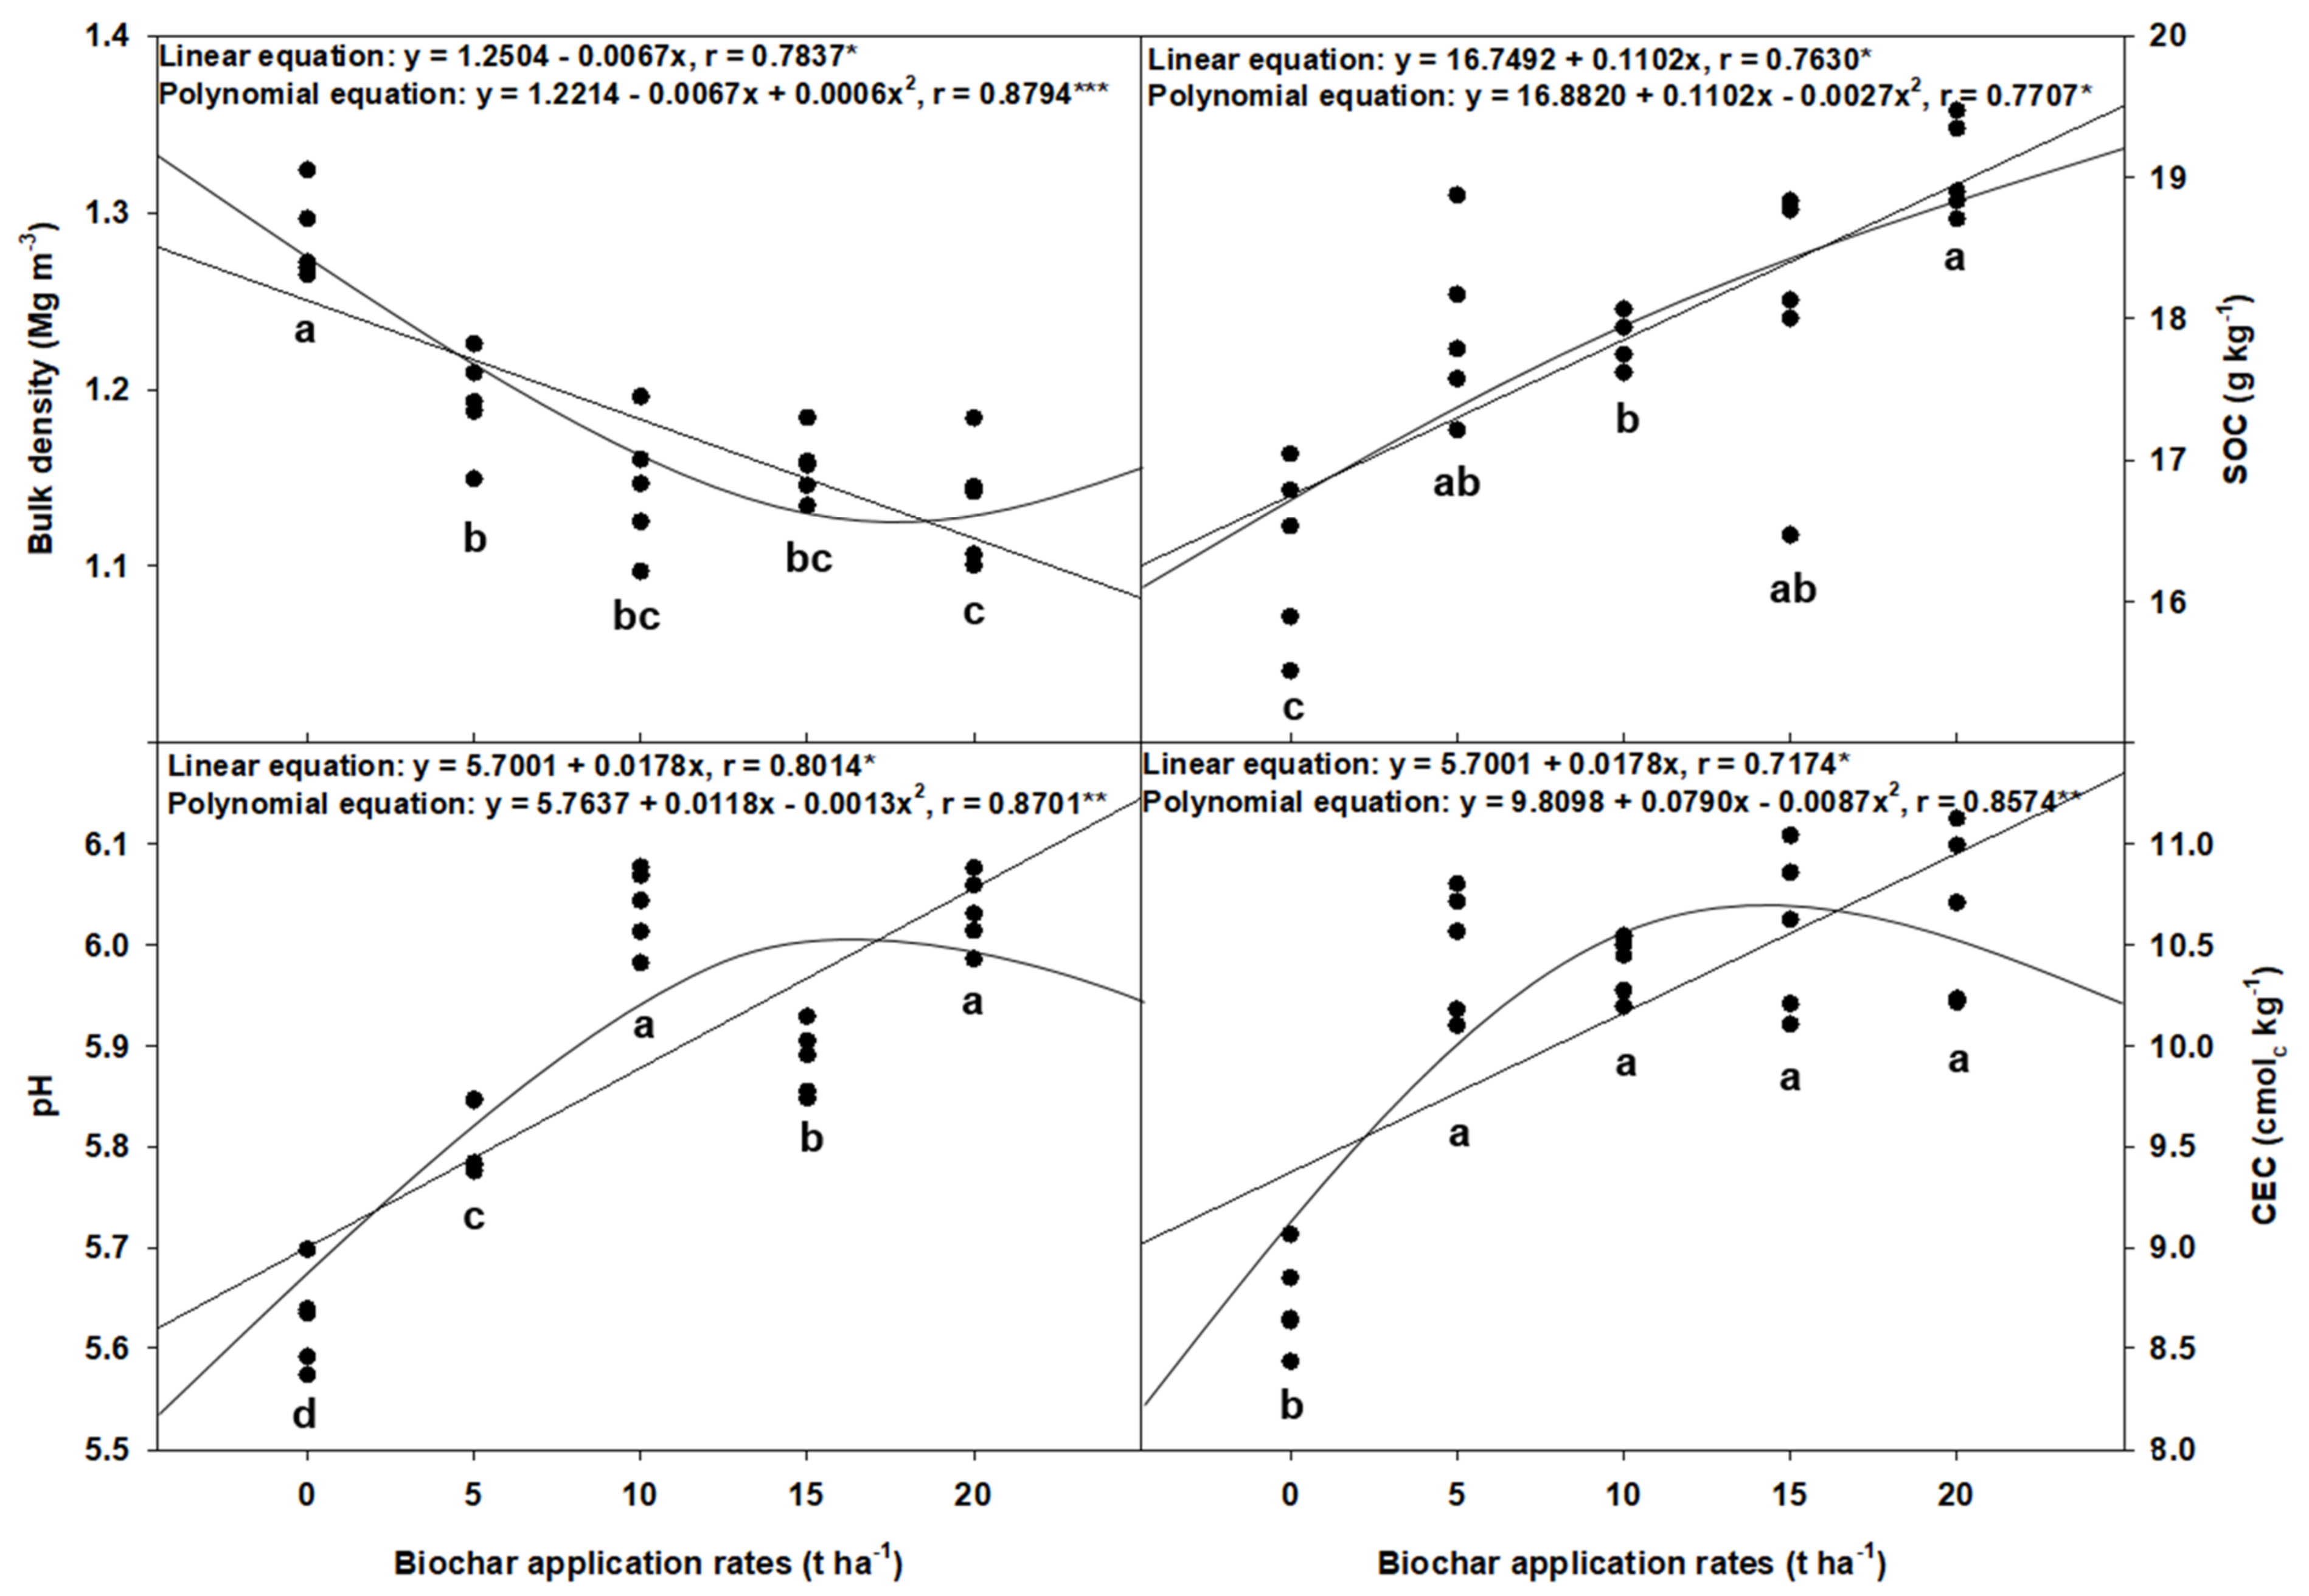
3.4. Soil Properties

The bulk density, SOC, pH, and CEC soil properties were investigated for each randomly selected collection site subsequent to the final crop harvest in 2016 (Figure 5). The overall changes in soil properties were significant among the tested soils. Regardless of the biochar application rate, the bulk density, SOC, pH, and CEC of the treated soils ranged from 1.10 to 1.32 Mg m−3, 15.5 to 19.5 g kg−1, 5.57 to 6.07, and 8.4 to 11.1 cmolc kg−1, respectively. Compared to the control soil, the lowest decrease in bulk density was observed for the BC20 treatment, followed sequentially by BC10, BC15, and BC5 treatments. SOC was greater in the BC20-treated soil than in the control soil. Similarly, pH and CEC were determined to be increased with increasing biochar application rate. The SOC, pH, and CEC for the BC20 treatment soil were, respectively, 16.5%, 7.2%, and 22.1% greater than values obtained for the BC0-treated soil.
The correlations among each BC treatment level for soil properties are presented based on linear and polynomial equations (Figure 5). The bulk density, pH, and CEC correlations under different biochar application rates and for both types of equations show that the r value of the polynomial equation is greater than the linear equation value; however, the SOC r values were notably not different. Regardless, no significant difference was obtained in the CEC results for different biochar applications.

4. Discussion

The positive effects of biochar application on the cultivation of crops are well known. It has been reported that the application of biochar to soil increases the crop productivity by improving soil physicochemical properties [1,7,17,20]. Several researchers have reported that biochar application rates of 5 to 50 t ha−1 are effective for growing crops [21]. However, the appropriate biochar application rate for improving crop productivity has not been clarified, since characteristics of the biochar produced vary according to the pyrolysis temperature, production method, and raw material. Thus, in the present study, we evaluated the effects of compost supplemented with different application rates of biochar, in a corn and Chinese cabbage rotation cultivation system. The results obtained should be useful in developing biochar application strategies that will maintain a sustainable resource cultivation agriculture system, preserve upland field environments, and secure long-term food production stability.

4.1. The Effect of Biochar Application Rates on Crop Productivity

Interestingly, subsequent to biochar application in the field soil, the highest productivities of the first and second crops were recorded at different conditions in this study.
Compared to the control area, the corn grain yield following biochar application increased by 11.2–29.3%, with the highest productivity obtained under the BC10 treatment. The biochar produced by agricultural byproducts generally has a high pH and EC, although slight variations are observed, depending on the pyrolysis temperature [8,15,22]. A high EC in soil can hinder the growth of crops and is a feature that appears in facility cultivation sites where chemical fertilizers have been applied for a long duration. Once biochar with a high EC is incorporated, the soil environment changes instantaneously. Such soil changes were thought to affect the initial growth period following the germination of corn. Mia et al. [23] reported that high biochar application rates result in poor plant growth due to salt stress related to the high EC of biochar. Similarly, Zhang et al. [24] applied biochar at 20 and 40 t ha−1 for corn cultivation. They reported a 7–14% increase in growth compared to the untreated areas, and a higher growth rate at biochar application of 20 t ha−1. Uzoma et al. [25] also reported higher corn yield after biochar application, in the order 15 t ha−1 > 20 t ha−1 > 10 t ha−1 > 0 t ha−1. These results indicate that crop productivity following biochar application differs according to the crop type, cropping period, and the period of biochar incorporation.
In the current study, the fresh weight of Chinese cabbage (the second crop produced after biochar application) increased by 10.3–39.7% compared to the BC0 treatment. These results may be attributed to the gradual stabilization of the treated soil conditions during Chinese cabbage cultivation, unlike during corn cultivation. Our results are consistent with previous reports [26,27,28,29]. For example, Major et al. [30] found no yield effect from biochar application during the first year of maize cultivation, but they did find a significant yield increase after 2–4 years of biochar application. In a greenhouse vegetable system, Zhang et al. [16] also reported a significant effect on the annual vegetable yield after biochar application of 10 t, 20 t, and 40 t ha−1, along with N fertilizer. In addition, Zhang et al. [31] reported a 11.9–35.4% increase in maize yields in biochar-treated areas (applied at 40 t ha−1) as compared to control areas, regardless of the investigation period or fertilizer type. Contrarily, Rogovska et al. [32] reported significant increases in maize yields during the first year of biochar application, but no subsequent biochar yield effect despite improved soil fertility, in the second year. It is also reported that biochar with a high C/N ratio decreases the yields or biomass of crops due to an increase in the soil N fixing rate [33]. In our study, slight differences were obtained according to treatment conditions, but overall crop productivity was positively affected by biochar application, presumably through improved soil properties.

4.2. The Effect of Biochar Application Rates on Emissions of CO2 and N2O

Previous studies have shown different effects of biochar application on CO2 and N2O emissions in upland soils; biochar application in an upland field can either affect [24] or not affect CO2 emissions [34]. In our observations, high levels of cumulative CO2 emissions were observed in the BC15 and BC20 treatment areas during both the corn and Chinese cabbage growing periods. Other studies have indicated that the increase in CO2 emissions observed after biochar treatment is possibly related to the decreased bulk density of the soil and the increased level of microbial activity [19,35]. Rogovska et al. [36] reported that regardless of manure application conditions, cumulative CO2 emissions under different biochar application rates were significantly increased due to enhanced SOC mineralization. In addition, Lu et al. [37] reported that four different rates of biochar applications in a chestnut plantation produced different CO2 emission levels: BC10 treatment (10 t ha−1) produced a higher cumulative CO2 level than other treatment groups (0, 2, and 5 t ha−1). In the current study, CO2 emissions obtained were slightly different according to the sampling period but showed an overall total CO2 flux increase with increasing biochar application; the highest annual CO2 was obtained subsequent to BC20 treatment. These results demonstrate that addition of biochar improves the physical properties of soil. Moreover, such improvements consequently increase soil aeration [17].
The main reason for the reduction in N2O following biochar application is reported to be related to microbial activity levels which, in turn, are a result of improved soil aeration, increased denitrification rates, and improvements resulting from alteration of N2O to N2 [38,39,40]. Several studies have reported the effects of biochar application on N2O emission in crop fields and also compared the application to effects from fertilizer treatment [31,41,42]. In our study, there was a reduction in N2O by biochar application; the annual N2O in biochar application treatments decreased by approximately 10.5–22.1% compared to the control treatment areas. In a previous study, Qin et al. [33] reported no significant difference in N2O reduction between biochar application and control treatment during rice cultivation (4 years); however, biochar amendment with 5, 10, and 20 t ha−1 resulted in a reduced N2O flux by 1.9–64.0% (average 30.4 ± 17.8%) compared to the decrease subsequent to chemical fertilizer treatment during the late rice season in 2012 and the early rice season in 2015. Lu et al. [37] also reported that as the biochar application rates increased, cumulative N2O efflux was significantly decreased. The low bulk density and specific characteristics of biochar are considered to affect the soil physicochemical properties, which may suppress N2O emission by improving soil aeration or increasing soil pH [43,44]. One reason for the reduction in N2O emission is that biochar acts as a carbon source, thereby affecting denitrification [45,46]. Conversely, Shen et al. [47] reported that biochar application can be a nitrogen source, which causes N2O production. Additionally, Hawthorne et al. [35] reported a possibility that the N2O emission generated by biochar application increases due to the low relative soil saturation level and improved nitrification condition. In addition, N2O production can vary depending on the biochar production method, the application conditions, and the degree of weathering of biochar from the soil [48,49]. Hence, due to the complex interactions between biochar, soil, and other environmental factors, it is necessary to determine an appropriate biochar treatment strategy that considers the cultivation system to be used. Moreover, long-term studies are needed to further elucidate the mechanisms related to CO2 and N2O production.

4.3. The Effect of Biochar Application Rates on Soil Quality

The present study revealed a positive effect on soil quality, including improvements to soil bulk density, SOC, pH, and CEC, through biochar application. The biochar application rate in this study maintained a fertile soil condition over the crop rotation year. However, compared to the control treatment, the soil quality was clearly altered subsequent to different biochar applications, but the soil characteristics remained stable with increasing application rates.
Soil bulk density is the physical property that affects soil structure, water and nutrient transport, and soil aeration [42,50]. Several researchers have reported that biochar application decreases soil bulk density [51,52,53]. Niu et al. [54] and Kang et al. [6] observed that biochar application resulted in decreased soil bulk density in upland soils. Our results are similar to those of Zhang et al. [31], who reported that over a two-year period, maize field soil bulk density following biochar amendment (0, 20, and 40 t ha−1) was significantly decreased by 0.02–0.17 t m−3 after the conventional fertilization condition, and by 0.03–0.20 t m−3 after the balanced fertilization condition, as compared to the control treatment. Azeem et al. [55] reported that in a mash bean–wheat crop system, biochar application (0, 5, and 10 t ha−1) decreased the soil bulk density regardless of fertilizer conditions, as compared to the control treatment. In addition, biochar application to upland soil increased the SOC, pH, and CEC, thereby improving the nutrient availability rate and improving the stability of crop productivity. SOC is an index for improving agricultural productivity and soil resource utilization efficiency, which improves the soil fertility and productivity by increasing nutrient supply, water holding capacity, and microbial activity. As expected, our results indicate that biochar application to an upland field is associated with increased SOC, which is primarily due to the pyrolysis process producing a carbon-rich solid.
Soil pH and CEC are important indicators, and any alterations in these factors can influence the availability and retention of nutrients. Numerous studies have demonstrated that biochar application improves soil pH and CEC [15,26,47]. Major et al. [30] reported that soil pH after four years of a biochar treatment of 20 t ha−1 was higher than pH values obtained after biochar treatments of 0 and 8 t ha−1 at a depth of 30 cm. Carter et al. [27] and Kelly et al. [56] also reported that the higher the rate of biochar application, the higher the cultivated soil pH. Biochar is basically an alkaline substance with a high pH and therefore increases the soil pH. In this study, increasing biochar application rates (5, 10, 15, and 20 t ha−1) significantly increased the resultant soil pH (by 0.18, 0.41, 0.26, and 0.41 units, respectively). However, there was no straight-line relationship. This non-linear trend agrees with the results reported by Zhang et al. [31], which state that soil pH was higher in the order of C1 (20 t ha−1) > C2 (40 t ha−1) > C0 (0 t ha−1) treatments. The current study also showed that the CEC results in soil were similar to the pH results under different biochar application rates. Soil CEC following biochar treatment was definitely higher than the control areas, presumably because biochar has a high specific surface area [8,13]; regardless, there was no significant difference in the CEC level based on the application rate. The results additionally reveal that alterations in the soil pH following biochar application are dependent on field conditions such as soil characteristics and crop growing period. In summary, biochar application for improving crop cultivation and soil fertility requires an appropriate application rate which needs to be determined in accordance with the prevailing environmental conditions.

5. Conclusions

Overall, biochar application rates were found to positively affect crop growth, soil quality, and soil respiration in an upland field environment. The higher biochar application rates contributed to changes in N2O emissions, with N2O emissions tending to gradually decrease. Following the biochar application, there were significant improvements in soil qualities, including improvements to bulk density, SOC, pH, and CEC. Similarly, at high application rates (10–20 t ha−1), crop yields were increased for both corn and Chinese cabbage in the rotation system, after application of biochar to an upland field in South Korea. In particular, the effect of biochar application on crop growth revealed that the Chinese cabbage cultivation (second crop) benefited more than the corn cultivation (first crop). Considering the benefits resulting from the high application rates of biochar and compost application to an upland field, further studies are required to determine the usefulness of this procedure for increasing soil respiration and yields of corn and Chinese cabbage over the long term. Based on the results from the combined application of biochar and compost, the following points are deduced:
(1)
Biochar application has the potential to improve soil conditions in an upland field;
(2)
Crop productivity, soil quality, and greenhouse gas fluxes under different biochar application rates were monitored;
(3)
Biochar application improved the bulk density, SOC, pH, and CEC in field soil;
(4)
Biochar application significantly reduces N2O emissions and increases soil respiration and crop productivity;
(5)
Appropriate biochar application rates need to be defined for upland field environments.
Considering the benefits of biochar application, including an improved crop productivity and soil environment and replacing the use of inorganic fertilizers, we propose the use of an appropriate biochar application rate in a corn and Chinese cabbage rotation system in upland fields.

Author Contributions

S.-W.K., and J.-S.C. designed and conducted the experiment as well as writing the manuscript. J.-J.Y. and J.-H.P. conducted plant and soil analysis, CO2 and N2O measurement, and interpretation. All authors have read and agreed to the published version of the manuscript.

Funding

This work was supported by the Korea Institute of Planning and Evaluation for Technology in Food, Agriculture and Forestry (IPET) through the Technology Commercialization Support Program, funded by the Ministry of Agriculture, Food and Rural Affairs (MAFRA) (821007–02). Additionally, this work was supported by a grant from the Ministry of Science and ICT (MSIT) through the National Research Foundation (NRF) of Korea (NRF-2019R1A4A1029125). Moreover, this work was supported by the National Research Foundation of Korea (NRF) grant funded by the Korean government (MSIT) (NRF-2020R1I1A1A01058224). Additionally, this work was carried out with the support of the “Cooperative Research Program for Agriculture Science and Technology Development (Project No. PJ015568)” Rural Development Administration, Republic of Korea.

Institutional Review Board Statement

Not applicable.

Informed Consent Statement

Not applicable.

Data Availability Statement

Not applicable.

Conflicts of Interest

The authors declare no conflict of interest.

References

  1. Ding, Y.; Liu, Y.; Liu, S.; Huang, X.; Li, Z.; Tan, X.; Zeng, G.; Zhou, L. Potential benefits of biochar in agricultural soils: A review. Pedosphere 2017, 27, 645–661. [Google Scholar] [CrossRef]
  2. Lee, S.B.; Lee, C.H.; Jung, K.Y.; Park, K.D.; Lee, D.K.; Kim, P.J. Changes of soil organic carbon and its fractions in relation to soil physical properties in a long-term fertilized paddy. Soil Tillage Res. 2009, 104, 227–232. [Google Scholar] [CrossRef]
  3. Bongiovanni, M.D.; Lobartini, J.C. Particulate organic matter, carbohydrate, humic acid contents in soil macro- and microaggregates as affected by cultivation. Geoderma 2006, 136, 660–665. [Google Scholar] [CrossRef]
  4. Guo, J.H.; Liu, X.J.; Zhang, Y.; Shen, J.L.; Han, W.X.; Zhang, W.F.; Christie, P.; Goulding, K.W.T.; Vitousek, P.M.; Zhang, F.S. Significant acidification in major Chinsese croplands. Science 2010, 327, 1008–1010. [Google Scholar] [CrossRef] [PubMed] [Green Version]
  5. Kang, S.W.; Lee, W.J.; Jeong, H.G.; Park, J.H.; Lee, J.H.; Yun, J.J.; Kim, S.Y.; Seo, D.C.; Cho, J.S. Effect of application levels of inorganic fertilizer with biochar on corn growth in an upland field. Korean J. Soil Sci. Fertil. 2018, 51, 547–554. [Google Scholar]
  6. Kang, S.W.; Kim, S.H.; Park, J.H.; Seo, D.C.; Ok, Y.S.; Cho, J.S. Effect of biochar derived from barley straw on soil physicochemical properties, crop growth, and nitrous oxide emission in an upland field in South Korea. Environ. Sci. Pollut. Res. 2018, 25, 25813–25821. [Google Scholar] [CrossRef] [PubMed]
  7. Palansooriya, K.N.; Ok, Y.S.; Awad, Y.M.; Lee, S.S.; Sung, J.K.; Koutsopyros, A.; Moon, D.H. Impacts of biochar application on upland agriculture: A review. J. Environ. Manag. 2019, 234, 52–64. [Google Scholar] [CrossRef]
  8. Peng, X.; Ye, L.L.; Wang, C.H.; Zhou, H.; Sun, B. Temperature- and duration-dependent rice straw-derived biochar: Characteristics and its effects on soil properties of an Ultisol in southern China. Soil Tillage Res. 2011, 112, 159–166. [Google Scholar] [CrossRef]
  9. Angst, T.E.; Six, J.; Reay, D.S.; Sohi, S.P. Impact of pine chip biochar on trace greenhouse gas emissions and soil nutrient dynamics in an annual ryegrass system in California. Agric. Ecosyst. Environ. 2014, 191, 17–26. [Google Scholar] [CrossRef]
  10. Mclennon, E.; Solomon, J.K.Q.; Neupane, D.; Davison, J. Biochar and nitrogen application rates effect on phosphorus removal from a mixed grass sward irrigated with reclaimed wastewater. Sci. Total. Environ. 2020, 715, 137012. [Google Scholar] [CrossRef]
  11. Man, Y.; Wang, B.; Wang, J.; Slaný, M.; Yan, H.; Li, P.; El-Naggar, A.; Shaheen, S.M.; Rinkeble, J.; Feng, X. Use of biochar to reduce mercury accumulation in Oryza sativa L: A trial for sustainable management of historically polluted farmlands. Environ. Int. 2021, 153, 106527. [Google Scholar] [CrossRef] [PubMed]
  12. Luo, X.; Liu, G.; Xia, Y.; Chen, L.; Jiang, Z.; Zheng, H.; Wang, Z. Use of biochar-compost to improve properties and productivity of the degraded coastal soil in the Yellow River Delta, China. J. Soils Sediments 2017, 17, 780–789. [Google Scholar] [CrossRef]
  13. Martinsen, V.; Alling, V.; Nurida, N.L.; Mulder, J.; Hale, S.E.; Ritz, C.; Rutherford, D.W.; Heikens, A.; Breedveld, G.D.; Cornelissen, G. pH effects of the addition of three biochars to acidic Indonesian mineral soils. Soil Sci. Plant Nutr. 2015, 61, 821–834. [Google Scholar] [CrossRef] [Green Version]
  14. Rajakumar, R.; Sankar, J. Biochar for sustainable agriculture—review. Int. J. Appl. Pure Sci. Agric. 2016, 2, 173–184. [Google Scholar]
  15. Sandhu, S.S.; Ussiri, D.A.N.; Kumar, S.; Chintala, R.; Papiernik, S.K.; Malo, D.D.; Schumacher, T.E. Analyzing the impacts of three types of biochar on soil carbon fractions and physiochemical properties in a corn-soybean rotation. Chemosphere 2017, 184, 473–481. [Google Scholar] [CrossRef]
  16. Zhang, Y.; Wang, H.; Maucieri, C.; Liu, S.; Zou, J. Annual nitric and nitrous oxide emissions response to biochar amendment from an intensive greenhouse vegetable system in southeast China. Sci. Hortic. 2019, 246, 879–886. [Google Scholar] [CrossRef]
  17. Major, J.; Lehmann, J.; Rondon, M.; Goodale, C. Fate of soil-applied black carbon: Downward migration, leaching and soil respiration. Glob. Chang. Biol. 2010, 16, 1366–1379. [Google Scholar] [CrossRef]
  18. NIAST. Methods of Soil and Plant Analysis; National Institute of Agricultural Science and Technology, RDA: Suwon, Korea, 2000. [Google Scholar]
  19. Kang, S.W.; Seo, D.C.; Cheong, Y.H.; Park, J.W.; Park, J.H.; Kang, H.W.; Park, K.D.; Ok, Y.S.; Cho, J.S. Effect of barley straw biochar application on greenhouse gas emissions from upland soil for Chinese cabbage cultivation in short-term laboratory experiments. J. Mt. Sci. 2016, 13, 259–702. [Google Scholar] [CrossRef]
  20. Oliveira, F.R.; Patel, A.K.; Jaisi, D.P.; Adhikari, S.; Lu, H.; Khanal, S.K. Environmental application of biochar: Current status and perspectives. Bioresour. Technol. 2017, 246, 110–122. [Google Scholar] [CrossRef]
  21. Major, J. Guideline on Practical Aspects of Biochar Application to Field Soil in Various Soil Management Systems; International Biochar Initiative: Westerville, OH, USA, 2010. [Google Scholar]
  22. Genesio, L.; Milglietta, F.; Baronti, S.; Vaccari, F.P. Biochar increases vineyard productivity without affecting grape quality: Result from a four years field experiment in Tuscany. Agric. Ecosyst. Environ. 2015, 201, 20–25. [Google Scholar] [CrossRef]
  23. Mia, S.; van Groenigen, J.W.; van de Voorde, T.F.J.; Oram, N.J.; Bezemer, T.M.; Mommer, L.; Jeffery, S. Biochar application rate affects biological nitrogen fixation in red clover conditional on potassium availability. Agric. Ecosyst. Environ. 2014, 91, 83–91. [Google Scholar] [CrossRef] [Green Version]
  24. Zhang, A.; Liu, Y.; Pan, G.; Hussain, Q.; Li, L.; Zheng, J.; Zhang, X. Effect of biochar amendment on maize yield and greenhouse gas emissions from a soil organic carbon poor calcareous loamy soil from central China plain. Plant Soil 2012, 351, 263–275. [Google Scholar] [CrossRef]
  25. Uzoma, K.C.; Inoue, M.; Andry, H.; Fujimaki, H.; Zahoor, A.; Nishiihara, E. Effect of cow manure biochar on maize productivity under sandy soil condition. Soil Use Manag. 2011, 27, 205–212. [Google Scholar] [CrossRef]
  26. Agegnehu, G.; Bass, A.M.; Nelson, P.N.; Bird, M.I. Benefits of biochar, compost and biochar-compost for soil quality, maize yield and greenhouse gas emissions in a tropical agricultural soil. Sci. Total. Environ. 2016, 543, 295–306. [Google Scholar] [CrossRef] [PubMed]
  27. Carter, S.; Shackley, S.; Sohi, S.; Suy, T.B.; Haefele, S. The impact of biochar application on soil properties and plant growth of pot grown lettuce (Lactuca sativa) and cabbage (Brassica chinensis). Agronomy 2013, 3, 404–418. [Google Scholar] [CrossRef] [Green Version]
  28. Liu, Z.; Chen, X.; Jing, Y.; Li, Q.; Zhang, J.; Huang, Q. Effects of biochar amendment on rapeseed and sweet potato yields and water stable aggregate in upland red soil. Catena 2014, 123, 45–51. [Google Scholar] [CrossRef]
  29. Raboin, L.M.; Razafimahafaly, A.H.D.; Rabenharisoa, M.B.; Rabary, B.; Dusserre, J.; Becquer, T. Improving the fertility of tropical acid soils: Liming versus biochar application? A long term comparison in the highlands of Madagascar. Field Crop. Res. 2016, 199, 99–108. [Google Scholar] [CrossRef]
  30. Major, J.; Rondon, M.; Molina, D.; Riha, S.J.; Lehmann, J. Maize yield and nutrition during 4 years after biochar application to a Colombian savanna oxisol. Plant Soil 2010, 333, 117–128. [Google Scholar] [CrossRef]
  31. Zhang, D.; Pan, G.; Wu, G.; Kibue, G.W.; Li, L.; Zhang, X.; Zheng, J.; Zheng, J.; Cheng, K.; Joseph, S.; et al. Biochar helps enhance maize productivity and reduce greenhouse gas emissions under balanced fertilization in a rainfed low fertility inceptisol. Chemosphere 2016, 142, 106–113. [Google Scholar] [CrossRef] [PubMed]
  32. Rogovska, N.; Laird, D.A.; Rathke, S.J.; Karlen, D.L. Biochar impact on Midwestern Mollisols and maize nutrient availability. Geoderma 2014, 230–231, 340–347. [Google Scholar] [CrossRef] [Green Version]
  33. Qin, X.; Li, Y.; Wang, H.; Liu, C.; Li, J.; Wan, Y.; Gao, Q.; Fan, F.; Liao, Y. Long-term effect of biochar application on yield-scaled greenhouse gas emissions in a rice paddy cropping system: A four-year case study in south China. Sci. Total. Environ. 2016, 569–570, 1390–1401. [Google Scholar] [CrossRef]
  34. Liu, X.; Zheng, J.; Zhang, D.; Cheng, K.; Zhou, H.; Zhang, A.; Li, L.; Joseph, S.; Smith, P.; Crowley, D.; et al. Biochar has no effect on soil respiration across Chinese agricultural soils. Sci. Total. Environ. 2016, 554–555, 259–265. [Google Scholar] [CrossRef] [PubMed] [Green Version]
  35. Hawthorne, I.; Johnson, M.S.; Jassal, R.S.; Black, T.A.; Grant, N.J.; Smukler, S.M. Application of biochar and nitrogen influences fluxes of CO2, CH4 and N2O in a forest soil. J. Environ. Manag. 2017, 192, 203–214. [Google Scholar] [CrossRef] [PubMed]
  36. Rogovska, N.; Laird, D.; Cruse, R.; Fleming, P.; Parkin, T.; Meek, D. Impact of biochar on manure carbon stabilization and greenhouse gas emissions. Soil Sci. Soc. Am. J. 2011, 75, 871–879. [Google Scholar] [CrossRef] [Green Version]
  37. Lu, X.; Li, Y.; Wang, H.; Singh, B.P.; Hu, S.; Luo, Y.; Li, J.; Xiao, Y.; Cai, X.; Li, Y. Response of soil greenhouse gas emissions to different application rates of biochar in a subtropical Chinese chestnut plantation. Agric. For. Meteorol. 2019, 271, 168–179. [Google Scholar] [CrossRef]
  38. Cayuela, M.L.; Sanchez-Monedero, M.A.; Roig, A.; Hanley, K.; Enders, A.; Lehmann, J. Biochar and denitrification in soils: When, how much and why does biochar reduce N2O emission? Sci. Rep. 2013, 3, 1732–1739. [Google Scholar] [CrossRef] [Green Version]
  39. Lai, W.Y.; Lai, C.M.; Ke, G.R.; Chung, R.S.; Chen, C.T.; Cheng, C.H.; Pai, C.W.; Chen, S.Y.; Chen, C.C. The effects of woodchip biochar application on crop yield, carbon sequestration and greenhouse gas emissions from soils planted with rice or leaf beet. J. Taiwan Inst. Chem. Eng. 2013, 44, 1039–1044. [Google Scholar] [CrossRef]
  40. Nelissen, V.; Saha, B.K.; Ruysschaert, G.; Boeckx, P. Effect of different biochar and fertilizer types on N2O and NO emissions. Soil Biol. Biochem. 2014, 70, 244–255. [Google Scholar] [CrossRef]
  41. Bass, A.M.; Bird, M.I.; Kay, G.; Muirhead, B. Soil properties, greenhouse gas emission and crop yield under compost, biochar and co-composted biochar in two tropical agronomic systems. Sci. Total. Environ. 2016, 550, 459–470. [Google Scholar] [CrossRef]
  42. Tan, Z.; Lin, C.S.K.; Ji, X.; Rainey, T.J. Returning biochar to fields: A review. Appl. Soil Ecol. 2017, 116, 1–11. [Google Scholar] [CrossRef]
  43. Wang, J.; Pan, X.; Liu, Y.; Zhang, X.; Xiong, Z. Effects of biochar amendment in two soils on greenhouse gas emissions and crop production. Plant Soil 2012, 360, 287–298. [Google Scholar] [CrossRef]
  44. Zhang, A.; Cui, L.; Pan, G.; Li, L.; Hussain, Q.; Zhang, X.; Zheng, J.; Crowley, D. Effect of biochar amendment on yield and methane and nitrous oxide emissions from a rice paddy from Tai Lake plain, China. Agric. Ecosyst. Environ. 2010, 139, 469–475. [Google Scholar] [CrossRef]
  45. Clough, T.J.; Condron, L.M.; Kammann, C.; Müller, C. A review of biochar and soil nitrogen dynamics. Agronomy 2013, 3, 275–293. [Google Scholar] [CrossRef] [Green Version]
  46. Singla, A.; Inubushi, K. Effect of biochar on CH4 and N2O emission from soils vegetated with paddy. Paddy Water Environ. 2014, 12, 239–243. [Google Scholar] [CrossRef]
  47. Shen, J.; Tang, H.; Liu, J.; Wang, C.; Li, Y.; Ge, T.; Jones, D.L.; Wu, J. Contrasting effects of straw of straw and straw-derived biochar amendments on greenhouse gas emissions within double rice cropping systems. Agric. Ecosyst. Environ. 2014, 188, 264–274. [Google Scholar] [CrossRef]
  48. Spokas, K.A. Impact of biochar field aging on laboratory greenhouse gas production potentials. Glob. Chang. Biol. Bioenergy 2013, 5, 165–176. [Google Scholar] [CrossRef]
  49. Lévesque, V.; Rochette, P.; Ziadi, N.; Dorais, M.; Antoun, H. Mitigation of CO2, CH4 and N2O from a fertigated horticultural growing medium amended with biochars and a compost. Appl. Soil Ecol. 2018, 126, 129–139. [Google Scholar] [CrossRef]
  50. Arshad, M.A.; Lowery, B.; Grossman, B. Physical Tests for Monitoring Soil Quality. In Methods for Assessing Soil Quality; Doran, J.W., Jones, A.J., Eds.; SSSA: Madison, WI, USA, 1996; pp. 123–141. [Google Scholar]
  51. Jien, S.H.; Wang, C.S. Effects of biochar on soil properties and erosion potential in a highly weathered soil. Catena 2013, 110, 225–233. [Google Scholar] [CrossRef] [Green Version]
  52. Song, X.; Pan, G.; Zhang, C.; Zhang, L.; Wang, H. Effects of biochar application on fluxes of three biogenic greenhouse gases: A meta-analysis. Ecosyst. Health Sustain. 2016, 2, e01202. [Google Scholar] [CrossRef] [Green Version]
  53. Rogovska, N.; Laird, D.A.; Karlen, D.L. Corn and soil response to biochar application and stover harvest. Field Crop. Res. 2016, 187, 96–106. [Google Scholar] [CrossRef] [Green Version]
  54. Niu, Y.; Chen, Z.; Müller, C.; Zaman, M.M.; Kim, D.; Yu, H.; Ding, W. Yield-scaled N2O emissions were effectively reduced by biochar amendment of sandy loam soil under maize—Wheat rotation in the North China Plain. Atmos. Environ. 2017, 170, 58–70. [Google Scholar] [CrossRef]
  55. Azeem, M.; Hayat, R.; Hussain, Q.; Ahmed, M.; Pan, G.; Tahir, M.I.; Imran, M.; Irfan, M.; Mehmood-ul-Hassan. Biochar improves soil quality and N2-fixation and reduces net ecosystem CO2 exchange in a dryland legume-cereal cropping system. Soil Tillage Res. 2019, 186, 172–182. [Google Scholar] [CrossRef]
  56. Kelly, C.N.; Calderón, F.C.; Acosta-Martínez, V.; Mikha, M.M.; Benjamic, J.; Rutherford, D.W.; Rostad, C.E. Switchgrass biochar effects on plant biomass and microbial dynamics in two soils from different regions. Pedosphere 2015, 25, 329–342. [Google Scholar] [CrossRef]
Figure 1. The mean temperature, daily precipitation, and field management activity during crop cultivation.
Agronomy 11 01136 g001
Figure 2. Characteristics of crop growth under different biochar application rates. Error bars represent standard deviations (n = 3). Different letters indicate significant differences among treatments at 5% probability level according to Tukey’s test.
Agronomy 11 01136 g002
Figure 3. Changes in the CO2 emission rate and cumulative CO2 flux under different biochar application rates during crop cultivation. Error bars represent standard deviations (n = 3).
Agronomy 11 01136 g003
Figure 4. Changes in the N2O emission rate and cumulative N2O flux under different biochar application rates during crop cultivation. Error bars represent standard deviations (n = 3).
Agronomy 11 01136 g004
Figure 5. Soil properties after field harvest under different biochar application rates. Different letters indicate significant differences among treatments at 5% probability level according to Tukey’s test. *, **, *** denote not significant and significant differences at the 5, 1, and 0.1% levels, respectively.
Agronomy 11 01136 g005
Table 1. Properties of biochar derived from soybean stalk used in this study.
BET SA *YieldpHElemental CompositionMolar Ratio
CHONSH/CO/C(O + N)/C(O + N + S)/C
(m2 g−1)(%)(1:10 H2O)(%)
12730.5 ±
1.76
10.5 ±
0.01
74.1 ±
0.32
2.37 ±
0.07
21.7 ±
0.33
1.37 ±
0.02
0.41 ±
0.00
0.38 ±
0.01
0.22 ±
0.00
0.24 ±
0.00
0.24 ±
0.00
* SA, surface area.
Table 2. Total flux of CO2 and N2O under different biochar application rates during crop cropping, fallow season, and annual.
TreatmentCorn Cropping SeasonFallow SeasonChinese Cabbage Cropping SeasonAnnual
CO2N2OCO2N2OCO2N2OCO2N2O
(g m−2)(mg m−2)(g m−2)(mg m−2)(g m−2)(mg m−2)(g m−2)(mg m−2)
BC0611 ± 80.7 b *385 ± 21.1 a201 ± 16.6 a90.4 ± 9.52 a557 ± 8.8 c285 ± 5.8 a1369 ± 79.8 c760 ± 32.7 a
BC5688 ± 17.4 ab342 ± 11.5 ab201 ± 27.2 a91.9 ± 20.2 a616 ± 70.7 bc246 ± 11.4 ab1505 ± 69.9 bc680 ± 20.5 b
BC10724 ± 50.4 ab325 ± 13.5 ab214 ± 20.6 a93.6 ± 12.3 a693 ± 69.4 abc260 ± 18.9 ab1631 ± 59.4 ab679 ± 16.2 b
BC15771 ± 43.7 ab285 ± 41.7 b208 ± 26.4 a88.3 ± 4.8 a775 ± 63.1 a219 ± 23.4 b1754 ± 91.0 a592 ± 41.8 c
BC20879 ± 122.2 a327 ± 42.7 ab235 ± 34.8 a93.8 ± 16.8 a739 ± 25.9 ab229 ± 25.2 b1853 ± 131.7 a650 ± 12.6 bc
p-value0.0120.0250.5020.9860.0030.010<0.001<0.001
* Different letters within the same column indicate significant differences, as determined by Tukey’s test with p < 0.05.
Publisher’s Note: MDPI stays neutral with regard to jurisdictional claims in published maps and institutional affiliations.

