Article

Frequency of Deoxynivalenol Concentrations above the Maximum Limit in Raw Winter Wheat Grain during a 12-Year Multi-Site Survey

by
Marine Pallez-Barthel
1,*,
Emmanuelle Cocco
1,
Susanne Vogelgsang
2 and
Marco Beyer
1
1
Department Environmental Research and Innovation, Luxembourg Institute of Science and Technology, LIST, 5 Avenue des Hauts Fourneaux, 4362 Esch-sur-Alzette, Luxembourg
2
Agroscope, Competence Division Plants and Plant Products, Reckenholzstrasse 191, 8046 Zurich, Switzerland
*
Author to whom correspondence should be addressed.
Agronomy 2021, 11(5), 960; https://doi.org/10.3390/agronomy11050960
Submission received: 8 April 2021 / Revised: 4 May 2021 / Accepted: 7 May 2021 / Published: 12 May 2021
(This article belongs to the Special Issue Fungal Disease Management and Mycotoxin Prevention in Cereals)

Abstract

:
Mycotoxins such as deoxynivalenol (DON) in wheat grain pose a threat to food and feed safety. Models predicting DON levels mostly require field specific input data that in turn allow predictions for individual fields. To obtain predictions for entire regions, model results from fields commonly have to be aggregated, requiring many model runs and the integration of field specific information. Here, we present a novel approach for predicting the percentage of winter wheat samples with DON levels above the EU maximum legal limit (ML) based on freely available agricultural summary statistics and meteorological data for an entire region using case study data from Luxembourg and Switzerland. The coefficient of variation of the rainfall data recorded ±7 days around wheat anthesis and the percentage of fields with a previous crop of maize were used to predict the countrywide percentage of winter wheat grain samples with DON levels > ML. The relationships found in the present study allow for a better assessment of the risk of obtaining winter wheat samples with DON contaminations > ML for an entire region based on predictors that are freely available in agricultural summary statistics and meteorological data.

1. Introduction

Winter wheat is among the most important crops for human nutrition together with maize and rice. According to the Food and Agricultural Organization of the United Nations (FAO), the global wheat production reached 767 million tons in 2020, corresponding with 28% of the world’s cereal production. Fusarium head blight (FHB) is one of the major cereal diseases. Head blight can be caused by different Fusarium species. Fusarium graminearum and F. avenaceum are frequently found in many European countries while F. poae, F. culmorum, F. cerealis, F. equiseti, F. sporotrichioides and F. tricinctum have been reported more regionally at lower frequencies [1,2,3]. Fusarium species produce secondary metabolites called mycotoxins. The yield losses and mycotoxin contaminations make Fusarium one of the economically most damaging fungal genera. Due to their impact on human and animal health [4,5], but also with regard to national and international trade [6], mycotoxins are among the most important food contaminants. Wheat and maize are the crops in which Fusarium mycotoxins occur most frequently and where they are of greatest concern from both a health and economic perspective [7].
Trichothecenes are one of the major classes of mycotoxins including more than 200 secondary metabolites [8]. Fusarium species can produce type A and type B trichothecenes [9,10]. Deoxynivalenol (DON) and its acetylated forms are among the most abundant type B trichothecenes primarily produced by F. graminearum and F. culmorum [1,11,12]. DON may induce nausea, diarrhea and vomiting (hence, the common name of vomitoxin). In terms of animal health, DON can affect the immune system as well as intestinal functions, impact growth and weight gain and induce vomiting [13,14,15,16]. DON contaminations are mainly found in wheat and maize but also in barley, rye, oat and rice. Previous reports indicated that in Europe, between approximately 50% [17] and 56% [18] of cereal-based samples contained DON in quantifiable amounts especially in wheat and maize. In order to limit the impact of mycotoxins on human and animal nutrition, many countries have established legal maximum limits (MLs) or guidance levels [19]. The European Commission (EC), the Food and Drug Administration (FDA) and the Chemical Inspection and Regulation Service in China [20] have, for example, established regulatory limits depending on the cereal concerned, the human or animal sector, the processed products and the consumer age (babies or adults) concerned. According to the European regulation EC No 1881/2006 (amended by n°1126/2007), the maximum limit for DON in unprocessed cereals is 1250 µg/kg. Several surveys were published on mycotoxin occurrence from various regions of the world [5,12,21,22,23,24,25,26,27,28,29,30,31,32]. The presence of DON in grains is strongly dependent on the year and environmental factors such as weather conditions particularly during the period of wheat anthesis. Beyer et al. [33] and Blandino et al. [34] demonstrated an important role of the previous crop and cultivar susceptibilities at the field level. Cultivar susceptibility is usually evaluated at the level of disease symptoms rather than at the level of toxin concentrations and is listed along with other cultivar traits by national institutions such as the German Federal Office for Plant Varieties (BSA) [35]. Previous models predicted DON concentrations for a specific location [36,37,38]. To obtain results on the risk for an entire region, many model runs requiring the full set of input variables must be done for many locations in the region under investigation with these models. So far, information on potential predictors that can be retrieved from open access agricultural summary statistics or meteorological data for the percentage of wheat samples with DON concentrations above the ML at the scale of entire regions is scarce.
The objectives of the present study were (1) to identify potential predictors for DON concentrations > 1250 µg/kg at the level of an entire region and (2) to determine the frequency of raw winter wheat grain samples with DON contents > 1250 µg/kg based on a long-term, multi-site monitoring campaign as an additional input for the risk assessment on mycotoxin contamination.

2. Materials and Methods

2.1. Sampling and Agronomic Information

Between 2007 and 2018, commercial wheat fields covering all regions of Luxembourg were selected for each year. The number of sampling locations was 172 (Table 1). For each location, at least two fields with different previous crops were selected. Agronomic data of the fields (previous crop, tillage) and maps with the position of the fields were provided by the Chambre d’Agriculture de Luxembourg (https://www.lwk.lu/, accessed on 8 May 2021) after obtaining permission from the respective farmers. Sampling locations are mapped for each year of the monitoring campaign in Figure 1.
The sampling was done between the plant growth stages 90 and 93 (Zadoks scale). From each field, 0.5 square meters of wheat heads were sampled randomly from two positions within each field. Hence, two samples were available per field except for the years 2007 and 2008 [39] where only one sample from one field per location was taken due to the sampling pattern of the previous, initial project. Wheat heads were dried at 30 °C overnight in an oven and subsequently threshed using a Minibatt grain sample harvester (Reichardt, Hungen, Germany). Cultivar susceptibility rankings for the symptom of FHB were taken from the BSA [35]. The susceptibility scale ranged from 1 (not susceptible) to 9 (very susceptible). The number of samples from cultivars with susceptibility ranks of 3, 4, 5 and 6 were 15, 382, 129 and 19, respectively. A total of 130 out of 714 samples originated from cultivars for which no susceptibility ranks were available because these cultivars were not evaluated by the BSA [35]. In addition to the data from Luxembourg, data from Switzerland previously published by Vogelgsang et al. [40] were used.

2.2. Mycotoxin Analysis

All reagents used for this study were of trace analytical grade (Carl Roth GmbH, Karlsruhe, Germany). DON standards were purchased from LGC Standards (Molsheim, France). Water used for the analytical part was purified by a Milli-Q system (Millipore, Bedford, MA, USA).
After threshing the wheat heads, flour was obtained by grinding 500 g of grains in an ultra-centrifugal mill ZM 200 (Retsch GmbH, 42781 Haan, Germany) using a ring sieve with an aperture size of 1 mm.
Analyses were performed on 5 g of flour added to 15 mL of acetonitrile/water (80/20, v/v). Tubes were vortexed and agitated for 10 min at 10 Hz with a mixer mill MM400 (Retsch). A supernatant aliquot was filtered through a 0.20 mm GHP membrane filter (PAL) after a centrifugation step (4700 rpm, 15 min, 20 °C, Multifuge X3R, Thermo, Waltham, MA, USA). To reduce the matrix effects and to be in the appropriate solvent ratio for a chromatographic analysis, the extracts were diluted ten times in water. Prior to the analysis, extracts were stored for 1 h at 4 °C. Two analytical systems were used during this 12-year survey for DON quantification depending upon the availability of the machine.
For the samples from 2007 to 2013 and 2016 to 2018, the method described in [39] was used for DON quantification.
In 2014 and 2015, an ultra-high performance liquid chromatograph coupled to a hybrid mass spectrometer was used (UHPLC, Infinity 1260, Agilent; Q Trap 4500 AB Sciex, Santa Clara, CA, USA) incorporating electrospray ionization in multiple reaction monitoring (MRM) with a negative mode set to detect DON. A Zorbax Eclipse Plus C18 column was used (3.5 µm, 2.1 mm × 150 mm, Agilent Technologies, Santa Clara, CA, USA) at 40 °C with a mobile phase consisting of methanol and water containing 2.5 mM ammonium acetate. The quantification was based on external standards (from 1.5 to 250 ng/mL) and by measuring 295, 265 and 138 fragmentation ions from a precursor ion adduct 355. In addition, 13C15 DON was used as an internal standard.
The relevance of the extraction and analytical procedure was verified using a certified reference material (LGC Standards, Molsheim, France). For each sample set, this analysis was performed resulting in an average concentration of 442 ± 67 (mean ± standard deviation, n = 61) for a certified concentration of 474 µg/kg.

2.3. Weather Data

Weather data were recorded by automatic weather stations. The positions of the weather stations and the weather data can be downloaded at www.agrimeteo.lu, accessed on 8 May 2021. Time series with data gaps were excluded from the analysis. The network of weather stations was continuously expanded during the period of observation such that complete data from 16 (2007) to 36 (2016) weather stations were available. Daily precipitation data starting one week before the full anthesis of winter wheat and ending one week after the peak of winter wheat anthesis were downloaded and used for a further analysis. This period is subsequently referred to as “around anthesis”. The period of anthesis was determined by weekly assessments at four locations (one each in the northern, southern, western and eastern regions of Luxembourg) as previously described in Aslanov et al. [41]. The distance between the fields sampled in the present study and the fields where the growth stages were assessed was determined using the using the “near” tool of the software package ArcGIS (ArcGIS software 10.0) as previously described by Beyer et al. [42]. The plant growth stages in the sampling fields were assumed to be the same as the ones in the closest plant growth stage assessment field.

2.4. Statistical Analyses

The sum of the daily precipitation data over the period ±7 days around the day of peak anthesis was calculated for each weather station. Subsequently, the coefficient of variation (CV) from the resulting data of all available weather stations was calculated for each year. This CV thus reflected the variability among the weather stations in relation to the mean precipitation around wheat anthesis.
The relationships between the CVs, the percentage of fields with previous crop maize, the cultivar susceptibility rankings and the annual percentage of samples with DON levels > 1250 µg/kg were described using linear or sigmoidal regression models (software package SigmaPlot version 13). The equations, regression coefficients and coefficients of determination are given in the figures where the regression lines are shown.
The frequencies were compared using two-sided chi-squared tests (software package SPSS version 19, IBM Corporation, Armonk, New York, USA). The effects were considered to be significant when the P-values were lower than 0.05.

3. Results

Between 2007 and 2018, 172 fields were sampled for a total number of 714 samples analyzed (for details, please see Supplementary Table S1).

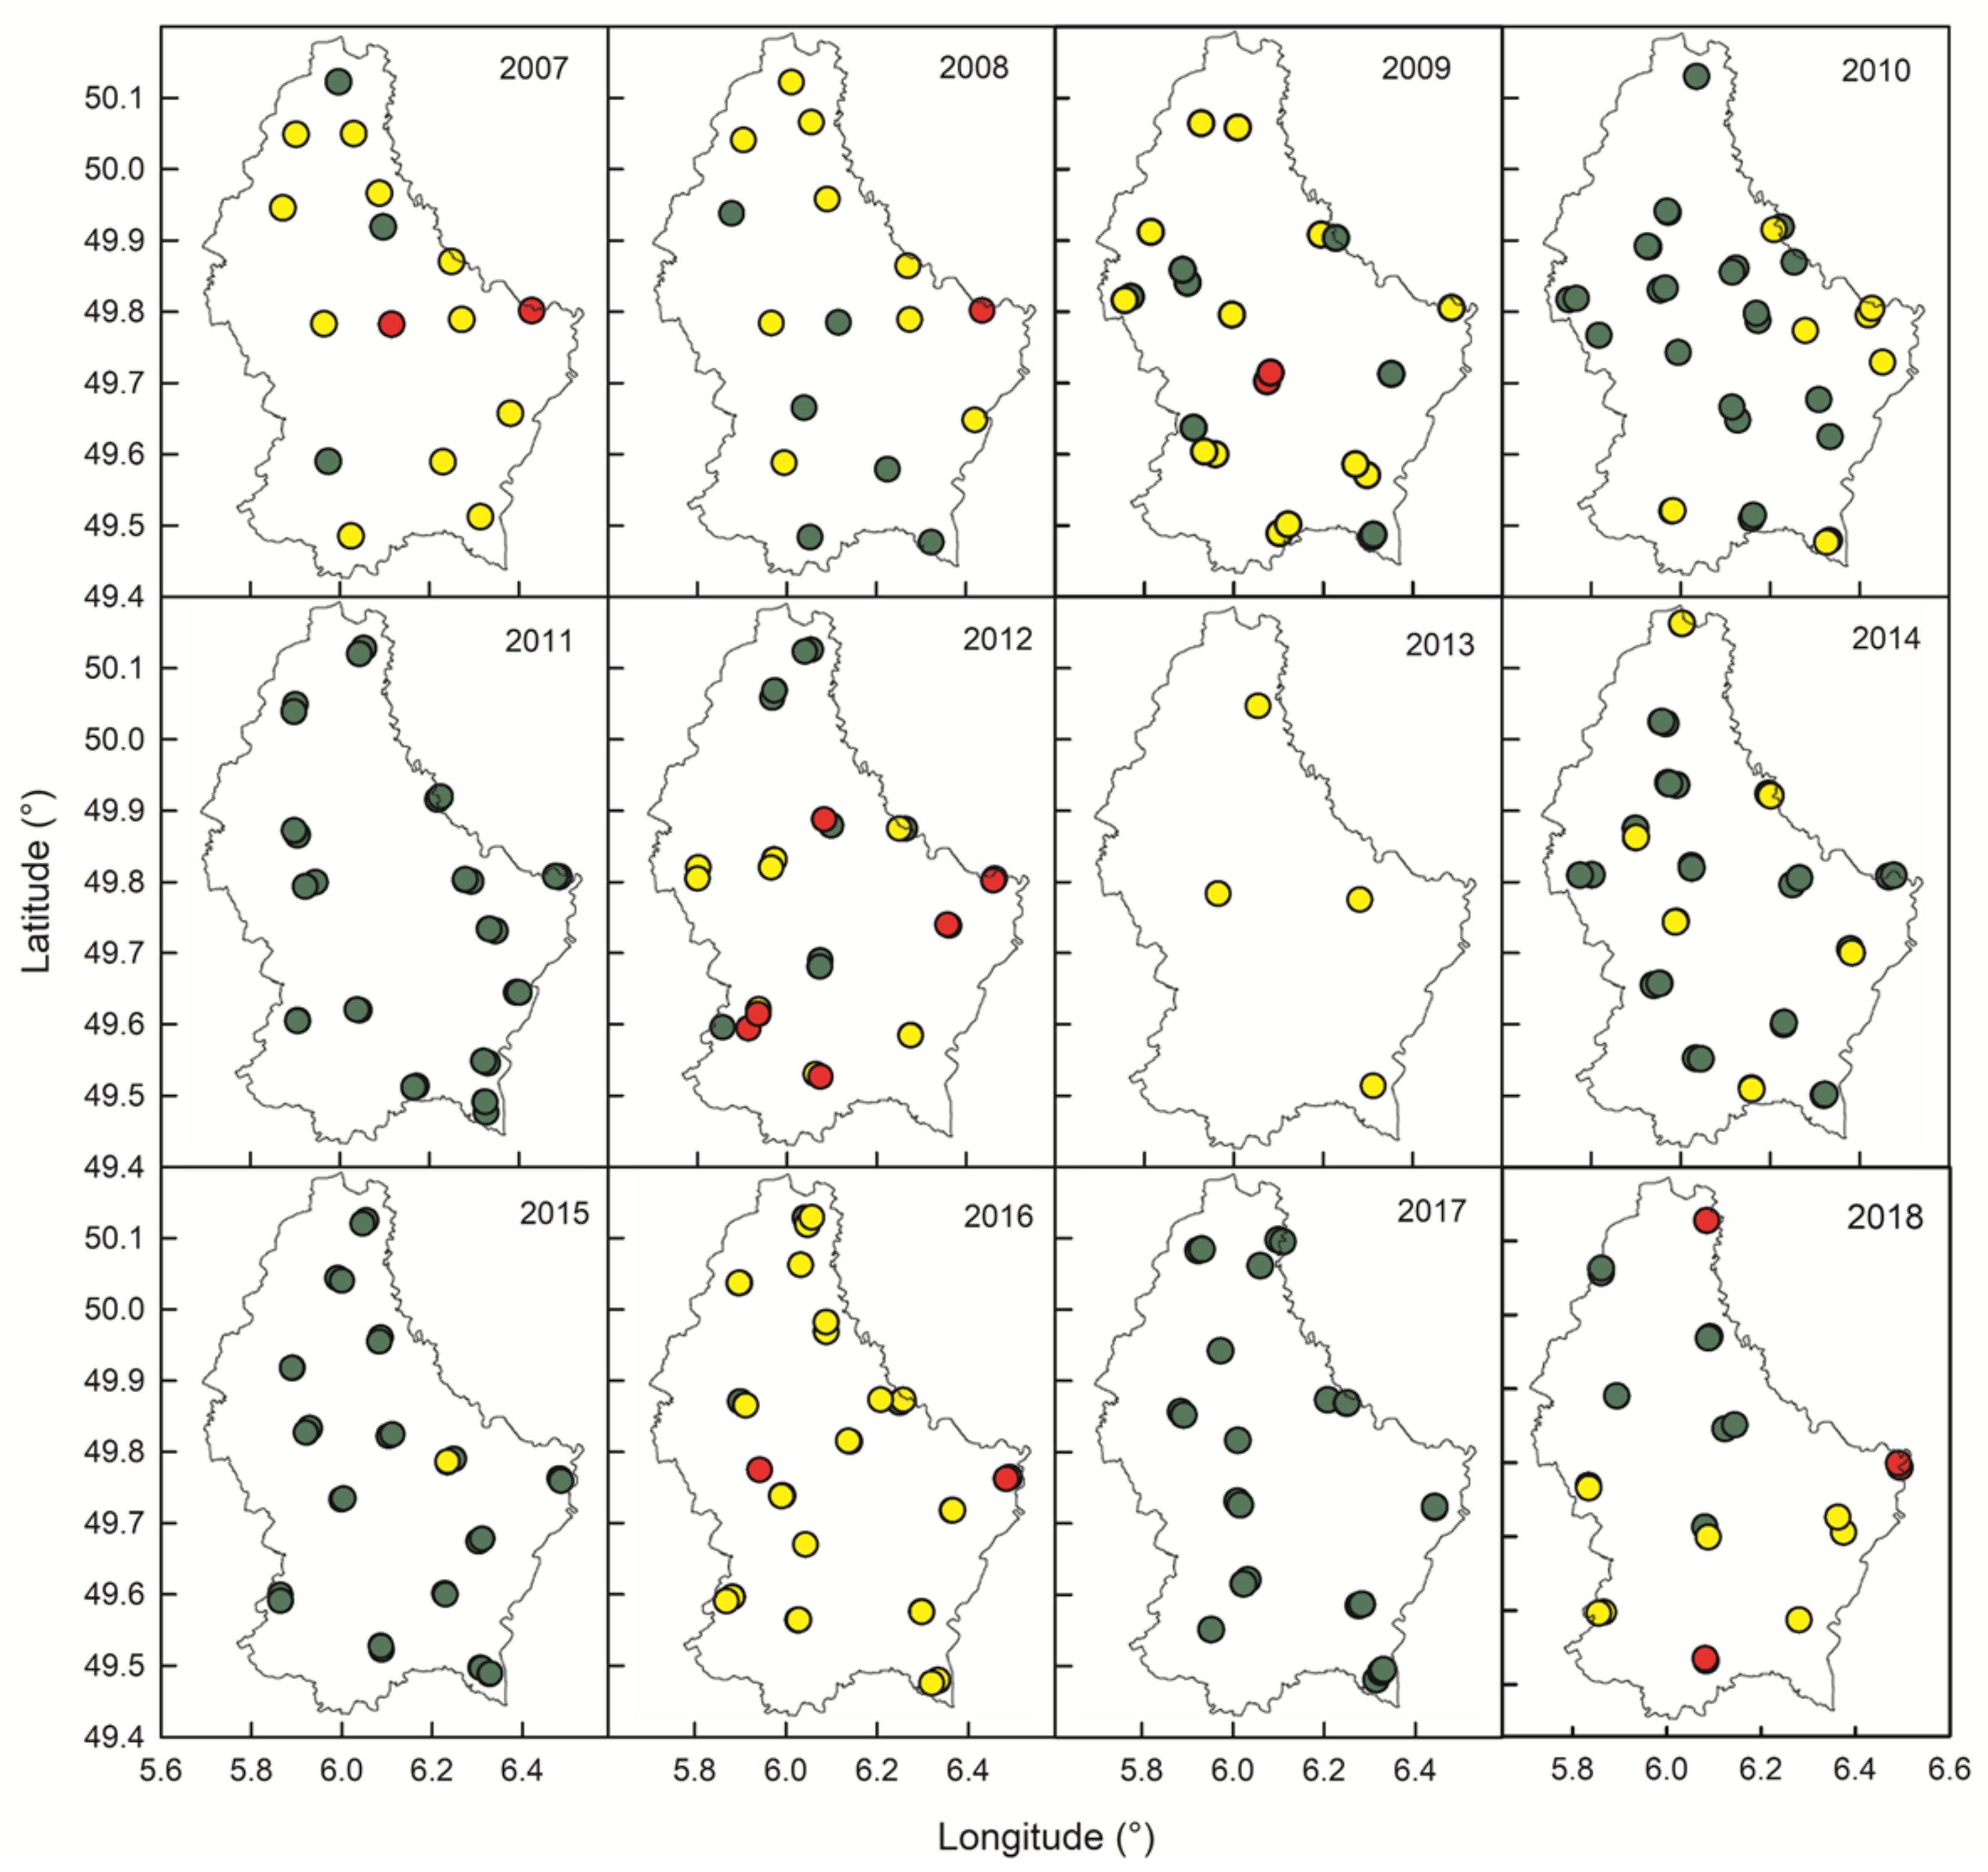
3.1. Spatial Distribution of Contaminated Samples

DON concentrations higher than 1250 µg/kg were found in 2007, 2008, 2009, 2012, 2016 and 2018 (Table 1) but were variable depending on the region (Figure 1). In fact, DON concentrations > 1250 µg/kg were observed in six out of twelve years in the east, in three out of twelve years in the center, twice in the south and once in the west. The high frequency of DON levels > 1250 µg/kg in the east was not significantly related (p > 0.05) to the susceptibility ranks of the cultivars grown there, the previous crop alone (maize versus others) or the tillage system alone (plough versus minimum tillage). The combination of a previous crop of maize with minimum tillage was not more common within the hotspot than elsewhere (p > 0.05). Rainfall during anthesis was lower than the countrywide average at the weather station in the eastern DON hotspot in 2008 and 2012 but higher in 2007, 2009, 2016 and 2018 (p < 0.041). Other years were not included in the rainfall analysis because for those years, no DON levels > 1250 µg/kg were observed, suggesting that weather conditions were insufficient for exceeding the ML.

3.2. Inter-Annual and Annual Variability of DON Contents

A chemical analysis by HPLC-MS/MS revealed that 33% of the samples analyzed were contaminated with DON (range from 76 (LoQ) to 9247 µg/kg) (Table 1). The percentage of contaminated samples varied greatly from year to year with 0% in 2011 and 83% in 2007. A total of 37 out of 714 (=5%) raw winter wheat samples contained DON levels > 1250 µg/kg. In 6 out of 12 years (2010, 2011, 2013, 2014, 2015 and 2017), no samples with DON levels > 1250 µg/kg were found (Table 1). In the remaining years, the percentage of samples with DON levels > 1250 µg/kg ranged from 4% in 2009 to 26% in 2012 (Table 1).
A high number of contaminated samples did not necessarily result in high levels of DON. For example, in 2007, 82% of the samples were contaminated with DON but only 12% were above the maximum level of 1250 µg/kg set by the EU. In 2012, 54% of the samples contained DON and 26% contained DON at levels above the ML. DON concentrations found in commercial wheat samples collected over the 12-year period are shown in Figure 2 (maximum, mean, median). For the calculation of the means and the medians, samples with DON levels below the LoQ were set equal to the LoQ (76 µg/kg). The distribution of DON values was characterized by many small values and a few high levels and a large variability of variances was observed between years (Figure 2). Every four years, a peak in the DON values was observed (Figure 2).

3.3. Effect of Weather and Previous Crop on the Percentage of Samples with DON > ML

A close non-linear relationship was observed between the coefficient of variation (CV) calculated from the rainfall data during the period around wheat anthesis (Figure 3A, r2 = 0.74 **). Low CVs were associated with high percentages of samples with DON levels > 1250 µg/kg (Figure 3A). The minimum average precipitation of all weather stations for a year with DON values > 1250 µg/kg was 51 mm in 2008 in Luxembourg. Hence, years with more precipitation were considered to be wet years while years with less precipitation were considered to be dry years. Another non-linear relationship (r2 = 0.74 *) was found between the percentage of fields with a previous crop of maize and the percentage of samples with DON levels > 1250 µg/kg for more wet years (≥51 mm rain in the week prior plus the week after the day of maximum anthesis). However, no relationship was found for drier years (<51 mm rain in the week prior plus the week after the day of maximum anthesis, Figure 3B). Note that the latter relationships comprise data that were recorded in course of the present study as well as data previously published from Switzerland [40], suggesting that the relationship has more than a local relevance. The effect of cultivar susceptibility rankings towards FHB symptom expression on the annual percentage of samples with DON levels > 1250 µg/kg was not significant (p > 0.05) basically because samples from cultivars with a relatively low susceptibility rank of 3 contained high DON levels in the year with the highest disease pressure (2012).

4. Discussion

4.1. Considerations on Temporal Risk Dynamics

DON levels above 1250 µg/kg were observed in 6 out of 12 years, indicating that there was on average a risk of relevant DON contamination almost every second year. The 12-year data available suggested that peak DON levels must be expected approximately every four years in Luxembourg. It may be speculated that this pattern could be the result of numerous farmers following the same scheme of crop rotation. However, this was not the case. The governments in the regions studied established incentives to diversify crop rotations and these programs have been largely accepted in the farming community. The reason for this pattern is currently unknown but for potential forecasts, this effect is of high interest.

4.2. Novelty

The meteorological conditions were demonstrated to have a strong impact on the DON content at the level of individual grain samples or fields [43,44,45]. Predictive models were developed over the years as a decision support tool for famers to deal with protection of the grains and for avoiding unnecessary fungicide applications [38]. Decision support tools often require detailed information such as the previous crop, growth stage, tillage system and cultivar susceptibility for each field [38,46,47,48,49]. They are mostly valid in the specific country or area where they were developed and need adaptation or additional validation when being used elsewhere. To the best of our knowledge, variability parameters such as coefficients of variation of rain data have not been used before for estimating DON levels. The close relationship found in Figure 3A suggested that precipitation (62.8 ± 13.9 mm in the two weeks around anthesis in the worst year, 2012) with little variation between locations throughout a region was needed to obtain high percentages of winter wheat grain samples with DON levels > 1250 µg/kg. The data needed for taking advantage of the relationships found here are available from meteorological services and agricultural statistics in many countries (e.g., agrimeteo.lu, https://agriculture.public.lu/dam-assets/publications/ser/statistiques/landwirtschaft-in-zahlen/the-agriculture-of-luxembourg-2016.pdf, https://www.dwd.de/DE/leistungen/klimadatendeutschland/klimadatendeutschland.html, https://donneespubliques.meteofrance.fr/, accessed on 8 May 2021) and may therefore be used without a need for many model runs that predict DON levels pointwise.

4.3. Spatial Aspects

A hotspot with DON levels > 1250 µg/kg in 5 out of 12 years was found in the east of the country. The cultivar susceptibility ranks towards FHB were similar within the hotspot compared with the entire country. The combination of a previous crop of maize with minimum tillage was not more common within the hotspot than elsewhere. The rainfall during anthesis was lower than the countrywide average at the weather station in the eastern DON hotspot in 2008 and 2012 but higher in 2007, 2009, 2016 and 2018 (p < 0.05). Other years were not included in the rainfall analysis because for those years, no DON levels > 1250 µg/kg were observed suggesting that weather conditions were insufficient for exceeding the ML. Hence, the reason for the high frequency of samples with DON levels > 1250 µg/kg in the hotspot may be related to wetter conditions during anthesis even though this effect was not perfectly consistent among years.
In Europe, F. graminearum, F. avenaceum, F. poae and F. culmorum are the dominant species. Fusarium graminearum is the main FHB causing species in the southern and central parts of Europe. In the northern part, F. graminearum has been spreading in recent years and has now replaced F. culmorum as the main producer of DON [50]. For Luxembourg, it was previously demonstrated that F. graminearum is dominant on wheat heads in wet years while F. culmorum can be the most frequently isolated species in dry years [45]. Climate change is likely to affect the composition of regional Fusarium species as well as the frequency and severity of critical rainfall periods and, consequently, mycotoxin concentration risks [7,19]. An increase of the proportion of F. graminearum has been reported in northern countries or cooler climates such as the Netherlands [51] and the UK [52]. Even though Figure 3B suggests that the percentage of fields with a previous crop of maize allowed for the estimation of the percentage of winter wheat samples with DON levels > 1250 µg/kg in Luxembourg and Switzerland, this result should not be extrapolated to other regions without validation, particularly not to regions with significantly different compositions of Fusarium species. Major spatial Fusarium species and chemotype distributions for Europe can be found in Pasquali et al. [53].

4.4. Considerations on the Role of Cultivars

Cultivar susceptibility towards FHB is commonly assessed by visual symptom evaluation. However, previous studies [54,55] demonstrated that correlations between symptoms and DON are close within cultivars and years but vary not only among cultivars but also among years even more so. In the present study based on a monitoring of real farming conditions, all cultivars were selected by farmers and were of moderate resistance. Hence, differences among cultivars were rather small and non-significant. In experimental settings where more resistant and more susceptible cultivars are included than in the present study, a significance of the cultivar effect can be expected [56].

4.5. Other Factors Affecting DON Production under Field Conditions

In addition to the factors of rain during anthesis and the previous crop that have been considered in the present study, cultivar susceptibility (discussed above) and tillage had a significant impact on DON levels while reports on the effects of nitrogen fertilization and growth regulators were inconsistent [33]. Considering information on tillage would probably allow for a more precise estimation of the percentage of samples with DON levels > ML. This information is, however, not included in standard agricultural statistics published by national authorities at the moment and is therefore hard to acquire. Relative humidity (>80%) and temperature during the anthesis time have repeatedly been shown to be crucial for DON levels at the field scale [37,43]. An increase in temperature coupled with an increase in precipitation would have a positive impact on the contamination of Fusarium spp. and therefore on the production of DON. However, as shown by Birr et al, 2019 [37], the relationship between the precipitation parameter during anthesis alone and DON content is much more robust than the relationship between temperature and DON content. In the present study, by using precipitation data freely available in agricultural summary statistics and meteorological data, we were able to forecast the risk of obtaining winter wheat samples with DON contaminations > ML with reasonable accuracy (r2 = 0.74). This prediction has a strong impact on food safety.

4.6. Comparison with Other European Surveys

Numerous studies have been published on mycotoxin occurrence from various regions of the world and on DON contamination in cereals in Europe during the past 20 years. Our study showed that 33% out of the 714 winter wheat samples analyzed contained levels of DON above the LoQ over the period 2007–2018. A high variability was detected in European countries such as 28% in Serbia [57], 23% in Albania (2014–2015) [58], 30% in samples from Finland, 21% from Sweden, 29% from Norway, 71% from the Netherlands (1990–2009) [59], 59% in Italy (2009–2010) [60], 94% in Finland (2013) [61] and 47% in Poland [62]. According to a BIOMIN survey in 2019 [18], DON prevalence was estimated to be 56% (up to 22,000 µg/kg) over 2011 cereal samples tested. Likewise, another European survey [63] on 11 countries confirmed the previous number with 61% of positive wheat samples.
All of these studies were performed on a short period with one, two or three years of sampling or it has been shown that the amount of mycotoxins is highly dependent on external factors such as environmental/meteorological conditions, fungal species and agronomical parameters [40,64]. Mycotoxin production is highly related to the weather conditions, particularly during the anthesis period. All of these conditions will lead to major changes in the mycotoxin occurrence from year to year, as shown by Uhlig et al. [65]. As it is still difficult to publish results from surveys with low mycotoxin levels, there is a bias risk that data from years with high DON levels are more likely to be published. Therefore, long-term data from the same region with sampling campaigns every year are necessary to provide a realistic picture of the overall risk and the frequency of contaminations. Only a few long-term analyses have been run in Europe. Switzerland carried out monitoring between 2007 and 2014 and highlighted that DON was detected in 80% of the samples while levels exceeding the European limit for unprocessed cereals for foodstuffs were observed in 11% (0–7%) of the samples [66]. In a joint survey between Finland, Sweden, Norway and the Netherlands during the period 1990–2009, 3% of the wheat samples were above the ML [59]. Similar results were observed in Norway between 2004 and 2009 with 9% of the samples exceeding the threshold [67]. The rate of contaminated samples can reach much higher levels as demonstrated by Chandelier et al. (2011) [68] in Belgium, where the range of samples containing more than 1250 µg/kg DON was between 0% in 2005 and 2006 campaigns and 36% in 2007. Similar results were found in our study with high disparities between years at the level of DON occurrence as well as the percentage of samples above the European ML.

5. Conclusions

In the current study, we were able to estimate the annual percentage of samples with DON levels > 1250 µg/kg with reasonable accuracy (r2 = 0.74) from the coefficient of variation (CV) of precipitation data recorded by weather stations scattered across Luxembourg in the week before and after wheat anthesis. Furthermore, the annual percentage of samples with DON levels > 1250 µg/kg could be estimated from the percentage of fields with a previous crop of maize in Luxembourg and Switzerland (r2 = 0.74). The latter relationship was only observed for wet years but did not hold true for dry years. The relationships found here may help estimate the percentage of winter wheat lots with critical DON levels from an entire region. This estimate may have a direct interest for authorities but also for post-harvest stakeholders in order to estimate the quality of the grains as well as possible outlets on the grain market. The present results should not be extrapolated to regions where Fusarium species other than F. graminearum sensu stricto dominate the species composition on wheat heads.

Supplementary Materials

The following are available online at https://www.mdpi.com/article/10.3390/agronomy11050960/s1, Table S1: Years, locations, winter wheat cultivars, previous crops and deoxynivalenol (DON) concentrations of winter wheat samples from Luxembourg.

Author Contributions

Conceptualization, M.P.-B. and M.B.; data curation, M.P.-B., S.V. and M.B.; formal analysis, M.P.-B. and M.B.; methodology, M.P.-B., E.C., S.V.; supervision, S.V. and M.B.; visualization, M.B.; writing—original draft preparation, M.P.-B. and M.B.; writing—review and editing, all. All authors have read and agreed to the published version of the manuscript.

Funding

This work was financed by the Administration des Services Techniques de l’Agriculture (project SENTINELLE).

Institutional Review Board Statement

Not applicable. This study did not involve humans or animals.

Data Availability Statement

Weather data from Luxembourg can be found at https://www.agrimeteo.lu; agricultural statistics are available at https://agriculture.public.lu/dam-assets/publications/ser/statistiques/landwirtschaft-in-zahlen/the-agriculture-of-luxembourg-2016.pdf (accessed on 8 May 2021). Locations and DON concentrations can be found in the Supplementary Table S1.

Acknowledgments

We thank Jeanny Dondelinger from the Chambre d’Agriculture in Luxembourg for preparing maps and providing information on previous crops of the sampled fields. We also thank Matias Pasquali, Servane Contal, Boris Untereiner, Friederike Pogoda, Tiphaine Dubos and Frédéric Giraud for collecting samples. We would like to acknowledge Kate Buckeridge for her help in the proofreading of the manuscript.

Conflicts of Interest

The authors declare no conflict of interest.

References

  1. Bottalico, A.; Perrone, G. Toxigenic Fusarium Species and Mycotoxins Associated with Head Blight in Small-Grain Cereals in Europe. Eur. J. Plant Pathol. 2002, 108, 611–624. [Google Scholar] [CrossRef]
  2. Ioos, R.; Belhadj, A.; Menez, M. Occurrence and Distribution of Microdochium nivale and Fusarium Species Isolated from Barley, Durum and Soft Wheat Grains in France from 2000 to 2002. Mycopathologia 2004, 158, 351. [Google Scholar] [CrossRef] [PubMed]
  3. Ibáñez-Vea, M.; Lizarraga, E.; González-Peñas, E.; López de Cerain, A. Co-Occurrence of Type-A and Type-B Trichothecenes in Barley from a Northern Region of Spain. Food Control 2012, 25, 81–88. [Google Scholar] [CrossRef]
  4. Capriotti, A.L.; Foglia, P.; Gubbiotti, R.; Roccia, C.; Samperi, R.; Laganà, A. Development and Validation of a Liquid Chromatography/Atmospheric Pressure Photoionization-Tandem Mass Spectrometric Method for the Analysis of Mycotoxins Subjected to Commission Regulation (EC) No. 1881/2006 in Cereals. J. Chromatogr. A 2010, 1217, 6044–6051. [Google Scholar] [CrossRef]
  5. Pleadin, J.; Vahčić, N.; Perši, N.; Ševelj, D.; Markov, K.; Frece, J. Fusarium Mycotoxins’ Occurrence in Cereals Harvested from Croatian Fields. Food Control 2013, 32, 49–54. [Google Scholar] [CrossRef]
  6. Siegel, D.; Babuscio, T. Mycotoxin Management in the European Cereal Trading Sector. Food Control 2011, 22, 1145–1153. [Google Scholar] [CrossRef]
  7. Moretti, A.; Pascale, M.; Logrieco, A.F. Mycotoxin Risks under a Climate Change Scenario in Europe. Trends Food Sci. Technol. 2019, 84, 38–40. [Google Scholar] [CrossRef]
  8. Pestka, J.J. Deoxynivalenol: Mechanisms of Action, Human Exposure, and Toxicological Relevance. Arch. Toxicol. 2010, 84, 663–679. [Google Scholar] [CrossRef]
  9. Krska, R.; Baumgartner, S.; Josephs, R. The State-of-the-Art in the Analysis of Type-A and -B Trichothecene Mycotoxins in Cereals. Fresenius J. Anal. Chem. 2001, 371, 285–299. [Google Scholar] [CrossRef]
  10. McCormick, S.P.; Stanley, A.M.; Stover, N.A.; Alexander, N.J. Trichothecenes: From Simple to Complex Mycotoxins. Toxins 2011, 3, 802–814. [Google Scholar] [CrossRef]
  11. Cui, L.; Selvaraj, J.N.; Xing, F.; Zhao, Y.; Zhou, L.; Liu, Y. A Minor Survey of Deoxynivalenol in Fusarium Infected Wheat from Yangtze–Huaihe River Basin Region in China. Food Control 2013, 30, 469–473. [Google Scholar] [CrossRef]
  12. Lee, H.J.; Ryu, D. Worldwide Occurrence of Mycotoxins in Cereals and Cereal-Derived Food Products: Public Health Perspectives of Their Co-Occurrence. J. Agric. Food Chem. 2017, 65, 7034–7051. [Google Scholar] [CrossRef]
  13. Sobrova, P.; Adam, V.; Vasatkova, A.; Beklova, M.; Zeman, L.; Kizek, R. Deoxynivalenol and Its Toxicity. Interdiscip. Toxicol. 2010, 3, 94–99. [Google Scholar] [CrossRef]
  14. Pinton, P.; Oswald, I.P. Effect of Deoxynivalenol and Other Type B Trichothecenes on the Intestine: A Review. Toxins 2014, 6, 1615–1643. [Google Scholar] [CrossRef]
  15. Payros, D.; Alassane-Kpembi, I.; Pierron, A.; Loiseau, N.; Pinton, P.; Oswald, I.P. Toxicology of Deoxynivalenol and Its Acetylated and Modified Forms. Arch. Toxicol. 2016, 90, 2931–2957. [Google Scholar] [CrossRef]
  16. Freire, L.; Sant’Ana, A.S. Modified Mycotoxins: An Updated Review on Their Formation, Detection, Occurrence, and Toxic Effects. Food Chem. Toxicol. 2018, 111, 189–205. [Google Scholar] [CrossRef]
  17. European Food Safety Authority. Deoxynivalenol in Food and Feed: Occurrence and Exposure. EFSA J. 2013, 11, 3379. [Google Scholar] [CrossRef]
  18. 2019 BIOMIN World Mycotoxin Survey Report. Available online: https://www.biomin.net/downloads/2019-biomin-world-mycotoxin-survey-report/ (accessed on 12 January 2021).
  19. Eskola, M.; Altieri, A.; Galobart, J. Overview of the Activities of the European Food Safety Authority on Mycotoxins in Food and Feed. World Mycotoxin J. 2018, 11, 277–289. [Google Scholar] [CrossRef]
  20. Ji, X.; Yang, H.; Wang, J.; Li, R.; Zhao, H.; Xu, J.; Xiao, Y.; Tang, B.; Qian, M. Occurrence of Deoxynivalenol (DON) in Cereal-Based Food Products Marketed through e-Commerce Stores and an Assessment of Dietary Exposure of Chinese Consumers to DON. Food Control 2018, 92, 391–398. [Google Scholar] [CrossRef]
  21. Jajić, I.; Jurić, V.; Abramović, B. First Survey of Deoxynivalenol Occurrence in Crops in Serbia. Food Control 2008, 19, 545–550. [Google Scholar] [CrossRef]
  22. Malachova, A.; Dzuman, Z.; Veprikova, Z.; Vaclavikova, M.; Zachariasova, M.; Hajslova, J. Deoxynivalenol, Deoxynivalenol-3-Glucoside, and Enniatins: The Major Mycotoxins Found in Cereal-Based Products on the Czech Market. J. Agric. Food Chem. 2011, 59, 12990–12997. [Google Scholar] [CrossRef] [PubMed]
  23. Del Ponte, E.M.; Garda-Buffon, J.; Badiale-Furlong, E. Deoxynivalenol and Nivalenol in Commercial Wheat Grain Related to Fusarium Head Blight Epidemics in Southern Brazil. Food Chem. 2012, 132, 1087–1091. [Google Scholar] [CrossRef] [Green Version]
  24. Fredlund, E.; Gidlund, A.; Sulyok, M.; Börjesson, T.; Krska, R.; Olsen, M.; Lindblad, M. Deoxynivalenol and Other Selected Fusarium Toxins in Swedish Oats—Occurrence and Correlation to Specific Fusarium Species. Int. J. Food Microbiol. 2013, 167, 276–283. [Google Scholar] [CrossRef] [PubMed]
  25. Vidal, A.; Marín, S.; Ramos, A.J.; Cano-Sancho, G.; Sanchis, V. Determination of Aflatoxins, Deoxynivalenol, Ochratoxin A and Zearalenone in Wheat and Oat Based Bran Supplements Sold in the Spanish Market. Food Chem. Toxicol. 2013, 53, 133–138. [Google Scholar] [CrossRef] [Green Version]
  26. Běláková, S.; Benešová, K.; Čáslavský, J.; Svoboda, Z.; Mikulíková, R. The Occurrence of the Selected Fusarium Mycotoxins in Czech Malting Barley. Food Control 2014, 37, 93–98. [Google Scholar] [CrossRef]
  27. Kirinčič, S.; Škrjanc, B.; Kos, N.; Kozolc, B.; Pirnat, N.; Tavčar-Kalcher, G. Mycotoxins in Cereals and Cereal Products in Slovenia—Official Control of Foods in the Years 2008–2012. Food Control 2015, 50, 157–165. [Google Scholar] [CrossRef]
  28. Lindblad, M.; Gidlund, A.; Sulyok, M.; Börjesson, T.; Krska, R.; Olsen, M.; Fredlund, E. Deoxynivalenol and Other Selected Fusarium Toxins in Swedish Wheat—Occurrence and Correlation to Specific Fusarium Species. Int. J. Food Microbiol. 2013, 167, 284–291. [Google Scholar] [CrossRef]
  29. Bryła, M.; Ksieniewicz-Woźniak, E.; Waśkiewicz, A.; Szymczyk, K.; Jędrzejczak, R. Natural Occurrence of Nivalenol, Deoxynivalenol, and Deoxynivalenol-3-Glucoside in Polish Winter Wheat. Toxins 2018, 10, 81. [Google Scholar] [CrossRef] [Green Version]
  30. Han, Z.; Nie, D.; Ediage, E.N.; Yang, X.; Wang, J.; Chen, B.; Li, S.; On, S.L.W.; De Saeger, S.; Wu, A. Cumulative Health Risk Assessment of Co-Occurring Mycotoxins of Deoxynivalenol and Its Acetyl Derivatives in Wheat and Maize: Case Study, Shanghai, China. Food Chem. Toxicol. 2014, 74, 334–342. [Google Scholar] [CrossRef]
  31. Hietaniemi, V.; Rämö, S.; Yli-Mattila, T.; Jestoi, M.; Peltonen, S.; Kartio, M.; Sieviläinen, E.; Koivisto, T.; Parikka, P. Updated Survey of Fusarium Species and Toxins in Finnish Cereal Grains. Food Addit. Contam. Part A Chem. Anal. Control Expo Risk Assess. 2016, 33, 831–848. [Google Scholar] [CrossRef]
  32. Joint FAO/WHO Expert Committee on Food Additives. Safety Evaluation of Certain Mycotoxins in Food; FAO: Rome, Italy, 2001; ISBN 978-92-5-104664-7. [Google Scholar]
  33. Beyer, M.; Klix, M.B.; Klink, H.; Verreet, J.-A. Quantifying the Effects of Previous Crop, Tillage, Cultivar and Triazole Fungicides on the Deoxynivalenol Content of Wheat Grain—A Review. J. Plant Dis. Prot. 2006, 113, 241–246. [Google Scholar] [CrossRef]
  34. Blandino, M.; Scarpino, V.; Sulyok, M.; Krska, R.; Reyneri, A. Effect of Agronomic Programmes with Different Susceptibility to Deoxynivalenol Risk on Emerging Contamination in Winter Wheat. Eur. J. Agron. 2017, 85, 12–24. [Google Scholar] [CrossRef]
  35. Bundessortenamt. Getreide, Mais, Öl-Und Faserpflanzen, Leguminosen, Rüben, Zwischenfrüchte. 2018. Available online: https://www.bundessortenamt.de/bsa/en/variety-testing/descriptive-variety-lists/downloading-descriptive-variety-lists (accessed on 12 January 2021).
  36. Prandini, A.; Sigolo, S.; Filippi, L.; Battilani, P.; Piva, G. Review of Predictive Models for Fusarium Head Blight and Related Mycotoxin Contamination in Wheat. Food Chem. Toxicol. 2009, 47, 927–931. [Google Scholar] [CrossRef]
  37. Birr, T.; Verreet, J.-A.; Klink, H. Prediction of Deoxynivalenol and Zearalenone in Winter Wheat Grain in a Maize-Free Crop Rotation Based on Cultivar Susceptibility and Meteorological Factors. J. Plant Dis. Prot. 2019, 126, 13–27. [Google Scholar] [CrossRef]
  38. Giroux, M.-E.; Bourgeois, G.; Dion, Y.; Rioux, S.; Pageau, D.; Zoghlami, S.; Parent, C.; Vachon, E.; Vanasse, A. Evaluation of Forecasting Models for Fusarium Head Blight of Wheat Under Growing Conditions of Quebec, Canada. Plant Dis. 2016, 100, 1192–1201. [Google Scholar] [CrossRef]
  39. Giraud, F.; Pasquali, M.; El Jarroudi, M.; Vrancken, C.; Brochot, C.; Cocco, E.; Hoffmann, L.; Delfosse, P.; Bohn, T. Fusarium Head Blight and Associated Mycotoxin Occurrence on Winter Wheat in Luxembourg in 2007/2008. Food Addit. Contam. Part A Chem. Anal. Control Expo. Risk Assess. 2010, 27, 825–835. [Google Scholar] [CrossRef]
  40. Aslanov, R.; El Jarroudi, M.; Gollier, M.; Pallez-Barthel, M.; Beyer, M. Yellow Rust Does Not like Cold Winters. But How to Find out Which Temperature and Time Frames Could Be Decisive in Vivo? J. Plant Pathol. 2019, 101, 539–546. [Google Scholar] [CrossRef]
  41. Beyer, M.; Junk, J.; Eickermann, M.; Clermont, A.; Kraus, F.; Georges, C.; Reichart, A.; Hoffmann, L. Winter Honey Bee Colony Losses, Varroa Destructor Control Strategies, and the Role of Weather Conditions: Results from a Survey among Beekeepers. Res. Vet. Sci. 2018, 118, 52–60. [Google Scholar] [CrossRef]
  42. Vogelgsang, S.; Beyer, M.; Pasquali, M.; Jenny, E.; Musa, T.; Bucheli, T.D.; Wettstein, F.E.; Forrer, H.-R. An Eight-Year Survey of Wheat Shows Distinctive Effects of Cropping Factors on Different Fusarium Species and Associated Mycotoxins. Eur. J. Agron. 2019, 105, 62–77. [Google Scholar] [CrossRef]
  43. Xu, X. Effects of Environmental Conditions on the Development of Fusarium Ear Blight. Eur. J. Plant Pathol. 2003, 109, 683–689. [Google Scholar] [CrossRef]
  44. Xu, X.-M.; Nicholson, P.; Thomsett, M.A.; Simpson, D.; Cooke, B.M.; Doohan, F.M.; Brennan, J.; Monaghan, S.; Moretti, A.; Mule, G.; et al. Relationship Between the Fungal Complex Causing Fusarium Head Blight of Wheat and Environmental Conditions. Phytopathology 2007, 98, 69–78. [Google Scholar] [CrossRef] [PubMed] [Green Version]
  45. Beyer, M.; Pogoda, F.; Pallez, M.; Lazic, J.; Hoffmann, L.; Pasquali, M. Evidence for a Reversible Drought Induced Shift in the Species Composition of Mycotoxin Producing Fusarium Head Blight Pathogens Isolated from Symptomatic Wheat Heads. Int. J. Food Microbiol. 2014, 182–183, 51–56. [Google Scholar] [CrossRef] [PubMed]
  46. Schaafsma, A.W.; Hooker, D.C. Climatic Models to Predict Occurrence of Fusarium Toxins in Wheat and Maize. Int. J. Food Microbiol. 2007, 119, 116–125. [Google Scholar] [CrossRef]
  47. Musa, T.; Hecker, A.; Vogelgsang, S.; Forrer, H.R. Forecasting of Fusarium Head Blight and Deoxynivalenol Content in Winter Wheat with FusaProg*. EPPO Bull. 2007, 37, 283–289. [Google Scholar] [CrossRef]
  48. Liu, C.; Manstretta, V.; Rossi, V.; Van der Fels-Klerx, H.J. Comparison of Three Modelling Approaches for Predicting Deoxynivalenol Contamination in Winter Wheat. Toxins 2018, 10, 267. [Google Scholar] [CrossRef] [Green Version]
  49. Garcia, D.; Ramos, A.J.; Sanchis, V.; Marín, S. Predicting Mycotoxins in Foods: A Review. Food Microbiol. 2009, 26, 757–769. [Google Scholar] [CrossRef] [PubMed]
  50. Yli-Mattila, T.; Rämö, S.; Hietaniemi, V.; Hussien, T.; Carlobos-Lopez, A.L.; Cumagun, C.J.R. Molecular Quantification and Genetic Diversity of Toxigenic Fusarium Species in Northern Europe as Compared to Those in Southern Europe. Microorganisms 2013, 1, 162–174. [Google Scholar] [CrossRef]
  51. Logrieco, A.F.; Moretti, A. Between Emerging and Historical Problems: An Overview of the Main Toxigenic Fungi and Mycotoxin Concerns in Europe. In Mycotoxins: Detection Methods, Management, Public Health and Agricultural Trade; CABI: Wallingford, UK, 2008. [Google Scholar]
  52. Edwards, S.G. Fusarium Mycotoxin Content of UK Organic and Conventional Oats. Food Addit. Contam. Part A 2009, 26, 1063–1069. [Google Scholar] [CrossRef] [Green Version]
  53. Pasquali, M.; Beyer, M.; Logrieco, A.; Audenaert, K.; Balmas, V.; Basler, R.; Boutigny, A.-L.; Chrpová, J.; Czembor, E.; Gagkaeva, T.; et al. A European Database of Fusarium Graminearum and F. Culmorum Trichothecene Genotypes. Front. Microbiol. 2016, 7, 406. [Google Scholar] [CrossRef] [Green Version]
  54. Beyer, M.; Klix, M.B.; Verreet, J.A. Estimating Mycotoxin Contents of Fusarium-Damaged Winter Wheat Kernels. Int. J. Food Microbiol. 2007, 119, 153–158. [Google Scholar] [CrossRef]
  55. Beyer, M.; Pogoda, F.; Ronellenfitsch, F.K.; Hoffmann, L.; Udelhoven, T. Estimating Deoxynivalenol Contents of Wheat Samples Containing Different Levels of Fusarium-Damaged Kernels by Diffuse Reflectance Spectrometry and Partial Least Square Regression. Int. J. Food Microbiol. 2010, 142, 370–374. [Google Scholar] [CrossRef] [PubMed]
  56. Rod, K.S.; Bradley, C.A.; Van Sanford, D.A.; Knott, C.A. Integrating Management Practices to Decrease Deoxynivalenol Contamination in Soft Red Winter Wheat. Front. Plant Sci. 2020, 11, 1158. [Google Scholar] [CrossRef] [PubMed]
  57. Škrbić, B.; Malachova, A.; Živančev, J.; Veprikova, Z.; Hajšlová, J. Fusarium Mycotoxins in Wheat Samples Harvested in Serbia: A Preliminary Survey. Food Control 2011, 22, 1261–1267. [Google Scholar] [CrossRef]
  58. Topi, D.; Babič, J.; Pavšič-Vrtač, K.; Tavčar-Kalcher, G.; Jakovac-Strajn, B. Incidence of Fusarium Mycotoxins in Wheat and Maize from Albania. Molecules 2021, 26, 172. [Google Scholar] [CrossRef]
  59. Van Der Fels-Klerx, H.J.; Klemsdal, S.; Hietaniemi, V.; Lindblad, M.; Ioannou-Kakouri, E.; Van Asselt, E.D. Mycotoxin Contamination of Cereal Grain Commodities in Relation to Climate in North West Europe. Food Addit. Contam. Part A Chem. Anal. Control Expo Risk Assess. 2012, 29, 1581–1592. [Google Scholar] [CrossRef]
  60. Alkadri, D.; Rubert, J.; Prodi, A.; Pisi, A.; Mañes, J.; Soler, C. Natural Co-Occurrence of Mycotoxins in Wheat Grains from Italy and Syria. Food Chem. 2014, 157, 111–118. [Google Scholar] [CrossRef]
  61. Nathanail, A.V.; Syvähuoko, J.; Malachová, A.; Jestoi, M.; Varga, E.; Michlmayr, H.; Adam, G.; Sieviläinen, E.; Berthiller, F.; Peltonen, K. Simultaneous Determination of Major Type A and B Trichothecenes, Zearalenone and Certain Modified Metabolites in Finnish Cereal Grains with a Novel Liquid Chromatography-Tandem Mass Spectrometric Method. Anal. Bioanal. Chem. 2015, 407, 4745–4755. [Google Scholar] [CrossRef] [Green Version]
  62. Bryła, M.; Waśkiewicz, A.; Podolska, G.; Szymczyk, K.; Jędrzejczak, R.; Damaziak, K.; Sułek, A. Occurrence of 26 Mycotoxins in the Grain of Cereals Cultivated in Poland. Toxins 2016, 8, 160. [Google Scholar] [CrossRef] [Green Version]
  63. Schothorst, R.C.; van Egmond, H.P. Report from SCOOP Task 3.2.10 “Collection of Occurrence Data of Fusarium Toxins in Food and Assessment of Dietary Intake by the Population of EU Member States”: Subtask: Trichothecenes. Toxicol. Lett. 2004, 153, 133–143. [Google Scholar] [CrossRef]
  64. Doohan, F.M.; Brennan, J.; Cooke, B.M. Influence of Climatic Factors on Fusarium Species Pathogenic to Cereals. Eur. J. Plant Pathol. 2003, 109, 755–768. [Google Scholar] [CrossRef]
  65. Uhlig, S.; Eriksen, G.S.; Hofgaard, I.S.; Krska, R.; Beltrán, E.; Sulyok, M. Faces of a Changing Climate: Semi-Quantitative Multi-Mycotoxin Analysis of Grain Grown in Exceptional Climatic Conditions in Norway. Toxins 2013, 5, 1682–1697. [Google Scholar] [CrossRef]
  66. Vogelgsang, S.; Musa, T.; Bänziger, I.; Kägi, A.; Bucheli, T.D.; Wettstein, F.E.; Pasquali, M.; Forrer, H.-R. Fusarium Mycotoxins in Swiss Wheat: A Survey of Growers’ Samples between 2007 and 2014 Shows Strong Year and Minor Geographic Effects. Toxins 2017, 9, 246. [Google Scholar] [CrossRef] [Green Version]
  67. Hofgaard, I.S.; Aamot, H.U.; Torp, T.; Jestoi, M.; Lattanzio, V.M.T.; Klemsdal, S.S.; Waalwijk, C.; Van der Lee, T.; Brodal, G. Associations between Fusarium Species and Mycotoxins in Oats and Spring Wheat from Farmers’ Fields in Norway over a Six-Year Period. World Mycotoxin J. 2016, 9, 365–378. [Google Scholar] [CrossRef]
  68. Chandelier, A.; Nimal, C.; André, F.; Planchon, V.; Oger, R. Fusarium Species and DON Contamination Associated with Head Blight in Winter Wheat over a 7-Year Period (2003–2009) in Belgium. Eur. J. Plant Pathol. 2011, 130, 403–414. [Google Scholar] [CrossRef]
Figure 1. Sampling locations of the monitoring campaigns 2007–2018. The locations of fields where the deoxynivalenol (DON) content of the raw winter wheat grain was below the limit of quantification (LoQ) are marked in green, the locations of fields with DON concentrations > LoQ but lower than 1250 µg/kg are marked in yellow and the locations of fields with DON > 1250 µg/kg are marked in red. The size of Luxembourg from east to west is 57 km.
Agronomy 11 00960 g001
Figure 2. Boxplots of the distribution of deoxynivalenol (DON) levels detected in raw winter wheat sampled in Luxembourg. Between 2007 and 2018, 714 samples were analyzed. The samples with DON levels above the maximum limit (ML) of 1250 µg/kg based on the EU legislation are marked in red. The dashed line is a waveform sine 4 parameter regression line fitted to the annual maximum DON values.
Agronomy 11 00960 g002
Figure 3. (A) Relationship between the percentage of raw winter wheat grain samples with deoxynivalenol (DON) > 1250 µg/kg and the coefficient of variation (CV) of precipitation data recorded ±7 days around anthesis. The samples were collected from fields scattered across Luxembourg. The network of weather stations was continuously expanded such that precipitation data from 16 (2007) to 36 (2018) weather stations were available. The total precipitation over the period ±7 days around anthesis was calculated for each weather station. Subsequently, coefficients of variation were calculated from the data of all weather stations. (B) Relationship between the percentage of winter wheat grain samples with DON > 1250 µg/kg in Luxembourg and the percentage of fields with a previous crop of maize for dry and wet years in the period ±7 days around wheat anthesis. The minimum average precipitation of all weather stations for a year when DON > 1250 µg/kg was observed was 51 mm in 2008 in Luxembourg in the period ±7 days around wheat anthesis. Hence, years with more precipitation were considered to be wet years while years with less precipitation were considered to be dry years. Squares represent data previously published by Vogelgsang et al. [40] for Switzerland (CH). The non-linear relationship for the wet years followed the equation y = 100/(1 + exp(−(x − 74.61)/16.69)), r2 = 0.74, p = 0.0104. The linear relationship for the dry years was non-significant (p > 0.05. The numbers close to plot symbols represent the years of sampling. ** = significant at the 1% level.
Agronomy 11 00960 g003
Table 1. Number of raw winter wheat samples in Luxembourg and the number of samples containing deoxynivalenol (DON) between 2007 and 2018. For the calculation of means and medians, samples with DON levels below the LoQ (limit of quantification) were set equal to the LoQ.
200720082009201020112012201320142015201620172018Total
Numbers of locations sampled17161420141341614171512172
Number of samples1716538456544090561287446714
Number of positive samples141024100272781771724239
% positive82634512050689260235233
Mean (µg/kg)704813230109761108247857941297411
Median (µg/kg)2782487676769318176761207691
Maximum (µg/kg)45068111209284576924775853426151453492463
Number of samples above the MLs2120014000110737
Number of positives samples = above the LoQ.
Publisher’s Note: MDPI stays neutral with regard to jurisdictional claims in published maps and institutional affiliations.

