Abstract
Acid rain (AR) adversely affects soybean growth and seed yield. However, genetic variation of soybean response to AR stress has not been well evaluated. Here, 441 cultivated soybean genotypes were subjected to simulated rainfall with either pH 4.2 (AR) or pH 5.6 (control) from the three-leaf stage to maturity in 2009 and 2010. After maturity, 14 traits potentially related to AR tolerance were determined. Analyses of variance showed that genetic variation in AR tolerance was statistically highly significant for all surveyed traits. Analysis of AR tolerance coefficients (ARTC) distinguished the 14 traits into four types. The Types I, II, and III variables were affected by AR stress to various degrees and displayed variations in AR sensitivity among genotypes with different sizes. Nevertheless, the Type IV variables were not influenced and showed little genetic variation. Among the three evaluation criteria for measuring AR tolerance of soybean genotypes, the ARTC and the ARTI (AR tolerance index) of seed yield were moderately associated, whereas the ARTC of seed yield and the average membership grade of ARTCs of the seven selected traits for comprehensive evaluating were strongly correlated. Applying the comprehensive evaluation method, 22 highly AR-tolerant and 23 highly AR-susceptible germplasms were identified. Seed yield changes after AR exposure of these screened genotypes were primarily attributed to changes in total pod number per plant, which consequently caused corresponding alterations in fruited pod number per plant and seed number per plant, and were secondarily due to changes in hundred seed weight. These novel germplasms will serve as materials for subsequent investigations aiming to explore the genetic mechanisms underlying AR tolerance and to develop AR-tolerant varieties in soybean.
1. Introduction
Acid rain (AR) has been a major environmental issue worldwide for several decades because it potentially damages human health, terrestrial and aquatic ecosystems, forests, and crops [1,2]. Although many countries in Northern and Western Europe, North America, and Southeast Asia have implemented policies and measures to reduce AR precursors, the problem will persist for some time [1,2,3]. Soybean [Glycine max (L.) Merr.], which is the largest source of edible vegetable oil for humans and high-protein feed for livestock, is the leading economic oilseed crop in the world; Furthermore, its capacity for symbiotic nitrogen fixation with rhizobium is valuable for cropping systems [4,5]. Thus, it is important to understand the effects of AR on soybean growth, development, yield, and seed quality, to develop countermeasures that mitigate any potentially harmful effects.
Many studies have shown that moderate- to high-acidity simulated acid rain (SAR) exposure has deleterious effects on soybeans, including inhibiting seed germination [6], injuring leaves at the seedling stage [7,8], decreasing leaf photosynthesis [9,10], impairing cell and plasma membranes [8,11], decreasing the growth of root nodules [7], enhancing the accumulation of heavy metals [12], reducing seed yield [13,14], and lowering seed protein content [15].
Interestingly, some investigators have demonstrated that different soybean varieties may respond differently to SAR [16,17,18,19,20]. This variability indicates that genetic enhancement of AR tolerance in soybean might be carried out through selection or breeding. However, the numbers of germplasms included in previous studies have been low. Although Sun et al. [21] identified and categorized the AR tolerances of 1033 Chinese soybean genotypes, the applicability of their results might be limited, as AR tolerance grades were merely rescaled from leaf injuries, which obviously express only at the seedling stage and may not be correlated with yield or other yield parameters [19]. Therefore, genetic variation and diversity of soybean response to SAR stress have not been well evaluated.
The objectives of the present study were to evaluate the genetic variability and diversity of AR tolerance in soybeans; to rank the AR tolerance grades for the sampled genotypes; and to identify novel germplasms with extreme sensitivity from a larger collection of cultivated soybean genotypes, using growth performance at maturity, yield, and yield components as indicators. The identified germplasms might provide a prerequisite for the identification of the genomic regions or even genes that govern those AR tolerance-related traits, for gene function analysis in the pathways associated with the AR-stress response, and eventually for the development of AR-tolerant varieties through conventional or marker-assisted breeding.
2. Materials and Methods
2.1. Plant Materials and Culture Experiments
A total of 441 soybean [Glycine max (L.) Merr.] genotypes, including 326 landraces and 115 cultivars (Table S1), were used for this study. The germplasm collection was sampled from the Soybean Genebank at the National Center for Soybean Improvement, Nanjing Agricultural University (NAU), Nanjing, China. The experiments were conducted in facility shelters at the Jiangpu Agronomic Experimental Station of NAU (32°02′05″ N 118°37′38″ E), Nanjing, China, during the normal growing seasons of 2009 and 2010. All plant materials were pot-cultured and evaluated under two simulated rain regimes (acid rain and normal rain). Under each acidity regime within each year, the genotypes were arranged in a randomized complete block design with three replications. Soybean seeds were sown and grown in plastic pots (24 cm in diameter, 20 cm in depth) filled with 7.5 L of plow layer soil. Five seeds were sown in each pot, and young seedlings were thinned to three homogeneous plants 10 days after seeding. Fertilizers, insecticides, and weeding were applied as required, in accordance with local practices.
2.2. Preparation and Application of Simulated Rain
We compared two acidity treatments: simulated acid rain, at pH 4.2 (SAR), and simulated normal rain, at pH 5.6 (SNR, the control). The ionic composition and acidity level of the simulated rain were determined based on current precipitation chemistry monitoring data [22,23,24]. The SNR solution (ionic water) was prepared by dissolving 3.1 mg/L CaCl2, 2.8 mg/L NH4Cl, 0.91 mg/L NaCl, and 0.75 mg/L KCl into deionized water. The SAR solution was produced by adjusting the pH value of the ionic water using a 5:1 (v:v, by chemical equivalents) mixture of concentrated H2SO4 and HNO3. The pH values of the SAR solutions were verified using a digital pH meter (Fisher Scientific, Pittsburgh, PA, USA). Exposure treatments were applied every four days from the three-leaf stage to maturity using a self-made rain generator system. The amount of precipitation applied during each event was 10 mm. In total, 220 mm of simulated rainwater was sprayed in 22 events during each growing season. The facility shelters were covered by polyethylene film to protect plants from ambient rainfall and equipped with windows at the lower periphery. The windows were normally left open to allow air movement and temperature equilibration and closed during natural rainfall or treatment application.
2.3. Phenotype Determination
To comprehensively assess the responses of the soybeans to SAR, 14 traits characterizing growth performance at maturity, yield, and yield components were surveyed by measurement or calculation at harvest [25]. The agronomic traits assessed were seed yield per plant (SYPP, g/plant), seed number per plant (SNPP, seeds/plant), hundred seed weight (HSW, g/100 seed), total pod number per plant (TPNPP, pods/plant), fruited pod number per plant (FPNPP, pods/plant), empty pod number per plant (EPNPP, pods/plant), percent of the fruited pod (PFP, %), seed number per fruited pod (SNPFP, seeds/pod), dry matter in vegetative organs per plant (DMVOPP, g/plant), plant height (PH, cm), the height of the lowest pod (HLP, cm), effective branch number per plant (EBNPP, branches/plant), length of interval for the podding nodes on the main stem (LIPNMS, cm), and effective node number on the main stem (ENNMS, nodes). SYPP was determined by oven drying seeds at 105 °C for 48 h and then weighing. HSW was calculated by dividing SYPP by SNPP and then multiplying by 100. FPNPP was the number of pods with at least one developed seed on a given plant, while EPNPP was the number of pods without any developed seeds. PFP was computed by dividing FPNPP by TPNPP and then multiplying by 100. SNPFP was determined by dividing SNPP by FPNPP. For each pot, the above-ground portion of each plant, excluding seeds, was oven-dried at 60 °C for 48 h and then weighed to determine DMVOPP. PH was measured from the ground to the top terminal, and HLP was the height of the lowest pod of each plant, while LIPNMS was the difference between PH and HLP. EBNPP was the number of branches with at least one fruited pod on a given plant, while ENNMS was the number of nodes with effective branches.
2.4. Statistical Analysis
Descriptive statistics, analyses of variance (ANOVA), and correlation analyses for the phenotypic data were performed using PROC MEANS, PROC GLM, and PROC CORR, respectively, in SAS [26,27]. In the linear model for the combined ANOVA, acidity was considered to be fixed, while the other factors (genotype, year, and block) were treated as random.
Referring to the methods for evaluation of tolerance to drought or other abiotic stresses in crops, seed yield was used as the primary trait [28,29]. The acid rain tolerance coefficient (ARTC) [30,31] and the acid rain tolerance index (ARTI) [31,32,33] of this trait were used to indicate the response of each soybean genotype to AR stress. The formulae for these two criteria were
where and are the ARTC and the ARTI of seed yield for the th genotype, respectively; and are the mean seed yields of the th genotype treated with SAR and SNR, respectively; and is the mean yield of all genotypes treated with SAR.
Because seed yield generally has medium to low heritability and does not fully explain the plant response to stress, yield components, growth performance, and other secondary traits are often incorporated into comprehensive evaluations of stress tolerance [28,29,34]. Here, the integrated criterion was acquired in three major steps. First, ARTC was computed for the th genotype on the th trait as [30,31]
where and are the mean values of the th trait for the th genotype treated with SAR and SNR, respectively. Second, ARTC was standardized to a interval, 0 ≤ u ≤ 1, using the membership function method [31,35,36]. As the variations in ARTCs differed among traits, the ARTCs of different traits could not be directly compared. The transformation formula used was
where is the grade of membership for the th genotype on the th trait; and and are, respectively, the maximal and minimal ARTC values for the th trait across all genotypes. Third, the integrated index (average membership grade, AMG) for each genotype was calculated as the mean across all the selected traits:
where is the number of traits used for the comprehensive evaluation.
3. Results
3.1. Effects of AR Stress on Soybean Growth, Yield, and Yield Components
The frequency distributions of the 14 traits under the two acidity treatments (Figure S1) displayed that the density plots were all unimodal. Under the two acidity conditions, the distributions of SYPP, HSW, PFP, SNPFP, DMVOPP, PH, LIPNMS, and ENNMS were approximately normal, while those of SNPP, TPNPP, FPNPP, EPNPP, and EBNPP were positively skewed and leptokurtic. However, the distribution of HLP was roughly normal under pH 4.2 SAR and was positively skewed and leptokurtic under pH 5.6 SNR. Of the 14 traits, acidity affected the distribution of 10 traits (SYPP, SNPP, TPNPP, FPNPP, EPNPP, DMVOPP, PH, HLP, EBNPP, and LIPNMS), but had little influence on the distribution of the remaining four ones (HSW, PFP, SNPFP, and ENNMS).
We calculated key descriptive statistics for the 14 traits potentially related to AR tolerance in the tested soybean population under the two simulated rain treatments (Table 1). Based on average performance under the two acidity conditions, the 14 traits fell into three distinct groups. The six traits in the first group (SYPP, SNPP, TPNPP, FPNPP, EPNPP, and DMVOPP) were reduced by 23.12–24.77% on average when exposed to SAR as compared to those exposed to SNR. These traits were thus most substantively inhibited by SAR. The variability as measured by the standard deviation (SD) of these variables decreased by 12.02–27.18% under the SAR treatment. However, the levels of variability as measured by the coefficient of variation (CV) of SYPP, SNPP, TPNPP, FPNPP, and DMVOPP were stable (fluctuated less than 4%) and that of EPNPP increased by 8.2%. The four traits in the second group were considerably affected by SAR. Under SAR stress, mean PH, EBNPP, and LIPNMS values declined by 6.11%, 9.90%, and 13.47%, respectively, while mean HLP increased by 12.17%. In addition, SAR stress decreased the levels of SD-measured variability in PH, EBNPP, and LIPNMS by 4.08%, 12.16%, and 10.97%, respectively, and less altered such variability in HLP. However, the levels of CV-measured variability in all four traits were stable (fluctuated less than 2.87%). Finally, differences in mean performance and variability (measured as both SD and CV) for HSW, PFP, SNPFP, and ENNMS were very small, irrespective of acidity levels. Thus, the four traits in the third group were almost unaffected by SAR.

Table 1.
Descriptive statistics for the 14 traits potentially related to AR tolerance for the tested soybean population under the two simulated rain regimes.
Joint ANOVA for the 14 traits (Table 2) showed that the genotype effect was highly significant (p < 0.0001) for all surveyed traits, suggesting that genetic variation among germplasms in the sampled soybean population really existed for all response variables. Differences between the two acidity treatments were highly significant (p < 0.0001) for all examined traits except HSW (p = 0.4565), indicating that SAR stress had statistically highly significant effects on the remaining 13 traits. Repetition effects between the two years were highly significant for HSW, HLP, and EBNPP (p < 0.0001); very significant for SYPP (p = 0.0024); significant for ENNMS (p = 0.0110) and PH (p = 0.0121); and not significant (p > 0.05) for the remaining eight traits. The first-order interactions between genotype and acidity factor were highly significant for all 14 traits (p < 0.0001), suggesting that different soybean germplasms might respond differently to SAR stress. As a validation, Figure 1 showed this property graphically for seed yield. The nonparallel and varied slope reflected the differential response of individual genotype to AR on SYPP. Thus, genetic variations might provide the prerequisite gene resources for the development of AR-tolerant varieties through selection or breeding. The first-order interactions between genotype and year were also highly significant for all 14 traits (p < 0.0001), indicating that different soybean germplasms might behave differently under a yearly changed environment. However, the first-order interactions between acidity and year were significant only for SYPP (p = 0.0006) and were not significant for the other 13 traits (p > 0.05). This indicated that the effects of SAR on most traits were fairly consistent across different years. Lastly, the three-factor interactions (genotype × acidity × year) were highly significant (p < 0.0001) for the six traits that were most substantially reduced by SAR stress (i.e., SYPP, SNPP, TPNPP, FPNPP, EPNPP, and DMVOPP) and were not significant (p > 0.05) for the remaining eight ones, indicating that soybean sensitivity to AR, as reflected by these six traits, might vary across different years.
Table 2.
Analysis of variance for the 14 traits potentially related to AR tolerance for the tested soybean population.
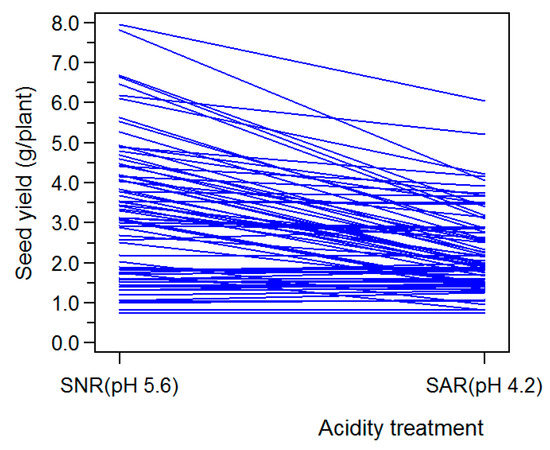
Figure 1.
Differential response (reaction norms) of soybean genotypes to SAR stress for seed yield. Each line represents a genotype. To avoid unclear presentation, only a subset of the whole surveyed genotypes was given.
3.2. Correlation Analyses under the Two Simulated Rain Treatments
The Pearson correlation coefficients among the 14 agronomic traits were calculated under the two acidity treatments (Table 3). In general, the simulated rain treatments had little effect on the correlation coefficients (Table 3).
Table 3.
Pearson correlation coefficients among traits potentially related to AR tolerance for the tested soybean population under the two simulated rain regimes.
SYPP was positively correlated with each of the other 13 traits under both acidity conditions. The correlations with SYPP were all highly significant (p < 0.001), with the following exceptions: EPNPP, LIPNMS, and EBNPP under both treatments, and HLP and PH under SAR (p > 0.05). The significant correlation with SYPP under SNR and SAR was moderate-to-strong for DMVOPP (r = 0.69 and r = 0.67, respectively); moderate for SNPP (r = 0.59 and r = 0.57, respectively), FPNPP (r = 0.52 and r = 0.52, respectively), and HSW (r = 0.48 and r = 0.47, respectively); moderate-to-weak for TPNPP (r = 0.39 and r = 0.37, respectively) and PFP (r = 0.33 and r = 0.29, respectively); and weak for SNPFP (r = 0.30 and r = 0.11, respectively) and ENNMS (r = 0.22 and r = 0.19, respectively). The correlation with SYPP under SNR was also weak for HLP (r = 0.20) and PH (r = 0.17).
SNPP was not significantly (p > 0.05) correlated only with HLP under either acidity treatment. While, SNPP was very significantly (p = 0.0075) and highly significantly (p < 0.001) correlated with SNPFP under SAR and SNR treatments, respectively. However, SNPP was highly significantly (p < 0.001) correlated with all other traits under both treatments. These significant correlations with SNPP were all positive except for HSW under both treatments. The correlation with SNPP under SNR and SAR was strong for FPNPP (r = 0.94 and r = 0.94, respectively) and TPNPP (r = 0.82 and r = 0.80, respectively); and moderate or weak for all other traits.
HSW was significantly correlated with all traits with the following exceptions: PFP, PH, and ENNMS under both treatments, and SNPFP under SNR (p > 0.05). Under both treatments, the significant correlation with HSW was positive for SYPP, DMVOPP, and HLP and negative for SNPP, TPNPP, FPNPP, EPNPP, EBNPP, and LIPNMS. All correlations between HSW and other traits were moderate to weak.
In addition, we also found highly significant, strong correlations under both SNR and SAR conditions between TPNPP and FPNPP (r = 0.88 and r = 0.87, respectively), TPNPP and EPNPP (r = 0.75 and r = 0.80, respectively), PH and LIPNMS (r = 0.88 and r = 0.87, respectively), and EPNPP and PFP (r = −0.70 and r = −0.71, respectively).
3.3. Soybean Sensitivity to AR Stress and Its Genetic Variability as Reflected by Indicators Associated with Growth, Yield, and Yield Components
Descriptive statistics for the ARTCs of the 14 traits potentially related to AR tolerance in the tested soybean germplasm collection were calculated (Table 4). Based mainly on ARTC mean and ARTC CV values and referred occasionally to ARTC range, the 14 traits were classified into four clusters. The mean ARTC values for all traits in the first cluster (SYPP, TPNPP, FPNPP, SNPP, EPNPP, and DMVOPP) were less than 0.80, while the ARTC CVs for these variables were greater than 20%. Consequently, these six traits were both highly affected by AR stress and possessed the most substantial genetic variability with respect to AR sensitivity (Type I). In the next place, the mean ARTC values for traits in the second cluster (HLP, LIPNMS, EBNPP, and PH) fluctuated ~0.10 to 0.20 around 1.00, while the ARTC CVs for these traits ranged from 10% to 20%. Thus, these four traits in the second cluster were also affected by AR stress and had larger genetic variation in AR sensitivity (Type II). The third cluster included only one trait, HSW. The ARTC mean for this trait was 1.00, indicating that HSW was, on average, not affected by AR stress. However, the ARTC CV of HSW was greater than 5% (7.48%), and the ARTC of HSW for individual genotypes varied from 0.82 to 1.18. Therefore, at the level of the individual genotype, this variable was somewhat influenced by AR stress and exhibited some genetic variability in AR sensitivity (Type III). Finally, the ARTC mean values for traits in the fourth cluster (PFP, SNPFP, and ENNMS) were approximately 1.00, while the ARTC CVs for these traits were less than 3.0%. Thus, traits in the fourth cluster were not affected by AR stress and had little genetic variation in AR sensitivity (Type IV). Figure 2 represented these results visually.
Table 4.
Descriptive statistics for ARTCs (acid rain tolerance coefficients) of the 14 traits potentially related to AR tolerance for the tested soybean population.
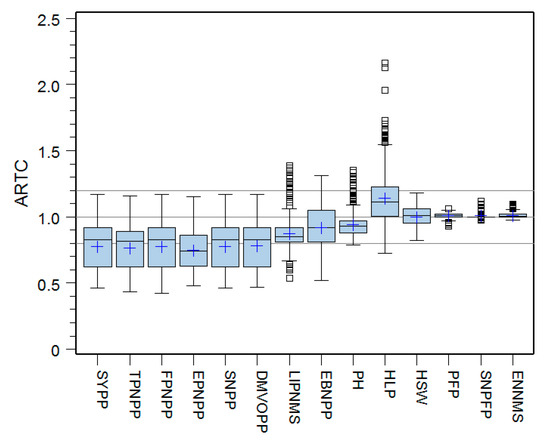
Figure 2.
Boxplots of ARTCs (acid rain tolerance coefficients) of the 14 traits potentially related to AR tolerance for the tested soybean population. SYPP, Seed yield per plant; TPNPP, Total pod number per plant; FPNPP, Fruited pod number per plant; EPNPP, Empty pod number per plant; SNPP, Seed number per plant; DMVOPP, Dry matter in vegetative organs per plant; LIPNMS, Length of interval for the podding nodes on the main stem; EBNPP, Effective branch number per plant; PH, Plant height; HLP, Height of the lowest pod; HSW, Hundred seed weight; PFP, Percent of fruited pod; SNPFP, Seed number per fruited pod; ENNMS, Effective node number on the main stem.
3.4. Evaluation of the AR Tolerance of the Soybean Genotypes, and Identification of Novel Germplasms
3.4.1. Selecting Traits Used for the Comprehensive Evaluation of AR Tolerance in Soybeans
PFP, SNPFP, and ENNMS (the Type IV variables) were not associated with AR tolerance and thus, were not be used to evaluate AR tolerance in soybeans. Seed yield was undoubtedly the primary trait for assessments of AR tolerance in soybean [28,29]. The remaining 10 traits (the Types I, II, and III variables) were affected by AR stress to various degrees and demonstrated variations in AR sensitivity among genotypes (Table 4). Therefore, these variables were also related to AR tolerance and might be useful for comprehensive evaluations of the AR tolerance of cultivated soybean germplasms. Of these 10 variables, DMVOPP reflected soybean growth and had the highest correlation with SYPP under both acidity treatments, while SNPP, HSW, and TPNPP were yield components that were moderately positively correlated with SYPP under both treatments (Table 3). PH was also a measure of soybean growth and was moderately positively correlated with DMVOPP under both treatments. Although EBNPP was not significantly associated with SYPP or DMVOPP, EBNPP was moderately correlated with the yield components SNPP, HSW, TPNPP, and FPNPP under both treatments. Therefore, these six traits (DMVOPP, SNPP, HSW, TPNPP, PH, and EBNPP), in addition to SYPP, were used for the comprehensive evaluation of AR tolerance in cultivated soybeans.
FPNPP was moderately positively correlated with SYPP and DMVOPP under both acidity conditions. However, the variability in AR sensitivity among genotypes revealed by this variable was sufficiently reflected by SNPP and TPNPP, as FPNPP was strongly positively correlated with both SNPP and TPNPP (Table 3). EPNPP was also related to AR tolerance but was significantly correlated with neither SYPP nor DMVOPP, except for a weak association with DMVOPP under SAR. LIPNMS was somewhat influenced by AR stress but was not significantly associated with SYPP, and the variations among genotypes captured by this trait were satisfactorily explained by PH (Table 3). Finally, HLP also had some sensitivity to AR stress, but this variable was not significantly associated with SYPP under SAR and had only a weak correlation with SYPP under SNR. Therefore, the traits FPNPP, EPNPP, LIPNMS, and HLP were not used in our comprehensive evaluation of the AR tolerance of cultivated soybean germplasms.
3.4.2. Evaluation of the AR Tolerance of Cultivated Soybean Genotypes
Grouping intervals and frequency distributions of the AR-tolerance grades of the tested cultivated soybean genotypes, using the ARTC of seed yield, the ARTI of seed yield, and the AMG of the ARTCs of the seven selected traits as evaluation criteria, were calculated (Table 5).
Table 5.
Grouping intervals and frequency distributions of AR tolerance grades using ARTC of seed yield, ARTI of seed yield, and AMG of ARTCs of the seven selected traits as evaluation criteria for the tested soybean population.
The Spearman rank correlation coefficient (rS) between the ARTC and the ARTI of seed yield was 0.494 (p < 0.0001) (Table 6). This moderate association suggested that the AR-tolerance grades calculated using these two criteria were not highly congruent. For example, 22 genotypes were identified as highly AR tolerant based on the ARTC of seed yield. Of these, the ARTI criterion identified 1 genotype as AR tolerant, 19 as moderately AR tolerant, 1 as AR susceptible, and 1 as highly AR susceptible (Table S1). However, rS between the ARTC of seed yield and the AMG of the ARTCs of the seven selected traits was 0.998 (p < 0.0001) (Table 6). This highly significant, strong correlation reflected the consensuses between the AR-tolerance grades assigned based on the ARTC of seed yield and those assigned based on the AMG of the ARTCs of the multiple selected traits. For example, of the 22 highly AR-tolerant germplasms identified based on the ARTC of seed yield described above, 21 were consistently identified as highly AR tolerant based on the AMG of the ARTCs of the seven selected traits; only one genotype was identified as AR tolerant (Table S1).
Table 6.
Spearman rank correlation coefficients among the three AR tolerance evaluation criteria.
3.4.3. Screening Novel Soybean Germplasms with Extreme AR Tolerance Using the Comprehensive Evaluation Method
Novel soybean germplasms with extreme AR tolerance were screened using the multiple traits comprehensive evaluation method. Highly AR-tolerant genotypes with AMG values above the upper fifth percentile of the integrated criterion () were listed in Table 7. To elaborate the sensitivity of each highly AR-tolerant genotype to AR stress in yield and yield components, the ARTCs of these traits were also shown. Of the 22 highly AR-tolerant genotypes, one half exhibited increased SYPP under SAR as compared to SYPP under SNR; whereas the other half showed roughly equivalent SYPP under both treatments. The performances of TPNPP, FPNPP, and SNPP for these genotypes were similar to that of SYPP. HSW for all highly tolerant germplasms was enhanced by ≥10% under SAR. However, PFP and SNPFP of these 22 highly tolerant genotypes were almost unaffected by SAR treatment.
Table 7.
ARTCs of seed yield and yield components for highly AR-tolerant soybean germplasms screened using the multiple traits comprehensive evaluation method.
Highly AR susceptible genotypes, with AMG values below the lower fifth percentile of the integrated criterion (), and corresponding ARTCs of seed yield and yield components for these genotypes were presented in Table 8. SYPP, TPNPP, FPNPP, and SNPP for all 23 highly AR-susceptible germplasms decreased more than 50% under SAR as compared to SNR. HSW for these highly susceptible genotypes declined ~13–18% under the SAR treatment, while PFP was only reduced by ~2–7%. Nevertheless, SNPFP for these highly susceptible genotypes increased ~6–12% under SAR.
Table 8.
ARTCs of seed yield and yield components for highly AR-susceptible soybean germplasms screened using the multiple traits comprehensive evaluation method.
4. Discussion
4.1. Genetic Variability of Soybean Responses to AR Stress and Comprehensive Evaluation of AR Tolerance in Soybeans
Soybean genotypes may react differently to AR stress [19,37]. Previous investigations of AR stress in soybeans have primarily aimed to recognize the effects of SAR on soybean plants, including growth, physiology, seed yield, and seed quality in this crop [7,10,11,14,16,17,18,19]. The plant materials used in these studies represented only limited numbers of cultivars; therefore, the genetic variation and the diversity of soybean responses to SAR stress could not be precisely assessed. Here, 441 cultivated soybean germplasms, sampled from different ecological regions of China, were planted and treated with both SAR and SNR. Fourteen traits potentially related to AR tolerance were then evaluated. The joint ANOVA suggested that genotype affects AR tolerance (Table 2). Although genetic variations in AR tolerance were statistically significant for all 14 traits, the average strength and dispersion of individual genotype response to AR stress, as measured by these variables, differed. Analysis of ARTCs distinguished these 14 traits into four clusters (Table 4, Figure 2). The Types I, II, and III variables were affected by AR stress to various degrees and displayed variations in AR sensitivity among genotypes with different sizes, nevertheless the Type IV variables were not influenced by AR stress and showed little genetic variation.
Similar to the tolerance of other abiotic stressors in crops, AR tolerance in soybeans was a complex quantitative trait that could not be directly measured. Moreover, the ARTCs of different traits in a single genotype were usually unequal, and AR-tolerance mechanisms were not necessarily similar across genotypes. Therefore, any single trait cannot fully explain the soybean response to AR stress, and multiple traits related to AR tolerance should be used in comprehensive AR-tolerance evaluations [38,39]. Seed yield was unquestionably the primary trait for assessments of AR tolerance in soybeans [28,29]. Meanwhile, some secondary traits (the Types I, II, and III variables) might also be useful for comprehensive evaluations of AR tolerance in soybean germplasms [28]. Using the correlations between pairs of these AR-tolerance-related secondary traits (Table 3) to eliminate redundant variable information, we finally chose seven indicators (SYPP, SNPP, HSW, TPNPP, EBNPP, DMVOPP, and PH) for the comprehensive evaluations.
4.2. Effects of AR Stress on Soybean Yield and Yield Components
Evans et al. [16,17] observed that the seed yields of the cultivar "Amsoy 71" after SAR exposure were lower than seed yields of plants exposed to SNR; most of these differences were due to the reduced numbers of pods on the SAR-exposed plants. In contrast, SAR treatment did not affect seed yield, pod number per plant, or seed number per pod in cultivar "Williams 79". Similarly, Evans et al. [13] found that the seed yields of four field-grown cultivars (“Amsoy 71”, “Asgrow 3127”, “Corsoy 79”, and “Hobbit”) were decreased by acid-rainfall treatments, and suggested that most of the observed decreases in seed mass per plant were due to decreases in the numbers of pods per plant.
Kohno and Kobayashi [14] reported that seed weights for the plastic-pot-planted cultivars “Sapporomidori” and “Early Hakucho” exposed to SAR at pH 2.0 were significantly lower than those of plants treated with pH 5.6. For “Sapporomidori”, the reduction in seed production was attributed to a decrease in numbers of both total and fruited pods per plant, as weight per seed and number of seeds per fruited pod were not affected by SAR treatment. In contrast, the decline in seed yield observed in cultivar “Early Hakucho” was attributed to a significant drop in the numbers of seeds per pod, as the total pods per plant and the weight per seed were not affected by SAR treatment. Kohno and Kobayashi [14] also observed that the seed yield of box-cultivated “Early Hakucho" after pH 2.0 treatment was significantly lower than seed yield after pH 5.6 treatment and inferred that the reduction in seed weight was caused by a combination of decreases in the number of fruited pods per plant, number of seeds per fruited pod, and weight per seed.
Banwart et al. [19] found that seed yields for “Essex” and “Forrest” were significantly higher after pH 3.0 treatment than after pH 5.6 treatment; however, seed yield for “Williams 82” decreased significantly after pH 3.0 treatment as compared to seed yield after pH 5.6 treatment. The changes in seed yields for these cultivars were primarily due to changes in the numbers of pods per plant and secondarily due to changes in hundred-seed weights.
Here, treatment with SAR decreased SYPP by over 20% on average, as compared to SYPP after treatment with SNR (Table 1 and Table 4). Although seed yield was reduced by SAR stress (ARTC of SYPP < 0.95) in a majority of germplasms (374 genotypes, 84.81%), with “Guangfengmaliaodou” showing the greatest decrease (54%), the seed yield of a few germplasms (8 genotypes, 1.81%) increased (ARTC of SYPP > 1.05), with “Nayongmaoerhui” showing the highest increase (17%); An additional 59 genotypes (13.38%) exhibited no significant alterations in yield (Table S1). Changes in TPNPP, FPNPP, SNPP, and EPNPP after SAR treatment were congruent with the changes observed in SYPP. HSW was not affected by AR stress on average, but for an individual genotype, HSW could fluctuate more than ±10%, with “Guangfengmaliaodou” showing the largest reduction (18%), and “Nayongmaoerhui” showing the largest increase (18%) (Table 4, Table 7 and Table 8). PFP and SNPFP were not affected by AR stress and exhibited little genetic variation in AR sensitivity. Therefore, depending on the genotypes exposed, SAR might reduce, increase, or not affect the seed yields of cultivated soybeans. Alterations in yield were primarily due to changes in TPNPP, which led to corresponding changes in FPNPP and SNPP, and secondarily attributed to changes in HSW. These changes were validated in more detail by the analysis of seed yield and yield components for the highly AR-tolerant or AR-susceptible soybean germplasms, which were screened using the multiple traits comprehensive evaluation method (Table 7 and Table 8). In addition, SNPFP was increased slightly in all highly AR-susceptible soybean germplasms (Table 8).
4.3. The Complexity of AR-Tolerance Evaluation in Soybeans
AR tolerance evaluation in soybean is complex because the response of the soybean to SAR is affected by many factors. First, the SAR properties, including ionic composition, acidity level, occurrence period and frequency, rainfall amount and intensity, treatment duration, and the form of acidic deposition (e.g., dry deposition, acidic mist, or acidic rain), may affect AR tolerance in soybeans [7,11,17,40,41]. Researchers should prepare SAR solutions and design SAR exposure treatments based on the precipitation monitoring data from the corresponding geographic region.
Second, plant growth circumstances (such as soil and climate) also affect the soybean response to AR [19,40]. For example, over more than five seasons of field study in New York, the seed yield of “Amsoy 71” treated with more acidic SAR decreased due to a reduction in the pod number per plant [13,16]. However, the yield of this cultivar increased when the cultivar was planted in the greenhouse, due to an increase in mass per seed [42]. In greenhouse studies conducted in North Carolina, two cultivars, “Essex” and “Forrest”, were not significantly affected by SAR [37]. Nevertheless, in field-plot experiments carried out in east-central Illinois, "Essex" and "Forrest" produced more pods per plant and generated higher grain yields after more acidic treatment than after the control treatment [19]. Here, the genotype×acidity×year interaction was highly significant for SYPP, TPNPP, SNPP, and DMVOPP (Table 2), indicating that soybean sensitivity to AR, as determined based on these traits, might vary across years. Therefore, similar to tolerance evaluations used for other abiotic stressors in crops, researchers should perform trials in multiple environments (locations and/or years) to identify consistently highly AR-tolerant or AR-susceptible soybean germplasms [28,39].
Third, different genotypes may respond to AR stress in different manners [38]. Consequently, investigators should utilize multiple traits related to AR tolerance to comprehensively assess AR tolerance in soybean germplasms. The constitution of the multivariate set used for comprehensive evaluation might affect the results; the selection of these variables is a challenging task.
Fourth, other pollutants or abiotic stresses may also affect AR tolerance or confuse the evaluation of AR tolerance in soybeans. For instances, Troiano et al. [43] discovered that the effects of acidities of SAR on the growth and yield of cultivar “Beeson” were altered by whether ambient ozone was filtered, while Porter et al. [18] found that the effects of SAR on cultivar “Amsoy 71”, including seed yield, number of seeds per plant, and number of seeds per pod, might have been confounded by heat stress. Finally, Zhang et al. [8] observed that SAR, together with frost, strong light, high temperatures, or other adverse environmental conditions that occurred during the experimental periods, could cause soybean leaf injuries.
4.4. Methods of AR-Tolerance Evaluation and Novel Germplasm Selection in Soybeans
Seed yield was the primary trait for AR tolerance evaluation in soybeans [28]. The ARTC of yield [30,31] could be used to assess the AR sensitivity of each soybean genotype, while the ARTI of yield [31,32,33] could be used to evaluate both the sensitivity and the yield potential of each soybean genotype under stress. Here, the agreement between the AR tolerance grades assigned using these two criteria was only moderate (rS = 0.494) (Table 6). Therefore, one of the two indices should be selected according to the research purpose. For example, ARTC might be more useful as an evaluation criterion when the aim was only to characterize and explore the genetic and physiological mechanisms underlying AR tolerance in soybeans, while ARTI might be preferable if the aim was to resolve and apply the biological basis for genotypes with high yield potential under both AR stress and non-stress environments.
Diverse AR response mechanisms among soybean genotypes necessitate comprehensive evaluations of AR tolerance using multiple traits related to AR tolerance [38]. Here, we selected seven variables for the comprehensive evaluation of AR tolerance. The ARTCs of these selected traits were then standardized to the interval 0 ≤ u ≤ 1 using the membership function method [31,35,36]. This procedure eliminated differences in the location and scale parameters of these ARTCs and rendered the assessed AR-tolerance levels of the different genotypes comparable [44].
After the evaluation of stress tolerance, grouping intervals should be specified to generate a tolerance grade for each genotype. The methods for defining grouping intervals include the equidistant interval procedure [34], clustering analysis [38], integral multiple of standard deviations departing from mean based on normal distribution theory [45], and the quantile approach, which has been adopted for the first time in the present paper. The tolerance grade of a given genotype was relative, as grouping intervals were commonly influenced by the stress treatments, experimental environments, germplasm-collection sampling, and the multivariate set used for the comprehensive evaluation. Nonetheless, germplasms with extreme tolerance levels remain the primary interest of these researches and were mostly consistent irrespective of the method used to delimitate grouping intervals. These extremely stress-tolerant accessions were conveniently screened out by the quantile approach, which does not depend on any distribution assumptions. Surely, further verifications of the identified genotypes are needed.
5. Conclusions
Our two-year AR exposure investigations demonstrated that 10 of the 14 traits determined, the Types I, II, and III variables, were affected by AR stress to various degrees and demonstrated variations in AR sensitivity among genotypes with different sizes. Among the three evaluation criteria for measuring AR tolerance of soybean genotypes, the ARTC and the ARTI of seed yield were moderately associated, whereas the ARTC of seed yield and the average membership grade of ARTCs of the seven selected traits for comprehensive evaluating were strongly correlated. Depending on the genotypes exposed, SAR might decrease, increase, or not affect the seed yields of cultivated soybeans. Seed yield changes after SAR treatment as compared to those under SNR of these screened novel germplasms were primarily attributed to changes in total pod number per plant, which consequently caused corresponding alterations in fruited pod number per plant and seed number per plant, and secondarily due to changes in hundred seed weight. The screened highly AR-tolerant germplasms promise further explorations of the genetic and physiological mechanisms underlying AR tolerance in soybean.
Supplementary Materials
The following are available online at https://www.mdpi.com/article/10.3390/agronomy11050868/s1, Table S1: Name, origin, germplasm type, AR tolerance grade, and ARTCs of seed yield and yield components for the 441 soybean genotypes used for AR-tolerance evaluation. Figure S1: Frequency distributions of the 14 traits potentially related to AR tolerance for the tested soybean population under the two simulated rain regimes.
Author Contributions
D.Y. and X.H. conceived and designed the experiments; G.Z., M.P. and R.T. performed the experiments and collected the data; G.Z. and X.H. analyzed the data and wrote the manuscript. D.Y. improved and polished the writing. All authors have read and agreed to the published version of the manuscript.
Funding
This research was funded by the National Natural Science Foundation of China, grant numbers 31771821, 31271749, and 41575135.
Institutional Review Board Statement
Not applicable.
Informed Consent Statement
Not applicable.
Data Availability Statement
No data will be provided other than the Supplemental Table S1 and Figure S1.
Conflicts of Interest
The authors declare no conflict of interest.
References
- Menz, F.C.; Seip, H.M. Acid rain in Europe and the United States: An update. Environ. Sci. Policy 2004, 7, 253–265. [Google Scholar] [CrossRef]
- Abbasi, T.; Poornima, P.; Kannadasan, T.; Abbasi, S.A. Acid rain: Past, present, and future. Int. J. Environ. Eng. 2013, 5, 229–272. [Google Scholar] [CrossRef]
- Larssen, T.; Lydersen, E.; Tang, D.; He, Y.; Gao, J.; Liu, H.; Duan, L.; Seip, H.M.; Vogt, R.D.; Mulder, J.; et al. Acid rain in China: Rapid industrialization has put citizens and ecosystems at risk. Environ. Sci. Technol. 2006, 40, 418–425. [Google Scholar] [CrossRef] [PubMed]
- Valliyodan, B.; Nguyen, H. Genomics of abiotic stress in soybean. In Genetics and Genomics of Soybean; Stacey, G., Ed.; Springer: New York, NY, USA, 2008; pp. 343–372. [Google Scholar]
- Manavalan, L.P.; Guttikonda, S.K.; Tran, L.-S.P.; Nguyen, H.T. Physiological and molecular approaches to improve drought resistance in soybean. Plant Cell Physiol. 2009, 50, 1260–1276. [Google Scholar] [CrossRef]
- Liu, T.T.; Wu, P.; Wang, L.H.; Zhou, Q. Response of soybean seed germination to cadmium and acid rain. Biol. Trace Elem. Res. 2011, 144, 1186–1196. [Google Scholar] [CrossRef]
- Kohno, Y.; Kobayashi, T. Effect of simulated acid rain on the growth of soybean. Water Air Soil Pollut. 1989, 43, 11–19. [Google Scholar] [CrossRef]
- Zhang, Y.M.; Wu, L.Y.; Wang, X.X.; Zhang, J.; Gao, X.P.; Xie, M.Y.; Hui, H.; Wang, P.; Xu, H.B.; Zhao, S.X. Effects of acid rain on leaf injury and physiological characteristics of crops. J. Agro. Environ. Sci. 1996, 15, 197–208, 227, 240, (In Chinese with English abstract). [Google Scholar]
- Sun, Z.; Wang, L.; Chen, M.; Wang, L.; Liang, C.; Zhou, Q.; Huang, X. Interactive effects of cadmium and acid rain on photosynthetic light reaction in soybean seedlings. Ecotoxicol. Environ. Saf. 2012, 79, 62–68. [Google Scholar] [CrossRef]
- Hu, H.; Wang, L.; Liao, C.; Fan, C.; Zhou, Q.; Huang, X. Combined effects of lead and acid rain on photosynthesis in soybean seedlings. Biol. Trace Elem. Res. 2014, 161, 136–142. [Google Scholar] [CrossRef]
- Zhang, X.; Du, Y.; Wang, L.; Zhou, Q.; Huang, X.; Sun, Z. Combined effects of lanthanum (III) and acid rain on antioxidant enzyme system in soybean roots. PLoS ONE 2015, 10, e0134546. [Google Scholar] [CrossRef]
- Kobayashi, T.; Kohno, Y.; Nakayama, K. The effects of simulated acid rain on the uptake of mineral elements in soybean plants. J. Agr. Met. 1992, 48, 11–18, (In Japanese with English summary). [Google Scholar] [CrossRef]
- Evans, L.S.; Lewin, K.F.; Owen, E.M.; Santucci, K.A. Comparison of yields of several cultivars of field-grown soybeans exposed to simulated acidic rainfalls. New Phytol. 1986, 102, 409–417. [Google Scholar] [CrossRef]
- Kohno, Y.; Kobayashi, T. Effect of simulated acid rain on the yield of soybean. Water Air Soil Pollut. 1989, 45, 173–181. [Google Scholar]
- Evans, L.S.; Dimitriadis, L.; Hinkley, D.A. Seed protein quantities of field-grown soybeans exposed to simulated acidic rain. New Phytol. 1984, 97, 71–76. [Google Scholar] [CrossRef]
- Evans, L.S.; Lewin, K.F.; Patti, M.J. Effects of simulated acidic rain on yields of field-grown soybeans. New Phytol. 1984, 96, 207–213. [Google Scholar] [CrossRef]
- Evans, L.S.; Lewin, K.F.; Santucci, K.A.; Patti, M.J. Effects of frequency and duration of simulated acidic rainfalls on soybean yields. New Phytol. 1985, 100, 199–208. [Google Scholar] [CrossRef]
- Porter, P.M.; Banwart, W.L.; Ziegler, E.L.; Vasilas, B.L.; Hassett, J.J. Effects of simulated acid rain on growth parameters and yield components of two soybean cultivars. New Phytol. 1989, 113, 77–83. [Google Scholar] [CrossRef]
- Banwart, W.L.; Finke, R.L.; Porter, P.M.; Hassett, J.J. Sensitivity of twenty soybean cultivars to simulated acid rain. J. Environ. Qual. 1990, 19, 339–346. [Google Scholar] [CrossRef]
- Liu, L.X.; Tian, Y.D.; Wu, Y.Y.; Xing, X.H.; Jiang, H.Q.; Zhou, Q.; Xing, H.; Jiang, H.D. Effect of simulated acid rain on antioxidative characteristics in different soybean genotypes. Soyb. Sci. 2014, 33, 41–45, 57, (In Chinese with English abstract). [Google Scholar]
- Sun, J.Y.; Zhao, Y.T.; Liu, F.; Liang, B.W. Identification of cultivated soybean germplasm resources from China for acid rain tolerance. Soyb. Sci. 2001, 20, 245–248, (In Chinese with English abstract). [Google Scholar]
- Jin, H.B.; Si, W. The present acid rain pollution condition and trend analysis of Jiangsu Province. Jiangsu Environ. Sci. Technol. 2000, 13, 22–23, (In Chinese with English abstract). [Google Scholar]
- Niu, Y.W.; Gu, J.Q.; Yu, X.M.; Jiang, H.R.; Dai, X. The chemical feature of precipitation in the Yangtze River Delta background region. Environ. Chem. 2010, 29, 358–362, (In Chinese with English abstract). [Google Scholar]
- Zhang, G.; Liu, D.; He, X.; Yu, D.; Pu, M. Acid rain in Jiangsu province, eastern China: Tempo-spatial variations features and analysis. Atmos. Pollut. Res. 2017, 8, 1031–1043. [Google Scholar] [CrossRef]
- Qiu, L.J.; Chang, R.Z.; Liu, Z.X.; Guan, R.X. Descriptors and Data Standard for Soybean (Glycine spp.); China Agriculture Press: Beijing, China, 2006; pp. 56–86. [Google Scholar]
- SAS Institute, Inc. Base SAS®® 9.2 Procedures Guide; SAS Institute, Inc.: Cary, NC, USA, 2008. [Google Scholar]
- SAS Institute, Inc. SAS/STAT®® 9.2 User’s Guide; SAS Institute, Inc.: Cary, NC, USA, 2008. [Google Scholar]
- Lu, Y.; Hao, Z.; Xie, C.; Crossa, J.; Araus, J.L.; Gao, S.; Vivek, B.S.; Magorokosho, C.; Mugo, S.; Makumbi, D.; et al. Large-scale screening for maize drought resistance using multiple selection criteria evaluated under water-stressed and well-watered environments. Field Crop Res. 2011, 124, 37–45. [Google Scholar] [CrossRef]
- Gouesnard, B.; Zanetto, A.; Welcker, C. Identification of adaptation traits to drought in collections of maize landraces from southern Europe and temperate regions. Euphytica 2016, 209, 565–584. [Google Scholar] [CrossRef]
- Bouslama, M.; Schapaugh, W.T. Stress tolerance in soybeans: I. Evaluation of three screening techniques for heat and drought tolerance. Crop Sci. 1984, 24, 933–937. [Google Scholar] [CrossRef]
- Yan, C.; Song, S.; Wang, W.; Wang, C.; Li, H.; Wang, F.; Li, S.; Sun, X. Screening diverse soybean genotypes for drought tolerance by membership function value based on multiple traits and drought-tolerant coefficient of yield. BMC Plant Biol. 2020, 20, 321. [Google Scholar] [CrossRef] [PubMed]
- Lan, J.S.; Hu, F.S.; Zhang, J.R. The concept and statistical method of drought resistance index in crops. Acta. Agric. Boreali. Sin. 1990, 5, 20–25, (In Chinese with English abstract). [Google Scholar]
- Hao, Z.F.; Li, X.H.; Su, Z.J.; Xie, C.X.; Li, M.S.; Liang, X.L.; Weng, J.F.; Zhang, D.G.; Li, L.; Zhang, S.H. A proposed selection criterion for drought resistance across multiple environments in maize. Breed. Sci. 2011, 61, 101–108. [Google Scholar] [CrossRef]
- Wang, L.F.; Wu, J.; Jing, R.L.; Cheng, X.Z.; Wang, S.M. Identification of mungbean germplasm resources resistant to drought at adult stage. Acta. Agron. Sin. 2015, 41, 1287–1294, (In Chinese with English abstract). [Google Scholar] [CrossRef]
- Zadeh, L.A. Fuzzy sets. Inf. Control 1965, 8, 338–353. [Google Scholar] [CrossRef]
- Tao, X.X. A preliminary application of fuzzy mathematics in agricultural science. J. Shenyang Agric. Coll. 1982, 2, 96–107, (In Chinese with English abstract). [Google Scholar]
- Reddy, M.R. Acid precipitation effects on growth and yield responses of twenty soybean and twelve snap bean cultivars. J. Environ. Qual. 1989, 18, 145–148. [Google Scholar] [CrossRef]
- Sánchez-Martín, J.; Mur, L.A.J.; Rubiales, D.; Prats, E. Targeting sources of drought tolerance within an Avena spp. collection through multivariate approaches. Planta 2012, 236, 1529–1545. [Google Scholar] [CrossRef] [PubMed]
- Trapp, J.J.; Urrea, C.A.; Zhou, J.; Khot, L.R.; Sankaran, S.; Miklas, P.N. Selective phenotyping traits related to multiple stress and drought response in dry bean. Crop Sci. 2016, 56, 1460–1472. [Google Scholar] [CrossRef]
- Takemoto, B.K.; Shriner, D.S.; Johnston, J.W. Physiological responses of soybean (Glycine max L. Merr) to simulated acid rain and ambient ozone in the field. Water Air Soil Pollut. 1987, 33, 373–384. [Google Scholar] [CrossRef]
- Kohno, Y. Effects of simulated acid rain on Asian crops and garden plants. In Air pollution impacts on plants in East Asia; Izuta, T., Ed.; Springer: Tokyo, Japan, 2017; pp. 223–235. [Google Scholar]
- Evans, L.S.; Lewin, K.F. Growth, development and yield responses of pinto beans and soybeans to hydrogen ion concentrations of simulated acidic rain. Environ. Exp. Bot. 1981, 21, 103–113. [Google Scholar] [CrossRef]
- Troiano, J.; Colavito, L.; Heller, L.; Mccune, D.C.; Jacobson, J.S. Effects of acidity of simulated rain and its joint action with ambient ozone on measures of biomass and yield in soybean. Environ. Exp. Bot. 1983, 23, 113–119. [Google Scholar] [CrossRef]
- Niu, F.X.; Hua, X.X.; Guo, X.D.; Wu, J.Y.; Li, H.M.; Ding, C.W. Studies on several physiological indexes of the drought resistance of sweet potato and its comprehensive evaluation. Acta. Agron. Sin. 1996, 22, 392–398, (In Chinese with English abstract). [Google Scholar]
- Qi, X.S.; Liu, Z.X.; Guan, R.X.; Wang, X.R.; Gou, Z.W.; Chang, R.Z.; Qiu, L.J. Comparison of evaluation methods for drought-resistance at soybean adult stage. Acta. Agron. Sin. 2012, 38, 665–674, (In Chinese with English abstract). [Google Scholar] [CrossRef]
Publisher’s Note: MDPI stays neutral with regard to jurisdictional claims in published maps and institutional affiliations. |
© 2021 by the authors. Licensee MDPI, Basel, Switzerland. This article is an open access article distributed under the terms and conditions of the Creative Commons Attribution (CC BY) license (https://creativecommons.org/licenses/by/4.0/).