
Integrated Transcriptome and Metabolome Analysis Reveals an Essential Role for Auxin in Hypocotyl Elongation during End-of-Day Far-Red Treatment of Cucurbita moschata (Duch. Ex Lam.)

Abstract
1. Introduction
2. Methods
2.1. Plant Materials and Sample Collection
2.2. Auxin Quantification
2.3. Metabolomic Profiling
2.4. Transcriptome Sequencing and Identification of DEGs
2.5. Quantitative Real-Time PCR (qRT–PCR)
2.6. Preparation and Observation of Hypocotyl Paraffin Sections
2.7. Statistical Analysis
3. Results
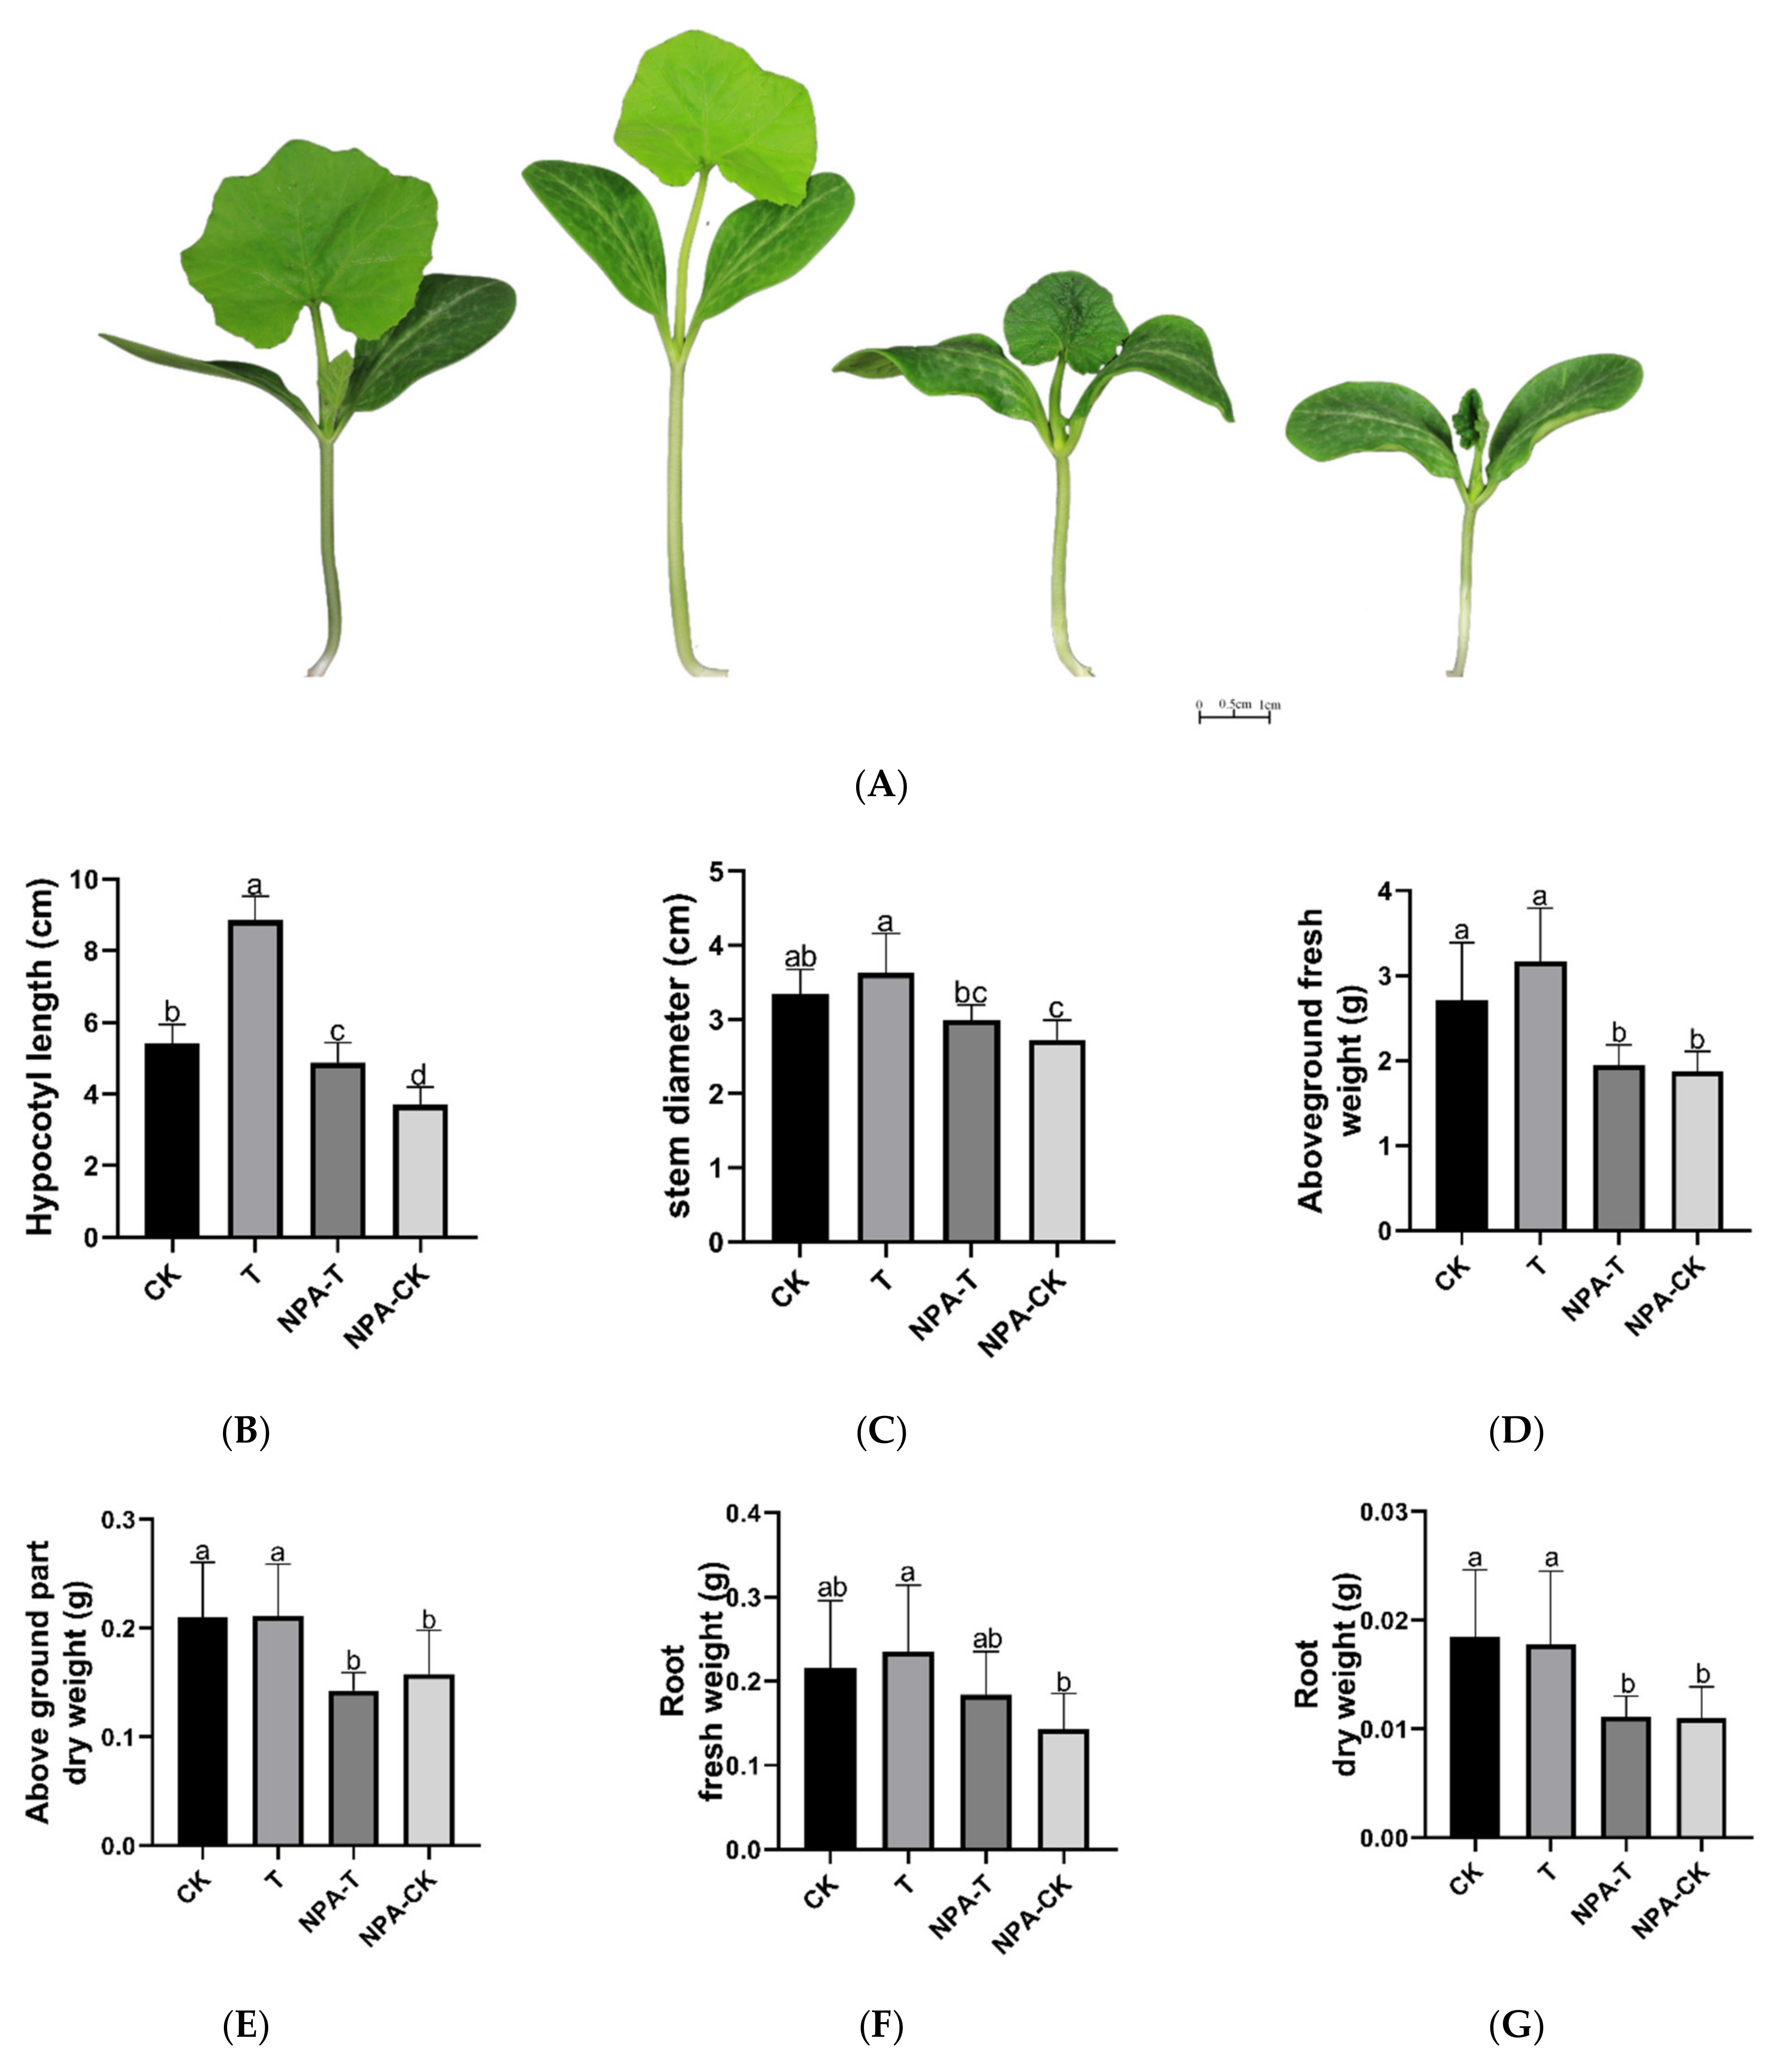
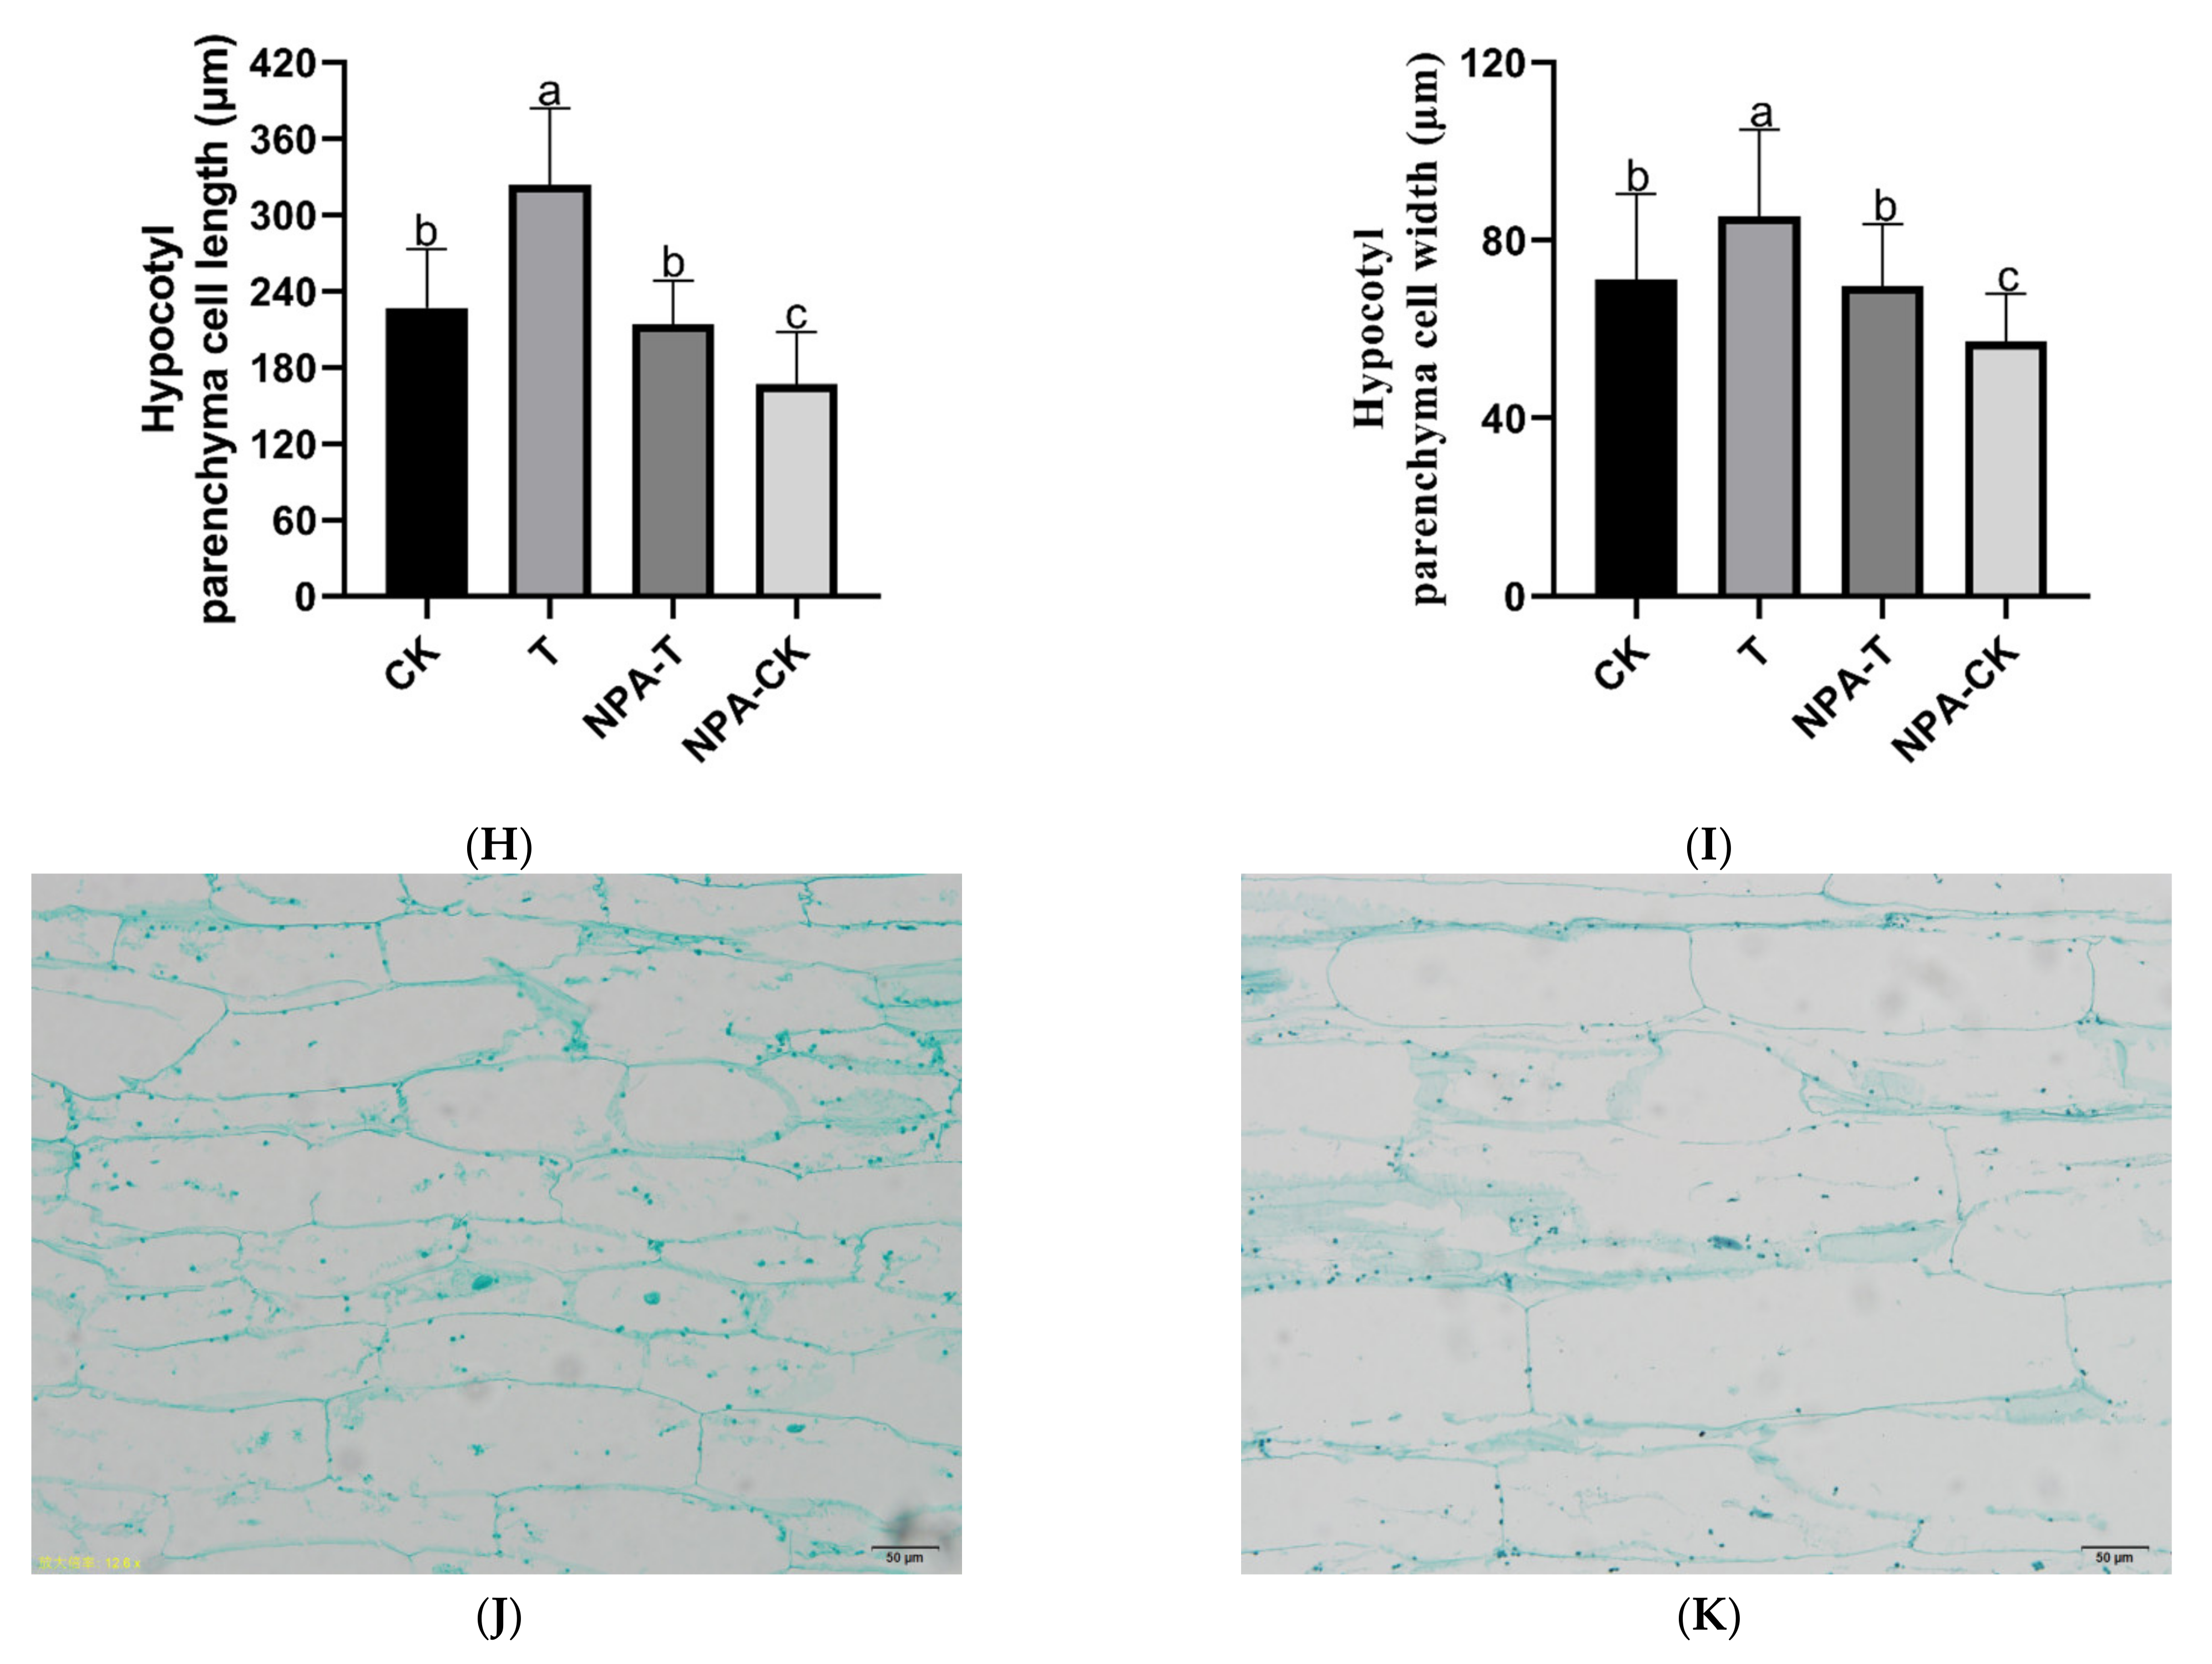
3.1. Effects of EOD-FR on Growth, Hypocotyl Cell Morphology, and Auxin Levels of Pumpkin Seedlings
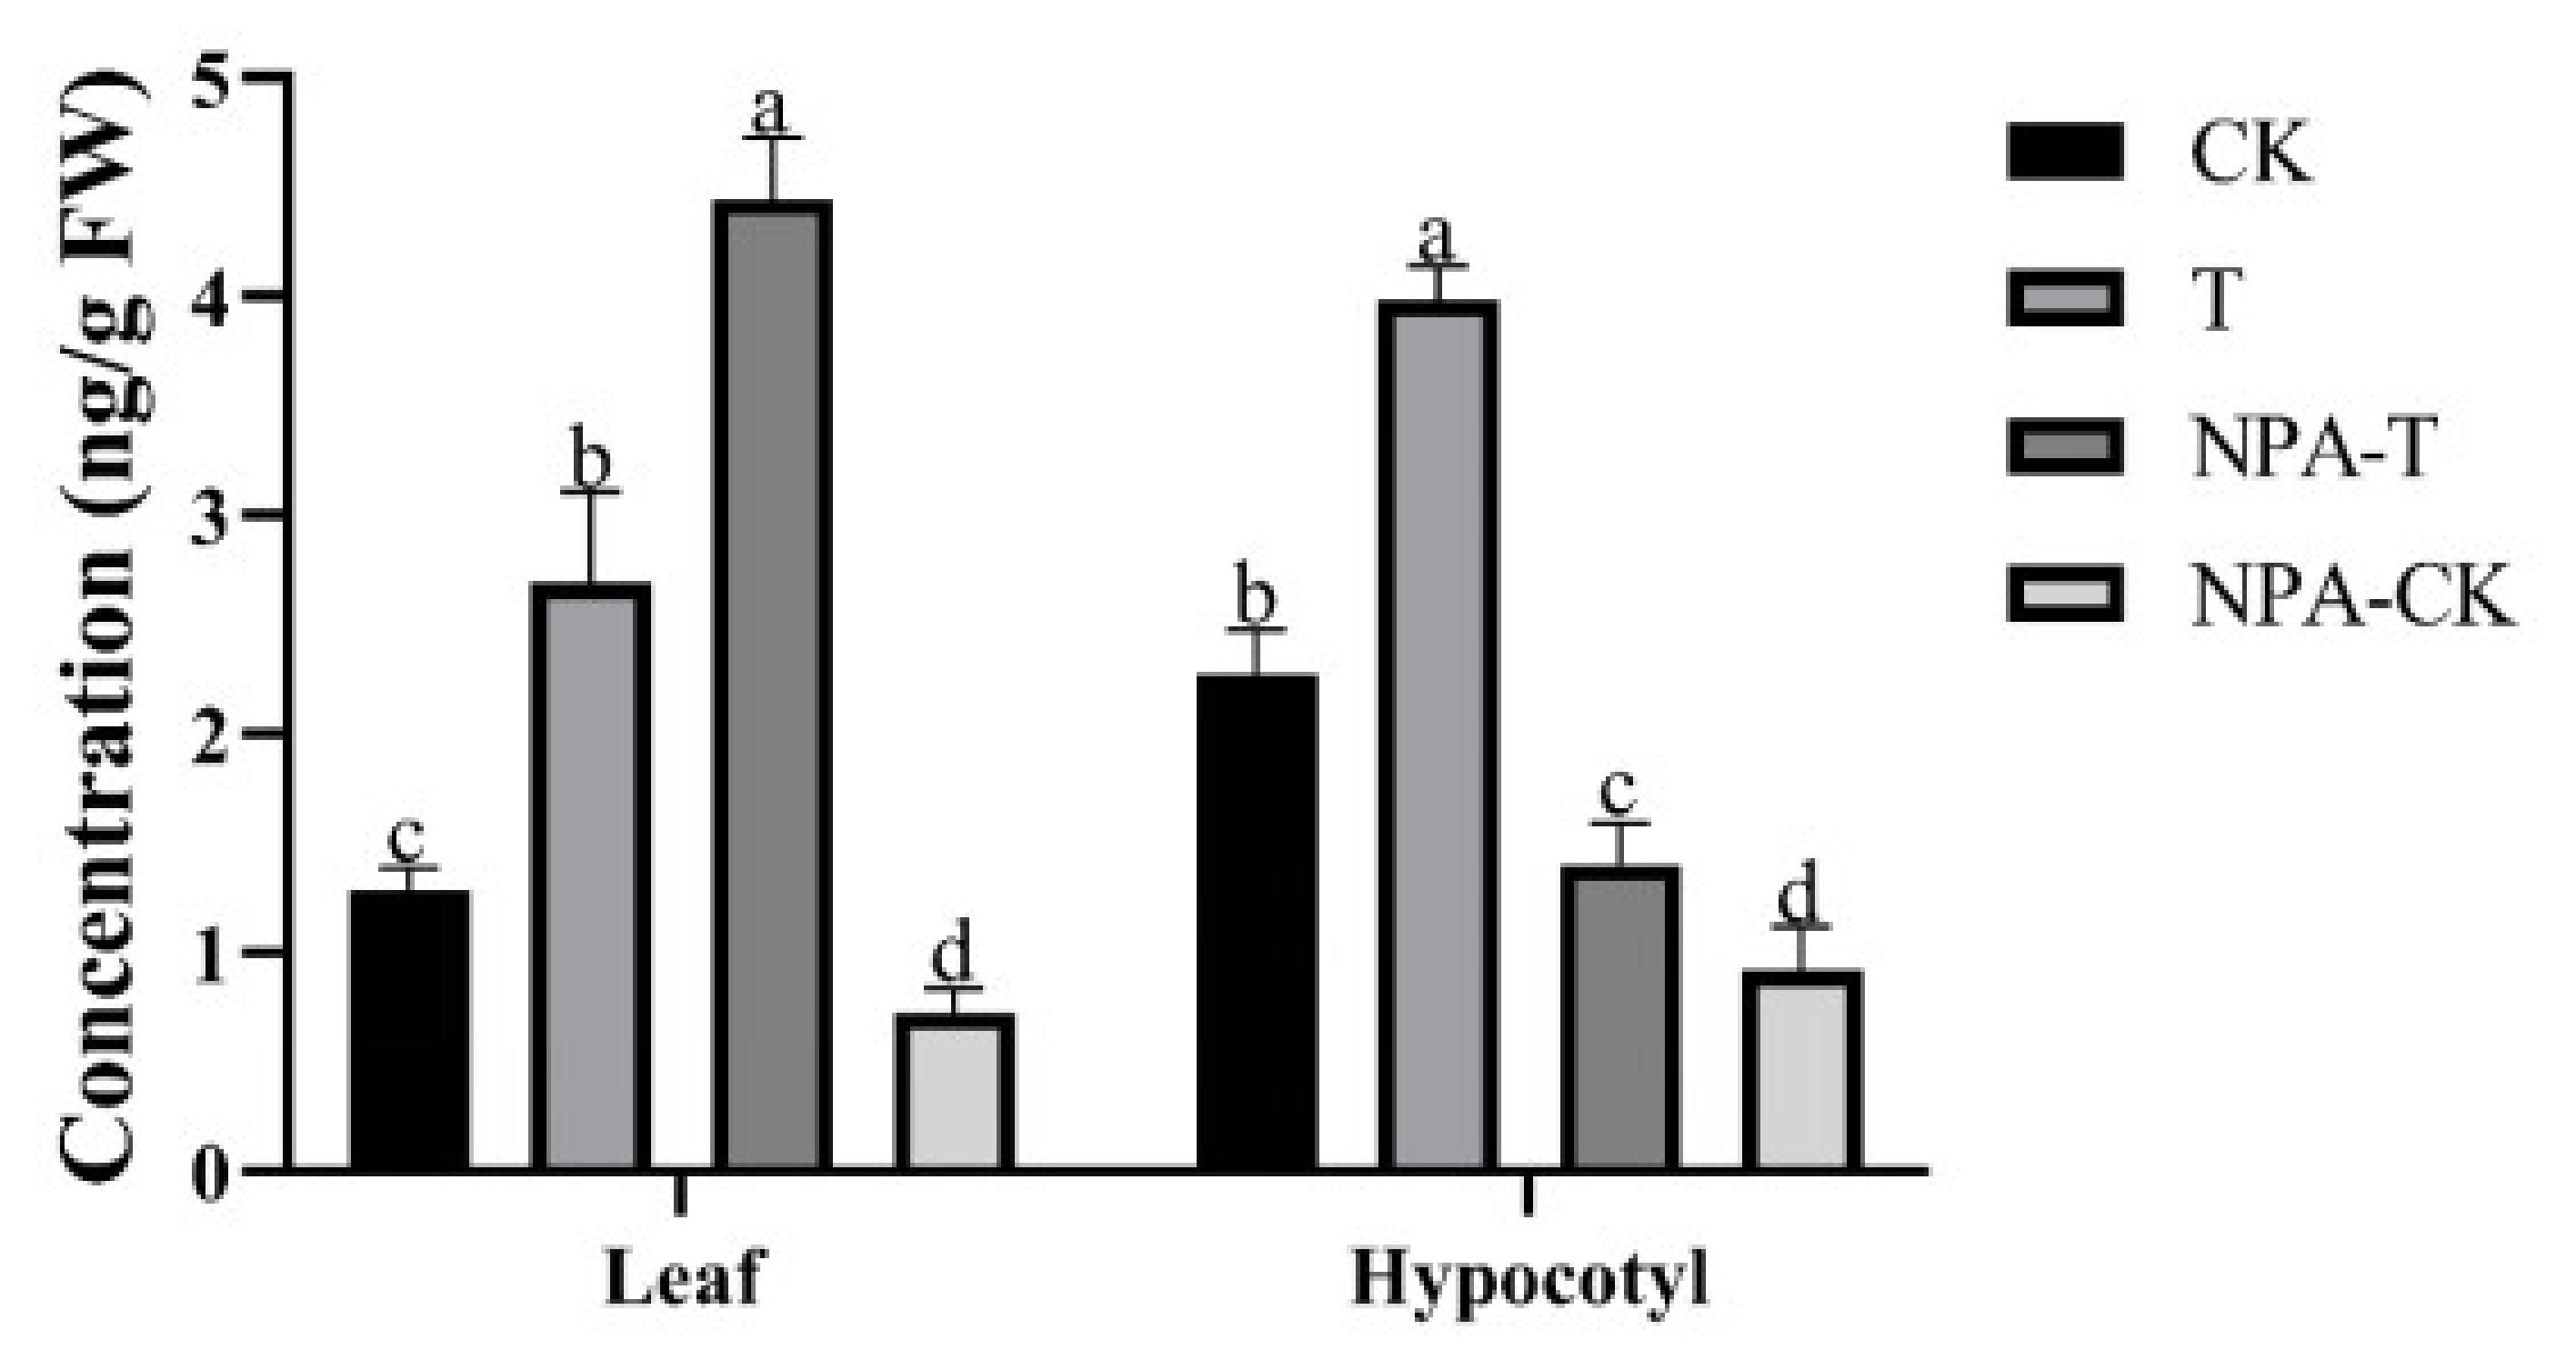
3.2. Changes in Auxin Level after EOD-FR Treatment
3.3. Metabolomics Analyses and Identification of Differentially Abundant Metabolites
3.4. RNA-Seq Analysis
3.5. GO and KEGG Enrichment Analysis of Differentially Expressed Genes
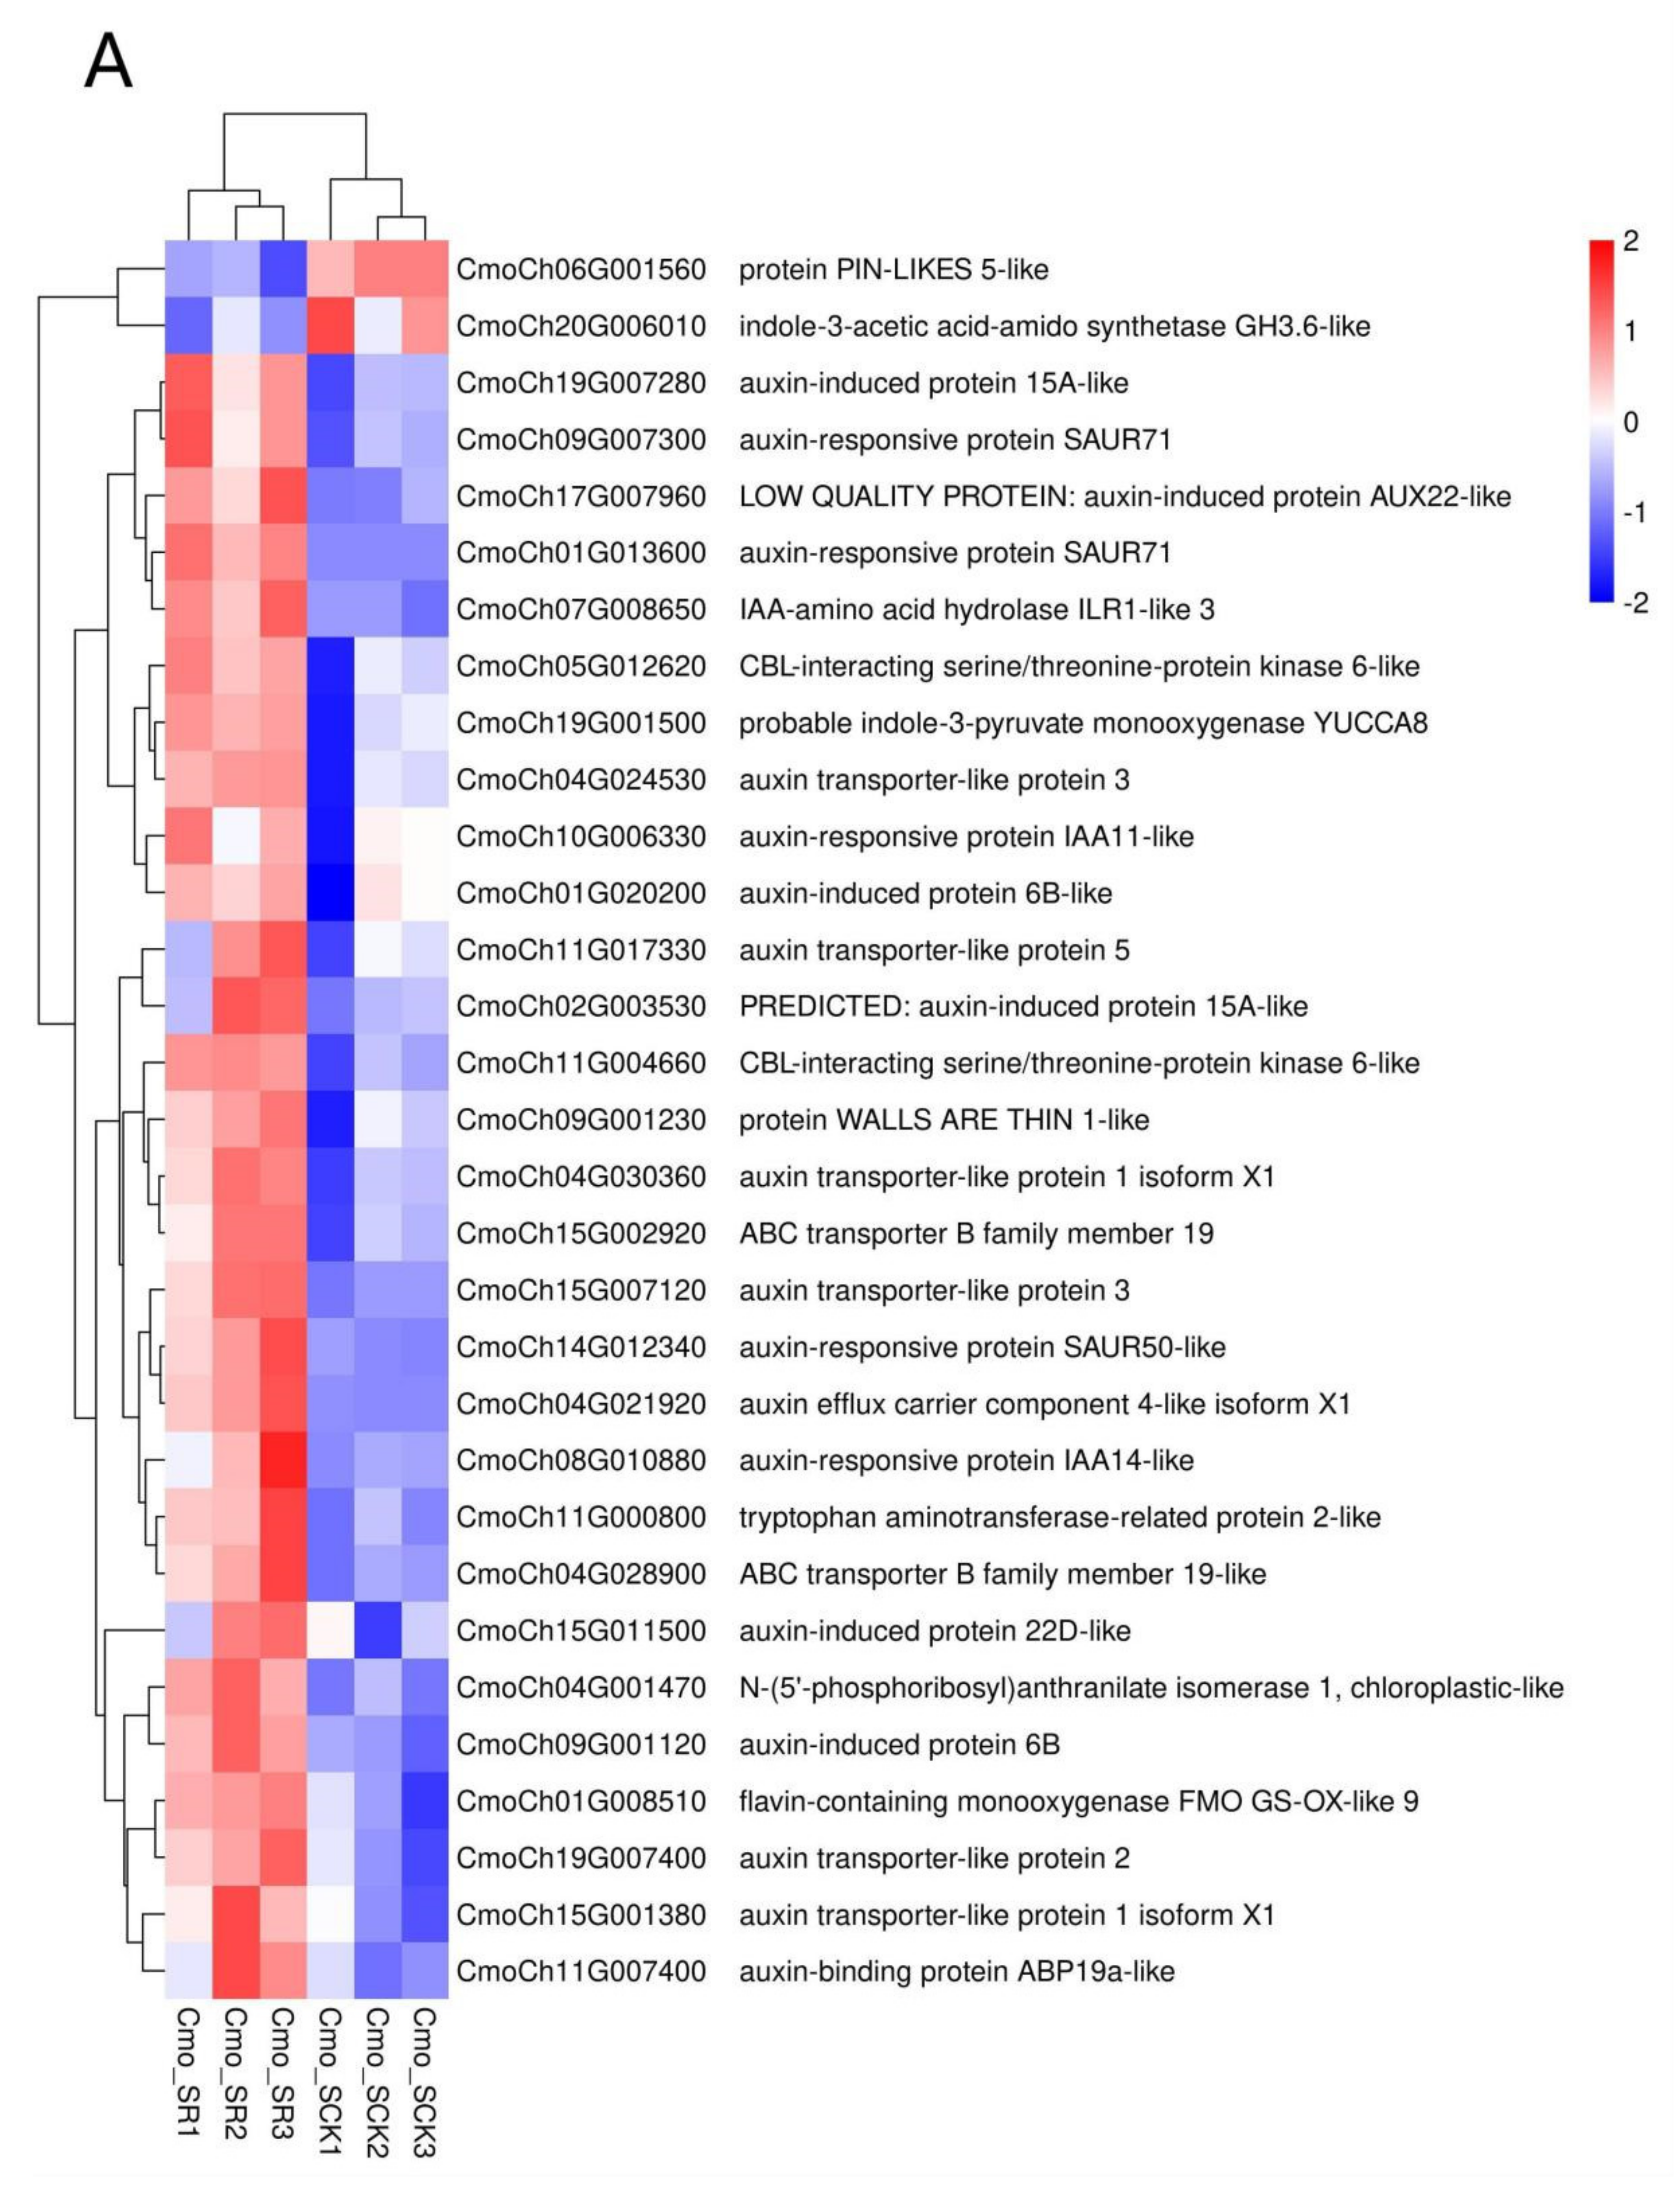
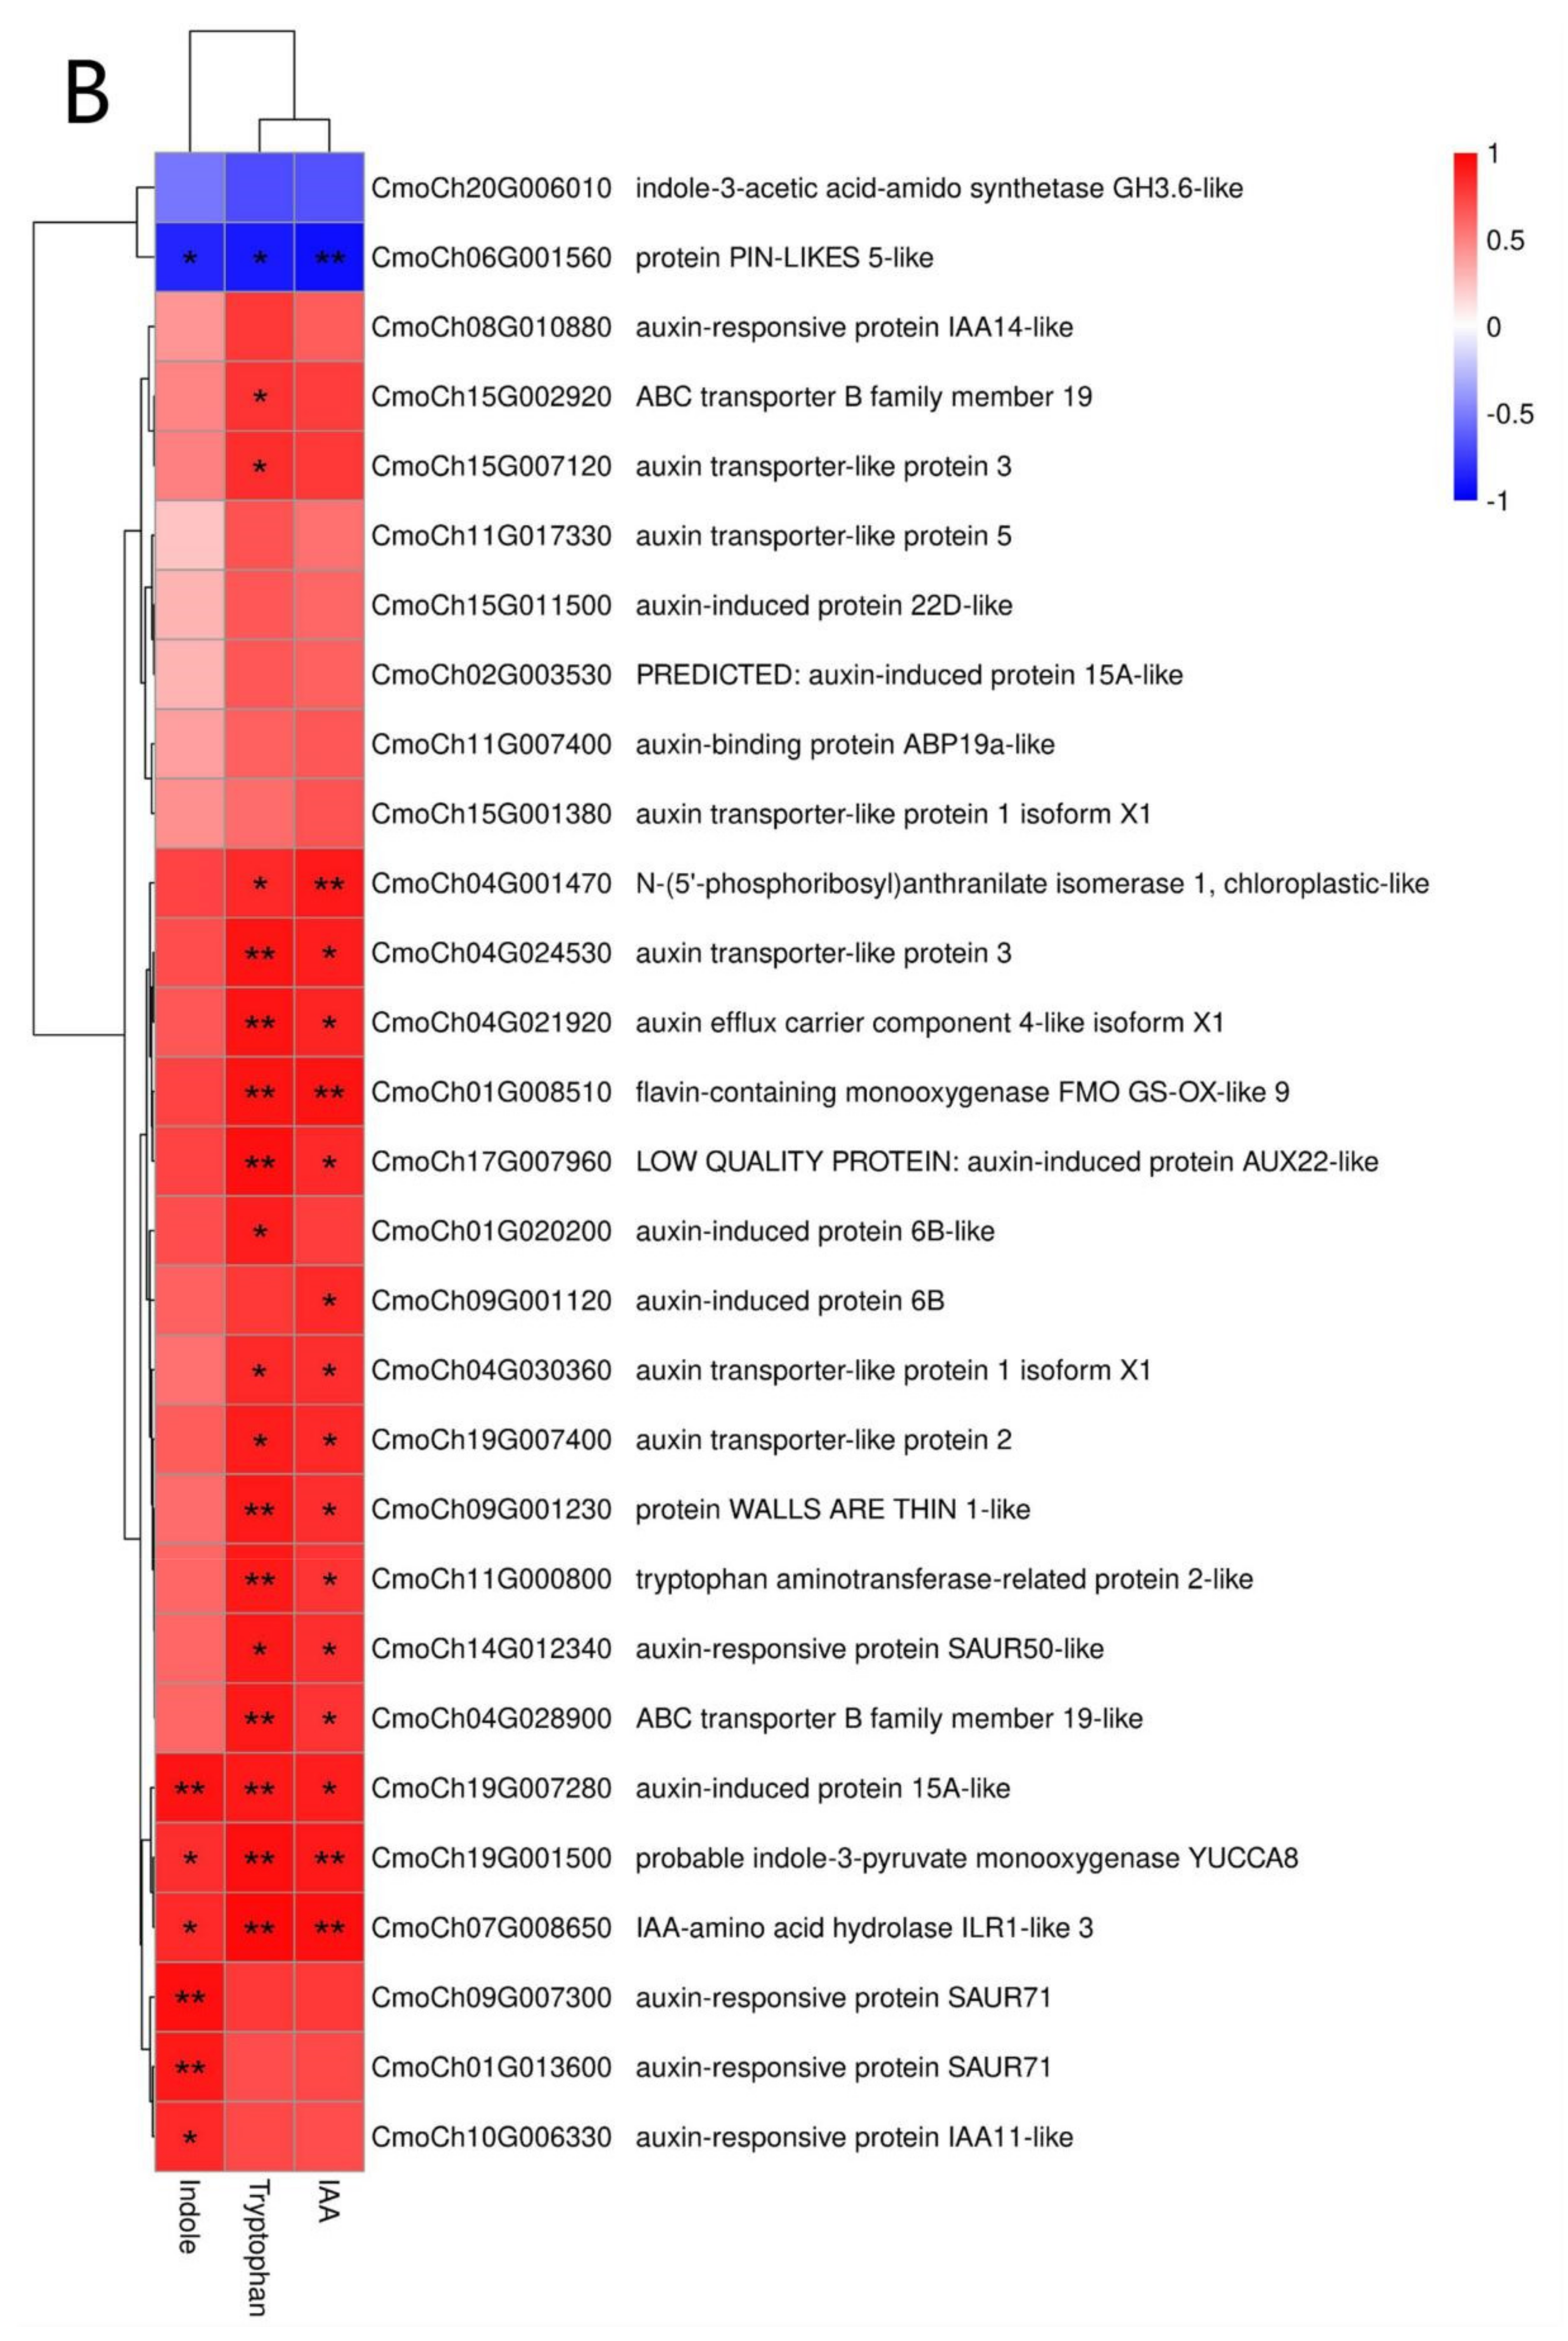
3.6. Identification of Auxin-Related DEGs
3.7. Integrated Analysis of the Transcriptome and Metabolome
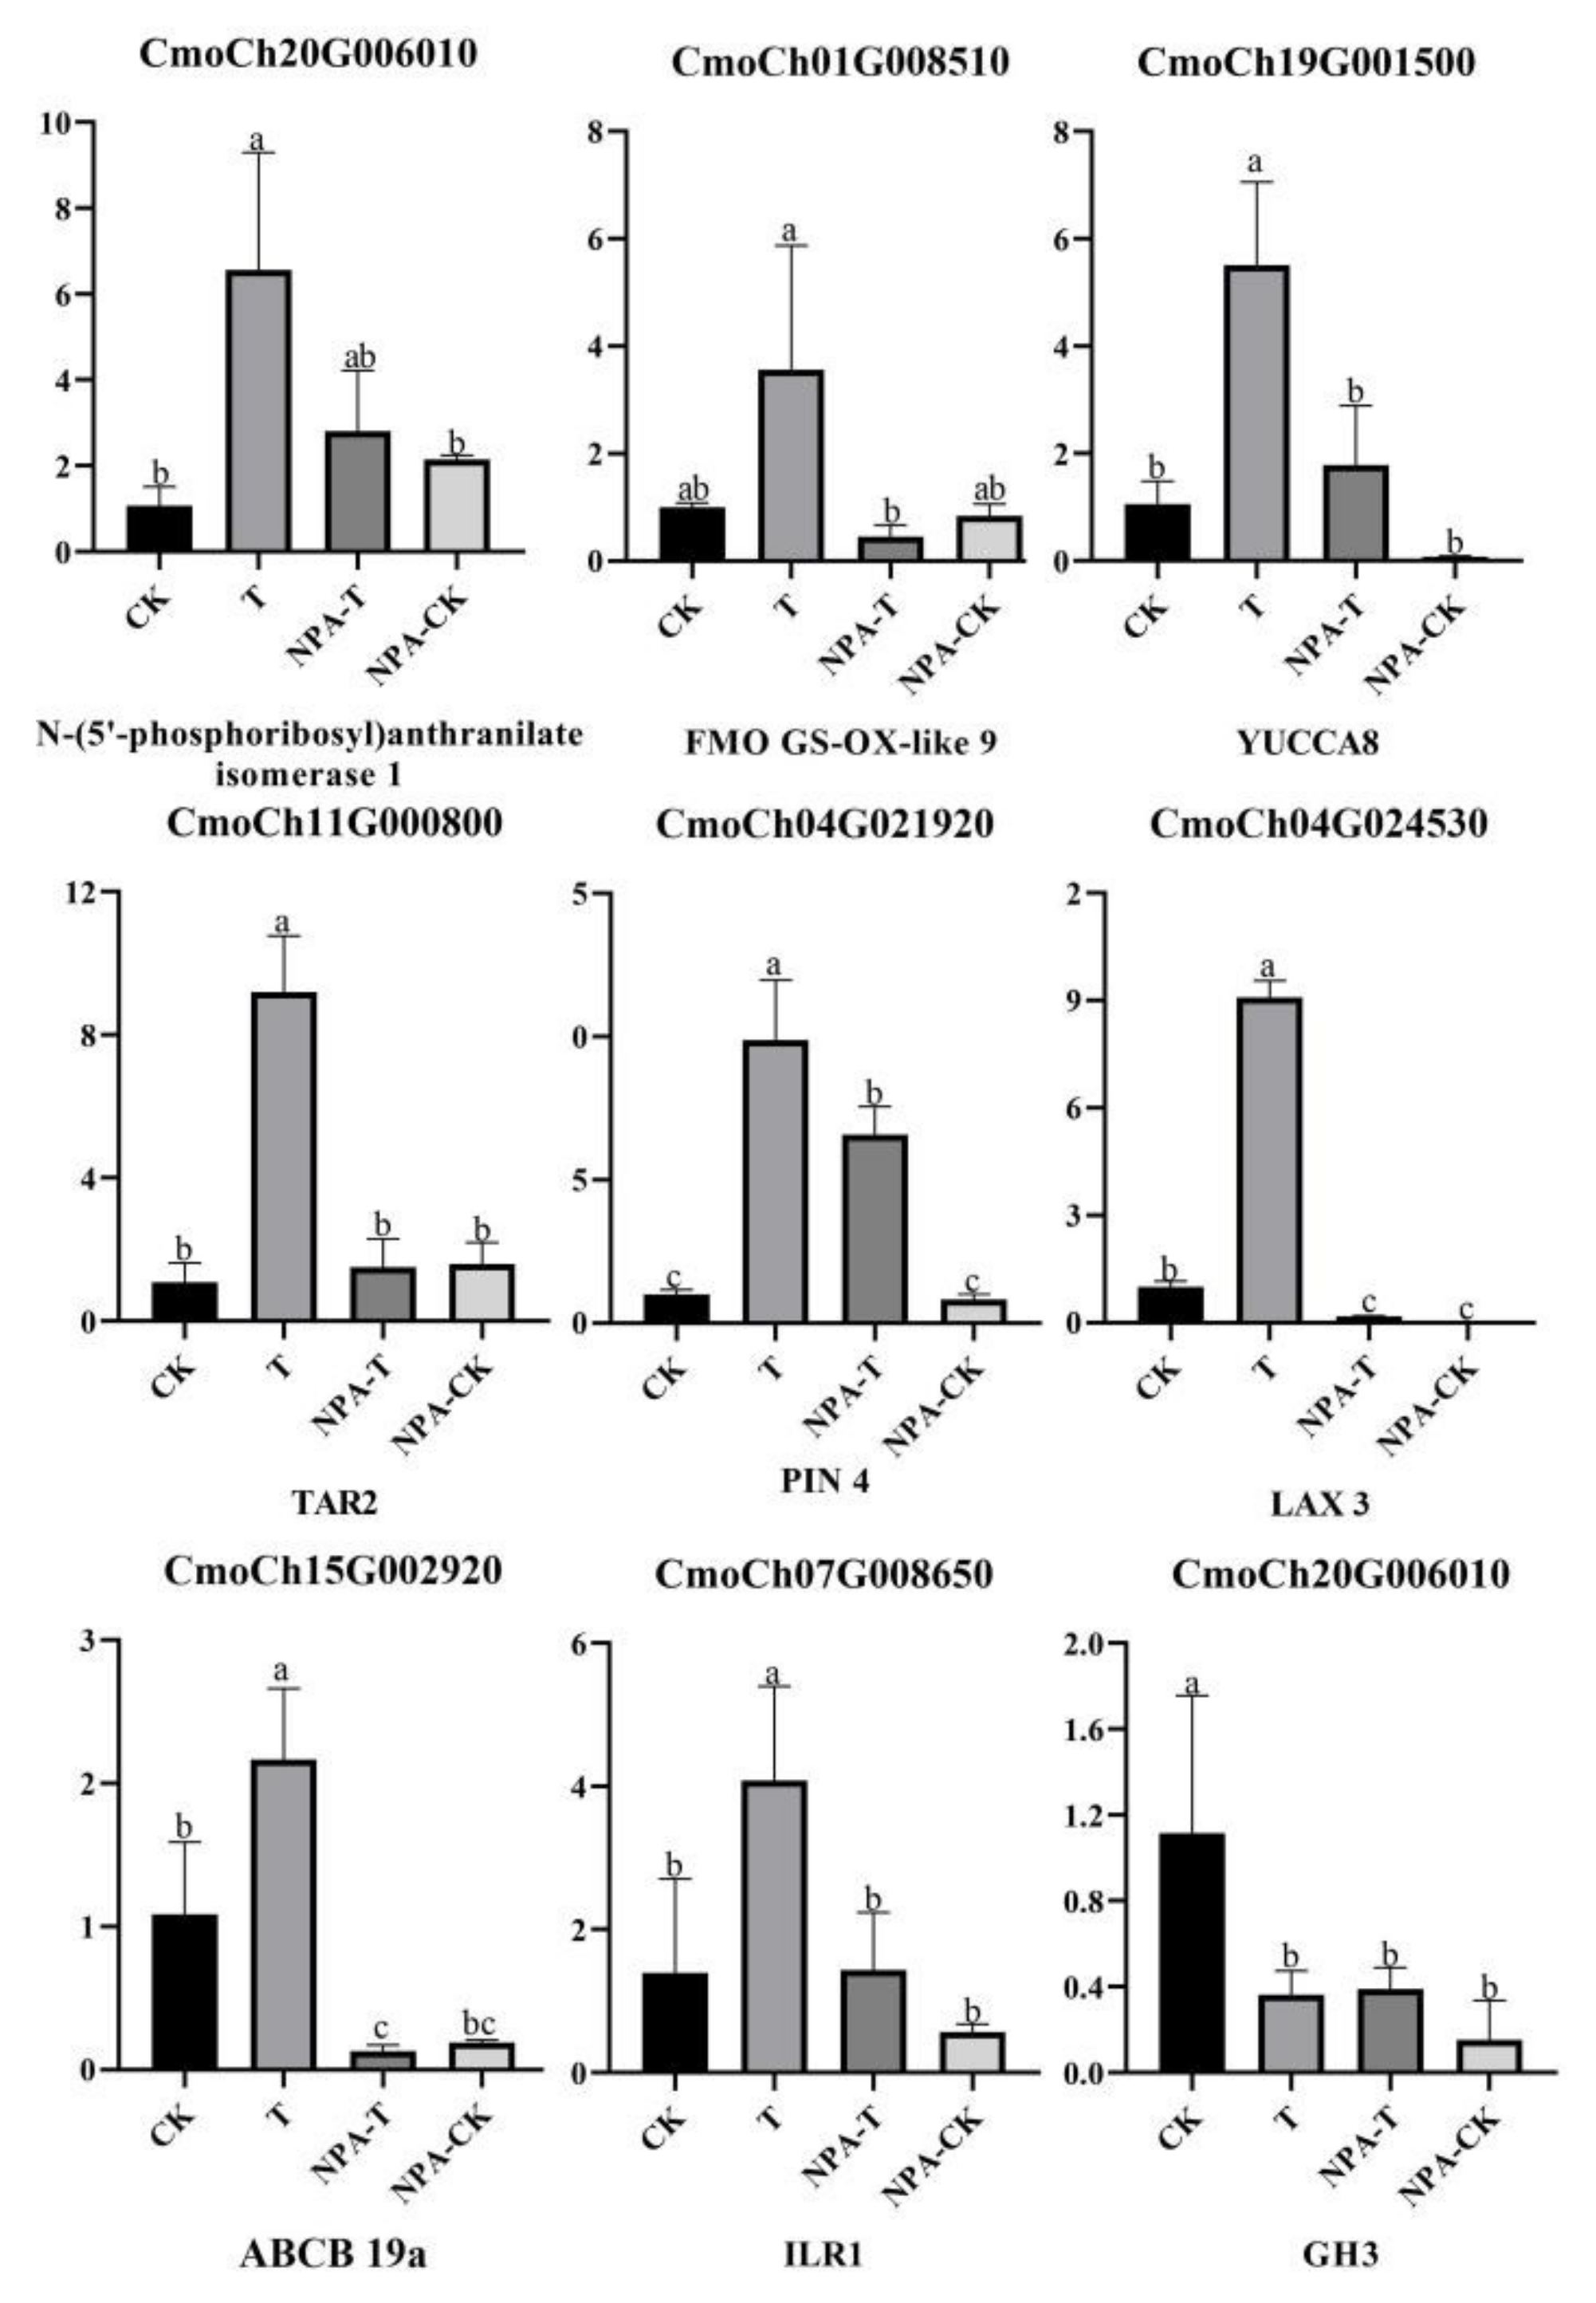
3.8. qRT–PCR
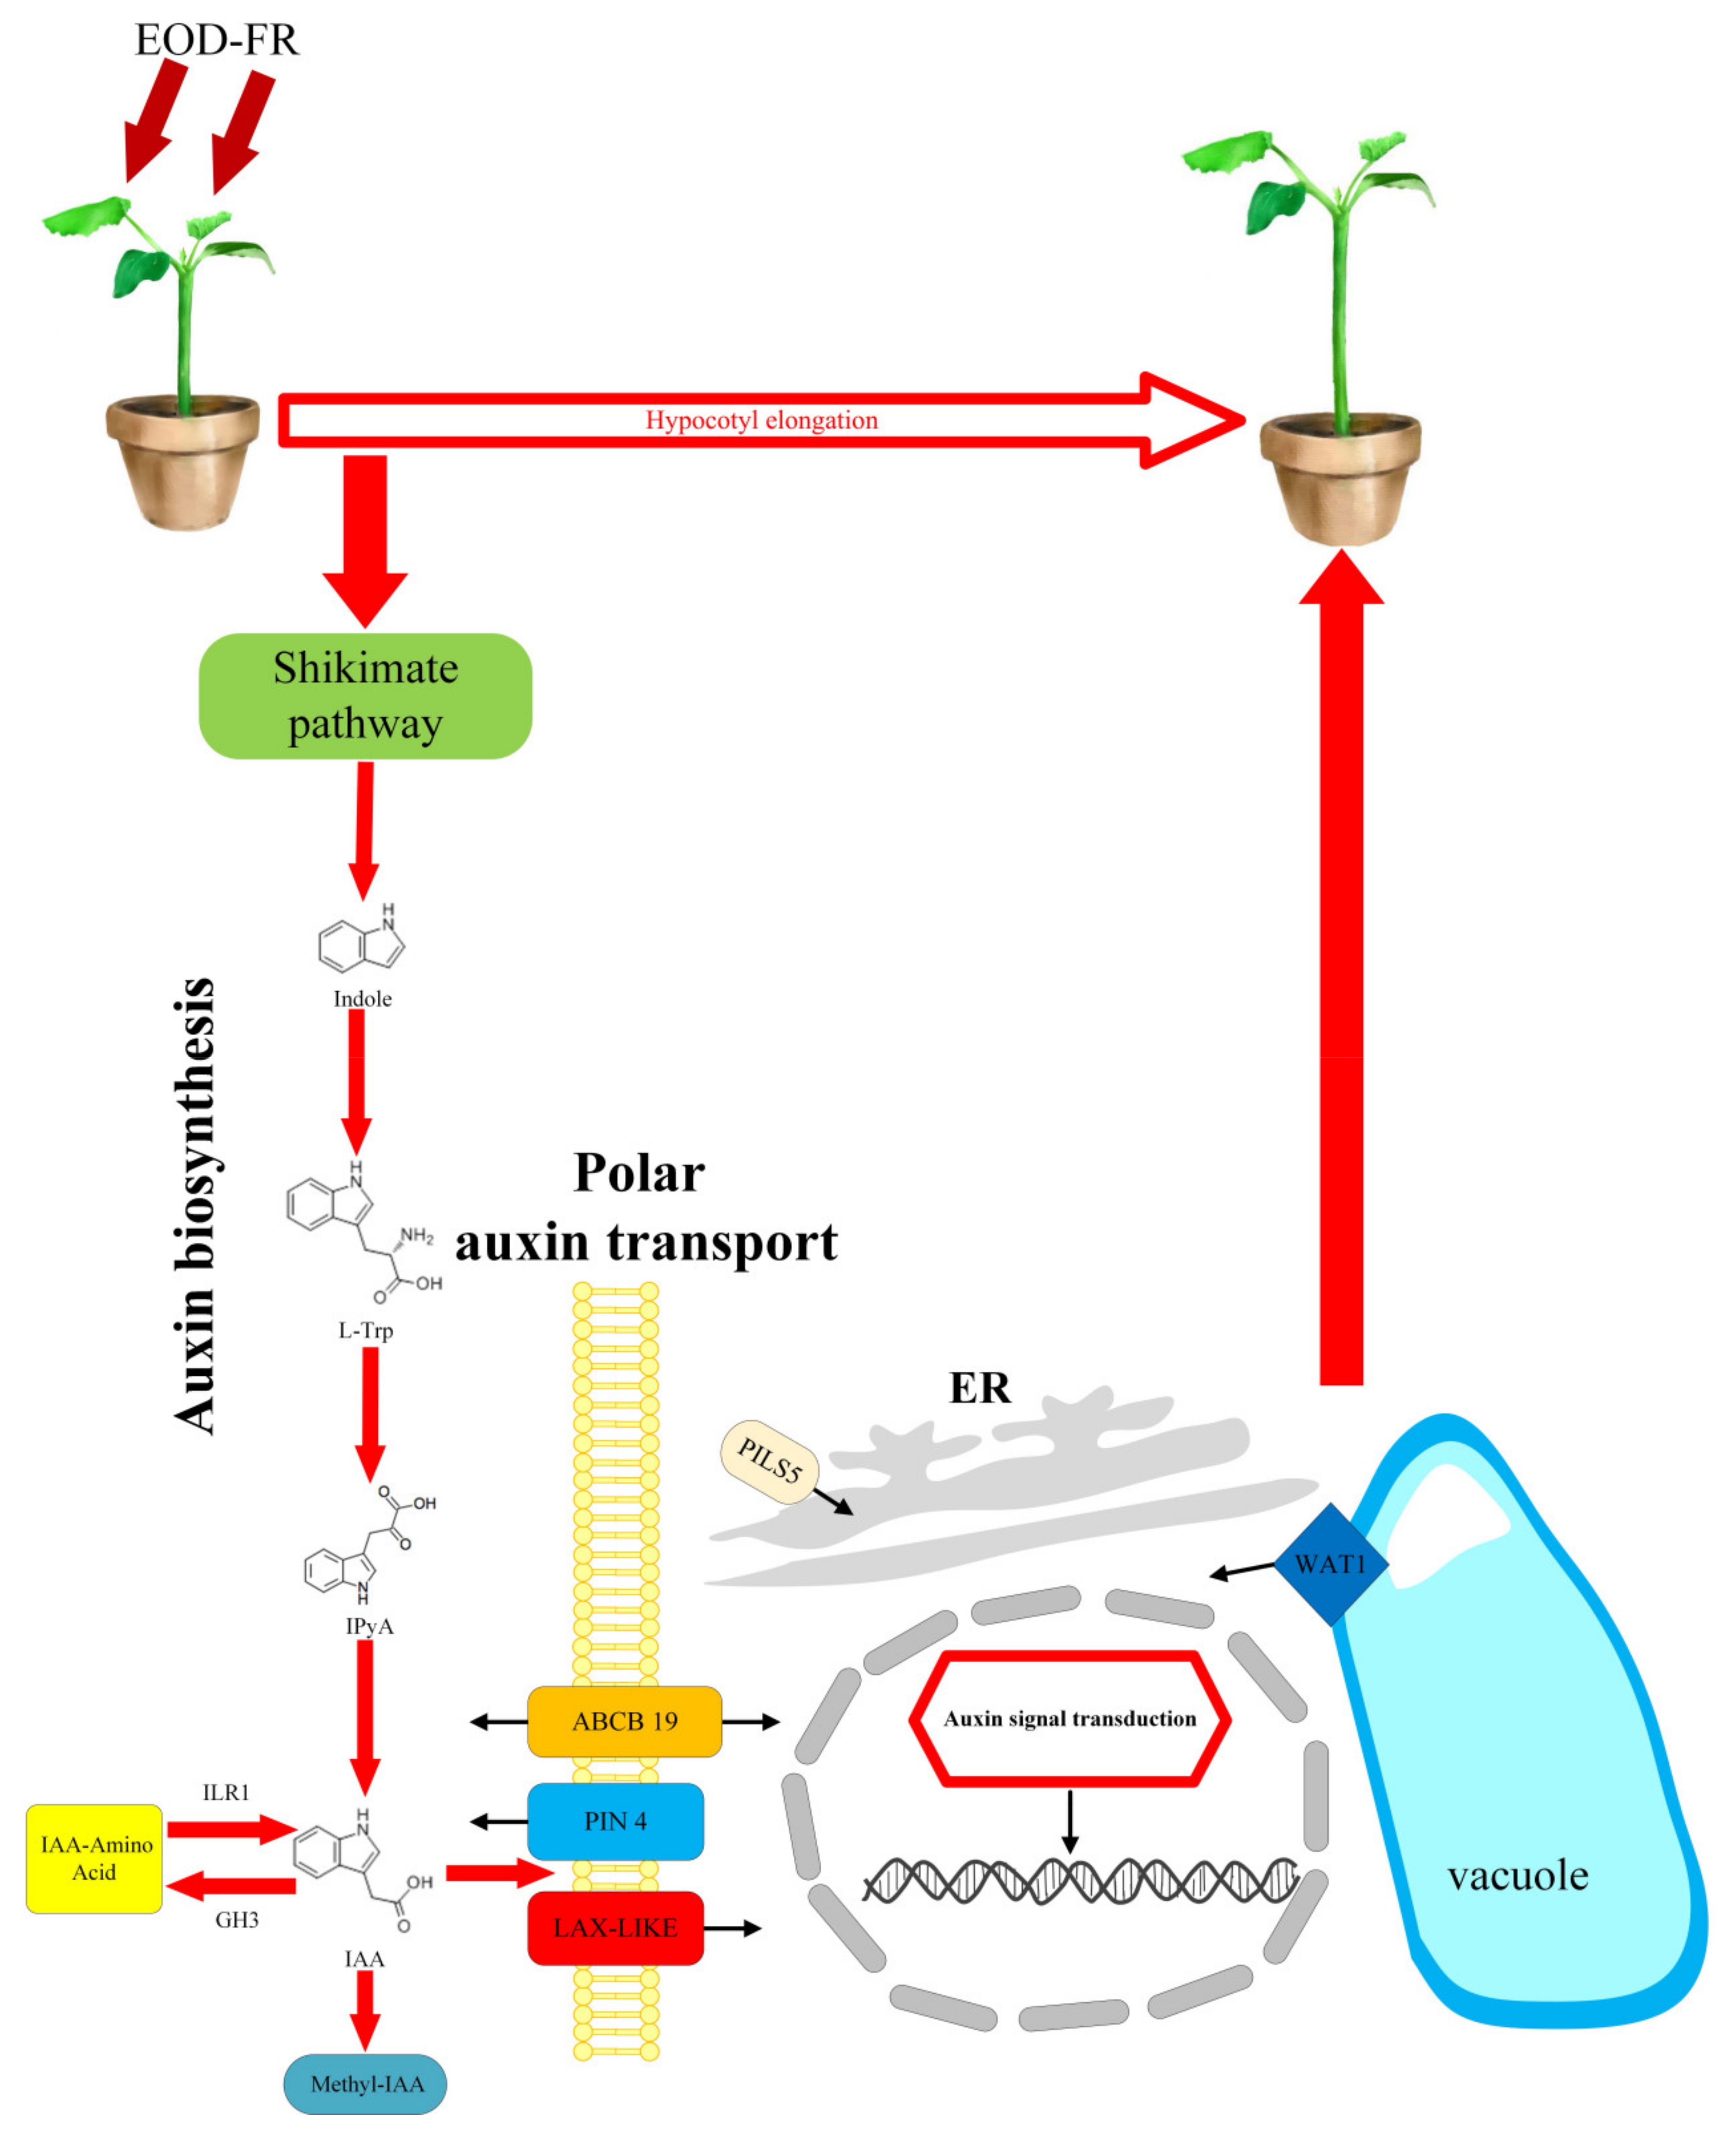
4. Discussion
5. Conclusions
Supplementary Materials
Author Contributions
Funding
Institutional Review Board Statement
Informed Consent Statement
Conflicts of Interest
References
- Chia, P.-L.; Kubota, C. End-of-day Far-red Light Quality and Dose Requirements for Tomato Rootstock Hypocotyl Elongation. Hortscience 2010, 45, 1501–1506. [Google Scholar] [CrossRef]
- Bantis, F.; Smirnakou, S.; Ouzounis, T.; Koukounaras, A.; Ntagkas, N.; Radoglou, K. Current status and recent achievements in the field of horticulture with the use of light-emitting diodes (LEDs). Sci. Hortic. 2018, 235, 437–451. [Google Scholar] [CrossRef]
- Bognar, L.K.; Hall, A.; Adam, E.; Thain, S.C.; Nagy, F.; Millar, A.J. The circadian clock controls the expression pattern of the circadian input photoreceptor, phytochrome B. Proc. Natl. Acad. Sci. USA 1999, 96, 14652–14657. [Google Scholar] [CrossRef] [PubMed]
- Franklin, K.A. Shade avoidance. New Phytol. 2008, 179, 930–944. [Google Scholar] [CrossRef]
- Mizuno, T.; Oka, H.; Yoshimura, F.; Ishida, K.; Yamashino, T. Insight into the mechanism of end-of-day far-red light (EODFR)-induced shade avoidance responses in Arabidopsis thaliana. Biosci. Biotechnol. Biochem. 2015, 79, 1987–1994. [Google Scholar] [CrossRef]
- Yang, Z.-C.; Kubota, C.; Chia, P.-L.; Kacira, M. Effect of end-of-day far-red light from a movable LED fixture on squash rootstock hypocotyl elongation. Sci. Hortic. 2012, 136, 81–86. [Google Scholar] [CrossRef]
- Xiong, J.Q.; Patil, G.G.; Moe, R. Effect of DIF and end-of-day light quality on stem elongation in Cucumis sativus. Sci. Hortic. 2002, 94, 219–229. [Google Scholar] [CrossRef]
- Kalaitzoglou, P.; van Ieperen, W.; Harbinson, J.; van der Meer, M.; Martinakos, S.; Weerheim, K.; Nicole, C.C.S.; Marcelis, L.F.M. Effects of Continuous or End-of-Day Far-Red Light on Tomato Plant Growth, Morphology, Light Absorption, and Fruit Production. Front. Plant. Sci. 2019, 10, 322. [Google Scholar] [CrossRef]
- Graham, H.A.H.; Decoteau, D.R. Young watermelon plant growth responses to end-of-day red and far-red light are affected by direction of exposure and plant part exposed. Sci. Hortic. 1997, 69, 41–49. [Google Scholar] [CrossRef]
- Louws, F.J.; Rivard, C.L.; Kubota, C. Grafting fruiting vegetables to manage soilborne pathogens, foliar pathogens, arthropods and weeds. Sci. Hortic. 2010, 127, 127–146. [Google Scholar] [CrossRef]
- Karaagac, O.; Balkaya, A. Interspecific hybridization and hybrid seed yield of winter squash (Cucurbita maxima Duch.) and pumpkin (Cucurbita moschata Duch.) lines for rootstock breeding. Sci. Hortic. 2013, 149, 9–12. [Google Scholar] [CrossRef]
- Tao, Y.; Ferrer, J.-L.; Ljung, K.; Pojer, F.; Hong, F.; Long, J.A.; Li, L.; Moreno, J.E.; Bowman, M.E.; Ivans, L.J.; et al. Rapid synthesis of auxin via a new tryptophan-dependent pathway is required for shade avoidance in plants. Cell 2008, 133, 164–176. [Google Scholar] [CrossRef]
- Keuskamp, D.H.; Pollmann, S.; Voesenek, L.A.C.J.; Peeters, A.J.M.; Pierik, R. Auxin transport through PIN-FORMED 3 (PIN3) controls shade avoidance and fitness during competition. Proc. Natl. Acad. Sci. USA 2010, 107, 22740–22744. [Google Scholar] [CrossRef] [PubMed]
- Zhang, M.; Kong, X.; Xu, X.; Li, C.; Tian, H.; Ding, Z. Comparative Transcriptome Profiling of the Maize Primary, Crown and Seminal Root in Response to Salinity Stress. PLoS ONE 2015, 10, e0121222. [Google Scholar] [CrossRef] [PubMed]
- Upadhyay, S.; Phukan, U.J.; Mishra, S.; Shukla, R.K. De novo leaf and root transcriptome analysis identified novel genes involved in Steroidal sapogenin biosynthesis in Asparagus racemosus. BMC Genom. 2014, 15, 1–13. [Google Scholar] [CrossRef]
- Schwender, J.; Koenig, C.; Klapperstueck, M.; Heinzel, N.; Munz, E.; Hebbelmann, I.; Hay, J.O.; Denolf, P.; De Bodt, S.; Redestig, H.; et al. Transcript abundance on its own cannot be used to infer fluxes in central metabolism. Front. Plant. Sci. 2014, 5, 668. [Google Scholar] [CrossRef] [PubMed]
- Bino, R.J.; Hall, R.D.; Fiehn, O.; Kopka, J.; Saito, K.; Draper, J.; Nikolau, B.J.; Mendes, P.; Roessner-Tunali, U.; Beale, M.H.; et al. Potential of metabolomics as a functional genomics tool. Trends Plant Sci. 2004, 9, 418–425. [Google Scholar] [CrossRef]
- Iino, M. Gravitropism and phototropism of maize coleoptiles—Evaluation of the cholodny-went theory through effects of auxin application and decapitation. Plant Cell Physiol. 1995, 36, 361–367. [Google Scholar] [CrossRef]
- Du, F.; Ruan, G.; Liu, H. Analytical methods for tracing plant hormones. Anal. Bioanal. Chem. 2012, 403, 55–74. [Google Scholar] [CrossRef]
- Trapnell, C.; Williams, B.A.; Pertea, G.; Mortazavi, A.; Kwan, G.; van Baren, M.J.; Salzberg, S.L.; Wold, B.J.; Pachter, L. Transcript assembly and quantification by RNA-Seq reveals unannotated transcripts and isoform switching during cell differentiation. Nat. Biotechnol. 2010, 28, 511–515. [Google Scholar] [CrossRef]
- Schmittgen, T.D.; Livak, K.J. Analyzing real-time PCR data by the comparative C-T method. Nat. Protoc. 2008, 3, 1101–1108. [Google Scholar] [CrossRef]
- Jing, W.; Zhang, S.; Fan, Y.; Deng, Y.; Wang, C.; Lu, J.; Sun, X.; Ma, N.; Shahid, M.O.; Li, Y.; et al. Molecular Evidences for the Interactions of Auxin, Gibberellin, and Cytokinin in Bent Peduncle Phenomenon in Rose (Rosa sp.). Int. J. Mol. Sci. 2020, 21, 1360. [Google Scholar] [CrossRef]
- Marklova, E. Where does indolylacrylic acid come from? Amino Acids 1999, 17, 401–413. [Google Scholar] [CrossRef]
- Won, C.; Shen, X.; Mashiguchi, K.; Zheng, Z.; Dai, X.; Cheng, Y.; Kasahara, H.; Kamiya, Y.; Chory, J.; Zhao, Y. Conversion of tryptophan to indole-3-acetic acid by Tryptophan Aminotransferases of Arabidopsis and YUCCAS in Arabidopsis. Proc. Natl. Acad. Sci. USA 2011, 108, 18518–18523. [Google Scholar] [CrossRef] [PubMed]
- Yamamoto, Y.; Kamiya, N.; Morinaka, Y.; Matsuoka, M.; Sazuka, T. Auxin biosynthesis by the YUCCA genes in rice. Plant Physiol. 2007, 143, 1362–1371. [Google Scholar] [CrossRef]
- Stepanova, A.N.; Robertson-Hoyt, J.; Yun, J.; Benavente, L.M.; Xie, D.-Y.; Dolezal, K.; Schlereth, A.; Juergens, G.; Alonso, J.M. TAA1-mediated auxin biosynthesis is essential for hormone crosstalk and plant development. Cell 2008, 133, 177–191. [Google Scholar] [CrossRef] [PubMed]
- Muller-Moule, P.; Nozue, K.; Pytlak, M.L.; Palmer, C.M.; Covington, M.F.; Wallace, A.D.; Harmer, S.L.; Maloof, J.N. YUCCA auxin biosynthetic genes are required for Arabidopsis shade avoidance. PeerJ 2016, 4, e2574. [Google Scholar] [CrossRef]
- Peng, M.; Li, Z.; Zhou, N.; Ma, M.; Jiang, Y.; Dong, A.; Shen, W.-H.; Li, L. Linking Phytochrome-Interacting factor to Histone Modification in Plant Shade Avoidance. Plant Physiol. 2018, 176, 1341–1351. [Google Scholar] [CrossRef] [PubMed]
- Casanova-Saez, R.; Voss, U. Auxin Metabolism Controls Developmental Decisions in Land Plants. Trends Plant. Sci. 2019, 24, 741–754. [Google Scholar] [CrossRef]
- Maeda, H.; Dudareva, N. The Shikimate Pathway and Aromatic Amino Acid Biosynthesis in Plants. Annu. Rev. Plant Biol. 2012, 63, 73–105. [Google Scholar] [CrossRef] [PubMed]
- Matsuda, F.; Yamada, T.; Miyazawa, H.; Miyagawa, H.; Wakasa, K. Characterization of tryptophan-overproducing potato transgenic for a mutant rice anthranilate synthase alpha-subunit gene (OASA1D). Planta 2005, 222, 535–545. [Google Scholar] [CrossRef]
- Morino, K.; Matsuda, F.; Miyazawa, H.; Sukegawa, A.; Miyagawa, H.; Wakasa, K. Metabolic profiling of tryptophan-overproducing rice calli that express a feedback-insensitive alpha subunit of anthranilate synthase. Plant Cell Physiol. 2005, 46, 514–521. [Google Scholar] [CrossRef]
- Grones, P.; Friml, J. Auxin transporters and binding proteins at a glance. J. Cell Sci. 2015, 128, 1–7. [Google Scholar] [CrossRef] [PubMed]
- Takemura, Y.; Kuroki, K.; Katou, M.; Kishimoto, M.; Tsuji, W.; Nishihara, E.; Tamura, F. Gene expression changes triggered by end-of-day far-red light treatment on early developmental stages of Eustoma grandiflorum (Raf.) Shinn. Sci. Rep. 2015, 5, 1–11. [Google Scholar] [CrossRef] [PubMed]
- Ge, Y.; Yan, F.; Zourelidou, M.; Wang, M.; Ljung, K.; Fastner, A.; Hammes, U.Z.; Di Donato, M.; Geisler, M.; Schwechheimer, C.; et al. Shade Avoidance 4 Is Required for Proper Auxin Distribution in the Hypocotyl. Plant Physiol. 2017, 173, 788–800. [Google Scholar] [CrossRef] [PubMed]
- Wu, G.; Carville, J.S.; Spalding, E.P. ABCB19-mediated polar auxin transport modulates Arabidopsis hypocotyl elongation and the endoreplication variant of the cell cycle. Plant J. 2016, 85, 209–218. [Google Scholar] [CrossRef] [PubMed]
- Hoyerova, K.; Perry, L.; Hand, P.; Lankova, M.; Kocabek, T.; May, S.; Kottova, J.; Paces, J.; Napier, R.; Zazimalova, E. Functional characterization of PaLAX1, a putative auxin permease, in heterologous plant systems. Plant Physiol. 2008, 146, 1128–1141. [Google Scholar] [CrossRef]
- Titapiwatanakun, B.; Blakeslee, J.J.; Bandyopadhyay, A.; Yang, H.; Mravec, J.; Sauer, M.; Cheng, Y.; Adamec, J.; Nagashima, A.; Geisler, M.; et al. ABCB19/PGP19 stabilises PIN1 in membrane microdomains in Arabidopsis. Plant J. 2009, 57, 27–44. [Google Scholar] [CrossRef] [PubMed]
- Ranocha, P.; Dima, O.; Nagy, R.; Felten, J.; Corratge-Faillie, C.; Novak, O.; Morreel, K.; Lacombe, B.; Martinez, Y.; Pfrunder, S.; et al. Arabidopsis WAT1 is a vacuolar auxin transport facilitator required for auxin homoeostasis. Nat. Commun. 2013, 4, 1–9. [Google Scholar] [CrossRef]
- Tripathi, V.; Parasuraman, B.; Laxmi, A.; Chattopadhyay, D. CIPK6, a CBL-interacting protein kinase is required for development and salt tolerance in plants. Plant J. 2009, 58, 778–790. [Google Scholar] [CrossRef]
- Ljung, K. Auxin metabolism and homeostasis during plant development. Development 2013, 140, 943–950. [Google Scholar] [CrossRef] [PubMed]
- Takase, T.; Nakazawa, M.; Ishikawa, A.; Kawashima, M.; Ichikawa, T.; Takahashi, N.; Shimada, H.; Manabe, K.; Matsui, M. ydk1-D, an auxin-responsive GH3 mutant that is involved in hypocotyl and root elongation. Plant J. 2004, 37, 471–483. [Google Scholar] [CrossRef] [PubMed]
- Bartel, B.; Fink, G.R. ILR1, an amidohydrolase that releases active indole-3-acetic-acid from conjugates. Science 1995, 268, 1745–1748. [Google Scholar] [CrossRef] [PubMed]
- Rampey, R.A.; LeClere, S.; Kowalczyk, M.; Ljung, K.; Sandberg, G.; Bartel, B. A family of auxin-conjugate hydrolases that contributes to free indole-3-acetic acid levels during Arabidopsis germination. Plant Physiol. 2004, 135, 978–988. [Google Scholar] [CrossRef] [PubMed]
- Jiang, Z.; Liu, D.; Wang, T.; Liang, X.; Cui, Y.; Liu, Z.; Li, W. Concentration difference of auxin involved in stem development in soybean. J. Integr. Agric. 2020, 19, 953–964. [Google Scholar] [CrossRef]
- Li, J.; Li, C.; Smith, S.M.; Li, J.; Li, C.; Smith, S.M. Hormone Metabolism and Signaling in Plants; Academic Press: Cambridge, MA, USA, 2017. [Google Scholar]


| Treatment | Duration(s) | FR Photo Flux (μmmol·m−2·s−1) | FR Dose (mmol·m−2·d−1) |
|---|---|---|---|
| CK | 0 | 0 | 0 |
| T | 120 | 34 | 4.08 |
| NPA-T | 120 | 34 | 4.08 |
| NPA-CK | 0 | 0 | 0 |
Publisher’s Note: MDPI stays neutral with regard to jurisdictional claims in published maps and institutional affiliations. |
© 2021 by the authors. Licensee MDPI, Basel, Switzerland. This article is an open access article distributed under the terms and conditions of the Creative Commons Attribution (CC BY) license (https://creativecommons.org/licenses/by/4.0/).
Share and Cite
Liu, Q.; Zhang, H.; Mei, Y.; Li, Q.; Bai, Y.; Yu, H.; Xu, X.; Ma, J.; Wu, Y.; Yang, Z. Integrated Transcriptome and Metabolome Analysis Reveals an Essential Role for Auxin in Hypocotyl Elongation during End-of-Day Far-Red Treatment of Cucurbita moschata (Duch. Ex Lam.). Agronomy 2021, 11, 853. https://doi.org/10.3390/agronomy11050853
Liu Q, Zhang H, Mei Y, Li Q, Bai Y, Yu H, Xu X, Ma J, Wu Y, Yang Z. Integrated Transcriptome and Metabolome Analysis Reveals an Essential Role for Auxin in Hypocotyl Elongation during End-of-Day Far-Red Treatment of Cucurbita moschata (Duch. Ex Lam.). Agronomy. 2021; 11(5):853. https://doi.org/10.3390/agronomy11050853
Chicago/Turabian StyleLiu, Qi, Hanqing Zhang, Yanhao Mei, Qi Li, Yahui Bai, Huibin Yu, Xiaodong Xu, Jianxiang Ma, Yongjun Wu, and Zhenchao Yang. 2021. "Integrated Transcriptome and Metabolome Analysis Reveals an Essential Role for Auxin in Hypocotyl Elongation during End-of-Day Far-Red Treatment of Cucurbita moschata (Duch. Ex Lam.)" Agronomy 11, no. 5: 853. https://doi.org/10.3390/agronomy11050853
APA StyleLiu, Q., Zhang, H., Mei, Y., Li, Q., Bai, Y., Yu, H., Xu, X., Ma, J., Wu, Y., & Yang, Z. (2021). Integrated Transcriptome and Metabolome Analysis Reveals an Essential Role for Auxin in Hypocotyl Elongation during End-of-Day Far-Red Treatment of Cucurbita moschata (Duch. Ex Lam.). Agronomy, 11(5), 853. https://doi.org/10.3390/agronomy11050853