Article

An Improved Vermicomposting System Provides More Efficient Wastewater Use of Dairy Farms Using Eisenia fetida

1
Agricultural Clean Watershed Research Group, Institute of Environment and Sustainable Development in Agriculture, Chinese Academy of Agricultural Science (CAAS), Beijing 100081, China
2
Laboratory of Functional and Evolutionary Entomology, Gembloux Agro-Bio Tech, University of Liege, 5030 Gembloux, Belgium
*
Authors to whom correspondence should be addressed.
Agronomy 2021, 11(5), 833; https://doi.org/10.3390/agronomy11050833
Submission received: 11 March 2021 / Revised: 19 April 2021 / Accepted: 19 April 2021 / Published: 23 April 2021

Abstract

:
Dairy cattle farming produces large amounts of wastewater and it causes environmental pollution and eutrophication of rivers, but the nutrients in the waste could be recycled. Here, an improved vermicomposting system was applied to dairy farm wastewater, and wastewater with a nitrogen content of 100 mg/L and 200mg/L tested with different combinations of organic substrates such as cow manure and rice straw in rural solid waste. Results showed that earthworms could continuously grow, wastewater (N 100mg/L) mixed with rice straw corresponding to the most significant gained weight for Eisenia fetida earthworms (2.38 to 9.12-fold), and the earthworms’ weight was positively correlated with the C/N ratio, organic matter content, and pH. Compared to the initial state, the system significantly changed physicochemical parameters in nutrients, such as the percentages of total nitrogen, phosphorous, and potassium, which were found to increase in vermicomposting while organic matter content, C/N ratio, and cellulose declined as a function of the vermicomposting period, and the final vermicompost was better for the absorption of plants. These results suggest that continuous wastewater addition improved the effective transformation of organic waste to allow valorizing a broad range of organic residues, and avoid the risk of environmental pollution in dairy cattle farming.

1. Introduction

Eutrophication of lakes and rivers is becoming a more serious problem that threatens the safety of human drinking water. Livestock farming constitutes a large proportion of the agricultural non-point source pollutants that cause eutrophication, and China’s first pollution-source census demonstrates that dairy cattle farming may be the largest contributor to the problem. Specifically, dairy cattle farming produces 2.2 times more pollutants than non-dairy cattle farming and 15.5 times more than swine farming [1]. The increasing demand for milk from growing human populations requires an innovative solution to mitigate the impact of dairy cattle farms on their surrounding environments.
Backyard breeders and farmers often discard waste directly into surrounding environment, and the current procedures of large-scale operations are costly and somewhat inefficient at removing the organic compounds that contribute to eutrophication. Large-scale livestock farms commonly use anaerobic digestion or aerobic digestion reactors [2]. Up-flow anaerobic sludge blanket (UASB) reactors are routinely used in centralized sewage collection and treatment [3,4], but anaerobic digestion does not remove nitrogen or phosphorus from wastewater. The remaining biogas slurry and residue caused by this secondary pollution is anaerobic, and then inaccessible as crop fertilizer [5]. Activated sludge systems are typically used for aerobic digestion [6,7], but are associated with the production of large amounts of sludge that also needs to be treated. The remaining sludge does not precipitate well due to its high moisture content. Moreover, it has a propensity to expand and float. The use of these two centralized digestion systems has high input costs, high energy consumption, and there are other more actually technical skills for smaller operations.
Using earthworms to treat solid organic waste (i.e., vermicomposting) provides a cheaper and easier alternative to other waste treatment methods [8]. In vermicomposting, worms digest and transform organic waste, also producing a compost to be used in crops for fertilization. Indeed the earthworm metabolic activity during this process enhances the level of nutrients in the transformed wastes [9]. Finally, vermicomposting creates more available nutrients per weight than the original organic substrate before earthworm action, converting organic wastes into excellent bio-fertilizers with abundant humic-like compounds and diverse probiotics that are helpful for agricultural use [10]. Therefore, vermicomposting can facilitate plant growth [11], and unlike pure animal manure, it is an excellent substrate for growing seedlings. Vermicomposting applications correspond to the improvement of conventional composting by adding earthworms to provide a better organic waste stabilization process [12]. Compared to conventional compost, vermicomposting contains higher levels of soluble nutrients and higher quality organic matter [13]. It is a bio-oxidative process in which earthworms and microbes, along with other degradable communities, interact and accelerate the decomposition process of organic waste [14].
Vermicomposting is being utilized within commercially available on-site waste treatment systems; however, there are few reported studies that have examined this medium for the purpose of wastewater treatment [15].
The objective of this study on the improved vermicomposting system was to examine the effects of high nitrogen and carbon contents in the waste liquid from dairy farm wastewater on vermicomposting. The original contributions of this study are that there was a clear difference in evaporation rates of the materials with and without earthworms, and less moisture in the manure added earthworms than in the manure with no earthworms [16]. According to the characteristics of high nitrogen content and high carbon content in the waste liquid of dairy farm wastewater, the continuous addition of wastewater to support the loss of water and maintain the humidity of the system to facilitate the earthworm activities in vermicomposting, in keeping with the sustainable environmental requirements of earthworms’ growth. The metabolism of earthworms transforms the nutrients of wastewater, cow dung, and straw into earthworm and earthworm manure with high economic value, achieving the goal of resource utilization and zero release of rural organic wastes. In addition, no after-treatment by-products are generated by achieving the aim of minimizing pollution. Nitrogen loss caused by high temperature composting and air pollution caused by incineration of agricultural organic wastes can be avoided, and this process will not produce after treatment by-products, to achieve the purpose of eliminating pollution.

2. Materials and Methods

2.1. Dairy Farm Waste Collection and Worm Rearing

Rice straw and cow manure were collected from a dairy farm in Yanqing county of Beijing in China; we selected the rice straw harvested in current autumn and fresh manure and wastewater. Young earthworms (Eisenia fetida, (Savigny, 1826)) were mass-reared on fresh cow manure in the Institute of Environment and Sustainable Development in Agriculture, Chinese Academy of Agricultural Sciences (CAAS). Fresh cow manure was homogenized and shade-dried in the lab for 2 weeks. Rice straw was cut off to a length of about 1.2 cm. Dairy farm wastewater was diluted with aseptic water and compounded to total nitrogen 100 mg/L and 200 mg/L (pH 7.70). Plastic circular containers with 4 holes in the bottoms were used as vermireactors (13.0 cm × 9.0 cm × 10.0 cm) and the bottoms were sealed with insect netting (mesh size 5 mm).

2.2. Vermicomposting Experimental Set-Up

Two dairy farm waste materials (wastewater and cow manure) and rice straw were used in the experiment. Combinations of three rates of cow manure in rice straw (0, 20 or 40% called M0, M20, and M40 respectively) with two levels of nitrogen content in wastewater (total nitrogen of 100 or 200 mg/L called N1 and N2 respectively) corresponding to six treatments were tested (namely M0N1, M20N1, M40N1, M0N2, M20N2, and M40N2). Each treatment was tested in triplicate, resulting in a total of 126 containers. Twenty non-clitella worms (~275 mg) were selected from the stock rearing and added to each container on the 2nd day. Dairy farm wastewater was added to the system every 3 days to supply the needed amount to avoid desiccation. To measure the digested volume of the wastewater, we measured the added and outflow wastewater from the containers. The moisture content was maintained at 60–80% throughout the vermicomposting period. The containers were kept at 20 °C in the lab. The tests were conducted for 60 days. No rice straw or cow manure was added during this vermicomposting period.

2.3. The Biological Parameters of Earthworms

Over the 60 days of the vermicomposting process, earthworm abundance and biomass were measured every 10 days. Worms were separated by hand, counted, and weighed manually (live weight). Before weighing, worms were washed in distilled water and dried on filter paper. Worms were quickly weighed and returned to their containers to prevent desiccation.

2.4. Physicochemical Parameter Analysis of the Vermicomposting Process and Germination tests

Organic matter (OM), total Kjeldahl nitrogen (TKN), total phosphorus (TP), total potassium (TK), cellulose, pH, and C/N ratio were measured in the initial and the final mixtures [17,18,19]. The pH was determined in a 1:10 (w/v) aqueous solution (deionized water) with a digital pH meter (Mettler Toledo). The seed germination index was determined at the initial and final points of the improved vermicomposting system using previously described methods [20,21].

2.5. Microbial Diversity Analysis

2.5.1. Sample Collection

R0 and R60 were the same treatments as M0N2 at 0 and 60 days, respectively, while CK0 and CK60 were the same treatments as M0N2 at 0 and 60 days, respectively, but without earthworms (Table 1).

2.5.2. DNA Extraction and PCR Amplification

Genomic DNA was extracted from solid samples using the E.Z.N.A. Stool DNA Kit (Omega Bio-Tek, Norcross, GA, USA) according to the manufacturer’s instructions. The quality of the extracted DNA was checked by 1% agarose gel electrophoresis and spectrophotometry (optical density at a 260 nm/280 nm ratio). All extracted DNA samples were stored at −20 °C for further analysis. The V3–V4 hypervariable regions of the 16S rRNA gene were subjected to high-throughput sequencing by Beijing All we gene Tech (Beijing, China) using the Illumina MiSeq PE300 sequencing platform (Illumina, CA, USA). The V3–V4 region of the bacteria 16S rRNA gene were amplified with forward 336F (5′-GTACTCCTACGGGAGGCAGCA-3′) and reverse 806R (5′-GTGGACTACHVGGGTWTCTAAT-3′) universal primers. These primers contain an 8-nucleotide long barcode sequence that is unique to each sample. PCR (Polymerase Chain Reaction) was performed as follows: 95 °C for 5 min, 28 cycles at 95 °C for 45 s, 50 °C for 50 s, and 72 °C for 45 s, with a final extension of 72 °C for 10 min. PCR reactions were performed in triplicate with 25-μL mixtures containing 2.5 μL of 10 × Pyrobest buffer, 2 μL of 2.5 mM dNTPs, 1 μL of each primer (10 μM), 0.4 U of Pyrobest DNA polymerase (TaKaRa), and 15 ng of template DNA. The amplicon mixture was applied to the MiSeq Genome Sequencer (Illumina, San Diego, CA, USA).

2.5.3. Illumina MiSeq Sequencing

Amplicons were extracted from 2% agarose gels and purified using the Axy Prep DNA Gel Extraction Kit (Axygen Biosciences, Union City, CA, USA) according to the manufacturer’s instructions and quantified using Quanti Fluor™-ST (Promega, Fitchburg, WI, USA). Purified amplicons were pooled in equimolar concentrations and paired-end sequenced (2 × 300) on an Illumina MiSeq platform according to standard protocols.

2.5.4. Processing of Sequencing Data

The extraction of high-quality sequences was first performed with the QIIME package (v1.2.1; Quantitative Insights Into Microbial Ecology; J Gregory caporaso, University of Colorado, Boulder, CO, USA). Raw sequences were selected based on sequence length, quality, primer, and tag. The raw sequences were selected, and the low-quality sequences were removed based on the following criteria: (i) raw reads were shorter than 110 nucleotides; (ii) 300-bp reads were truncated at any site receiving an average quality score <20 over a 50-bp sliding window (the truncated reads that were shorter than 50 bp were discarded); (iii) exact barcode matching, 2 nucleotide mismatches in primer matching (reads containing ambiguous characters were removed); and (iv) only sequences that overlapped more than 10 bp were assembled according to their overlap sequence (reads that could not be assembled were discarded).
The unique sequence set was classified into operational taxonomic units (OTUs) under the threshold of 97% identity using UCLUST. Chimeric sequences were identified and removed using Usearch (v8.0.1623). The taxonomy of each 16S rRNA gene sequence was analyzed by UCLUST against the Silva119 16S rRNA database using a confidence threshold of 90%.

2.6. Statistical Analysis

All of the reported data were the means of three replicates. One-way analysis of variance (ANOVA) was used to detect significant differences among treatments. Independent Tukey’s tests were also performed to evaluate the distribution of the data sets. Statistical analyses were performed using the SPSS statistical package (Version 13.0; SPSS Inc., Chicago, IL, USA). Unless otherwise indicated, p < 0.05 was selected to indicate statistical significance.

3. Results and Discussion

3.1. Consumption of Dairy Farm Wastewater during Vermicomposting

After the preliminary experiment, the total nitrogen concentration of the dairy farm wastewater was set at 100 and 200 mg/L. These two concentrations are higher than the standard for pollutant discharge issued by the national livestock breeding industry. In our study, the amount of wastewater input was closed to the amount of water evaporated by the system. The amount of wastewater consumed in the M0N1 and M0N2 was the largest (Table 1). In these treatments, all of the fillers were straw and explained this result. The crushed stalks were short and rod-shaped, with gaps between them, making it easier for the moisture to drain. Therefore, more wastewater was needed to maintain the system’s humidity. In the mixture of other groups that contained cow manure, the latter was crushed into powder, the crevices between pieces of straw were filled, and the water was more easily retained. The rate of water loss was relatively low, the system moisturizing effect was better, and liquid waste did not need to be added as frequently.
In each 100 g improved vermicomposting system, the volume of dairy farm wastewater consumed by M0N1 and M0N2 was similar. M0N2 consumed 196 mg of TKN and M0N1 consumed 98 mg. In terms of total nitrogen consumption, M0N2 was a more suitable treatment system for dairy farm wastewater. This study provides information on how the nutrient components of wastewater affect the ability of earthworms to grow, thereby absorbing and transforming organic waste into high-value earthworms and earthworm manure. Vermicomposting using these methods discharge no wastewater, achieving the goal of zero pollutants.

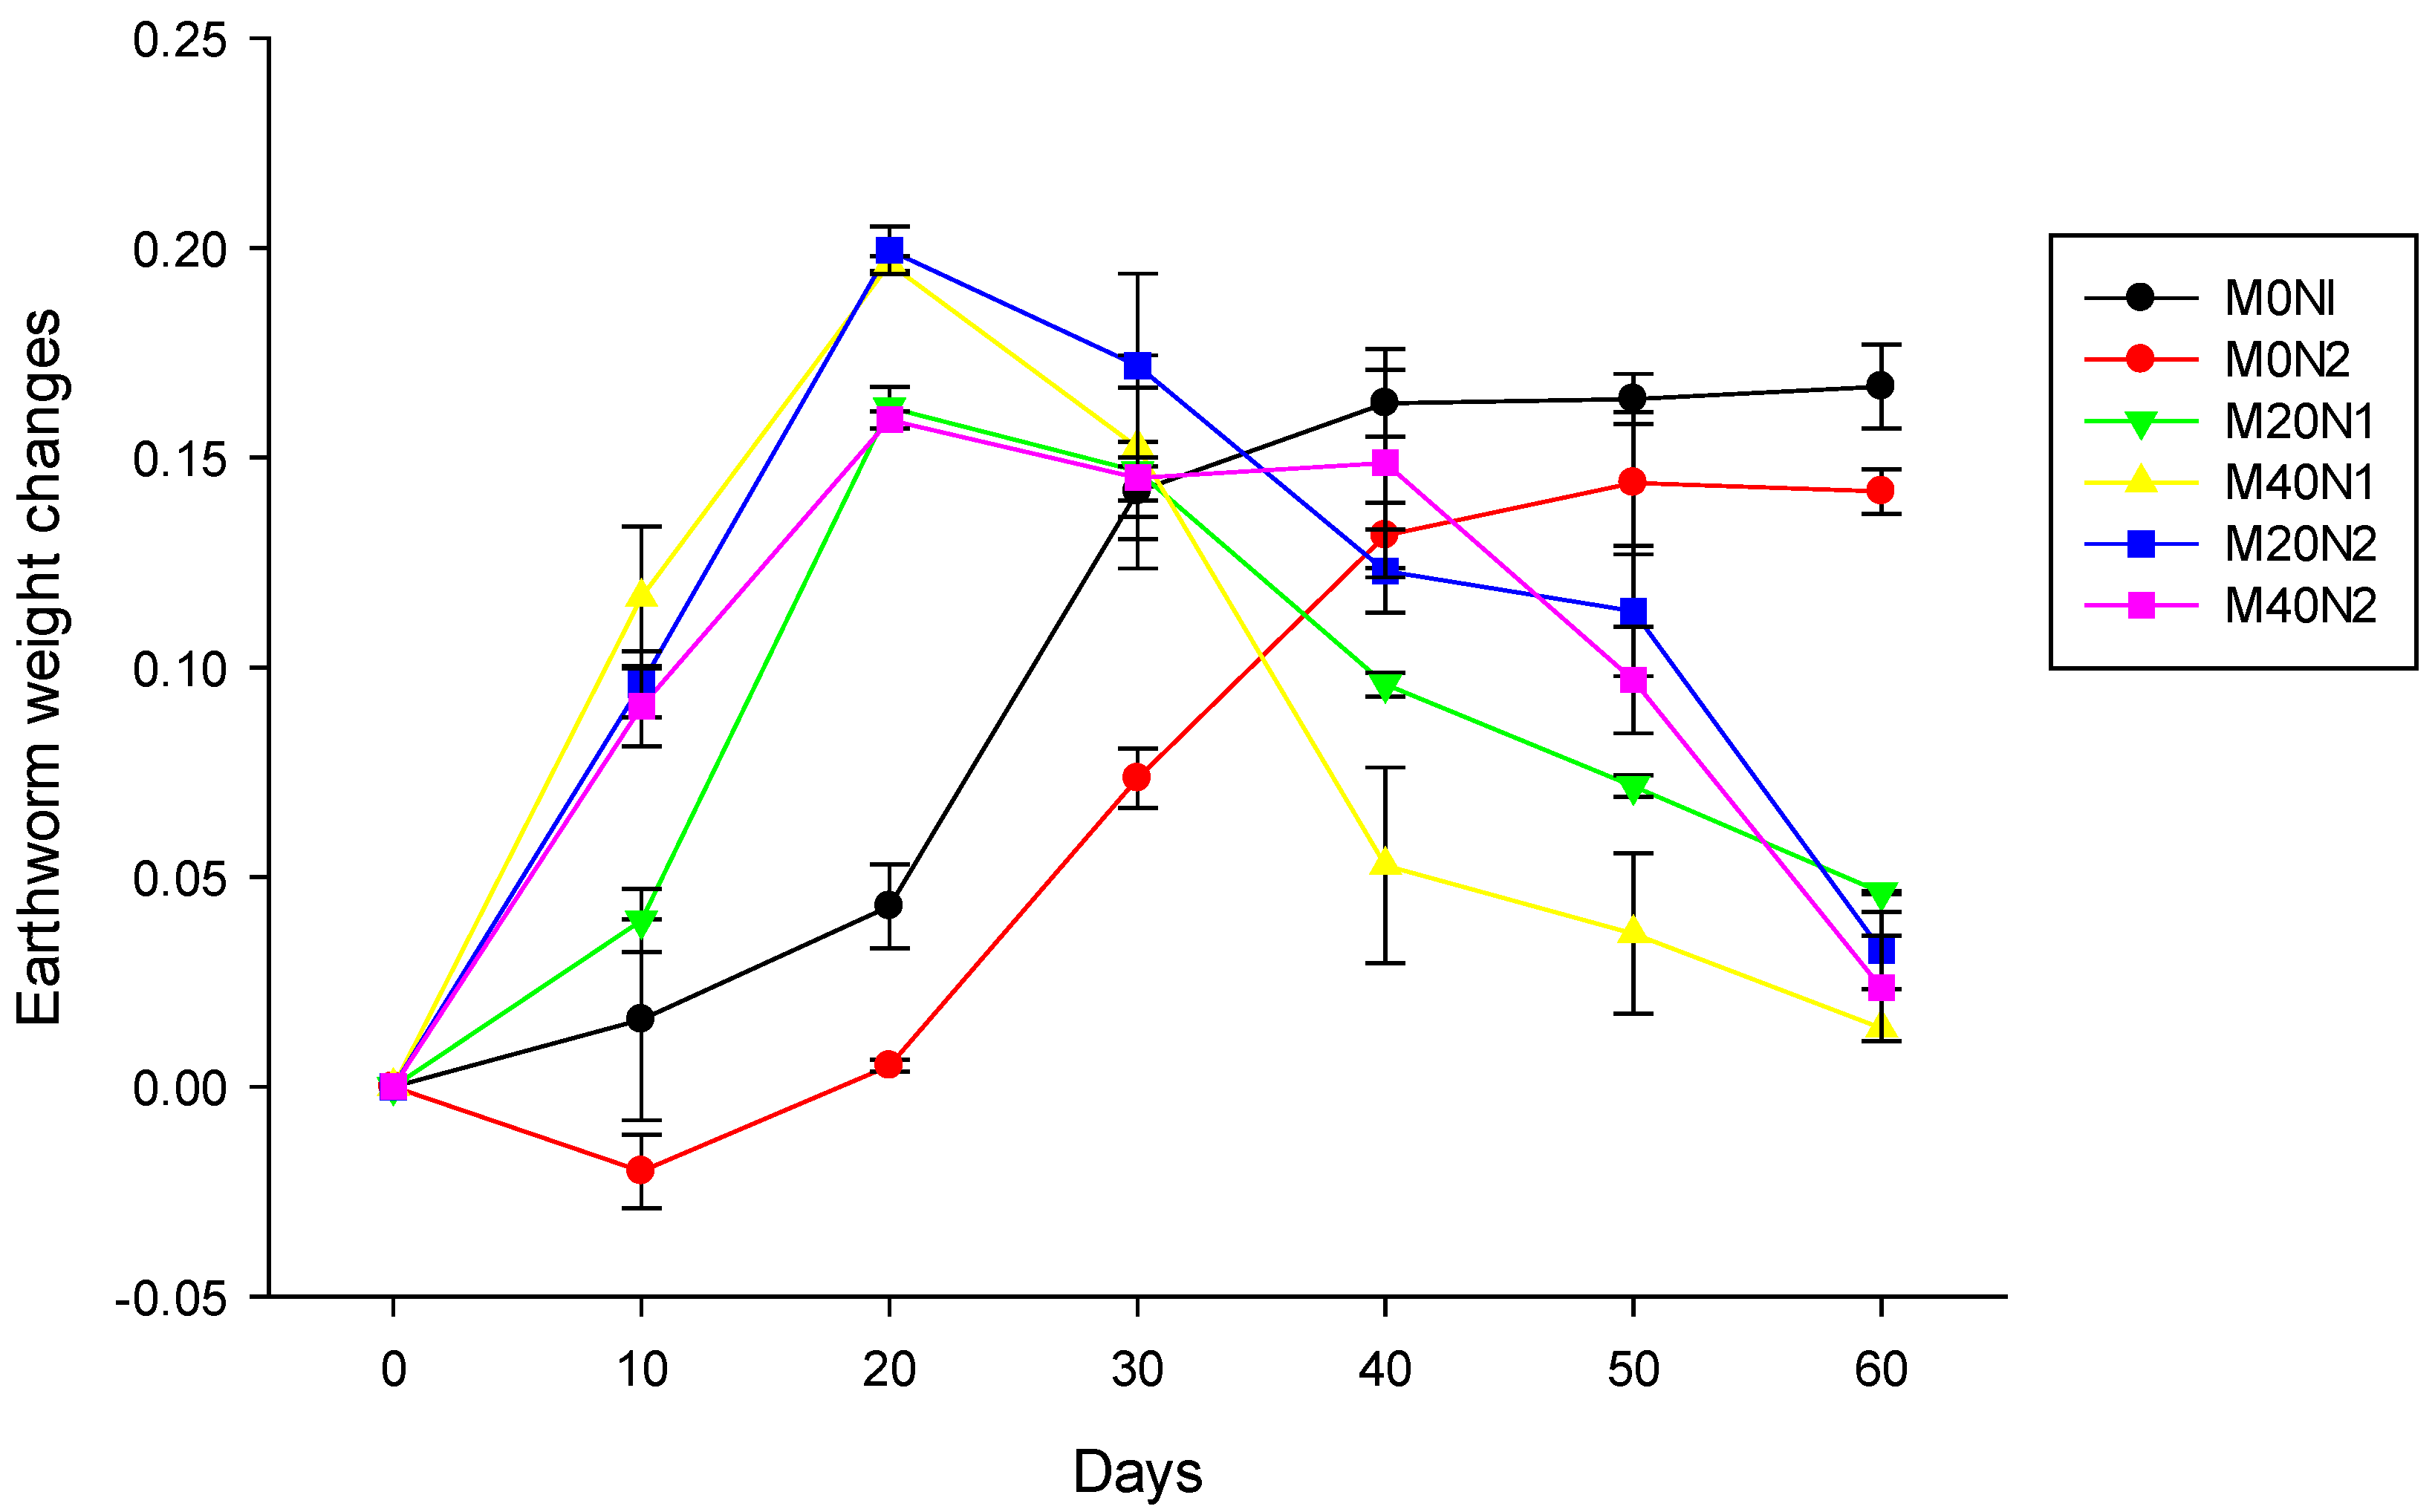
3.2. Earthworm Weight Changes during Vermicomposting

After 10 days, the average weights of all earthworms, except for the M0N2 conditions, increased (Figure 1). After 20 days, all treatments had continued positive effect on the average earthworm growing. InM20N1, M40N1, M20N2, and M40N2 containing cow manure, significant higher weight gain were observed when compared to earthworms in M0N1 and M0N2, which had only rice straw. After 30 days, the earthworm’s average weight in M20N1, M40N1, M20N2, and M40N2 declined, while the ones in M0N1 and M0N2 increased. At day 60, the change in the latter was significantly higher than the ones in M20N1, M40N1, M20N2, and M40N2. The average weight change of M0N1 was 2.4 times that of M20N1, and 9.1 times that of M40N1. The average weight change of M0N2 was 2.1 times that of M20N2 and 1.7 times that of M40N2 (Table 1).
Earthworms utilize nutrients from different sources to supply their growth needs [22]. The weight change of earthworms was significantly correlated with the C/N ratio.
Dairy wastewater continually supplemented nitrogen, reducing the C/N ratio of all treatments gradually. The M0N1 and M0N2 conditions became more and more suitable for earthworm growth as this supplementation process continued. High nitrogen can exceed the tolerance limit of earthworms, resulting in slow growth or death [23]. Indeed, at day 20 of the experiment, because of the large amounts of nitrogen in cow manure of M20N1, M40N1, M20N2, and M40N2, the additional dairy wastewater added nitrogen into the mixture, resulting in the increasing nitrogen content, and high nitrogen is toxic to earthworms, so the weight of earthworms began to decrease.

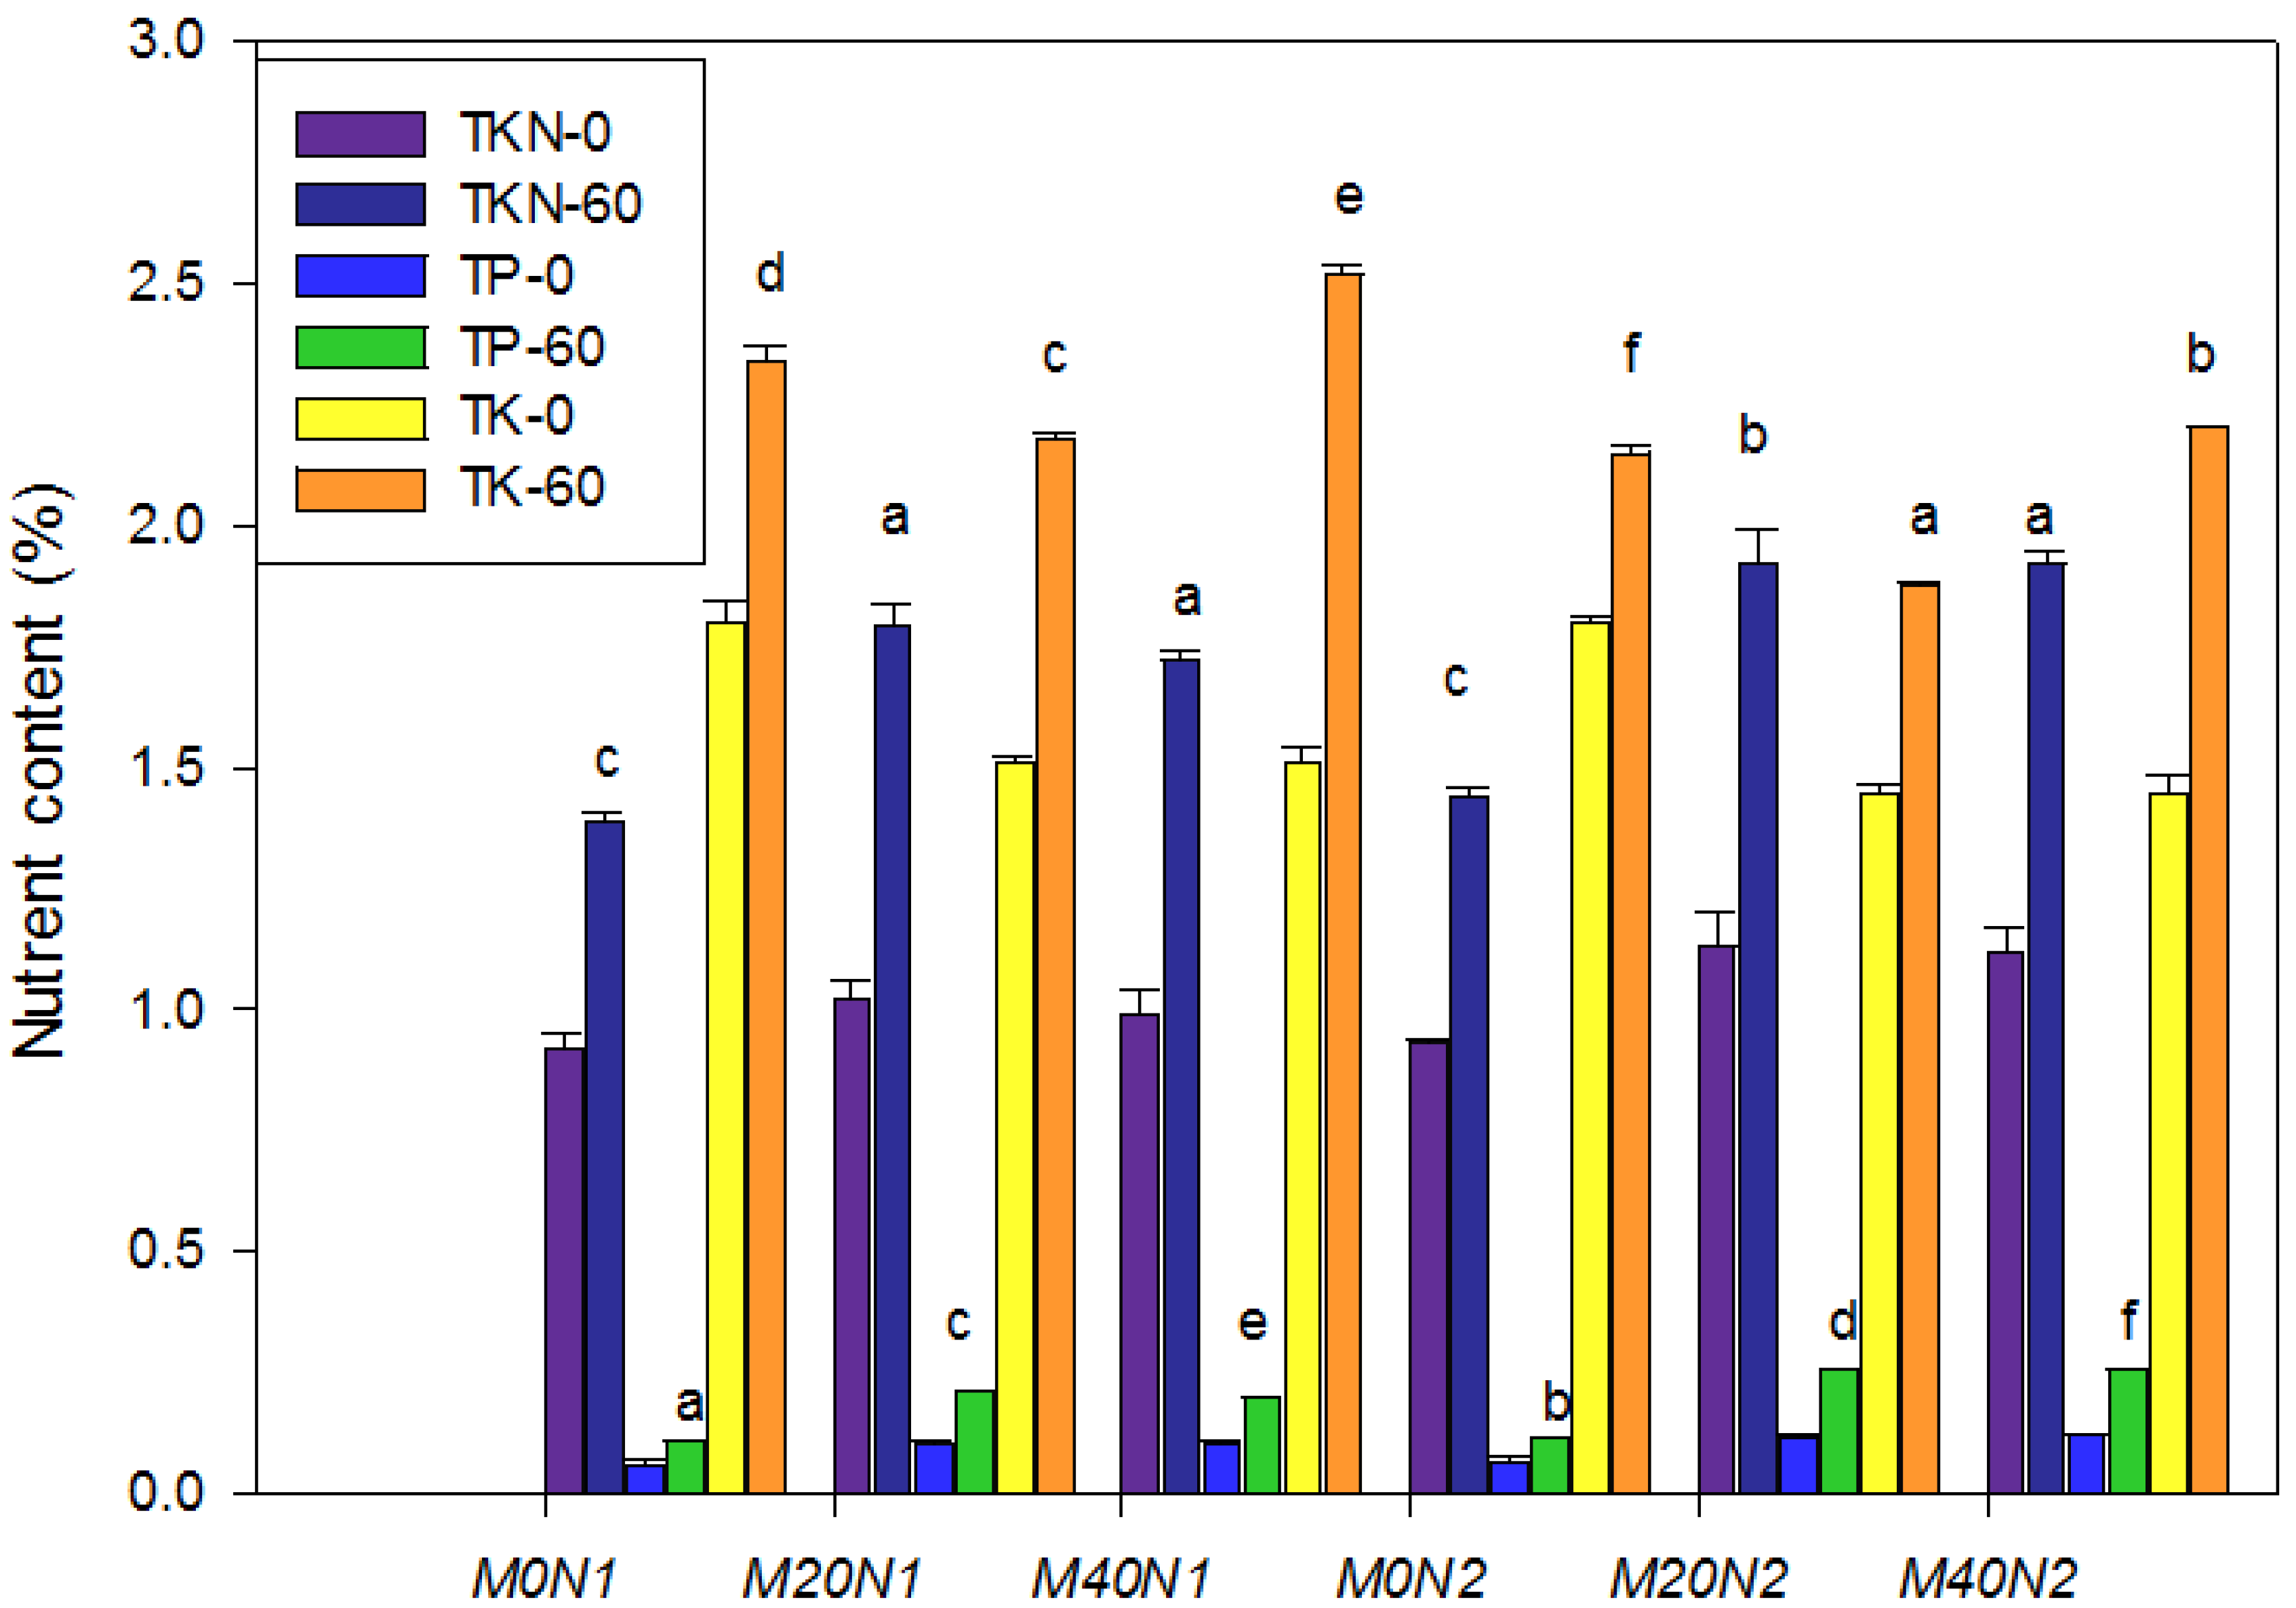
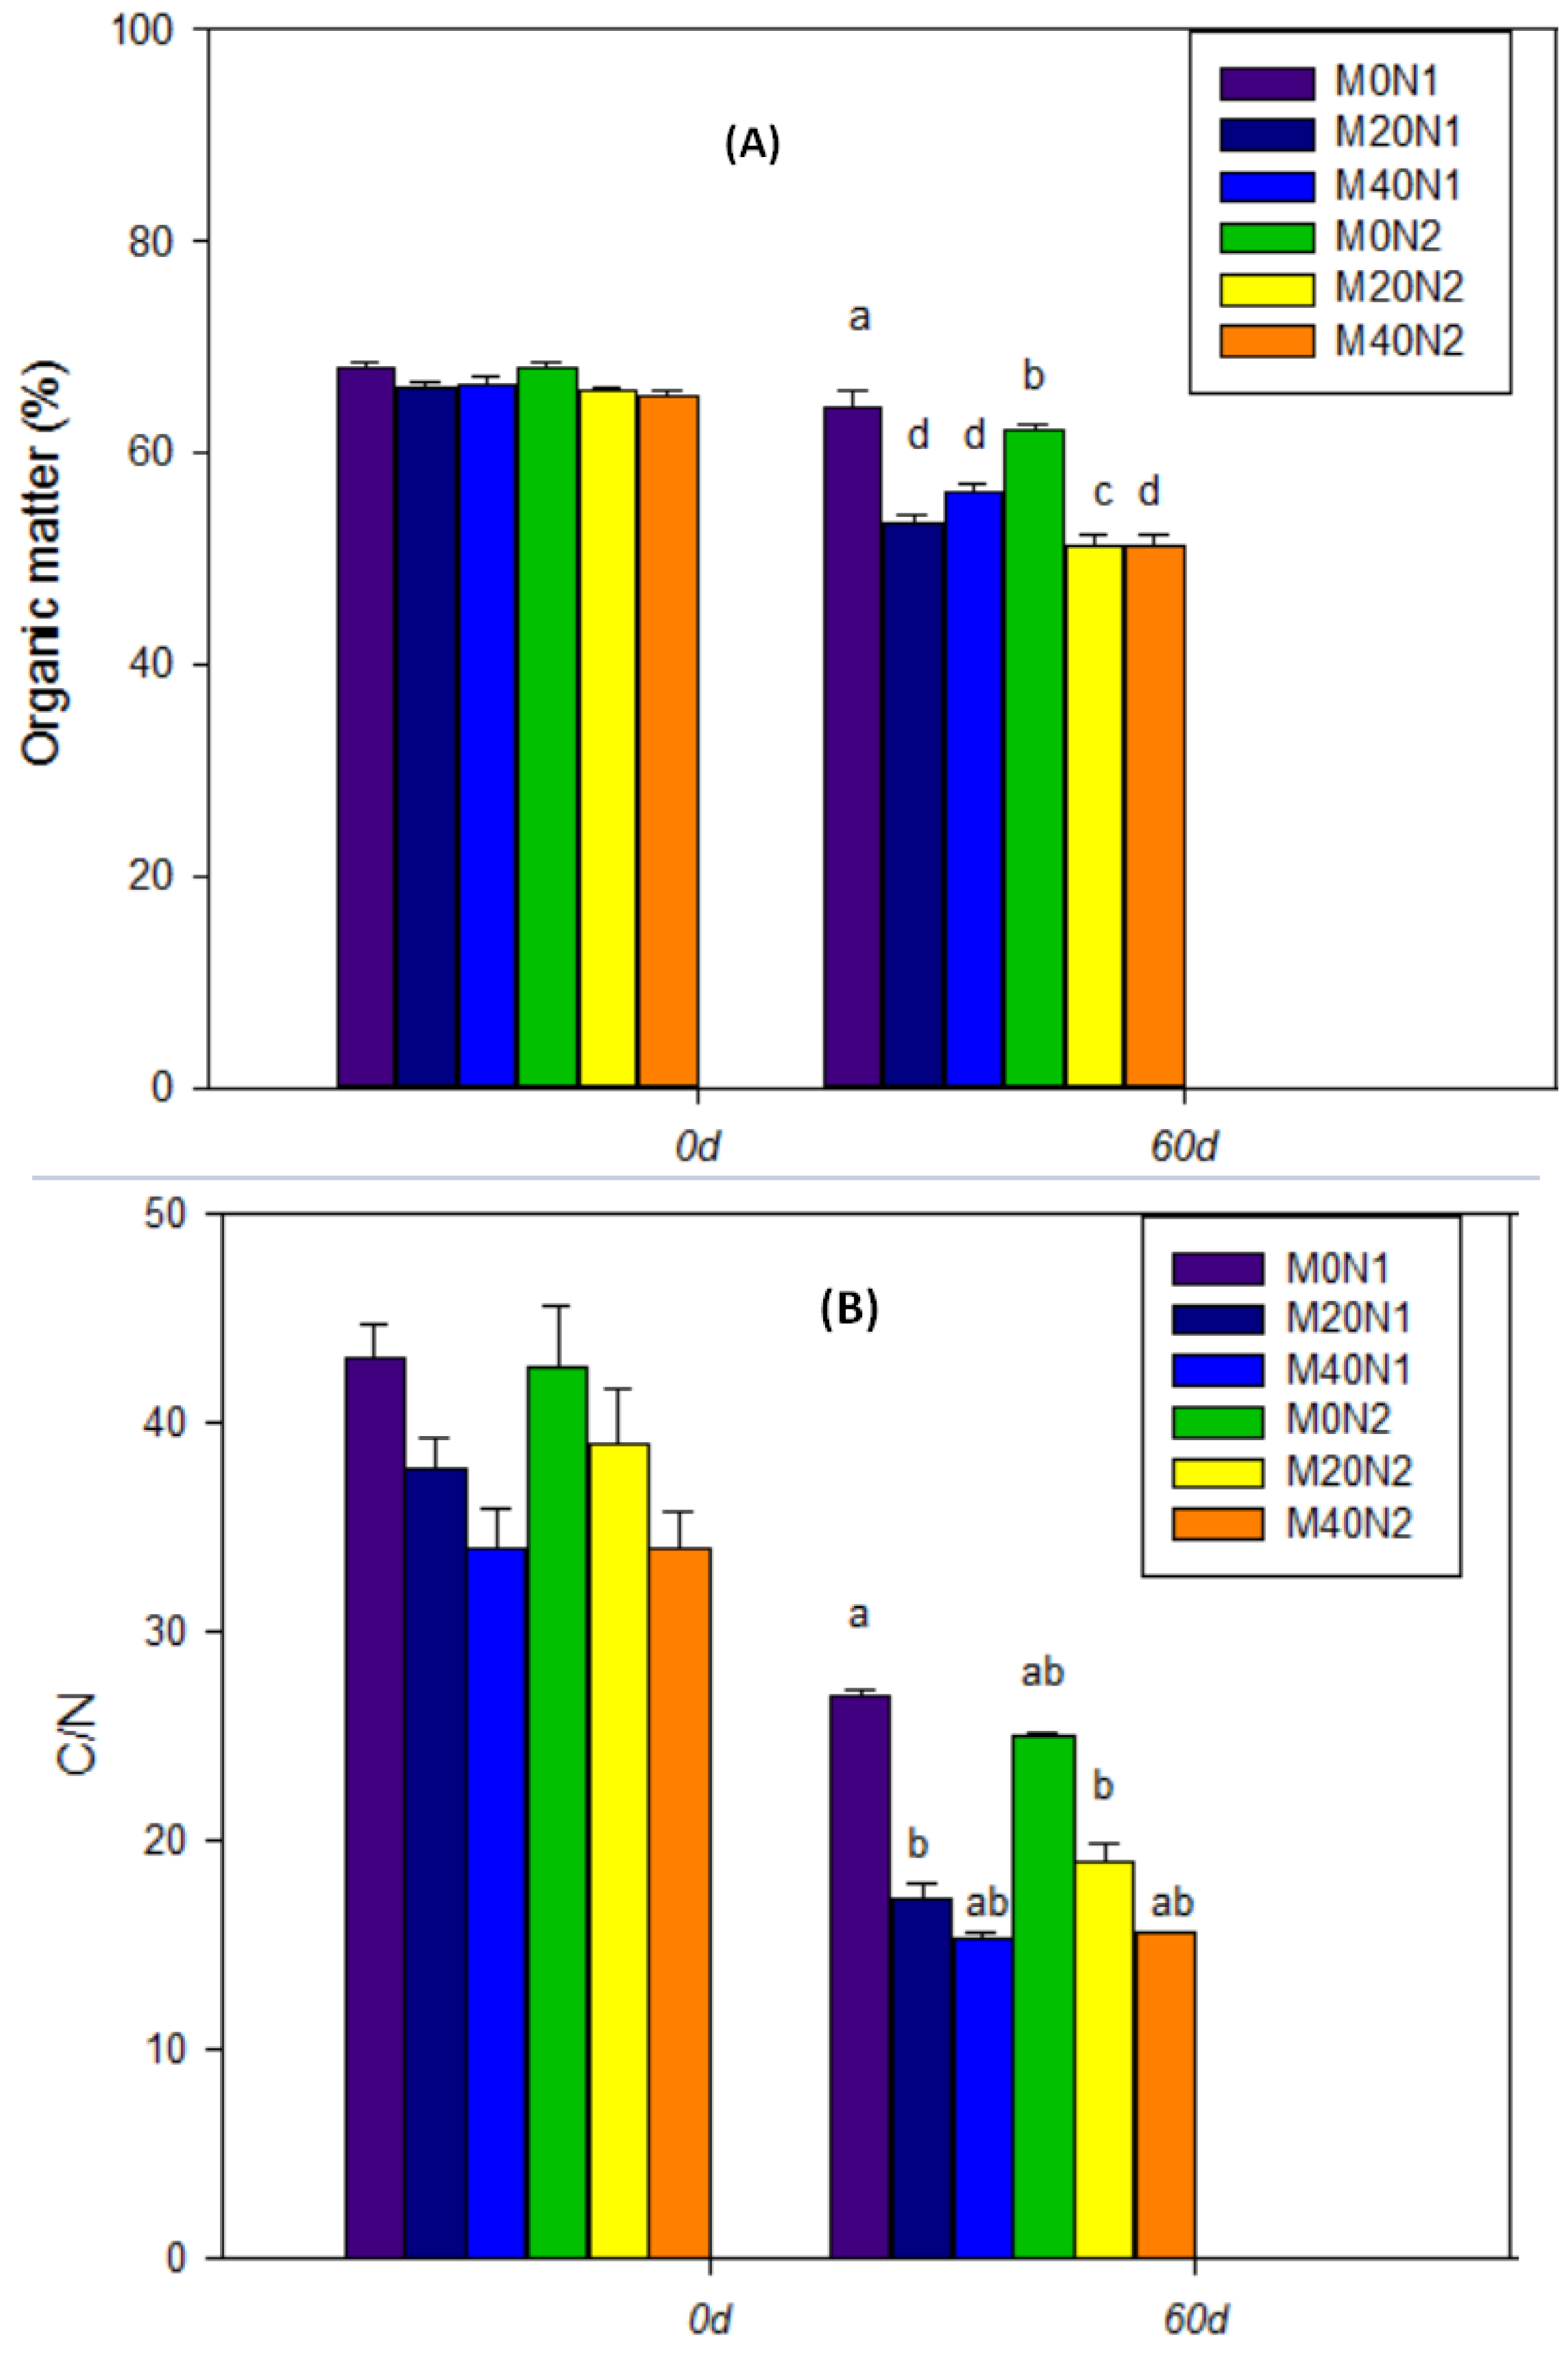
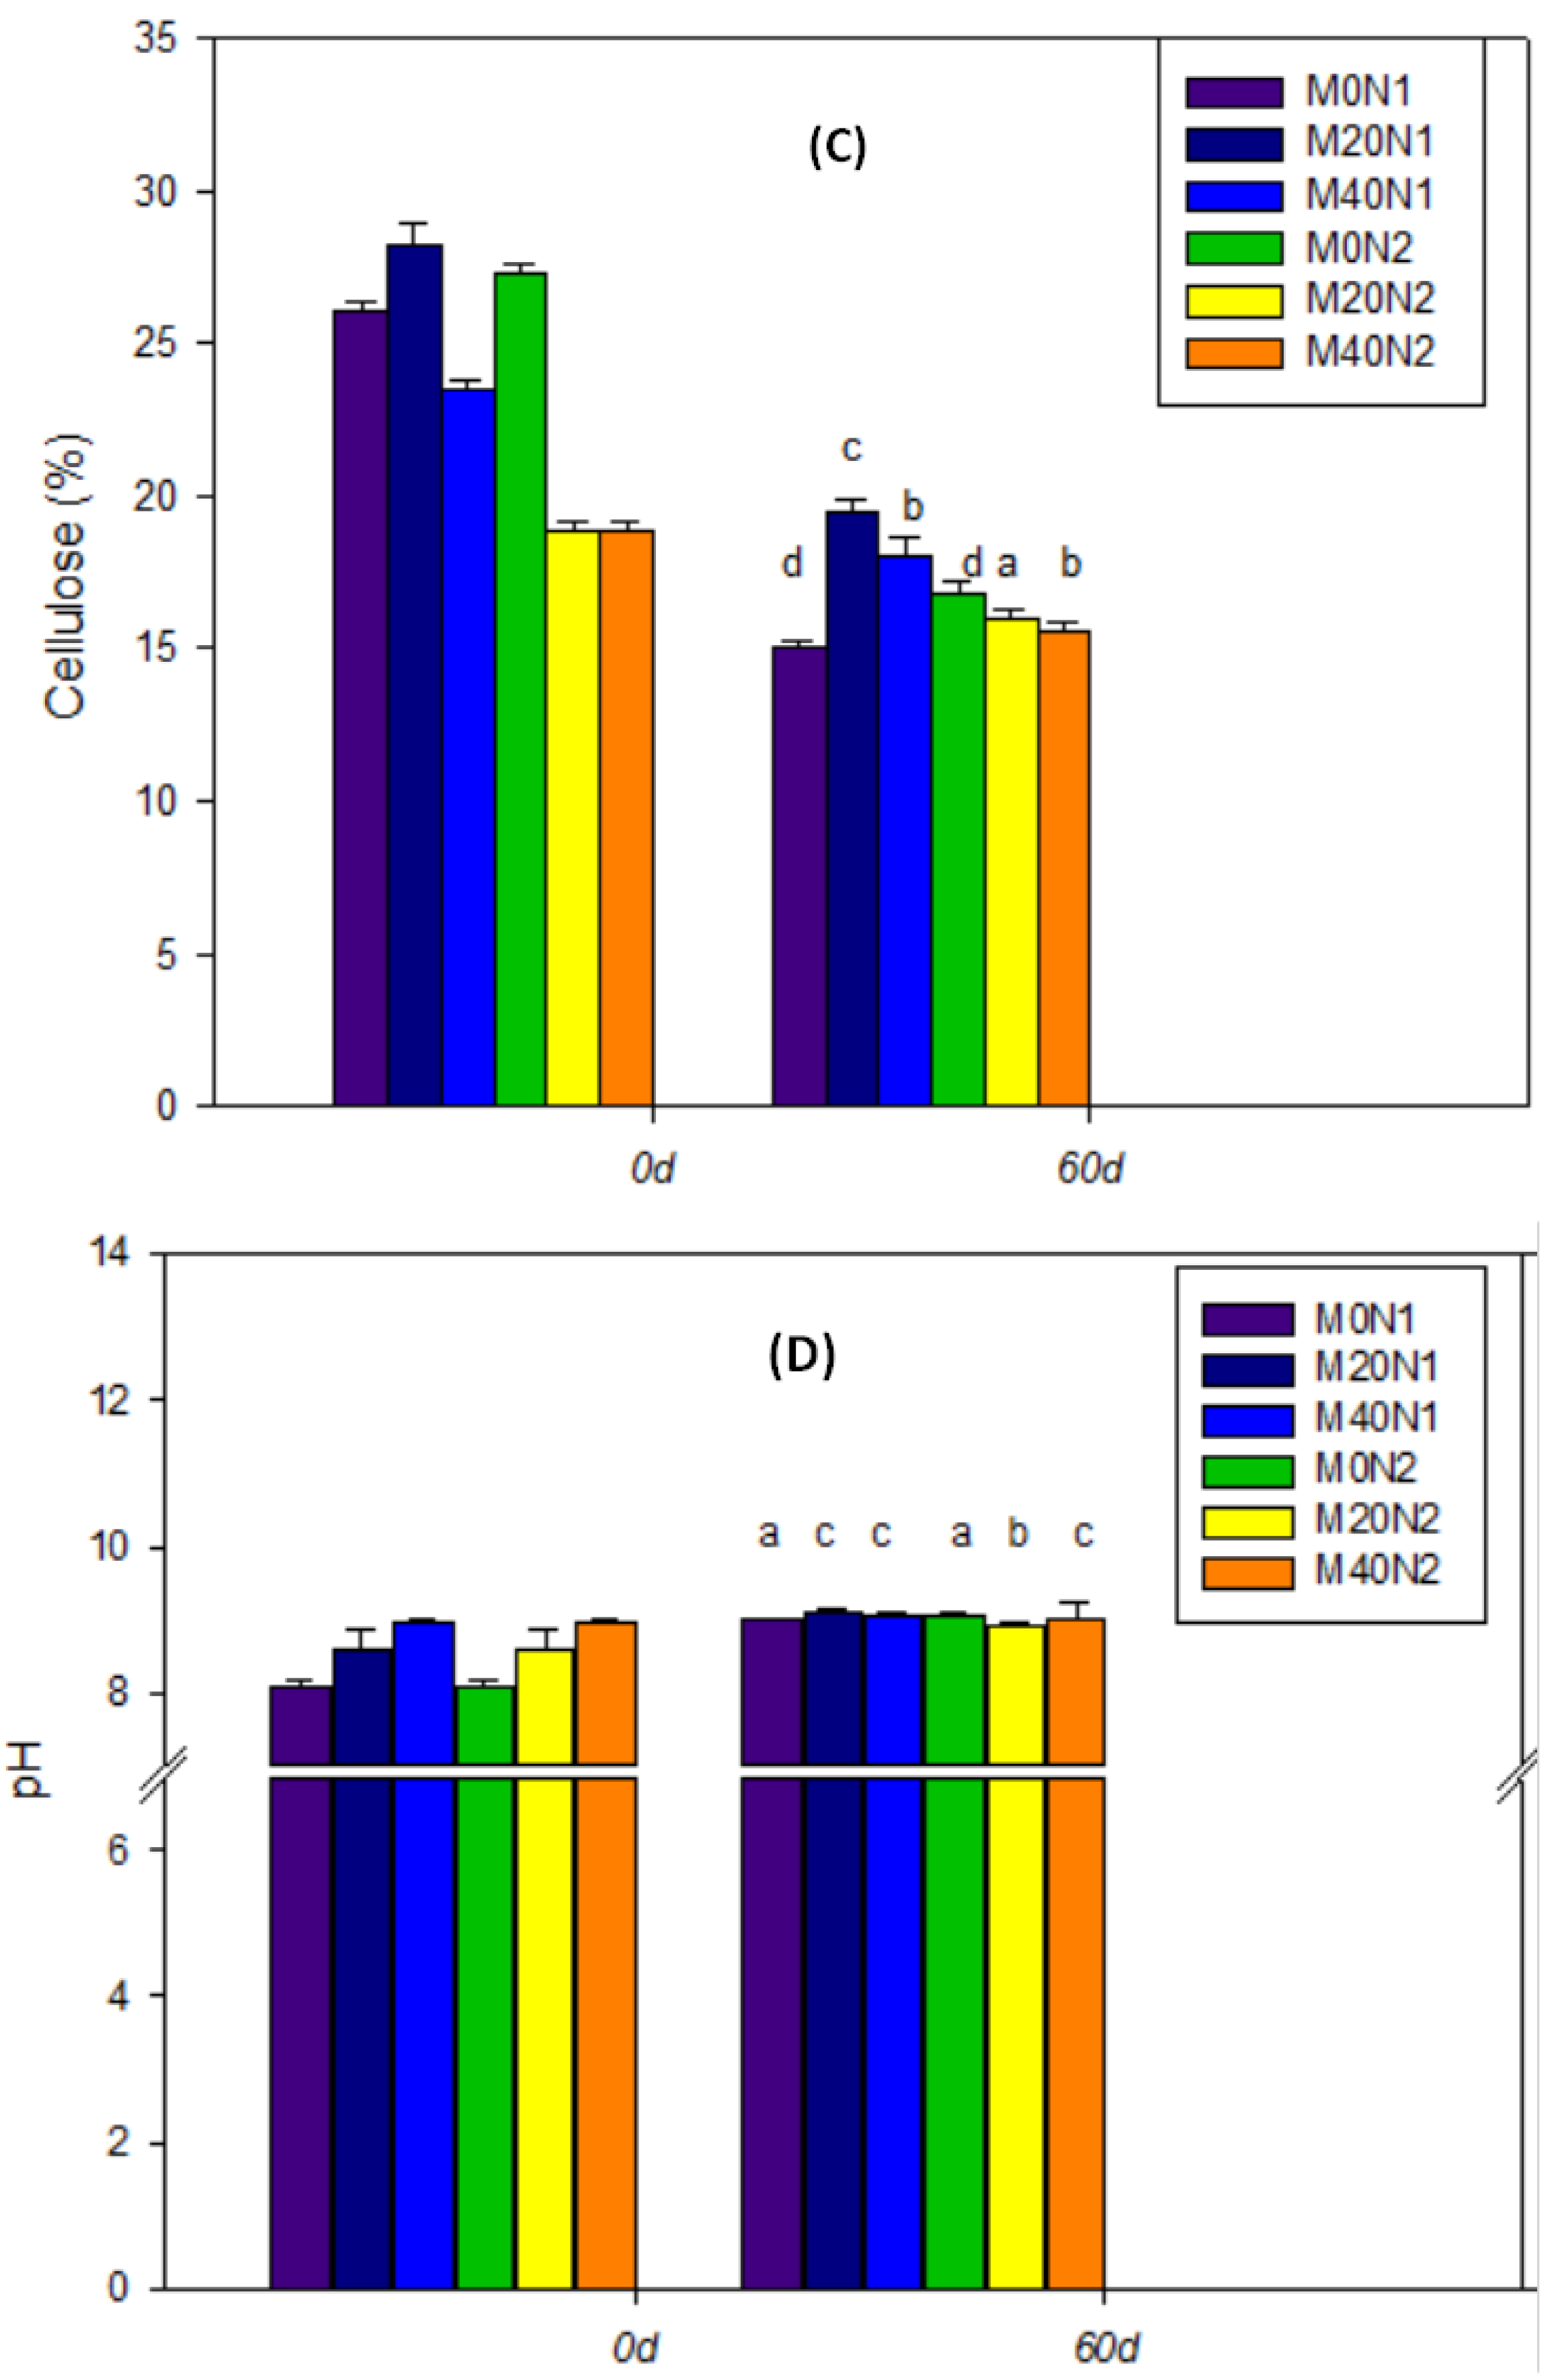
3.3. The Response of Physicochemical Parameters during the Vermicomposting Period

After 60 days, the black color and uniformly disintegrated structure of the mixtures indicated the presence of worm activity [24]. TKN, TP, and TK increased in all of the tests under different treatments after the vermicomposting (Figure 2). The difference between various mixtures was statistically significant (ANOVA, p < 0.05) at the end of the process. Traditionally, TKN, TP, TK, organic matter content, and the C/N ratio are considered indicators of decomposition and compost quality [25]. Then, the treatments inoculated with earthworms were more decomposed, and the fillers after vermicomposting were more preferable for bio-organic fertilizer manufacturing [26].
In the test, there was a 51.1% increase in TKN for M0N1, a 75.5% increase for M20N1, and a 69.9% increase for M40N1 compared to the initial level. There was a 54.8% increase in TKN forM0N2, a 73.7% increase for M20N2, and a 71.4% increase for M40N2 compared to the initial level (Figure 2). The rate of increase in TKN was higher than 50%, and the mixtures with 20% of cow manure had the highest TKN content. The TKN of 20% cow manure and 40% manure were 1.7% to 1.9% at the 60th day, which were higher than TKN of only-cow manure which was about 1.6% at the 60th day (with Eisenia fetida, no wastewater), the TKN of only-straw were 1.3% and 1.4%. TKN of treatments ranged between 1.4% and 1.9% at 60th day, and values were similar to those already reported. The TKN content ranging from 1.2% to 1.7% for vermicompost of paper cattle manure, mill sludge, and dairy sludge were reported [27]. Vermicompost of bilsolids mixed with paper mulch contained 1.7% [28]. But whereas the range reported by values ranging between 1.9% to 3.7% for different types of waste [29]. It indicated that the improved vermicomposting system also had a great impact on nitrogen transformations in the manure, by enhancing nitrogen mineralization, so that mineral nitrogen was retained.
The same trend was observed for TP and TK (Figure 2). There was a 76.4% increase in TP for M0N1, a 107.1% increase for M20N1, and a 115.3% increase for M40N1. There was a 73.1% increase in TP for M0N2, a 89.1% increase for M20N2, and a 111.3% increase for M40N2. Then, the largest increases in TP which group with 40% cow manure were observed in M40N1 and M40N2 (ANOVA, p < 0.05), the lowest increases in TP which group with rice straw-only were observed in M0N1 and M0N2 (ANOVA, p < 0.05). There was a 30.0% increase in TK for M0N1, a 43.8% increase for M20N1, and a 29.9% increase for M40N1. There was a 19.5% increase in TK for M0N2, a 66.4% increase for M20N2, and a 52.5% increase for M40N2. Therefore, the M20N1 and M20N2 treatments, which contained 20% cow manure, showed the largest increase in TK concentration. Overall, the treatments with earthworms had more nutrients after vermicomposting. During the present investigation, the TP concentration varied from 1.1% to 2.6% and the TK concentration varied from 18.8% to 25.2% at the 60th day, in comparison with recommended standards the TP and TK were found higher in all the samples [30].
Organic matter content decreased in all treatments after vermicomposting (Figure 3A), the difference among mixtures was statistically significant (ANOVA, p < 0.05). In comparison to the initial values, there were 5.3%, 19.4%, and 22.1% decreases for M0N1, M20N1, and M40N1, respectively, and 8.8%, 15.3%, and 21.6% decreases for M0N2, M20N2, and M40N2. The organic matter content varied from 51.3% to 64.4% at the 60th day, which were higher than 45% in the National Organic Fertilizers Standard [31]. The reduction in the organic matter content could be attributed to the rapid decomposition and consumption of the organic materials by earthworms and microorganisms present in their guts [32].
In our experiment, the initial C/N ratio of M0N1 and M0N2 with only rice straw was significantly higher than that in M20N1, M40N1, M20N2, and M40N2, which also contained cow manure (Figure 3). The C/N ratio significantly decreased among the different mixtures at the end of the experiments (Figure 3B). Decreases of 37.5%, 54.4%, and 54.4% in C/N were observed in M0N1, M20N1, and M40N1, and decreases of around 41.4%, 51.2%, and 54.4% in M0N2, M20N2, and M40N2. After 60 days, the C/N ratios of M0N1 and M0N2 were 26.9 and 25.0, the C/N ratios of M20N1 and M20N2 were 17.3 and 19.1, and the C/N ratios of M40N1 and M40N2 were 15.5 and 15.6. Overall the C/N ratios of biosolids in our improved vermicomposting system after treatment were positively correlated with those before. The C/N ratios of the rice straw-only treatment groups were all above 25, in keeping with reports in the literature indicating that a C/N ratio of 25 resulted in the highest and the best fertilizer value of the product [33]. The results of this study revealed that rice straw-only treatments can be used continuously for long time periods and are more capable of eliminating pollutants from dairy farm wastewater.
At the end of the experiment, the cellulose contents of M0N1 and M0N2 had decreased by 42.1% and 38.3%, respectively, those of M20N1 and M20N2 had decreased by 31.0% and 23.7% respectively, and those of M40N1 and M40N2 had decreased by 15.5% and 26.6% respectively (Figure 3C). This is concordant with the observation that the largest decrease in cellulose content was in the straw-only treatment. Comparing the results of different concentrations of wastewater in the same treatment, cellulose degraded faster in 100 mg/L (TKN) than in 200 mg/L (TKN). This may be because the addition of mild nitrogen which has a lower and mild concentration of nitrogen is more conducive to the metabolism and growth of earthworms, thereby promoting the degradation of cellulose.
The initial pH values of M0N1 and M0N2, M20N1 and M20N2, and M40N1 and M40N2 were 8.1, 8.6, and 8.9, respectively. At the end of the experiment, the pH values of M0N1 and M0N2 were 9.0and 9.0, those of M20N1 and M20N2 were 9.1 and 8.9, and those of M40N1 and M40N2 were 9.0 and 9.0, respectively (Figure 3D). The pH of all the treated matrix was about 9.0, and the activity of earthworms changed the pH of the mixture. Vermicomposting can change the pH of different sources of substances through the decomposition of organic matter into inorganic matter [34]. The pH of the vermicomposting process is also strongly correlated with ammonia volatilization [35]. In this study, the continuous supplement of dairy farm wastewater increased the nitrogen content of the improved vermicomposting system, and then the ammonia content due to gaseous losses was replenished. Therefore, the differences in pH resulting from the addition of wastewater were significant over the period of the experiment.

3.4. Phytotoxicity Test

Immature compost products may have toxic effects on seed germination and seedling growth. We used the germination index to measure the physiological toxicity and maturity of earthworm composting products. Intuitively, when the seed germination coefficient is greater than 50%, the composting is considered to have reached maturity [36]. In the study (Table 2), the germination index of the six tests were all higher than 60%, which demonstrated the improved vermicomposting system form could increase plant productivity. The germination index of M0N1 and M0N2 were 81% and 81%, respectively, which were significantly higher than those of other treatments. The germination index of M20N1 and M40N1 were 75% and 70%, respectively, and those of M20N2 and M40N2 were 71.86% and 68.66%, respectively. The germination index of these four tests was lower than those of the M0N1 and M0N2. The M0N1 and M0N2 groups, which showed the highest germination index, may provide more root growth and better promote the safety of plants [37].

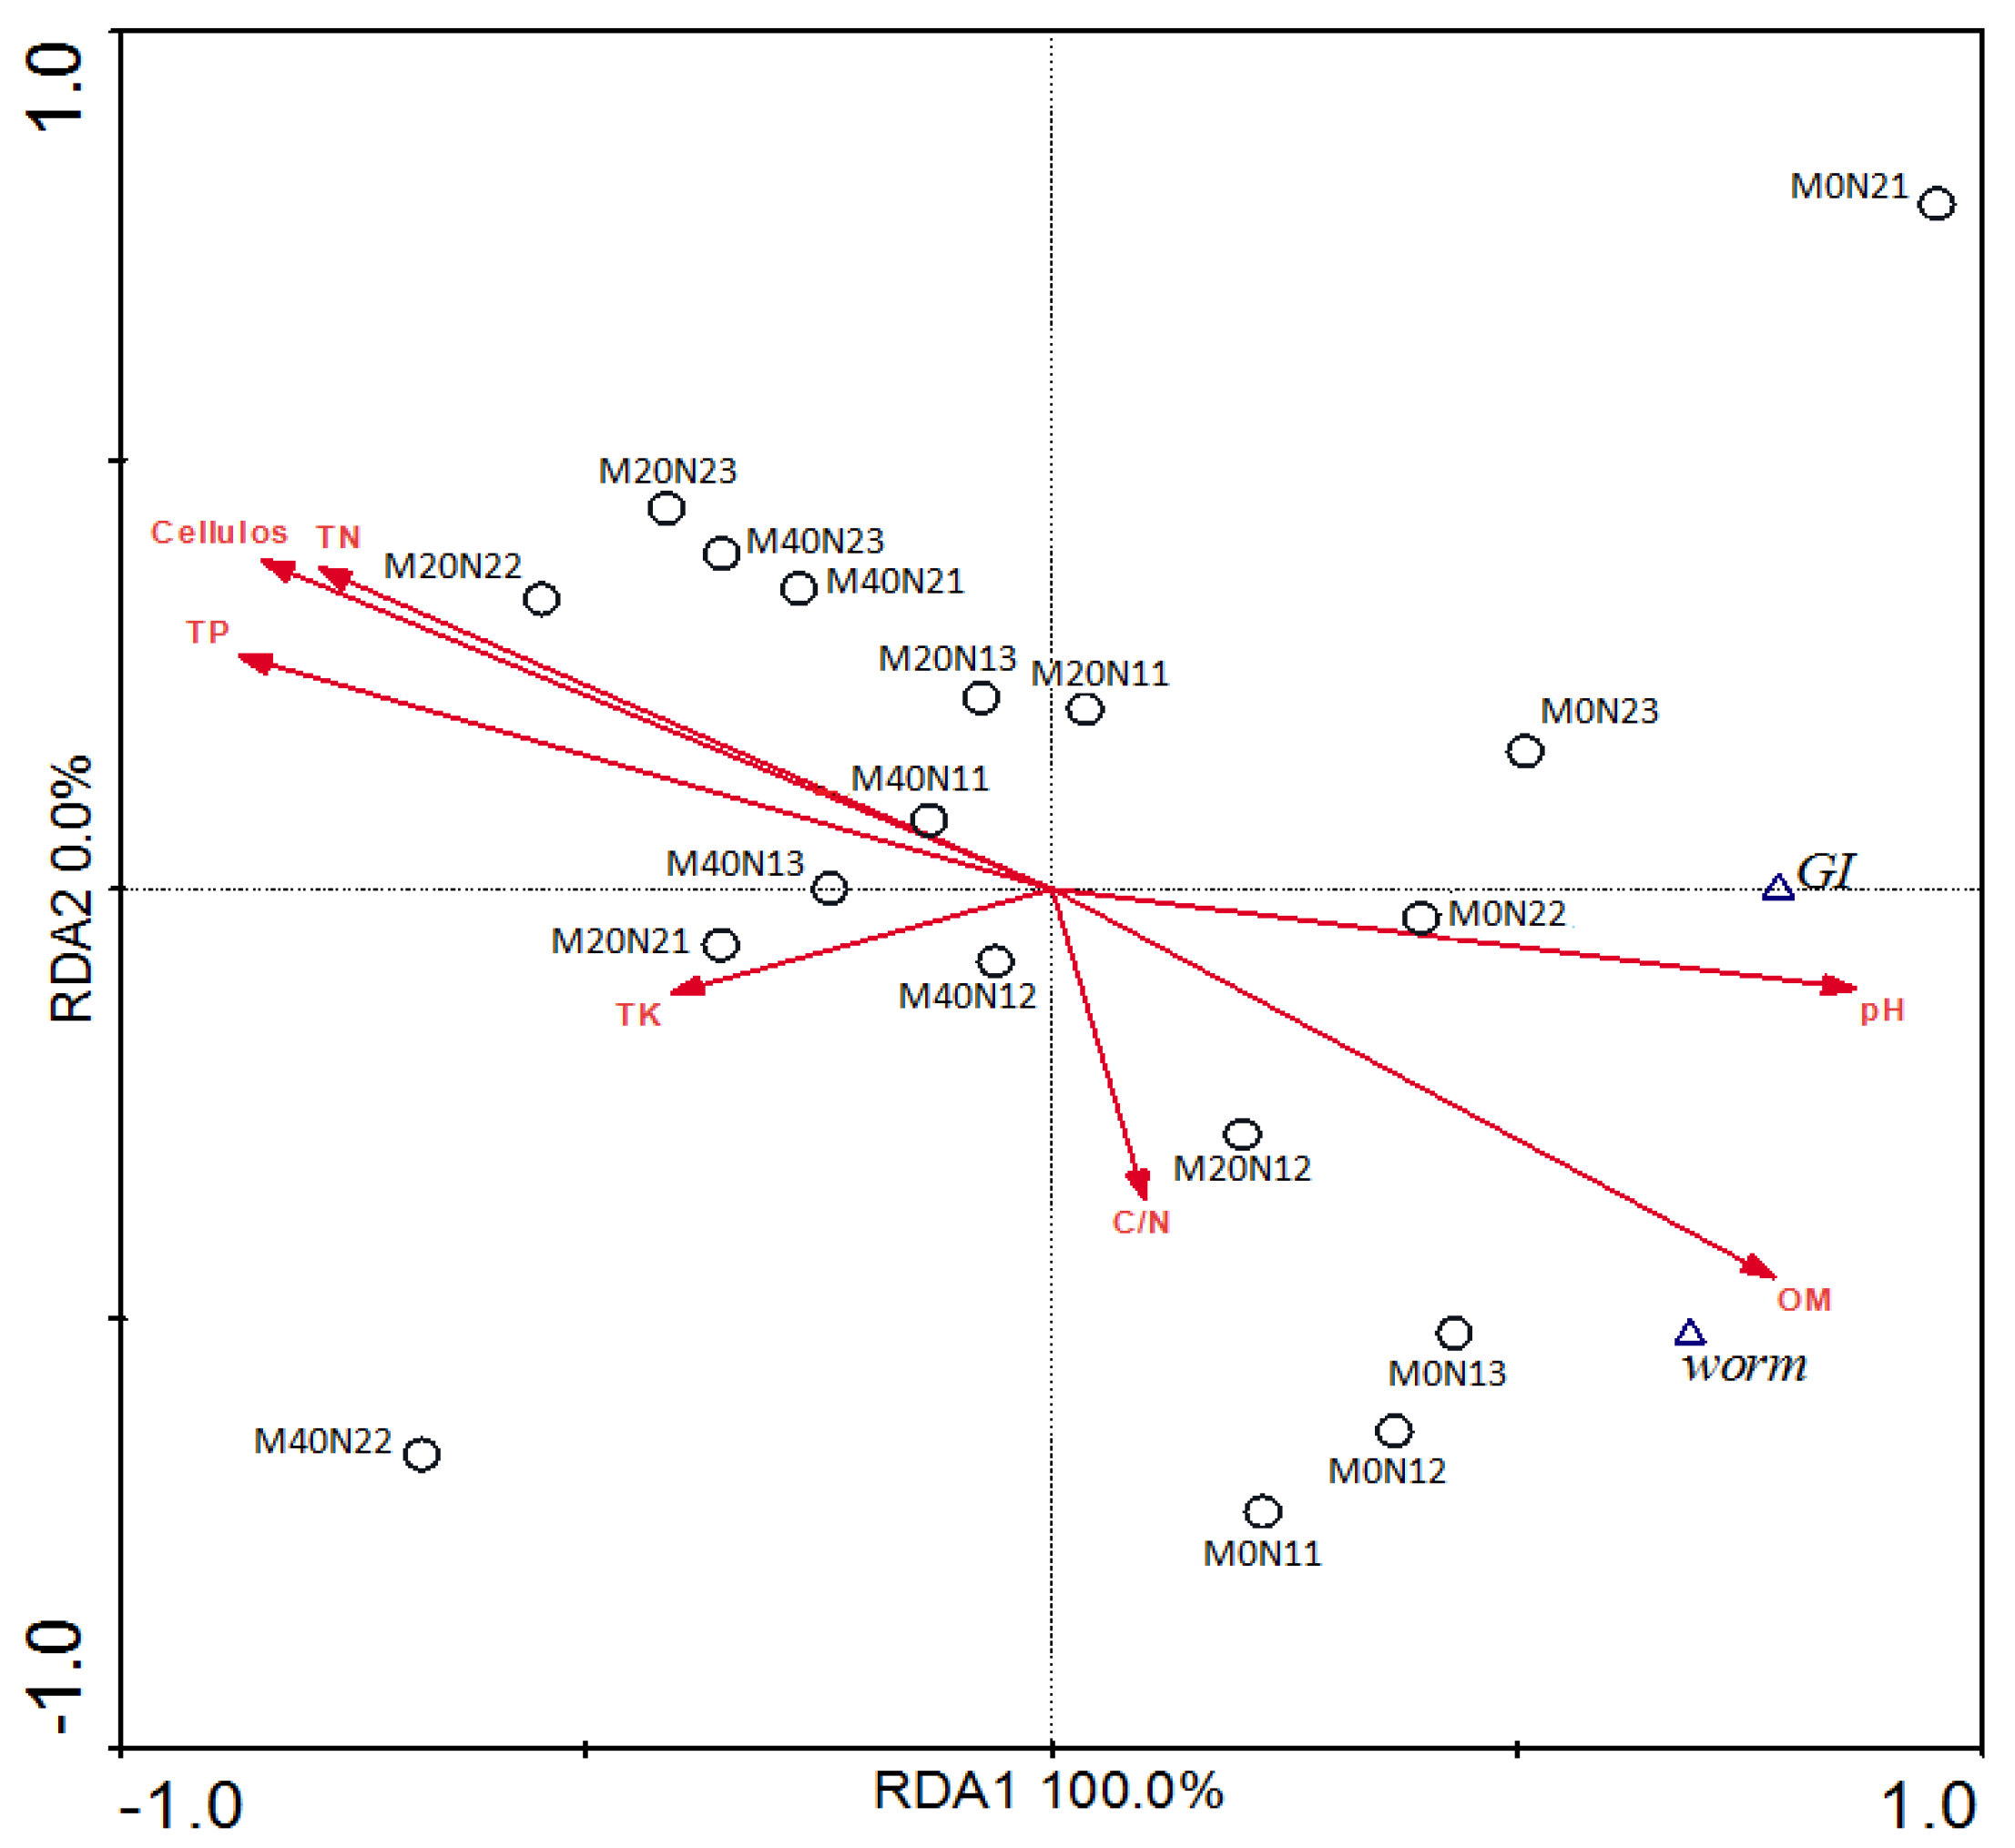
3.5. Correlation of Biological and Chemical Indexes

According to the detrended correspondence analysis, the length of the gradient of the first axis was 0.961, indicating that redundancy analysis (RDA) could better explain the relationship between the weight changes of per earthworm and germination index for environment factors compared with canonical correlation analysis. The ordination diagram based on RDA was presented (Figure 4). Similar trends were seen with the M0N1 and M0N2, which were highly positively correlated with earthworm weight change, germination index, C/N ratio, organic matter, and pH value, but negatively correlated with TKN, TP, TK, and cellulose, which correlated positively with M20N1, M40N1, M20N2, and M40N2. In this study, earthworm weight change was positively correlated with germination index, and the relative seed germination recorded a higher range of earthworm weight gain [38]. The C/N ratio, organic matter, and pH of the mixture had significant effects on the earthworms’ growth. The combination of pH value and organic matter had a significant effect on the mixture germination index.

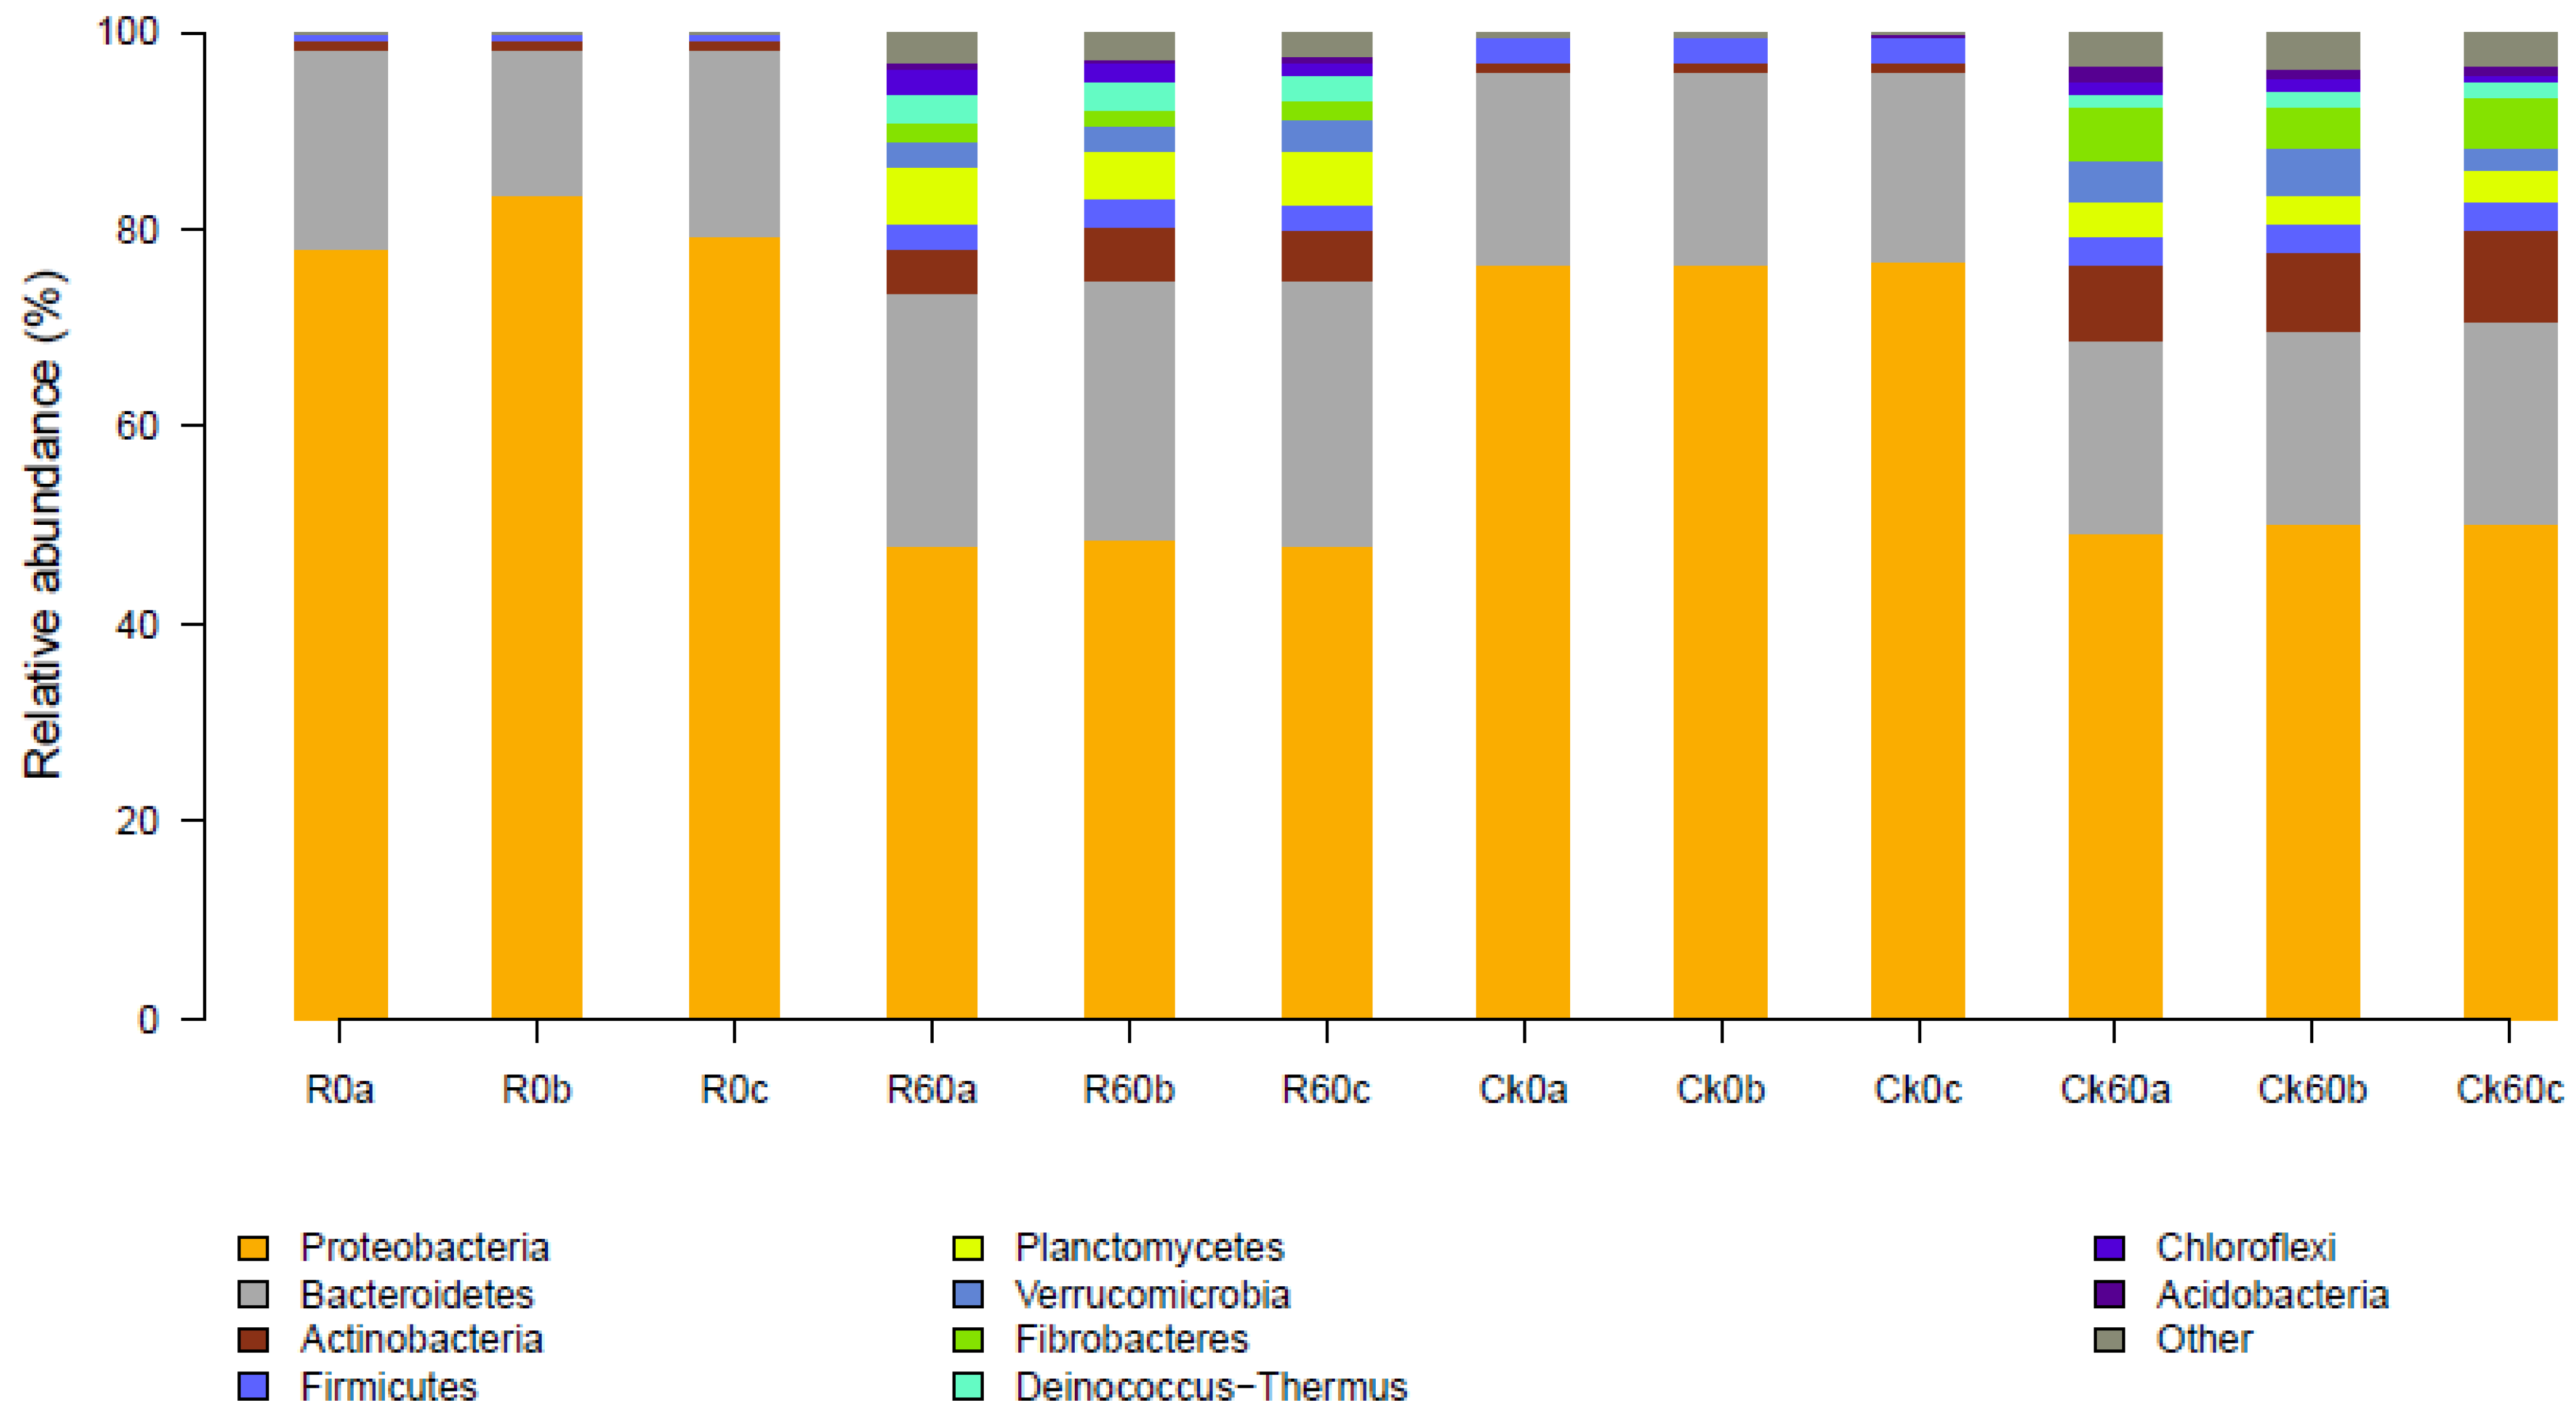
3.6. Composition of the Microbial Community

The relative abundance of bacteria taxonomic groups were presented (Figure 5). Thirty bacteria phyla were identified. At the phylum level, in all groups, at day 0, the dominant phyla were Proteobacteria, Bacteroidetes, Actinobacteria, and Firmicutes, which accounted for 99.8% of all bacteria. Proteobacteria was the most abundant phylum in all groups, followed by Bacteroidetes in groups R0 and CK0, indicating that when earthworms were not added, the bacteria in the mixture were mainly Proteobacteria and Bacteroidetes.
In groups CK and R, at day 60, the dominant phylum in the groups with earthworms were Proteobacteria and Bacteroidetes, the same as in the groups without earthworms, although the relative abundance of Proteobacteria decreased in both treatments, while the abundance of Bacteroidetes, Actinobacteria, Firmicutes, and Verrucomicrobia increased. The latter phyla have also been reported to dominate in compost studies without earthworms, which are generally involved in the degradation of organic waste [39]. Proteobacteria and Actinobacteria are lignin-degrading bacteria [40] while Bacteroidetes are thought to degrade cellulose and chitin [41]. Firmicutes produce celluloses, lipases, proteases, and other extracellular enzymes that degrade lignin, cellulose, sugars, and amino acids [42]. Finally, Verrucomicrobia is mainly found in lakes, drinking water, and other natural freshwater environments [43].
Original composting and vermicomposting modified the original microbial communities of the waste in diverse ways. The differences in microbiota patterns can be attributed to the physicochemical composition of the wastes and the interaction of the earthworms in the microbial communities [44]. Representative bacteria of mature compost (Actinobacteria) were more abundant in vermicomposting, and Bacteroidetes were more abundant in compost [45]. This resulted in the greater similarity of the microbial community structure between the products of natural placement and maturation via vermicomposting. This indicates that the microbial community composition was affected by the presence of earthworms and by the continuous addition of waste liquid.

4. Conclusions

In summary, the study presented here permits us to develop an improved vermicomposting system, in order to have efficient recycling of wastewater and reuse dairy wastewater, rice straw, and cow manure simultaneously. We demonstrated that earthworms could alter the biochemistry of dairy wastewater and other solid waste and accelerate the stabilization, maturity, and microbial community composition of organic waste. The C/N ratio had the highest effects on earthworm growth, and the increase of earthworm weight promoted the mineralization of solid waste; also, the percentages of total nitrogen, phosphorous, and potassium increased, while organic matter content, C/N ratio, and cellulose declined as a function of the vermicomposting period. For future experiments, we could proceed with the response of electrical conductivity and heavy metals during the vermicomposting period, and the effect of other agricultural organic wastes. This is a feasible method for the simultaneous disposal of organic wastes, especially in poor countries, because it incurs lower costs and has a lower impact on the environment. Our laboratory-scale experiment processing cow manure with earthworms might not fully duplicate large-scale commercial conditions, but provides valuable insights into the process and the changes brought about by earthworm activity.

Author Contributions

Data curation—formal analysis & writing, X.L.; review, F.F.; funding acquisition, C.Z., B.G., L.L.; supervision, F.F., and C.Z. All authors have read and agreed to the published version of the manuscript.

Funding

This work was financially supported by National Water Pollution Control and Treatment Science and Technology Major Project in China (2017ZX07603002, 2015C03004), the National Science Foundation of Beijing (8182059).

Institutional Review Board Statement

Not applicable.

Informed Consent Statement

Not applicable.

Data Availability Statement

The data presented in this study are available on request from the corresponding author.

Acknowledgments

The authors would like to thank the University of Liège-Gembloux Agro-Bio Tech and more specifically Agriculture Is Life for the opportunity platform.

Conflicts of Interest

The authors declare no conflict of interest.

References

  1. NDCC. The First National Census Atlas of Pollution Sources; China Surveying and Mapping Publishing House: Beijing, China, 2011; ISBN 978750302485. The first National Data Compilation Committee on pollution sources census. [Google Scholar]
  2. Goncalves, M.R.; Costa, J.C.; Marques, I.P.; Alves, M.M. Strategies for lipids and phenolics degradation in the anaerobic treatment of olive mill wastewater. Water. Res. 2012, 46, 1684–1692. [Google Scholar] [CrossRef] [Green Version]
  3. Haugen, F.; Bakke, R.; Lie, B.; Hovland, J.; Vasdal, K. Optimal design and operation of a UASB reactor for dairy cattle manure. Comput. Electron. Agr. 2015, 111, 203–213. [Google Scholar] [CrossRef] [Green Version]
  4. Sergey, K.; Vyacheslav, F.; Alla, N. Anaerobic treatment of liquid fraction of hen manure in UASB reactors. Bioresour. Technol. 1998, 65, 221–225. [Google Scholar]
  5. Daud, M.K.; Rizvi, H.; Akram, M.F.; Ali, S.; Rizwan, M.; Nafees, M.; Jin, Z.S. Review of upflow anaerobic sludge blanket reactor technology: Effect of different parameters and developments for domestic wastewater treatment. J. Chem. 2018, 2018, 1–13. [Google Scholar] [CrossRef] [Green Version]
  6. Sebastian, B.; Jarosław, D.; Laurence, W. Anaerobic co-digestion of swine and poultry manure with municipal sewage sludge. Wast. Manag. 2014, 34, 513–521. [Google Scholar]
  7. Zhang, W.Q.; Wei, Q.Y.; Wu, S.B.; Qi, D.D.; Li, W.; Zuo, Z.; Dong, R. Batch anaerobic co-digestion of pig manure with dewatered sewage sludge under mesophilic conditions. Appl. Energ. 2014, 128, 175–183. [Google Scholar] [CrossRef]
  8. Su, L.L.; Lee, L.H.; Wu, T.Y. Sustainability of using composting and vermicomposting technologies for organic solid waste biotransformation: Recent overview, greenhouse gases emissions and economic analysis. J. Clean. Prod. 2016, 111, 262–278. [Google Scholar]
  9. Zziwa, A.; Jjagwea, J.; Kizitob, S.; Kabengea, I.; Komakecha, A.J.; Kayondoa, H. Nutrient recovery from pineapple waste through controlled batch and continuous vermicomposting systems. J. Environ. Manag. 2021, 279, 111784. [Google Scholar] [CrossRef] [PubMed]
  10. Sanchez-Hernandez, J.C.; Domínguez, J. Dual Role of Vermicomposting in Relation to Environmental Pollution. In Bioremediation of Agricultural Soils; CRC Press: Boca Raton, FL, USA, 2019; p. 217. [Google Scholar]
  11. Rola, M.; Atiyeh, R.M.; Domínguez, J.; Subler, S.; Edwards, C.A. Changes in biochemical properties of cow manure during processing by earthworms (Eiseniaandrei, Bouché) and the effects on seedling growth. Pedobiologia 2000, 44, 709–724. [Google Scholar]
  12. Lv, M.; Li, J.; Zhang, W.X.; Zhou, B.; Dai, J.; Zhang, C. Microbial activity was greater in soils added with herb residue vermicompost than chemical fertilizer. Ecol. Lett. 2020, 2, 209–219. [Google Scholar] [CrossRef]
  13. Sinha, R.K.; Agarwal, S.; Chauhan, K.; Valani, D. The wonders of earthworms & its vermicompost in farm production: Charles Darwin’s friends of farmers, with potential to replace destructive chemical fertilizers from agriculture. Agr. Sci. 2010, 1, 76–97. [Google Scholar]
  14. Patwa, A.; Parde, D.; Dohare, D.; Vijay, R.; Kumar, R. Solid waste characterization and treatment technologies in rural areas: An Indian and international review. Environ. Technol. Innov. 2020, 20, 101066. [Google Scholar] [CrossRef]
  15. Taylor, M.; Clarke, W.P.; Greenfield, P.F. The treatment of domestic wastewater using small scale vermicompost filter beds. Ecol. Eng. 2003, 21, 197–203. [Google Scholar] [CrossRef]
  16. Haimi, J.; Huhta, V. Comparison of composts produced from identical wastes by “vermistabilization” and conventional composting. Pedobiologia 1987, 30, 137–144. [Google Scholar]
  17. Kalembasa, S.J.; Jenkinson, D.S. A Comparative study of titrimetric and gravimetric methods for the determination of organic carbon in soil. Sci. Food. Agri. 1973, 24, 1085–1090. [Google Scholar] [CrossRef]
  18. Jackson, M.L. Soil Chemical Analysis; Prentice Hall of India Pvt. Ltd.: New Delhi, India, 1973. [Google Scholar]
  19. Crosland, A.R.; Zhao, F.J.; McGrath, S.P.; Lane, P.W. Comparison of aqua regia digestion with sodium carbonate fusion for the determination of total phosphorus in soil by inductively coupled plasma atomic emission spectroscopy (ICP). Commun. Soil Sci. Plan. 1995, 26, 1357–1368. [Google Scholar] [CrossRef]
  20. Awasthi, M.K.; Pandey, A.K.; Khan, J.; Bundela, P.S.; Wong, J.W.C.; Selvam, A. Evaluation of thermophilic fungal consortium for organic municipal solid waste composting. Bioresour. Technol. 2014, 168, 214–221. [Google Scholar] [CrossRef]
  21. Zhang, L.; Sun, X.Y. Changes in physical, chemical, and microbiological properties during the two-stage co-composting of green waste with spent mushroom compost and biochar. Bioresour. Technol. 2014, 171, 274–284. [Google Scholar] [CrossRef]
  22. Datta, S.; Singh, J.; Singh, S.; Singh, J. Earthworms, pesticides and sustainable agriculture: A review. Environ. Sci. Pollut. R. 2016, 23, 8227–8243. [Google Scholar] [CrossRef]
  23. Deka, R.; Kumar, R.; Tamuli, R. Neurospora crassa homologue of neuronal calcium sensor-1 has a role in growth, calcium stress tolerance, and ultraviolet survival. Genetica 2011, 139, 885–894. [Google Scholar] [CrossRef]
  24. Partanen, P.; Hultman, J.; Paulin, L.; Auvinen, P.; Romantschuk, M. Bacterial diversity at different stages of the composting process. BMC Microbiol. 2010, 10, 1–11. [Google Scholar] [CrossRef] [Green Version]
  25. Gu, W.J.; Zhang, F.B.; Xu, P.Z.; Tang, S.H.; Xie, K.Z.; Huang, X.; Huang, Q.Y. Effects of sulphur and Thiobacillus thioparus on cow manure aerobic composting. Bioresour. Technol. 2011, 102, 6529–6535. [Google Scholar] [CrossRef]
  26. Li, Y.K.; Yang, X.L.; Gao, W.; Qiu, J.P.; Li, Y.S. Comparative study of vermicomposting of garden waste and cow dung using Eisenia fetida. Environ. Sci. Pollut. Res. 2020, 27, 9646–9657. [Google Scholar] [CrossRef]
  27. Elvira, C.; Sampedro, L.; Benitez, E.; Nogales, R. Bioconversion of solid paper-pulp mill sludge by earthworms. Bioresour. Technol. 1998, 57, 173–177. [Google Scholar] [CrossRef]
  28. Ndegwa, P.M.; Thompson, S.A. Integrating composting and vermicomposting in the treatment and bioconversion of biosolids. Bioresour. Technol. 2001, 76, 107–112. [Google Scholar] [CrossRef]
  29. Bernal, M.P.; Paredes, C.; Sanchez-Monedero, M.A.; Cegarra, J. Maturity and stability parameters of composts prepared with a wide range of organic waste. Bioresour. Technol. 1998, 63, 91–99. [Google Scholar] [CrossRef]
  30. Bordna Mona. Compost Testing and Analysis Service—Interpretation of Results; Bordna Mona, Newbridge, Co.: Kildare, Ireland, 2003. [Google Scholar]
  31. NY 525-2012. People’s Republic of China Agricultural Industry Standard; China Agricultural Publishing House: Beijing, China.
  32. El-Haddad, M.E.; Zayed, M.S.; El-Sayed, G.A.M.; Hassanein, M.K.; El-Satar, A.M.A. Evaluation of compost, vermicompost and their teas produced from rice straw as affected by addition of different supplements. Ann. Ggr. Sci. 2014, 59, 243–251. [Google Scholar] [CrossRef] [Green Version]
  33. Aira, M.; Monroy, F.; Domínguez, J. C to N ratio strongly affects population structure of Eisenia fetida in vermicomposting systems. Eur. J. Soil Biol. 2006, 42, S127–S131. [Google Scholar] [CrossRef]
  34. Garg, P.; Gupta, A.; Satya, S. Vermicomposting of different types of waste using Eisenia foetida: A comparatives study. Bioresour. Technol. 2006, 97, 391–395. [Google Scholar] [CrossRef]
  35. Venkatesh, R.M.; Eevera, T. Mass reduction and recovery of nutrients through vermicomposting of fly ash. Appl. Ecol. Env. Res. 2008, 6, 77–84. [Google Scholar] [CrossRef]
  36. Zucconi, F.; Pera, A.; Forte, M.; Bertoldi, M.D. Evaluating toxicity of immature compost. Biocycle 1981, 22, 54–57. [Google Scholar]
  37. Bajsa, O.; Nair, J.; Mathew, K.; Ho, G. Vermiculture as a tool for domestic wastewater management. Water. Sci. Technol. 2003, 48, 125–132. [Google Scholar] [CrossRef]
  38. Ravindran, B.; Contreras-Ramos, S.M.; Wong, J.W.C.; Selvam, A.; Sekaran, G. Nutrient and enzymatic changes of hydrolysed tannery solid waste treated with epigeic earthworm Eudrilus eugeniae and phytotoxicity assessment on selected commercial crops. Environ. Sci. Pollut. Res. 2014, 21, 641–651. [Google Scholar] [CrossRef] [PubMed]
  39. Wang, X.J.; Pan, S.Q.; Zhang, Z.Z.; Lin, X.Y.; Zhang, Y.Z.; Chen, S.H. Effects of the feeding ratio of food waste on fed-batch aerobic composting and its microbial community. Bioresour. Technol. 2017, 224, 397–404. [Google Scholar] [CrossRef]
  40. Bugg, T.D.; Ahmad, M.; Hardiman, E.M.; Singh, R. The emerging role for bacteria in lignin degradation and bio-product formation. Curr. Opin. Biotech. 2011, 22, 394–400. [Google Scholar] [CrossRef] [PubMed]
  41. Manz, W.; Amann, R.; Ludwig, W.; Vancanneyt, M.; Schleifer, K.-H. Application of a suite of 16S rRNA-specific oligonucleotide probes designed to investigate bacteria of the phylum cytophaga-flavobacter-bacteroides in the natural environment. Microbiology 1996, 142, 1097–1106. [Google Scholar] [CrossRef] [PubMed] [Green Version]
  42. Lim, J.W.; Chiam, J.A.; Wang, J.Y. Microbial community structure reveals how micro aeration improves fermentation during anaerobic co-digestion of brown water and food waste. Bioresour. Technol. 2014, 171, 132–138. [Google Scholar] [CrossRef]
  43. Zwart, G.; Crump, B.C.; Kamst-van Agterveld, M.P.; Hagen, F.; Han, S.K. Typical freshwater bacteria: An analysis of avail-able 16S rRNA gene sequences from plankton of lakes and rivers. Aquat. Microb. Ecol. 2002, 28, 141–155. [Google Scholar] [CrossRef] [Green Version]
  44. Villar, I.; Alves, D.; Pérez-Díaz, D.; Mato, S. Changes in microbial dynamics during vermicomposting of fresh and composted sewage sludge. Wast. Manag. 2016, 48, 409–417. [Google Scholar] [CrossRef]
  45. Danon, M.; Franke-Whittle, I.H.; Insam, H.; Chen, Y.; Hadar, Y. Molecular analysis of bacterial community succession during prolonged compost curing. Fems. Microbiol. Ecol. 2008, 65, 133–144. [Google Scholar] [CrossRef]
Figure 1. Evolution of Eisenia fetida weight according to different proposed diets (in g per worm on 60 day durations).
Agronomy 11 00833 g001
Figure 2. Total Kjeldahl nitrogen (TKN)%, total phosphorus (TP)%, and total potassium (TK)% in different treatments on days 0 and 60 of the experiment. (N-0:TKN% at 0 day; N-60:TKN% at 60 day; TP-0:TP% at 0 day; TP-60:TP% at 60 day; TK-0:TK% at 0 day; TK-60:TK% at 60 day). Compared the difference values of TKN-60 to TKN-0, TP-60 to TP-0, TK-60 to TK-0 in different treatments, the different letters of a, b, c, d were marked on the bar to indicate the significantly different which were determined by Tukey’s test (p ˂ 0.05).
Agronomy 11 00833 g002
Figure 3. Changes in the physicochemical properties of the different treatments at 0 and 60 days. Comparing the difference values of orgnic matter of 60 day to 0 day (A), C/N ratio of 60 day to 0 day (B), cellulose of 60 day to 0 day (C), pH value of 60 day to 0 day (D) in different treatments; different letters in arrows are significant at p < 0.05 (Tukey’s test).
Agronomy 11 00833 g003aAgronomy 11 00833 g003b
Figure 4. Redundancy analysis of the D_value of the weight of worms and germination rate to the environmental factors in the improved vermicomposting system (after 60 days).
Agronomy 11 00833 g004
Figure 5. Composition of the bacterial communities at the phylum level. R0a, R0b, and R0c: samples of the rice straw inoculated with earthworms, R60a, R60b, and R60c: samples of the rice straw inoculated with earthworms after 60 days. CK0a, CK0b, and CK0c: samples of the rice straw without earthworms. CK60a, CK60b, and CK60c samples of the rice straw without earthworms after 60 days.
Agronomy 11 00833 g005
Table 1. Consumption of wastewater parameters in the improved vermicomposting system until 60th day.
Parameter aTreatments
M0N1M0N2M20N1M40N1M20N2M40N2
Volume (mL) b980a980a895b895b770c770c
Total nitrogen (mg) c98d196a89.5e89.5e144c154b
a For each parameter (see text for details), differences among treatments were determined by Tukey’s test. Different letters in arrow are significant at p < 0.05 (Tukey’s test). b The total volume of the added wastewater into the improved vermicomposting system because that the dairy farm wastewater was added to the system every 3 days to supply the needed amount to avoid desiccation. c The total nitrogen of the added wastewater into the improved vermicomposting system.
Table 2. Biological parameters of weight changes of earthworms and germination index.
Parameter aTreatments
M0N1 M0N2 M20N1 M40N1 M20N2 M40N2
Weight changes of per worm (g) b0.16 ± 0.02a0.11 ± 0.02ab0.06 ± 0.02c0.02 ± 0.003d0.05 ± 0.05bc0.06 ± 0.03bc
Germination index (%)81.07 ± 1.35a81.13 ± 4.95a75.64 ± 7.74a70.16 ± 5.63a 71.86 ± 4.20a 68.66 ± 8. 97a
a For each parameter (see text for details), differences among treatments were determined by Tukey’s test. Different letters in arrow are significant at p < 0.05 (Tukey’s test). b Weight changes of per worm between day 0 and the 60th day.
Publisher’s Note: MDPI stays neutral with regard to jurisdictional claims in published maps and institutional affiliations.

