Article

Soil Productivity Degradation in a Long-Term Eroded Olive Orchard under Semiarid Mediterranean Conditions

by
Manuel González-Rosado
,
Luis Parras-Alcántara
,
Jesús Aguilera-Huertas
and
Beatriz Lozano-García
*
SUMAS Research Group, Department of Agricultural Chemistry, Soil Science and Microbiology, Faculty of Science, Agrifood Campus of International Excellence—ceiA3, University of Cordoba, 14071 Cordoba, Spain
*
Author to whom correspondence should be addressed.
Agronomy 2021, 11(4), 812; https://doi.org/10.3390/agronomy11040812
Submission received: 24 February 2021 / Revised: 14 April 2021 / Accepted: 19 April 2021 / Published: 20 April 2021
(This article belongs to the Special Issue Conservation Tillage in Sustainable Agro-Ecosystems)

Abstract

:
Olive groves are one of the most important agro-systems in the Mediterranean basin, and the Andalusia region produces the highest quantity of olive oil in Europe. The aim of this work was to evaluate the long-term (15 years) influence of two management practices in olive orchards—conventional tillage (CT) and no tillage with bare soil and herbicide application (NT + H)—on soil physical properties, infiltration capacity, erosion rates, and soil productivity. In addition, the short-term (2 years) influence of no tillage with cover crop management (NT-CC) on these parameters was also assessed. In the study area, CT and NT + H management practices showed unsustainable erosion values, 9.82 and 13.88 Mg ha−1 year−1, respectively, while NT-CC inclusion decreased the erosion rates (2.06 Mg ha−1 year−1). The implementation of NT-CC not only reduced erosion rates but also caused a change in the trend of soil productivity loss observed under CT and NT + H. In this sense, NT-CC showed a positive influence on soil quality. However, tillage removal led to a significant reduction in the infiltration capacity of soils under NT + H and NT-CC, which will be a serious handicap for water storage in an environment with continuous processes of water deficit.

1. Introduction

Governmental strategies, such as the European Green Deal and an awareness increase in relation to environmental health and the long-term sustainability of agroecosystems, require the implementation of management strategies that preserve soil, air, and water resources. Agricultural soils can provide a significant number of ecosystem services under suitable agricultural management practices [1,2,3]. In Mediterranean areas, woody crop soils, e.g., olive, almond, or vineyards, have a high potential to provide ecosystem services [4,5,6]. However, they are usually installed on hillsides and shallow soils that are exposed to prolonged drought periods and torrential rainfall episodes [7,8,9]. In addition, the implementation of non-conservative agronomic practices in woody crop soils (deep tillage or bare soil maintenance), leads to soil degradation processes and calls their properties relative to the provision of ecosystem services into question [10,11,12].
Olive groves are representative landscapes in the Mediterranean region, with around 10 Mha [13]. The historical evolution in the management of this millenary agroecosystem from a traditional organic and multifunctional system to a mechanical and monoculture system [14] has caused a decline in biodiversity, poor soil structures, a depletion of organic matter levels, and increased soil losses due to severe erosive processes [15]. In this sense, the restoration of soil properties in the agricultural soils, where olive groves are cultivated, should be a priority in crop management strategies, while improving soil quality and climate change mitigation and adaptation [16,17,18].
In Andalusian olive groves, soil loss related to erosive processes is a major environmental issue that causes soil degradation and contributes, in arid and semiarid lands, to land desertification [19]. Soil erosion is even worse in soils with low organic matter levels and poor structure [20,21]. These erodible soils are common in Andalusia olive groves [22,23], and erosion processes affect the productivity of these agricultural soils [24].
Soil productivity is defined as the capacity of soil to yield a specific crop or a sequence of plants under a determinate agricultural management system [25,26]. Sustainable soil productivity is the key to the provision of some soil services (e.g., food or fiber) and food security [27,28]. Soil management practices for the maintenance and improvement in soil productivity in olive groves under Mediterranean conditions, to avoid deficiencies and improve the efficiency of water dynamics by avoiding deficits and possible crusting processes, should be based on the adoption of strategies that generate biomass that increases soil organic carbon (SOC) and soil coverage and a balanced supply of nutrients [16,29].
Agricultural management in olive groves is mainly based on the maintenance of the soil without permanent vegetation cover through continuous tillage or by the application of pre-emergence herbicides. It is widely accepted that these soil management systems impact many different soil characteristics and processes [30,31]. Conventional tillage (CT) promotes the oxidation of organic compounds, crop residue, and soil organic matter (OM) through soil macroaggregate breakdown and increased aeration, which usually results in SOC losses [32,33,34]. In contrast, no tillage plus herbicides (NT + H) has been accepted by many farmers as a sustainable agricultural practice because it reduces the amount of farm labour. However, this is not always clear, especially when bare soil is continuously being maintained by herbicide applications [35,36]. On the contrary, no tillage with cover vegetation (NT-CC) has been proposed by many researchers as a sustainable management technique [37,38,39] that could result in management that reduces erosion rates and provides valuable ecosystem services in Mediterranean olive groves.
The purpose of the present study was to assess both the assessment of degradation in olive grove soil after long-term conventional tillage and after no tillage plus herbicides and the short-term effectiveness in terms of soil regeneration of the inclusion of vegetation cover under semiarid conditions in soils with a long-term degradation process. To achieve this goal, the effects of management practices on erosion processes, physical soil properties at different depths, and water infiltration in rainfed Mediterranean olive groves were evaluated. In addition, the effects of soil erosion on soil productivity with reference to the soil’s physical and chemical properties under different management practices (conventional tillage, no tillage with bare soil, and no tillage with cover) were estimated.

2. Materials and Methods

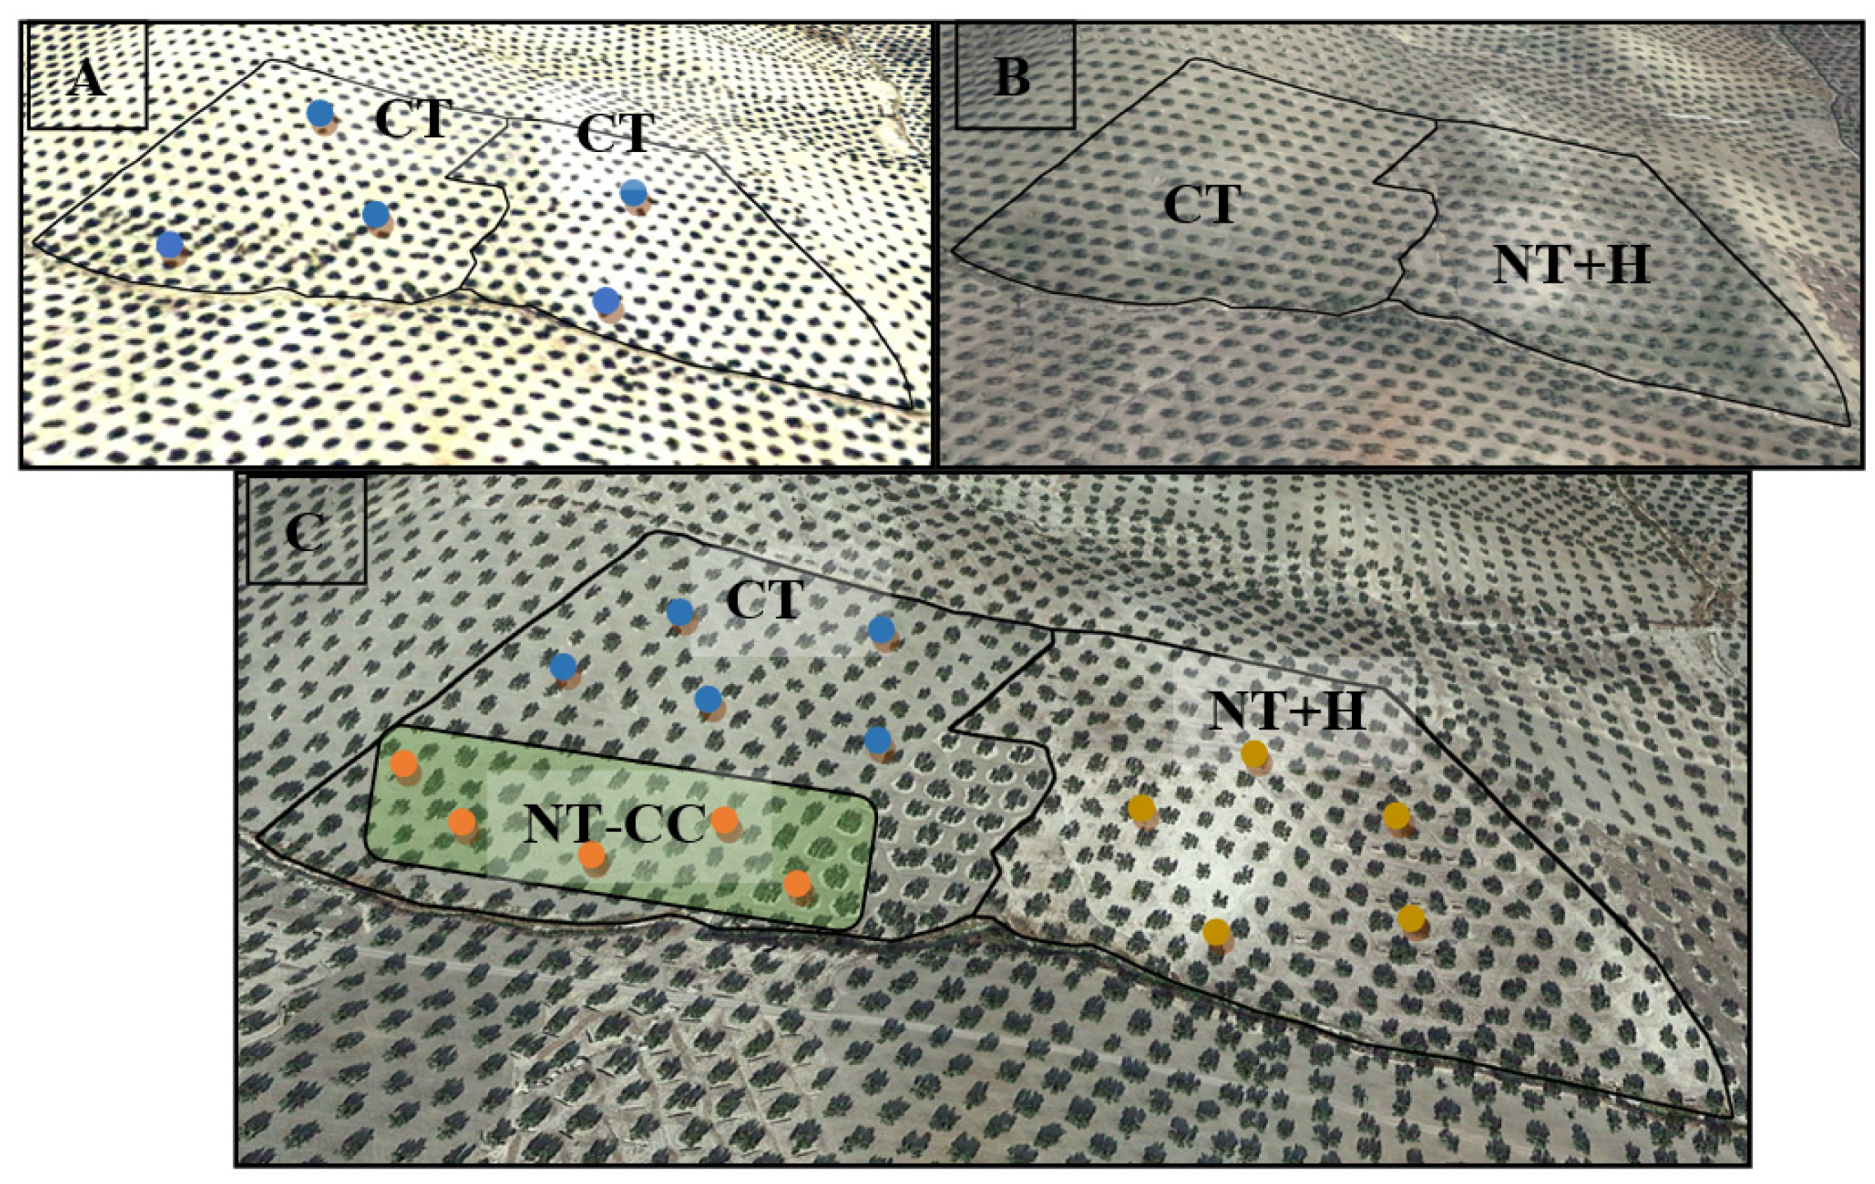
2.1. Site Characterization and Experimental Design

The field work was conducted in Southern Spain (Torredelcampo, Jaen, Andalusia), and the farm studied comprised an area of 10 ha of traditional olive groves (Olea europaea) (37°50′55″ N, 03°51′55″ W) (Figure 1).
The landscape in the study area is greatly influenced by a long history of human agricultural activity and is mainly formed by low altitude hills (around 450 m.a.s.l.) with rounded summits and gently slopes (6% on average) consisting of sedimentary material (mainly, limestones and marls), and by channel beds in the low areas, with no permanent watercourse, as a consequence of water incision due to erosion processes. The soil of the study area, which developed from a sedimentary parental material, has a uniform texture and high carbonate content, and was classified as Calcaric Cambisol according to [40]. Details related to climatic conditions in the analysed period are described in [41].
The long-term experimental design consisted in a traditional rain-fed olive grove of the “Picual” variety (10 ha) managed under conventional tillage (CT0) since 1950. It was divided into two plots in 2004, one maintaining the same management (CT1) and the other changed to a no tillage system (NT + H). The plots managed with CT were tilled with a cultivator in spring followed by tine and disc harrowing in summer (25 cm), and NT + H was managed with a lower amount of labour, since mechanical practices were not applied. Both plots received the same rate and type of chemical fertilisers in the winter season (100 kg ha−1 urea, 46% N), and vegetation was eliminated by applying pre-emergence herbicides (1.0 L 36% glyphosate ha−1) in autumn to control weeds in all cases. In 2017, an area (7500 m2) managed under CT1 since 2004 was changed to agricultural management under covers (Crocus sativus, Avena sativa, and Lavandula x intermedia) without tillage or applications of herbicides—only mechanical weeding in spring. The seed quantities used were 140 kg ha−1, 2000 kg ha−1 and 12,000 plants ha−1 for oats, saffron, and lavender, respectively. These crops were selected because they have low water requirements; however, different circumstances (rabbit pests, a lack of rainfall in the nascence season, and high temperatures) did not allow for the growth of the planted covers, and spontaneous covers (Conyza canadensis, Arenaria hispanica, Sonchus oleraceus, Capsella bursapastoris, Diplotaxis virgata) colonized the olive tree alleys (NT-CC).

2.2. Soil Sampling and Analysis

In the study area, in 2004, pits were opened to describe initial soil profiles—under conventional tillage (CT0)—and sampling them by horizons. The pits were closed once the samples were taken. In 2019, the study area was sampled again after a management change on the part of the farm in 2004 to no tillage, the inclusion of cover crops (2017), and the evolution of soil properties under conventional tillage from 2004 to 2019. Five random sampling points were selected in each plot, (Figure 1), pits were dug with a mini-excavator outside the tree canopy projection (inter-row olive area). In each management system (CT0, CT1, NT + H, and NT-CC), five soil profiles (120 cm in depth on average) were sampled horizon by horizon and sampling points were positioned beyond the projection of the tree crown. The horizons depths (Table 1) are average values and the study area is a hillside with low slope gradients. Therefore, there were no significant differences in the depth of the horizons between the treatments studied.
The soil samples collected were air-dried in the laboratory, sieved (2 mm), and stored until subsequent analysis in 2004 in the case of CT0 and in 2019 in the other cases. The samples were analysed according to different methods to determine the soil’s physical and chemical properties [41], and three repetitions were carried out for each sample. Soil water retention was measured using undisturbed samples collected with core cylinders (100 cm3 and 5 cm high). The samples were wetted with distilled water from below to saturation and then drained to water suctions at −33 kPa (field capacity; FC) and −1500 kPa (permanent wilting point; PWP) using a progressive drying process with pressure plate extractors [42]. Finally, the soil samples were completely dried in an oven (24 h at 105 °C). Available water capacity (AWC) was determined by the difference between water volumes at PWP and FC, and volumetric values were obtained as a result of multiplying the gravimetric measurements by the bulk density values. Bulk density was determined by collecting undisturbed samples (horizon by horizon) in core cylinders (core method). The pore size and water retention capacity relationship were established as follows: macroporosity represents >60 μm (pF < 1.8) and microporosity represents <10 μm (pF > 2.5) [43].
The infiltration rate was determined in the field by the simple ring method (Beerkam method) [44,45]. Surface vegetation and litter were removed, and PVC rings (diameter = 15 cm; height = 12 cm) were inserted into the soil to a depth of 1–2 cm to produce minimal disturbance of the porous medium and prevent water leakage at the surface. Within each experimental plot, measurement points were randomly selected in the inter-row area (that is, outside the olive canopy projection). Six rings were installed per management system, and the time required for the infiltration of water was registered.

2.3. Soil Loss Estimation, Revised Universal Soil Loss Equation (RUSLE) Model

The Revised Universal Soil Loss Equation (RUSLE) [45] remains the most widely used tools for this. The soil losses were calculated for each management practice, and the model estimated average annual erosion using five factors, rainfall, soil, the topographic factor, covers and management, applying the following equation:
A = R     K     C     L S     P
where A is the annual average soil loss (Mg ha−1 year−1), R is the rainfall erosivity factor (MJ mm ha−1 h−1 yr−1), K is the soil erodibility factor (Mg ha h ha−1 MJ−1 mm−1), C is the cover and management factor, LS is the factor of length (m) and the magnitude of the slope (%), and P is the support conservation practices factor.
Rainfall erosivity (R factor) was obtained based on the adapted universal equation of soil loss, defined by [46] as
R = e 0.834     P M E X   1.314 M R 0.388   F 24 0.563
where e represents the basis of the Napierian algorithms, PMEX is the average value of the annual series of maximum monthly rainfall (mm) using meteorological stations of Andalusia Government, MR is the average precipitation of the period (mm), and F24 is the ratio between the annual maximum 24 h rainfall squared and the sum of the maximum 24 h rainfall of all months of the same year.
The soil erodibility (K factor) was based on soil properties that were measured directly at each field site and was calculated according to [47]
K = [ 2.1 10 4 ( 12 O M ) M 1.14 + 3.25 ( b 2 ) + 2.5 ( c 3 ) ]
where OM is the percentage of the organic matter. M represents the textural factor expressed by the product of the percentage fractions of sand, clay, and silt. The nomogram value of the factor K [47] was used to determine the soil structure and permeability classes, parameters b and c, respectively.
C-factor values are based on the concept of deviation from a standard plot under clean-tilled continuous fallow. Therefore, factor C varies with the type of management depending on tree density and canopy diameter, and with the extent (width) of ground cover (partial in NT-CC and minimum in CT and NT + H management types). For the calculation of the sub-factors, a canopy with a uniform tree spacing of 12 × 12 m that was 3 m high and 6 m in diameter was considered.
To calibrate the LS topographic factor, we used the length and grade of the slope of the territory. These parameters were measured with a manual inclinometer and with measuring tape in the study area. The LS factor was considered constant throughout the simulated period using expressions of [48], indicated in the RUSLE documentation.
Finally, the P factor was considered to be equal to 1 for all erosion situations, as it was assumed that all plots were subject to tillage practices and that none were subject to specific mechanical or soil manipulation erosion control practices.

2.4. Calculation of Soil Productivity from the Soil Profile Samples

Productivity index (PI) was used to assess the long-term influence of management practices and erosion processes in soil productivity. Pierce et al. (1983) suggested 100 cm as a suitable soil thickness for the growth of crops. In our case study, three soil horizons were used (Ap, Bw, and BC), around 100 cm, to evaluate the PI. We calculated the PI of each soil profile using [49]
P I = i = 1 3 A i     C i     D i     O i     W F i
where PI is the productivity index (0–1), Ai is the sufficiency of AWC, Ci is the sufficiency of bulk density, Di is the sufficiency of pH, Oi is the sufficiency of organic matter at the ith soil layer, and WFi is a weighting factor representing an idealized plant root distribution reflecting that different soil layers have different impacts on soil productivity. The sufficiency function of Ai, Ci, and Di is the same as noted in [50], and the sufficiency function of Oi is as noted in [26]. WFi was calculated in accordance with [50] as follows:
W F = 0.35 0.152 l g ( d e p h t + d e p t h 2 + 6.45 )
where depth indicates the soil depth within the profile. According to Karlen (2005), within this index, sufficiency is defined as levels that do not restrict plant growth or development throughout the life cycle of the species for which the assessment is being made. The sufficiency values for the soil properties (Table 1) were adapted and used as described in [50,51,52].

2.5. Statistical Analyses

The effect of land management and depth on soil properties was analysed using ANOVA (SPSS 13.0 for Windows). Data were tested for normality to verify the model assumptions, and differences of p < 0.05 were considered statistically significant.

3. Results

3.1. Pore Size Distribution and Soil Water Retention
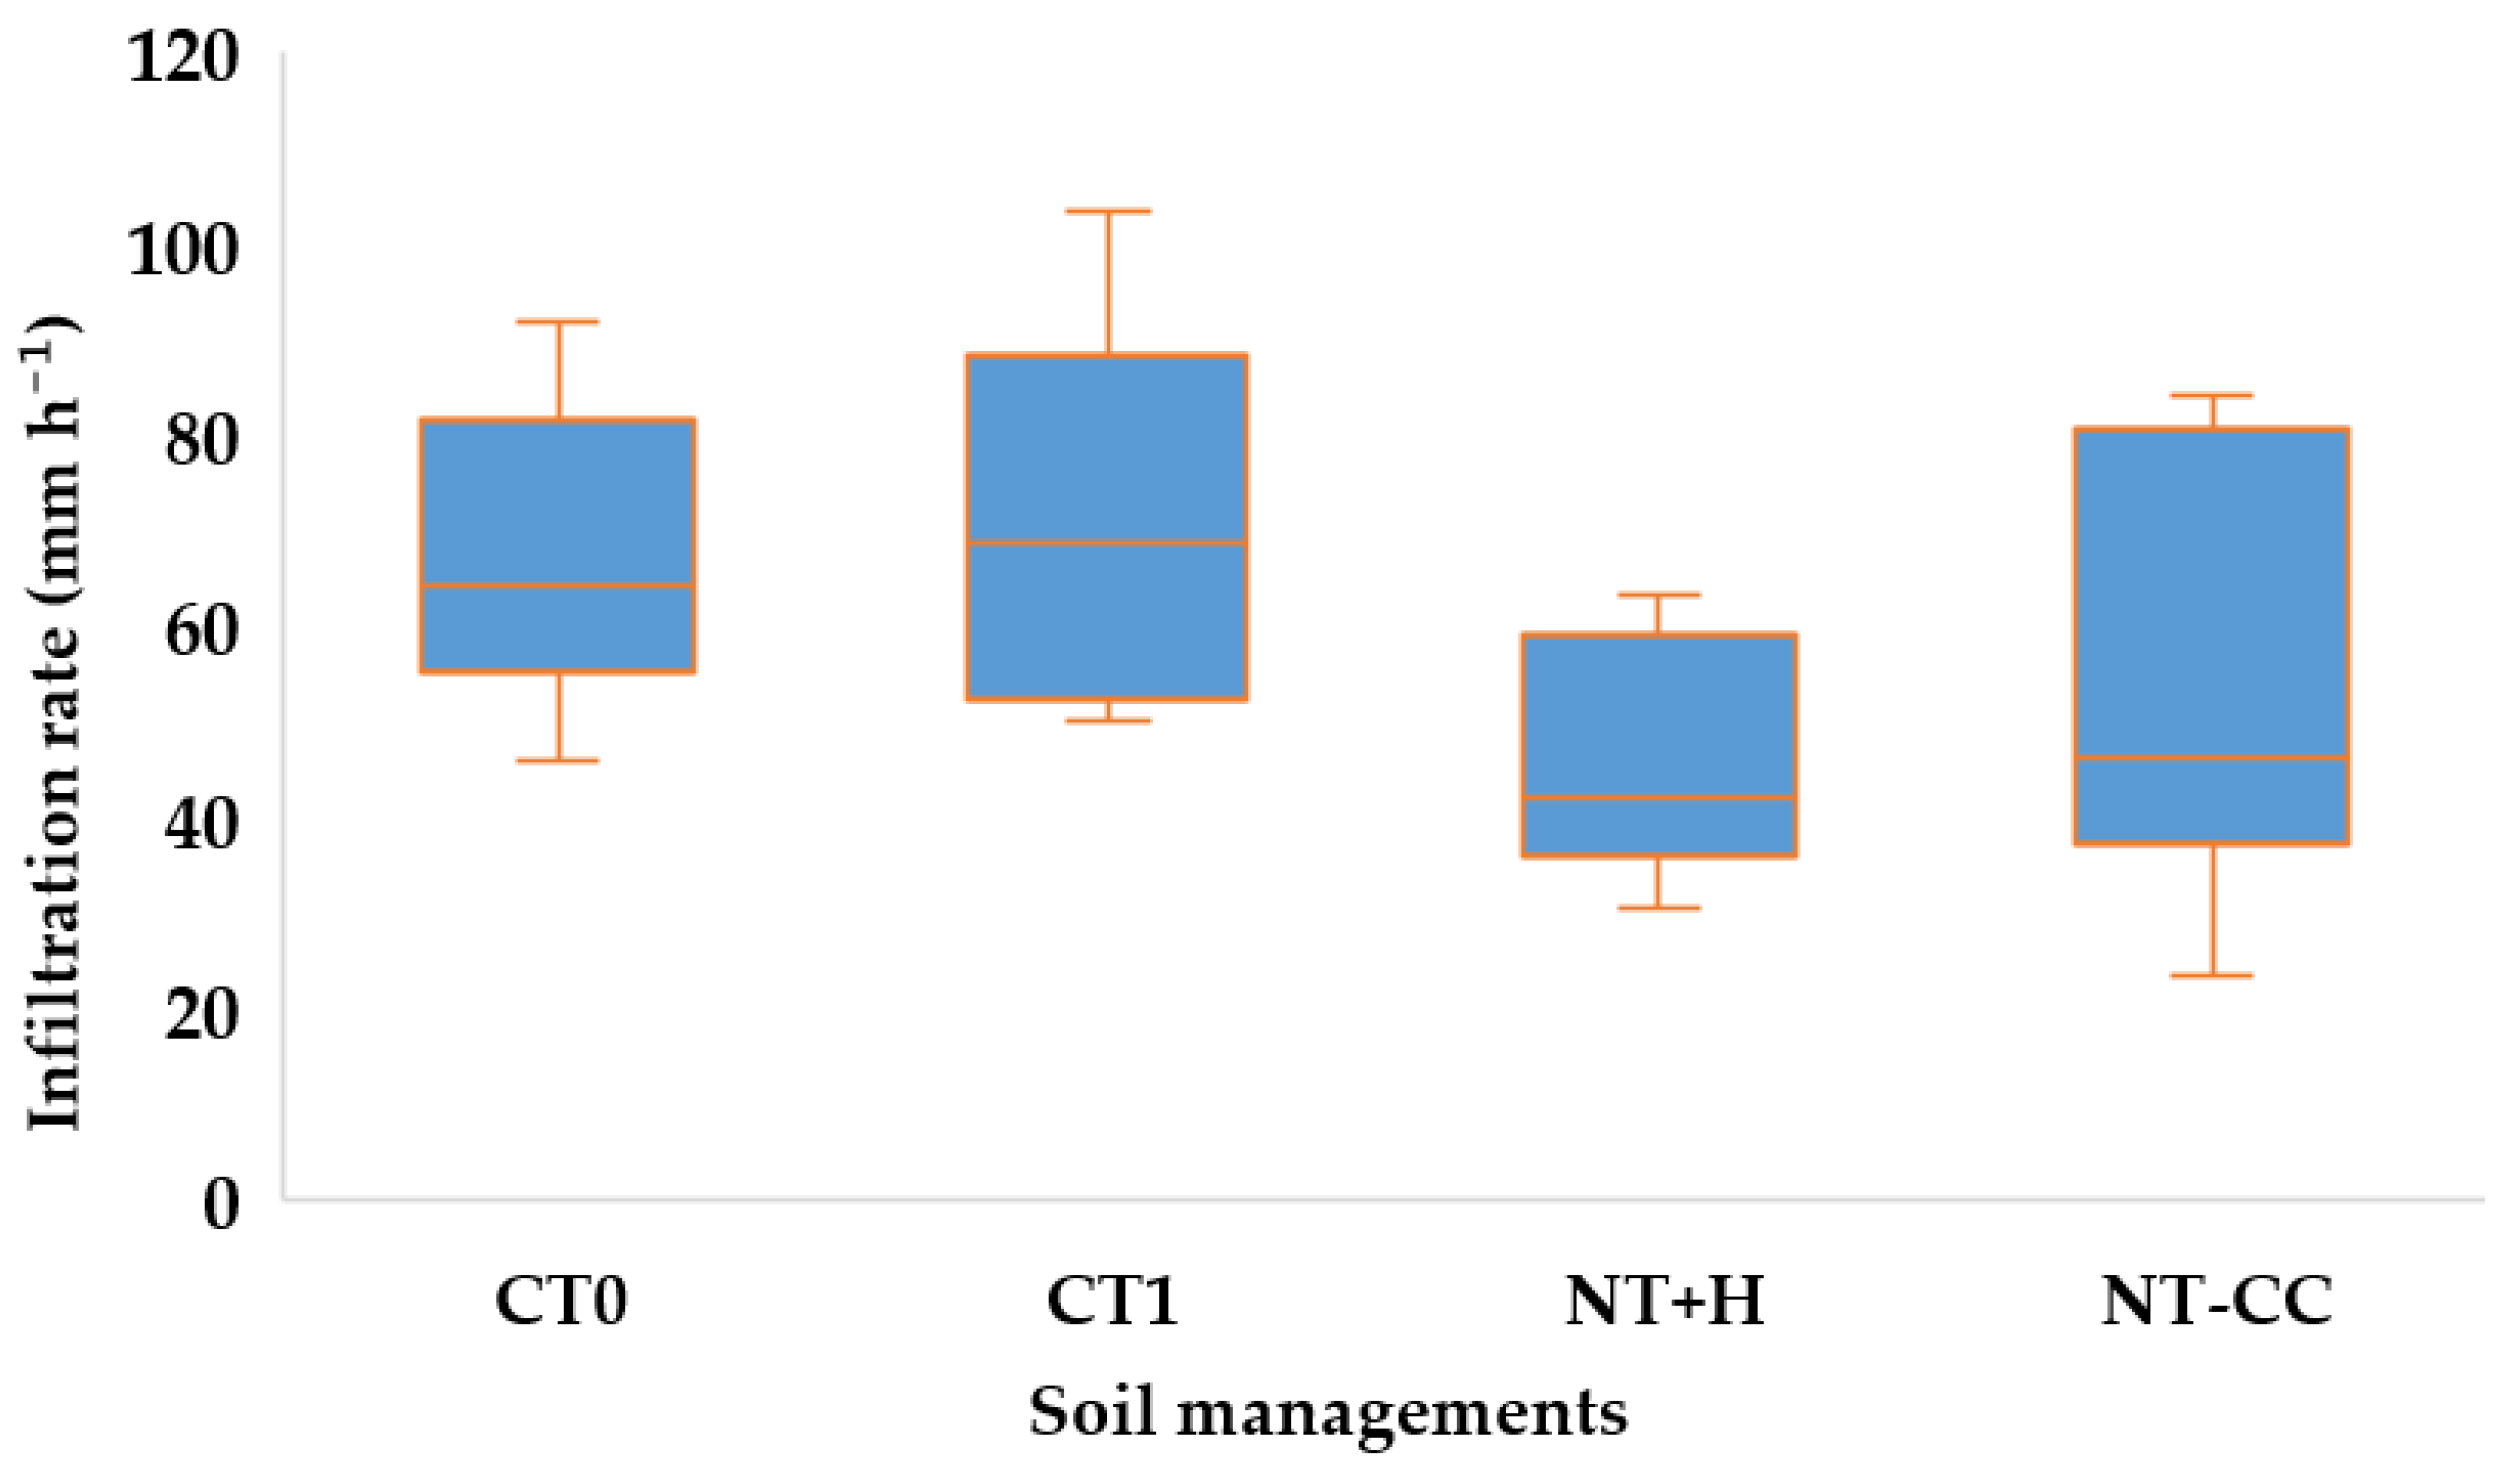
Macro, microporosity, and total porosity (TP) along the complete soil profiles of the different soil management systems are shown in Table 2. TP values ranged between 0.47 and 0.42 m3 m−3, with no significant variations in management systems, with the exception of the A horizon in NT-CC, where the TP reached 0.51. In all soil profiles, the highest values were found in the Bw horizon, except in NT-CC, where a higher value was found in the surface horizon, as mentioned before. In CT0 and CT1, there were no differences in the macroporosity or the microporosity between horizons in the soil profiles. Regarding the NT management systems (NT + H and NT-CC), the highest macroporosity values were found in the two first horizons (Ap and Bw), while the highest microporosity values were found in the two deep horizons (BC or C). The main variations were found under NT-CC management, where the highest macroporosity values (0.316 m3 m−3), as in the rest of the management systems, were obtained in the A horizon, but the decrease in depth was greater, and the difference between the soil surface horizons and the deeper horizons was more important. Furthermore, in the surface horizon in NT-CC, the lowest microporosity value was found (0.190 m3 m−3).
The soil water retention properties in olive grove soils from the periods and management systems studied are reported in Table 2. The values were quite similar to the initial situation (CT 0) after 15 years under continuous tillage (CT1) and, in 2019, after the establishment of covers and eliminating the tillage (NT-CC). However, the main modification observed was the decrease in the PWP in NT + H management regarding CT0 and CT1 in all horizons (Table 2), with values in the Bw and BC horizons of less than 50%. A similar trend was found in FC values, which, in NT + H management, were around 4% lower in the A horizon and 9% lower in the Bw and BC horizons regarding CT0 and CT1 (42.7 and 42.8%, respectively). With respect to NT-CC management, similar PWP and FC values were obtained compared to CT0 and CT1.
The available water content (AWC) values ranged between 1.64 and 2.02 mm cm−1 under the examined management practices and depths (Table 2). All management systems obtained greater values in the subsuperficial horizons, except for CT0, where all values were very similar. Considering the same management (CT), there was a decrease in AWC values over time (CT1 < CT0). Differences between management practices were observed with a significant decrease in AWC under NT-CC management regarding the initial situation in the first horizon (1.64 mm cm−1). Similar values to CT1 were also observed. There was an increase in AWC values in the BC horizon under NT + H (2.02 mm cm−1).

3.2. Infiltration

Infiltration rates under the different soil management systems varied from 45 to 71 mm h−1 (Figure 2). According to USDA (2001), these soils have a moderate infiltration level. Between the different treatments, infiltration rates followed the order CT0 = CT1 > NT-CC = NT + H, with significant differences among tilled and non-tilled plots. The lowest infiltration values were observed under no tillage management systems, NT + H and NT-CC, with 45 and 53 mm h−1, respectively. On the other hand, under tillage (CT0 and CT1), the highest infiltration values were recorded: respectively, 67 and 71 mm h−1. According to these data, the change from tillage to no tillage plus herbicides and no tillage with coverage resulted in a decrease in the infiltration capacity of the analysed soils of 33% after 15 years and 25% after two years, respectively.

3.3. Soil Erodibility and Soil Loss Estimation

Soil erodibility, the K factor from the RUSLE equation, which characterizes both the vulnerability of soil to erosion and the rate of runoff, was calculated to model the erodibility of soils from different research stages and soil management practices entering the field data collected into the formula. The K factor showed no significant differences; it ranged from 0.0200 to 0.0250 t ha h ha−1 MJ−1 mm−1 (Table 3). Rain erosivity (R factor) and the length and grade of the slope (LS factor) in the study area were similar under the different management systems and were established at 89 J ha−1 and 7%, respectively. Factor C varied with the type of management; it had a value of 0.16 in NT-CC management but was 0.78 in bare soil management systems due to the tree spacing (12 × 12 m), which allows a large amount of soil to remain uncovered. Factor P was considered to be equal to 1 for all erosion situations, as it was assumed that all plots were subject to tillage practices and that none were subject to specific mechanical or soil manipulation erosion control practices.
The soil erosion rates recorded in this study using the RUSLE equation reached 9.71 Mg ha−1 year−1 under CT0, and similar value was obtained maintaining the same management 15 years later (CT1: 9.82 Mg ha−1 year−1). The highest soil loss estimation was found under NT + H management with 13.88 Mg ha−1 year−1, and the lowest values were estimated under NT-CC treatment with 2.06 Mg ha−1 year−1 (Table 3).

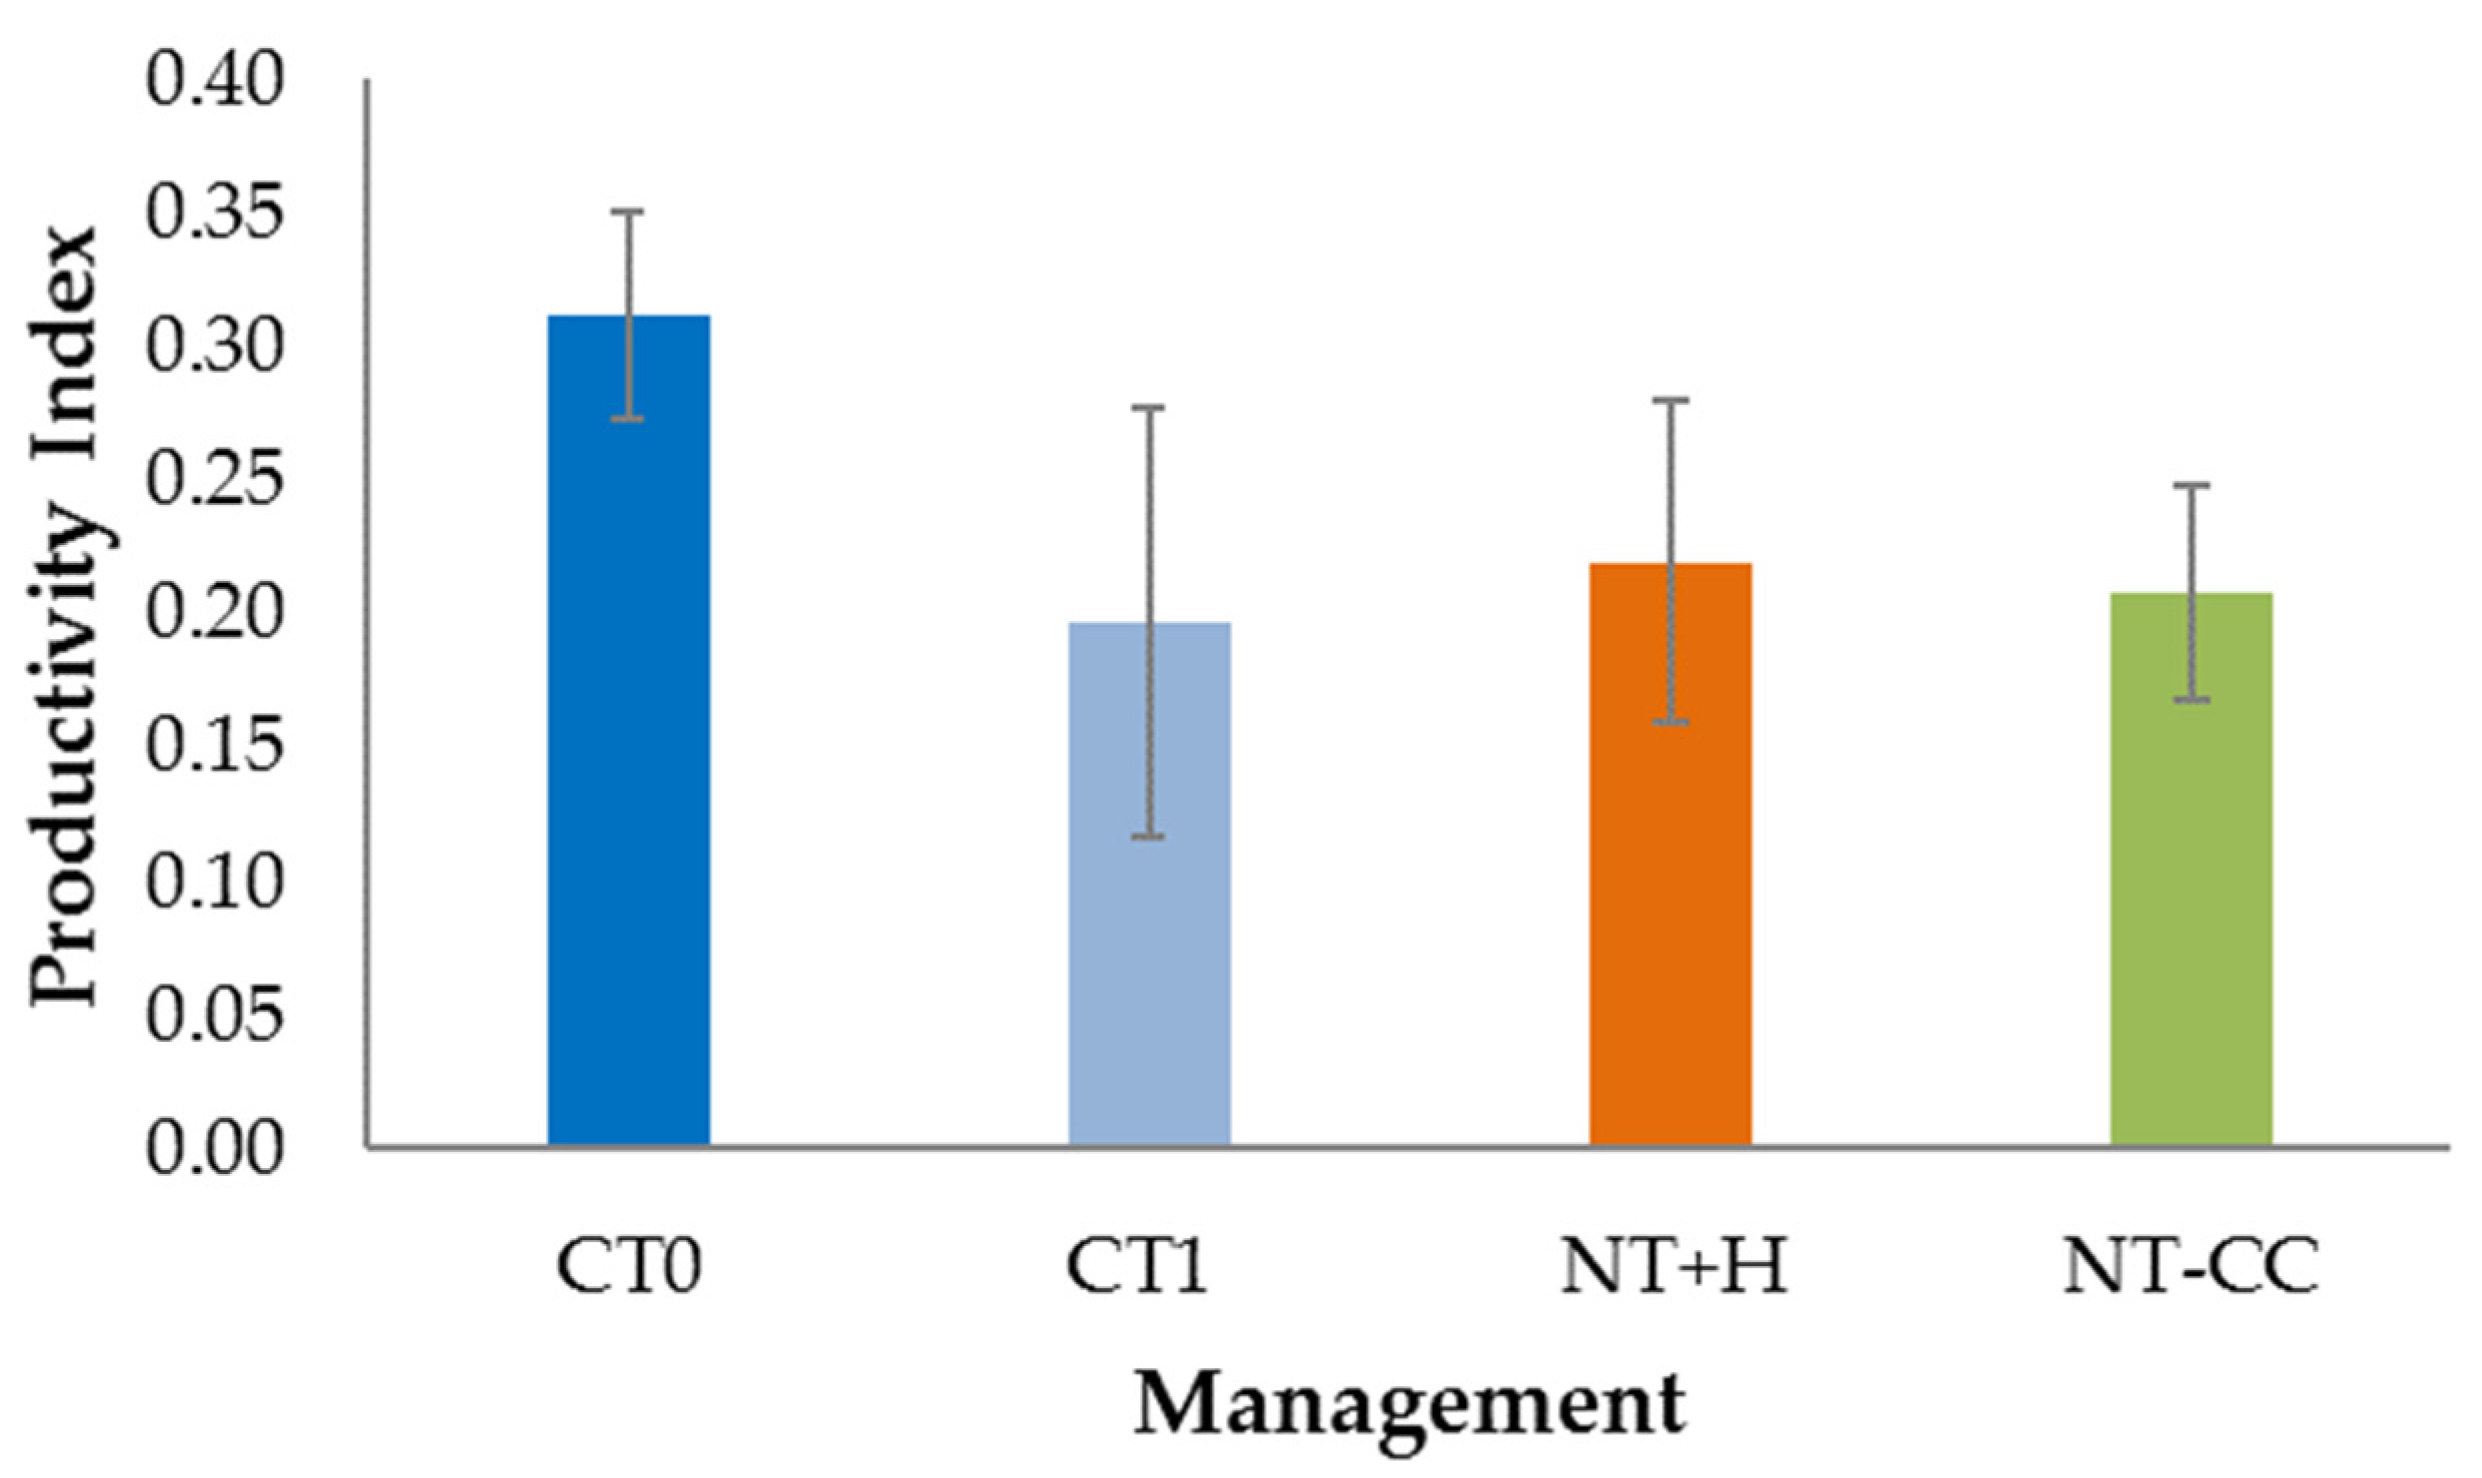
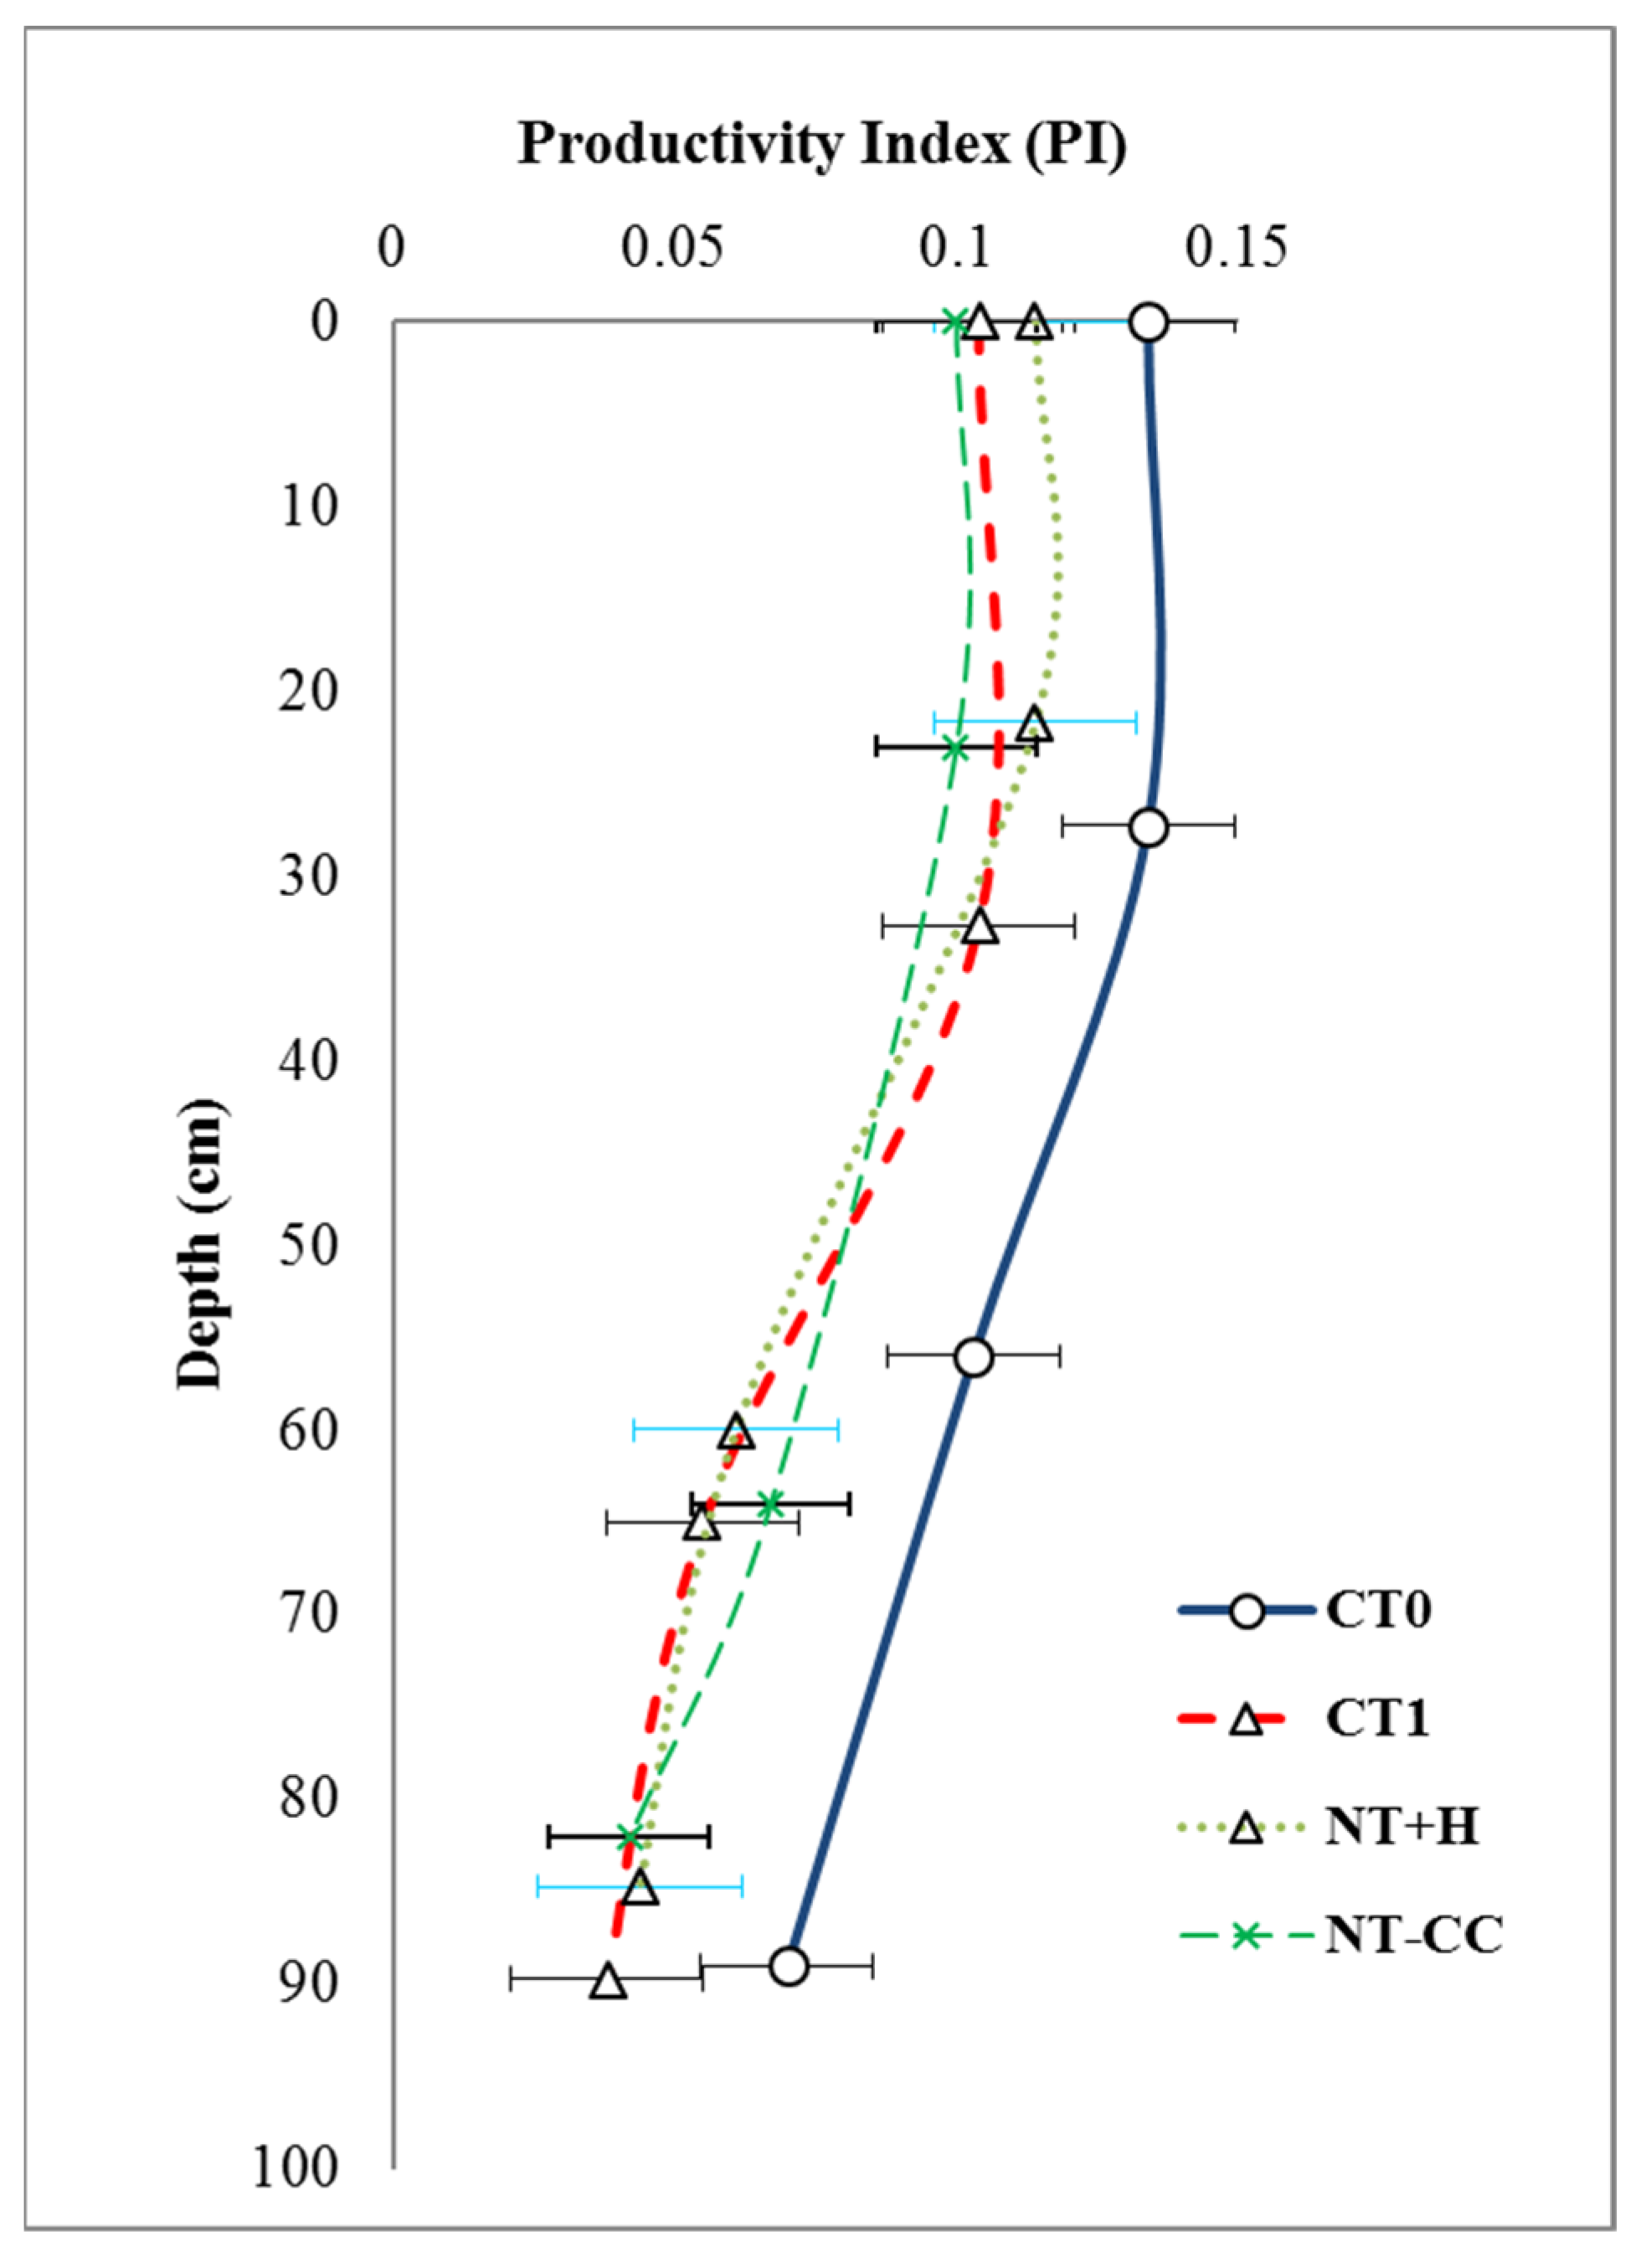
3.4. Soil Productivity Index

The parameters determining soil productivity were calculated from the field data collected. Subsequently, the soil PI for each soil horizon was determined by applying the described equations, and the PI for the complete profile was the sum of all the soil horizons. PI values ranged from 0.20 to 0.31 in the profiles of the experimental plots (Figure 3), with an average of 0.23. In concordance with the classification of [49], these values indicate a low productivity in the analysed olive grove soils. Greater values were obtained in the initial stage of the experiment (CT0), but there was a decline in the PI index in CT1 and NT + H after 15 years of management, reaching 0.19 in CT1 and 0.22 in NT + H, which represents decreases of 35.5% and 29%, respectively. Under NT-CC management, a trend change was observed for two years after conversion from CT1 to NT-CC management. A slight increase (13.6%) in the PI (0.21) was detected with regard to CT1.
In relation to PI variation across the opened soil profiles, registered data revealed that the PI was significantly reduced as the soil depth increased (Figure 4). The greatest soil PI was found in the superficial horizon under different soil management systems, ranging between 0.13 (CT0) to 0.10 (NT + H). PI values below 30 cm remained at less than 0.1 in all the deepest horizons under the analysed management systems. In the BW horizon, the values remained at intermediate levels between the upper and lower horizons. In this horizon, the highest PI values were recorded under CT0 (0.10).

4. Discussion

4.1. Changes in Soil Physical Properties and Water Infiltration

In order to assess the long-term impact of management practices in the evolution of the soil environment, it is essential to quantify the changes in soil structure. In this sense, soil porosity is a useful indicator of changes caused by soil management systems, since porosity has a great influence on water dynamics into the soil and biota habitat. In the study area, the most important modification related to soil structure was the improvement in soil porosity in the superficial horizon under NT-CC. This change was clearly caused by no tillage and the existence of natural vegetation ground cover. A similar trend was described in [53]. Therefore, although the macroporosity of soil was rather low, NT-CC improved the soil structure quality, while the remaining management systems preserved similar values, with no appreciable variation between CT0, CT1, and NT + H.
The clayey soils of the study area not only had a high FC but also a high PWP. Therefore, the most highlighted parameter was the AWC (difference between FC and PWP). In soils with a clay content greater than 40–50%, the PWP increases more than the FC, so the AWC decreases with increasing clay content. In the soils of the study area with clay contents close to 70%, the available water was rather low. Nevertheless, management practices impacted soil physical properties. CT1 and NT-CC registered the lowest values in the superficial horizon in AWC (1.70 and 1.64 mm cm−1, respectively), while similar values were observed under NT + H compared with the initial situation (CT0). This trend was also observed in other studies under semiarid conditions [54]. Based on these results, it seems that, in the establishment of vegetation cover in rainfed olive trees under Mediterranean conditions, it is essential that the vegetation cover be controlled during the drought season so that it remains as a mulch to keep the soil covered and does not continue to extract water resources. In this sense, olive grove soil mulching can be another practice used for reducing surface erosion and enhancing water conservation into the soil [55,56,57].
In the subsurface horizons, AWC values were quite similar between the analysed management systems, except in CT1, where they were the lowest (1.67 mm cm−1). This is an important aspect in the growth and productivity of olive groves, since olive tree roots penetrate to this depth and the Bw horizon has become an important water reservoir that accumulates humidity and stores water in dry months.
In the experimental plots, the infiltration rate was, on average, 59 mm h−1, which is in line with that reported in [58] regarding clayey olive grove soil in Southern Italy. An important aspect of soil degradation was visually identified mainly in NT + H treatment, namely crust formation (not measured in this study), which should affect water infiltration dynamics and increase erosion, also registered in other semiarid Mediterranean cultivated areas [59,60]. Breaking this crust is one of the main reasons why Andalusian farmers manage olive grove soil with conventional tillage. The other reason is to avoid water competition between covers and olive trees. However, farmers are becoming aware of the negative aspects that tillage has caused in soils in recent years. NT + H is now an option. However, in our study, the lowest infiltration rates were found in NT + H (45 mm h−1), while conventional tillage (CT0 and CT1) showed the highest infiltration values, 71 and 67 mm h−1, respectively, in the analysed period. NT-CC obtained intermediate values (53 mm h−1) with a significant decrease in a relatively short period of time (two years). A similar trend was also reported in [61], two years after the inclusion of spontaneous cover under Cambisols.
The infiltration capacity decline after tillage elimination (land management change from CT to NT) is a serious issue since it involves an increase in the degree of runoff generation and, therefore, enhances vulnerability to water erosion in these soils [61,62,63]. This is especially critical when the soil is bare, as in the case of NT + H management, or the percentage of vegetation coverage is low (<20%), especially in degraded areas where soil recovery is a slow process [64,65]. Since NT-CC management has been widely identified as a sustainable practice that increases organic matter (OM) [66,67,68], it is expected that an increase in OM levels can increase infiltration levels [69,70]. However, a longer period of time is needed to observe these effects, because changes in soil properties under semiarid rainfed conditions are quite slow. The first few years of cover crop installation are critical and do not always lead to positive results.

4.2. Effect of Soil Management Practices on Soil Erosion Rates

The RUSLE methodology has been widely used to estimate soil losses in agricultural areas. In this case study, RUSLE was used for the long-term analysis of the distribution of water erosion, since in olive groves it has been shown to be a useful method for the study of temporary changes related to soil management and properties [15]. Several authors have clearly indicated the significant potential for erosion in olive orchards [71,72]. According to [73], erosion rates above 5–10 Mg ha−1 year−1 are estimated to be unsustainable.
In the studied olive grove plots, the average annual soil loss ranged between 2.06 and 13.88 Mg ha−1 year−1, which was estimated from field measurements in the olive alleys. Our data showed soil lowering during the last 15 years. In this period of continuous soil loss, the variations observed are mainly related to the soil management.
In this sense, NT + H obtained the highest erosion rates (13.88 Mg ha−1 year−1). Under this soil management system, herbicide applications contribute to bare soils, and the absence of tillage caused a decrease in the infiltration rate (Figure 2); as a consequence, erosion occurs at a faster rate, as has been registered in other studies on olive groves [74,75] and studies on woody crops in the Mediterranean areas, e.g., apricots [76], vineyard [77], and citrus [71], under a no tillage system. RUSLE did not show considerably different soil erosion rates between CT0 and CT1, with 9.71 Mg ha−1 year−1 and 9.82 Mg ha−1 year−1, respectively. These data show that, in the study area, there was a long period of erosion under CT management (2004–2019) and that the NT + H land management change, rather than reducing erosion values, increased soil losses.
In Andalusian olive groves, the use of the RUSLE and direct measurements have shown contrasting responses. In general, field measurements report lower values of erosion. Rates of soil loss of 12.5 Mg ha−1 year−1 have been estimated in olive plots in Córdoba (Spain) [78]. In the same province, average soil losses on a heavy clay soil of 8.5, 1.2 and 4.0 t ha−1 year−1 from NT + H, NT-CC, and CT management systems, respectively, were reported [76]. In Sevilla, the authors of [79] found the maximum soil loss in CT (19.4 Mg ha−1 year−1) compared to cover crop management (0.4 Mg ha−1 year−1), while in Granada province, the authors of [80] associated the highest losses due to no tillage systems with bare soil (17.4 Mg ha−1 year−1), compared to spontaneous cover (7.1 Mg ha−1 year−1) and barley sown cover (5.0 Mg ha−1 year−1). On the other hand, the application of RUSLE methodology tends to overestimate soil losses [81,82], generally by obtaining topographic data through a digital dataset [83]. In this sense, the authors of [84] estimated considerably higher soil losses in the Jaen province at 32 Mg ha−1 year−1. However, the results obtained in this study with the RUSLE model did not show great differences regarding other research works developed in olive groves under direct measurements.
The inclusion of the NT + CC system in the olive grove plot had a significant impact on estimated soil erosion (2.06 Mg ha−1 year−1) and showed rates approximately seven and five times lower than in the NT + H and CT plots, respectively. The introduction of vegetation cover in the olive grove alleys combined with NT land management has been demonstrated to be the most effective method to reduce soil erosion rates [61,85,86,87]. Our results for the soil loss under NT-CC management were close to those measured in [88] in an olive micro-catchment under NT treatment with a spontaneous vegetation cover in vertic soil (1.8 ± 2.3 t ha−1 year−1) and in [89] with Hordeum vulgare L., barley (2.74 t ha−1 year−1) under semiarid Mediterranean conditions.
On the other hand, although the vegetation coverage in this study was spontaneous grass, the authors of [90,91] describe the benefits in erosion rate control, derived from the use of leguminous and cruciferous cover crops.

4.3. Soil Productivity Index Changes under Analysed Management Practices

Despite unsustainable management and prolonged erosion rates under conventional management systems, there is no vision of danger among many farmers because there is generally no correlation between soil erosion rates and olive yield [15]. However, in the study area, the long-term productivity of olive orchard soils had been significantly reduced. In this way, at the beginning of the research period (2004), the analysed soils presented PI values of 0.31, but after 15 years, the soils showed a PI of 0.19 under CT1, 0.22 in NT + H, and 0.21 in NT + CC. According to these data, under the management practices described in this work, an important PI reduction was found with an annual loss of productivity of 3.2% on average. The main factor in this reduction in soil productivity may be the significant erosion rates observed over the long period in CT and NT + H management. Soil erosion has been detected as the most important reason for soil productivity reduction in olive groves [16] and in other cultivated lands [92,93], although there may be other factors of considerable importance in soil degradation and low productivity, such as compaction, low levels of OM, high clay content, and low AWC, linked to erosive processes that influence the productivity loss of olive grove soils.
The productivity decline of agricultural soils has been identified on several occasions as one of the most important consequences of unsustainable management practices [94,95]. Moreover, the loss of productivity resulting from soil degradation is a global problem of considerable dimension that can compromise the food security objective (SDG 2) of the Sustainable Development Goals (SDGs) of the United Nations or Agenda 2030 [96]. This is under a climate change context, where a reduction in Mediterranean agricultural yields is expected [97], including in olive groves [98,99,100]. Therefore, adaptation measures are required to ensure the sustainability of the olive sector [17,101,102,103].
In this sense, the PI value obtained under NT-CC management (0.21) represents an intermediate rate between CT1 and NT + H treatments, but it involved a slight increase and a change in trend after two years of management change from CT. This change in PI dynamics may be related to a reduction in erosion rates due to the increase in vegetation cover. However, since only a short period of time has passed since the implementation of the cover, more control and observation must be carried out in the following years to consider changes in specific soil properties and the response of crops to these factors.

5. Conclusions

After 15 years of land management under CT, the continuous erosion process estimated in this plot caused a decrease in the soil quality, which was demonstrated by a decrease in soil productivity and high soil erosion rates, although CT1 obtained the highest infiltration capacity and maintained similar values to the initial situation (CT0). The management change to NT + H led to increased soil erosion rates, decreased infiltration capacity, and soil productivity. Therefore, these bare soils are vulnerable to erosion and need protection. Consequently, NT-CC seems to be the most suitable option for this purpose as NT-CC considerably reduced erosion rates and increased PI values. However, tillage removal and vegetation cover inclusion in degraded olive grove soils under semiarid conditions resulted in a reduction in infiltration rates, which could cause a decline in soil water availability and thus affect olive crop yields in an area with low rainfall levels. At this point, further studies should be implemented in relation to cover crops and water storage in semiarid environments.
PI was useful in assessing the effect of management practices on soil productivity. In this regard, with the inclusion of NT-CC management, we are facing a trend change in the physical and productive properties of the analysed soils because of the installation of vegetation coverage. However, this possible process of change towards an increase in soil quality and the capacity to provide ecosystem services is an incipient stage (only two years since its installation), so it is necessary to continue evaluating the evolution of this management in the olive grove and to take care of the aspects that may affect the yield of the main crop, such as water storage and competition with the vegetation cover.
The European Green Deal and CAP reform promote sustainable soil management and environmental conditions. Erosion prevention and the maintenance of soil productivity through increased soil cover and lower tillage disturbance are among the most effective practices. Therefore, it is essential that olive groves adapt in a generalized way to these strategies of soil management that aim to mitigate the climate change effects.

Author Contributions

Conceptualization, L.P.-A. and B.L.-G.; methodology, B.L.-G., L.P.-A., J.A.-H. and M.G.-R.; validation, B.L.-G., L.P.-A. and M.G.-R.; formal analysis, B.L.-G. and L.P.-A.; investigation, L.P.-A., B.L.-G., J.A.-H. and M.G.-R.; resources, B.L.-G. and L.P.-A.; data curation, M.G.-R.; writing—original draft preparation, M.G.-R.; writing—review and editing, M.G.-R., B.L.-G. and L.P.-A.; visualization, B.L.-G. and L.P.-A.; supervision, B.L.-G. and L.P.-A.; project administration, B.L.-G. and L.P.-A.; funding acquisition, B.L.-G. and L.P.-A. All authors have read and agreed to the published version of the manuscript.

Funding

This research was funded by The European Commission Horizon 2020 project Diverfarming (crop diversification and low-input farming cross Europe: from practitioners’ engagement and ecosystems services to increased revenues and value chain organisation), grant agreement 728003.

Informed Consent Statement

Informed consent was obtained from all subjects involved in the study.

Data Availability Statement

Data sharing not applicable.

Acknowledgments

We are grateful for the help of the farmer Antonio Parras Rosa in the field work and in the transfer of the experimental farm.

Conflicts of Interest

The authors declare no conflict of interest.

References

  1. Cavigelli, M.A.; Mirsky, S.B.; Teasdale, J.R.; Spargo, J.T.; Doran, J. Organic grain cropping systems to enhance ecosystem services. Renew. Agric. Food Syst. 2013, 28, 145–159. [Google Scholar] [CrossRef]
  2. Bünemann, E.K.; Bongiorno, G.; Bai, Z.G.; de Goede, R.; Mäder, P.; Sukkel, W.; Brussaard, L. Soil quality—A review. Soil Biol. Biochem. 2018, 120, 105–125. [Google Scholar] [CrossRef]
  3. Lozano-García, B.; Francaviglia, R.; Renzi, G.; Doro, L.; Ledda, L.; Benítez, C.; González-Rosado, M.; Parras-Alcántara, L. Land use change effects on soil organic carbon store. An opportunity to soils regeneration in Mediterranean areas: Implications in the 4p1000 notion. Ecol. Indic. 2020, 119, 106831. [Google Scholar] [CrossRef]
  4. Martín-López, B.; Oteros-Rozas, E.; Cohen-Sacham, E.; Santos-Martín, F.; Nieto-Romero, M.; Carvalho-Santos, C.; González, J.; García-Llorente, M.; Keren, K.; Geijzendorffer, I.; et al. Ecosystem services supplied by mediterranean basin ecosystems. In Routledge Handbook of Ecosysem Services; Potschin, M., Haines-Young, R., Fish, R., Turner, R.K., Eds.; Routledge: New York, NY, USA, 2016; pp. 405–414. [Google Scholar]
  5. Morugán-Coronado, A.; Linares, C.; Gómez-López, M.D.; Faz, Á.; Zornoza, R. The impact of intercropping, tillage and fertilizer type on soil and crop yield in fruit orchards under Mediterranean conditions: A meta-analysis of field studies. Agric. Syst. 2020, 178, 102736. [Google Scholar] [CrossRef]
  6. Lee, H.; Lautenbach, S.; Nieto, A.P.G.; Bondeau, A.; Cramer, W.; Geijzendorffer, I.R. The impact of conservation farming practices on Mediterranean agro-ecosystem services provisioning—A meta-analysis. Reg. Environ. Chang. 2019, 19, 2187–2202. [Google Scholar] [CrossRef]
  7. Comino, J.R.; Senciales, J.; Ramos, M.; Martínez-Casasnovas, J.; Lasanta, T.; Brevik, E.; Ries, J.; Sinoga, J.R. Understanding soil erosion processes in Mediterranean sloping vineyards (Montes de Málaga, Spain). Geoderma 2017, 296, 47–59. [Google Scholar] [CrossRef] [Green Version]
  8. Martínez-Mena, M.; Carrillo-López, E.; Boix-Fayos, C.; Almagro, M.; Franco, N.G.; Díaz-Pereira, E.; Montoya, I.; De Vente, J. Long-term effectiveness of sustainable land management practices to control runoff, soil erosion, and nutrient loss and the role of rainfall intensity in Mediterranean rainfed agroecosystems. Catena 2020, 187, 104352. [Google Scholar] [CrossRef]
  9. Cerdà, A.; Rodrigo-Comino, J. Is the hillslope position relevant for runoff and soil loss activation under high rainfall conditions in vineyards? Ecohydrol. Hydrobiol. 2020, 20, 59–72. [Google Scholar] [CrossRef]
  10. Montanaro, G.; Xiloyannis, C.; Nuzzo, V.; Dichio, B. Orchard management, soil organic carbon and ecosystem services in Mediterranean fruit tree crops. Sci. Hortic. 2017, 217, 92–101. [Google Scholar] [CrossRef]
  11. Novara, A.; Gristina, L.; Sala, G.; Galati, A.; Crescimanno, M.; Cerdà, A.; Badalamenti, E.; La Mantia, T. Agricultural land abandonment in Mediterranean environment provides ecosystem services via soil carbon sequestration. Sci. Total Environ. 2017, 576, 420–429. [Google Scholar] [CrossRef] [Green Version]
  12. Francaviglia, R.; Ledda, L.; Farina, R. Organic Carbon and Ecosystem Services in Agricultural Soils of the Mediterranean Basin. In Sustainable Agriculture Reviews; Springer: Cham, Switzerland, 2018; Volume 28, pp. 183–210. [Google Scholar] [CrossRef]
  13. FAOSTAT. 2017. Available online: http://faostat.fao.org/ (accessed on 24 October 2020).
  14. Infante-Amate, J.; Villa, I.; Aguilera, E.; Torremocha, E.; Guzmán, G.; Cid, A.; De Molina, M.G. The Making of Olive Landscapes in the South of Spain. A History of Continuous Expansion and Intensification. In Biocultural Diversity in Europe. Environmental History; Agnoletti, M., Emanueli, F., Eds.; Springer: Cham, Switzerland, 2016; Volume 5. [Google Scholar] [CrossRef]
  15. Vanwalleghem, T.; Amate, J.I.; de Molina, M.G.; Fernández, D.S.; Gómez, J.A. Quantifying the effect of historical soil man-agement on soil erosion rates in Mediterranean olive orchards. Agric. Ecosyst. Environ. 2011, 142, 341–351. [Google Scholar] [CrossRef]
  16. Rodríguez-Sousa, A.A.; Barandica, J.M.; Rescia, A.J. Estimation of Soil Loss Tolerance in Olive Groves as an Indicator of Sus-tainability: The Case of the Estepa Region (Andalusia, Spain). Agronomy 2019, 9, 785. [Google Scholar] [CrossRef] [Green Version]
  17. Michalopoulos, G.; Kasapi, K.A.; Koubouris, G.; Psarras, G.; Arampatzis, G.; Hatzigiannakis, E.; Kavvadias, V.; Xiloyannis, C.; Montanaro, G.; Malliaraki, S.; et al. Adaptation of Mediterranean Olive Groves to Climate Change through Sustainable Cultivation Practices. Climate 2020, 8, 54. [Google Scholar] [CrossRef] [Green Version]
  18. Carbonell-Bojollo, R.; Moreno-García, M.; Ordóñez-Fernández, R.; García-Tejero, I.F.; Cárceles-Rodríguez, B.; Durán-Zuazo, V.H.; De Torres, M.A.R.-R. Efficient Groundcovers in Mediterranean Olive Groves Under Changing Climate. In Resources Use Efficiency in Agriculture; Springer: Singapore, 2020; pp. 729–760. [Google Scholar] [CrossRef]
  19. MITECO. Informe 2017 Sobre el Estado del Patrimonio Natural y de la Biodiversidad en España. 2017. Available online: https://www.miteco.gob.es/es/biodiversidad/temas/inventarios-nacionales/inventario-espanol-patrimonio-natural-biodiv/informe-anual/Informe_2017_IEPNB.aspx (accessed on 10 January 2021).
  20. Panagos, P.; Meusburger, K.; Ballabio, C.; Borrelli, P.; Alewell, C. Soil erodibility in Europe: A high-resolution dataset based on LUCAS. Sci. Total Environ. 2014, 479–480, 189–200. [Google Scholar] [CrossRef] [PubMed]
  21. Borrelli, P.; Alewell, C.; Alvarez, P.; Anache, J.A.A.; Baartman, J.; Ballabio, C.; Bezak, N.; Biddoccu, M.; Cerdà, A.; Chalise, D.; et al. Soil erosion modelling: A global review and statistical analysis. Earth arXiv 2020, arXiv:10.31223/X5GS3T. [Google Scholar]
  22. Parras-Alcantara, L.; Lozano-Garcia, B.; Keesstra, S.; Cerda, A.; Brevik, E.C. Long-term effects of soil management on eco-system services and soil loss estimation in olive grove top soils. Sci. Total Environ. 2016, 571, 498–506. [Google Scholar] [CrossRef] [PubMed]
  23. Soriano, M.A.; Álvarez, S.; Landa, B.B.; Gómez, J.A. Soil properties in organic olive orchards following different weed man-agement in a rolling landscape of Andalusia, Spain. Renew. Agric. Food Syst. 2014, 29, 83–91. [Google Scholar] [CrossRef]
  24. Panagos, P.; Standardi, G.; Borrelli, P.; Lugato, E.; Montanarella, L.; Bosello, F. Cost of agricultural productivity loss due to soil erosion in the European Union: From direct cost evaluation approaches to the use of macroeconomic models. Land Degrad. Dev. 2018, 29, 471–484. [Google Scholar] [CrossRef]
  25. Mueller, L.; Schindler, U.; Mirschel, W.; Shepherd, T.G.; Ball, B.C.; Helming, K.; Rogasik, J.; Eulenstein, F.; Wiggering, H. Assessing the productivity function of soils. A review. Agron. Sustain. Dev. 2010, 30, 601–614. [Google Scholar] [CrossRef]
  26. Duan, X.; Xie, Y.; Ou, T.; Lu, H. Effects of soil erosion on long-term soil productivity in the black soil region of northeastern China. Catena 2011, 87, 268–275. [Google Scholar] [CrossRef]
  27. Beets, P.; Kimberley, M.; Garrett, L.; Paul, T.; Matson, A. Soil productivity drivers in New Zealand planted forests. For. Ecol. Manag. 2019, 449, 117480. [Google Scholar] [CrossRef]
  28. Lal, R. Food security impacts of the “4 per Thousand” initiative. Geoderma 2020, 374, 114427. [Google Scholar] [CrossRef]
  29. Durán-Zuazo, V.H.; Rodríguez, B.C.; García-Tejero, I.F.; Ruiz, B.G.; Cuadros, T.S. Benefits of organic olive rainfed systems to control soil erosion and runoff and improve soil health restoration. Agron. Sustain. Dev. 2020, 40, 41. [Google Scholar] [CrossRef]
  30. Lozano-García, B.; Muñoz-Rojas, M.; Parras-Alcántara, L. Climate and land use changes effects on soil organic carbon stocks in a Mediterranean semi-natural area. Sci. Total Environ. 2017, 579, 1249–1259. [Google Scholar] [CrossRef] [PubMed]
  31. Duval, M.E.; Martinez, J.M.; Galantini, J.A. Assessing soil quality indices based on soil organic carbon fractions in different long-term wheat systems under semiarid conditions. Soil Use Manag. 2019, 36, 71–82. [Google Scholar] [CrossRef]
  32. Six, J.; Elliott, E.; Paustian, K. Soil macroaggregate turnover and microaggregate formation: A mechanism for C sequestration under no-tillage agriculture. Soil Biol. Biochem. 2000, 32, 2099–2103. [Google Scholar] [CrossRef]
  33. Abid, M.; Lal, R. Tillage and drainage impact on soil quality. Aggregate stability, carbon and nitrogen pools. Soil Tillage Res. 2008, 100, 89–98. [Google Scholar] [CrossRef]
  34. González-Rosado, M.; Lozano-García, B.; Aguilera-Huertas, J.; Parras-Alcántara, L. Short-term effects of land management change linked to cover crop on soil organic carbon in Mediterranean olive grove hillsides. Sci. Total Environ. 2020, 744, 140683. [Google Scholar] [CrossRef]
  35. Sindelar, A.J.; Lamb, J.A.; Coulter, J.A. Short-Term Stover, Tillage, and Nitrogen Management Affect Near-Surface Soil Organic Matter. Soil Sci. Soc. Am. J. 2014, 79, 251–260. [Google Scholar] [CrossRef]
  36. González-Rosado, M.; Parras-Alcántara, L.; Aguilera-Huertas, J.; Benítez, C.; Lozano-García, B. Effects of land management change on soil aggregates and organic carbon in Mediterranean olive groves. Catena 2020, 195, 104840. [Google Scholar] [CrossRef]
  37. Moreno, B.; Garcia-Rodriguez, S.; Cañizares, R.; Castro, J.; Benítez, E. Rainfed olive farming in south-eastern Spain: Long-term effect of soil management on biological indicators of soil quality. Agric. Ecosyst. Environ. 2009, 131, 333–339. [Google Scholar] [CrossRef]
  38. Rodrigues, M.Â.; Ferreira, I.Q.; Freitas, S.L.; Pires, J.M.; Arrobas, M.P. Self-reseeding annual legumes for cover cropping in rainfed managed olive orchards. Span. J. Agric. Res. 2015, 13, e0302. [Google Scholar] [CrossRef]
  39. Rodríguez, P.C.R.; Durán, Z.V.H.; Francia, M.J.R.; Martín, P.F.J.; Moreno, M.F.; García, T.I.F. Organic olive farming in An-dalusia, Spain. A review. Agron. Sustain. Dev. 2018, 38, 20. [Google Scholar] [CrossRef] [Green Version]
  40. Food and Agriculture Organization Working Group WRB. World Reference Base for Soil Resources 2014, Update 2015: International Soil Classification System for Naming Soils and Creating Legends for Soil Maps; World Soil Resources Reports; FAO: Rome, Italy, 2015; No 106. [Google Scholar]
  41. González-Rosado, M.; Parras-Alcántara, L.; Aguilera-Huertas, J.; Lozano-García, B. Long-term evaluation of the initiative 4‰ under different soil management systems in Mediterranean olive groves. Sci. Total Environ. 2021, 758, 143591. [Google Scholar] [CrossRef] [PubMed]
  42. Richards, L.A. Pressure-Menbrana apparatus construction and use. Agric. Eng. 1941, 28, 451–454. [Google Scholar]
  43. Bienes, R.; Marques, M.J.; Sastre, B.; García-Díaz, A.; Ruiz-Colmenero, M. Eleven years after shrub vegetation revegetation in semiarid eroded soil. Influence in soil properties. Geoderma 2016, 273, 106–114. [Google Scholar] [CrossRef]
  44. Álvaro-Fuentes, J.; Lóczy, D.; Thiele-Bruhn, S.; Zornoza, R. Handbook of Plant and Soil Analysis for Agricultural Systems; Version 1.0. Zenodo; 2019; Available online: https://zenodo.org/record/2553445#.YGS18N9Lj3g (accessed on 31 March 2021). [CrossRef]
  45. Martínez-Mena, M.; Perez, M.; Almagro, M.; Garcia-Franco, N.; Díaz-Pereira, E. Long-term effects of sustainable management practices on soil properties and crop yields in rainfed Mediterranean almond agroecosystems. Eur. J. Agron. 2021, 123, 126207. [Google Scholar] [CrossRef]
  46. Renard, K.G.; Foster, G.R.; Weesies, G.A.; McCool, D.K.; Yoder, D.C. Predicting Soil Erosion by Water: A Guide to Conservation Planning with the Revised Universal Soil Loss Equation (RUSLE); U.S. Department of Agriculture Agricultural Handbook No. 703; USDA: Washington, DC, USA, 1997.
  47. Instituto para la Conservación de la Naturaleza (ICONA). Agresividad de la Lluvia en España—Valores del Factor R de la Ecuación Universal de Pérdidas de Suelo; MITECO: Madrid, Spain, 1988.
  48. Wischmeier, W.H.; Smith, D.D. Predicting Rainfall Erosion Losses: A Guide to Conservation Planning; U.S. Department of Agriculture: Washington, DC, USA, 1978.
  49. McCool, D.K.; Foster, G.R.; Mutchler, C.K.; Meyer, L.D. Revised Slope Length Factor for the Universal Soil Loss Equation. Trans. ASAE 1989, 32, 1571–1576. [Google Scholar] [CrossRef]
  50. Xingwu, D.; Li, R.; Guangli, Z.; Jinming, H.; Haiyan, F. Soil productivity in the Yunnan province: Spatial distribution and sustainable utilization. Soil Tillage Res. 2015, 147, 10–19. [Google Scholar] [CrossRef]
  51. Pierce, F.J.; Larson, W.E.; Dowdy, R.H.; Graham, W.A.P. Productivity of soils: Assessing long-term changes due to erosion. J. Soil Water Conserv. 1983, 38, 39–44. [Google Scholar]
  52. Kiniry, L.N.; Scrivner, C.L.; Keener, M.E. A Soil Productivity Index Based Upon Predicted Water Depletion and Root Growth; College of Agriculture, Agricultural Experiment Station, University of Missouri: Columbia, MO, USA, 1983. [Google Scholar]
  53. Gu, Z.; Xie, Y.; Gao, Y.; Ren, X.; Cheng, C.; Wang, S. Quantitative assessment of soil productivity and predicted impacts of water erosion in the black soil region of northeastern China. Sci. Total Environ. 2018, 637, 706–716. [Google Scholar] [CrossRef]
  54. Palese, A.M.; Vignozzi, N.; Celano, G.; Agnelli, A.; Pagliai, M.; Xiloyannis, C. Influence of soil management on soil physical characteristics and water storage in a mature rainfed olive orchard. Soil Tillage Res. 2014, 144, 96–109. [Google Scholar] [CrossRef]
  55. Bienes, R.; Marques, M.; Sastre, B.; García-Díaz, A.; Esparza, I.; Antón, O.; Navarrete, L.; Hernánz, J.; Sánchez-Girón, V.; Del Arco, M.S.; et al. Tracking Changes on Soil Structure and Organic Carbon Sequestration after 30 Years of Different Tillage and Management Practices. Agronomy 2021, 11, 291. [Google Scholar] [CrossRef]
  56. Bombino, G.; Denisi, P.; Gómez, J.A.; Zema, D.A. Mulching as best management practice to reduce surface runoff and erosion in steep clayey olive groves. Int. Soil Water Conserv. Res. 2020, 9, 26–36. [Google Scholar] [CrossRef]
  57. Rodrigo-Comino, J.; Giménez-Morera, A.; Panagos, P.; Pourghasemi, H.R.; Pulido, M.; Cerdà, A. The potential of straw mulch as a nature-based solution for soil erosion in olive plantation treated with glyphosate: A biophysical and socioeconomic as-sessment. Land Degrad. Dev. 2020, 31, 1877–1889. [Google Scholar] [CrossRef]
  58. Ozturkmen, A.; Ramazanoglu, E.; Almaca, A.; Çakmakli, M. Effect of intercropping on soil physical and chemical properties in an olive orchard. Appl. Ecol. Environ. Res. 2020, 18, 7783–7793. [Google Scholar] [CrossRef]
  59. Bombino, G.; Denisi, P.; Gómez, J.A.; Zema, D.A. Water Infiltration and Surface Runoff in Steep Clayey Soils of Olive Groves under Different Management Practices. Water 2019, 11, 240. [Google Scholar] [CrossRef] [Green Version]
  60. Castillo-Monroy, A.P.; Maestre, F.T.; Delgado-Baquerizo, M.; Gallardo, A. Biological soil crusts modulate nitrogen availability in semiarid ecosystems: Insights from a Mediterranean grassland. Plant. Soil 2010, 333, 21–34. [Google Scholar] [CrossRef]
  61. Rodrigo-Comino, J.; Taguas, E.; Seeger, M.; Ries, J.B. Quantification of soil and water losses in an extensive olive orchard catchment in Southern Spain. J. Hydrol. 2018, 556, 749–758. [Google Scholar] [CrossRef]
  62. Taguas, E.V.; Peña, A.; Ayuso, J.A.; Pérez, R.; Yuan, Y.; Giráldez, J.V. Rainfall variability and hydrological and erosive response of an olive tree microcatchment under no-tillage with a spontaneous grass cover in Spain. Earth Surf. Process. Landf. 2010, 35, 750–760. [Google Scholar] [CrossRef]
  63. Sastre, B.; Marques, M.J.; García-Díaz, A.; Bienes, R. Three years of management with cover crops protecting sloping olive groves soils, carbon and water effects on gypsiferous soil. Catena 2018, 171, 115–124. [Google Scholar] [CrossRef]
  64. Kairis, O.; Karavitis, C.; Kounalaki, A.; Salvati, L.; Kosmas, C. The effect of land management practices on soil erosion and land desertification in an olive grove. Soil Use Manag. 2013, 29, 597–606. [Google Scholar] [CrossRef]
  65. Acín-Carrera, G.; Marques, M.J.; Carral, P.; Alvarez, A.M.; Lopez, C.; Martin-Lopez, B.; González, J.A. Impacts of land-use intensity on soil organic carbon content, soil structure and water-holding capacity. Soil Use Manag. 2013, 29, 547–556. [Google Scholar] [CrossRef]
  66. López-Vicente, M.; Calvo-Seas, E.; Álvarez, S.; Cerdà, A. Effectiveness of cover crops to reduce loss of soil organic matter in a rainfed vineyard. Land 2020, 9, 230. [Google Scholar] [CrossRef]
  67. Márquez-García, F.; González-Sánchez, E.J.; Castro-García, S.; Ordóñez-Fernández, R. Improvement of soil carbon sink by cover crops in olive orchards under semiarid conditions. Influence of the type of soil and weed. Span. J. Agric. Res. 2013, 11, 335. [Google Scholar] [CrossRef]
  68. Kaye, J.P.; Quemada, M. Using cover crops to mitigate and adapt to climate change. A review. Agron. Sustain. Dev. 2017, 37, 4. [Google Scholar] [CrossRef]
  69. Novara, A.; Minacapilli, M.; Santoro, A.; Rodrigo-Comino, J.; Carrubba, A.; Sarno, M.; Gristina, L. Real cover crops contribu-tion to soil organic carbon sequestration in sloping vineyard. Sci. Total Environ. 2019, 652, 300–306. [Google Scholar] [CrossRef]
  70. Obalum, S.; Chibuike, G.; Peth, S.; Ouyang, Y. Soil organic matter as sole indicator of soil degradation. Environ. Monit. Assess. 2017, 189, 176. [Google Scholar] [CrossRef]
  71. Keesstra, S.; Rodrigo-Comino, J.; Novara, A.; Giménez-Morera, A.; Pulido, M.; Di Prima, S.; Cerdà, A. Straw mulch as a sustainable solution to decrease runoff and erosion in glyphosate-treated clementine plantations in Eastern Spain. An assessment using rainfall simulation experiments. Catena 2019, 174, 95–103. [Google Scholar] [CrossRef]
  72. Taguas, E.; Gomez, J.A. Vulnerability of olive orchards under the current CAP (Common Agricultural Policy) regulations on soil erosion: A study case in Southern Spain. Land Use Policy 2015, 42, 683–694. [Google Scholar] [CrossRef]
  73. Taguas, E.V.; Vanderlinden, K.; Pedrera-Parrilla, A.; Giráldez, J.V.; Gómez, J.A. Spatial and temporal variability of spontaneous grass cover and its influence on sediment losses in an extensive olive orchard catchment. Catena 2017, 157, 58–66. [Google Scholar] [CrossRef]
  74. Panagos, P.; Borrelli, P.; Poesen, J.; Ballabio, C.; Lugato, E.; Meusburger, K.; Montanarella, L.; Alewell, C. The new assessment of soil loss by water erosion in Europe. Environ. Sci. Policy 2015, 54, 438–447. [Google Scholar] [CrossRef]
  75. Francia, A.; Durán-Zuazo, V.; Martínez, A. Environmental impact from mountainous olive orchards under different soil-management systems (SE Spain). Sci. Total Environ. 2006, 358, 46–60. [Google Scholar] [CrossRef]
  76. Gómez, J.A.; Romero, P.; Giráldez, J.V.; Fereres, E. Experimental assessment of runoff and soil erosion in an olive grove on a Vertic soil in Southern Spain as affected by soil management. Soil Use Manag. 2004, 20, 426–431. [Google Scholar] [CrossRef]
  77. Keesstra, S.; Pereira, P.; Novara, A.; Brevik, E.C.; Azorin-Molina, C.; Parras-Alcántara, L.; Jordán, A.; Cerdà, A. Effects of soil management techniques on soil water erosion in apricot orchards. Sci. Total Environ. 2016, 551–552, 357–366. [Google Scholar] [CrossRef] [Green Version]
  78. Cerdà, A.; Keesstra, S.; Rodrigo-Comino, J.; Novara, A.; Pereira, P.; Brevik, E.; Giménez-Morera, A.; Fernández-Raga, M.; Pulido, M.; di Prima, S.; et al. Runoff initiation, soil detachment and connectivity are enhanced as a consequence of vineyards plantations. J. Environ. Manag. 2017, 202, 268–275. [Google Scholar] [CrossRef] [PubMed] [Green Version]
  79. Pastor, M.; Castro, J.; Humanes, M.D.; Muñoz, J. Sistemas de manejo del suelo en olivar de Andalucía. Edafología 2001, 8, 75–98. [Google Scholar]
  80. Gómez, J.A.; Guzmán, M.; Giráldez, J.V.; Fereres, E. The influence of cover crops and tillage on water and sediment yield, and on nutrient, and organic matter losses in an olive orchard on a sandy loam soil. Soil Tillage Res. 2009, 106, 137–144. [Google Scholar] [CrossRef] [Green Version]
  81. Durán-Zuazo, V.; Pleguezuelo, C.R.; Panadero, L.A.; Raya, A.M.; Martínez, J.F.; Rodríguez, B.C. Soil Conservation Measures in Rainfed Olive Orchards in South-Eastern Spain: Impacts of Plant Strips on Soil Water Dynamics. Pedosphere 2009, 19, 453–464. [Google Scholar] [CrossRef]
  82. Romero, P.; Castro, G.; Gomez, J.A.; Fereres, E. Curve Number Values for Olive Orchards under Different Soil Management. Soil Sci. Soc. Am. J. 2007, 71, 1758–1769. [Google Scholar] [CrossRef]
  83. Barrena-González, J.; Rodrigo-Comino, J.R.; Gyasi-Agyei, Y.; FernánPulidezo, M.P.; Cerdà, A. Applying the RUSLE and ISUM in the Tierra de Barros Vineyards (Extremadura, Spain) to Estimate Soil Mobilisation Rates. Land 2020, 9, 93. [Google Scholar] [CrossRef] [Green Version]
  84. Bircher, P.; Liniger, H.; Prasuhn, V. Comparing different multiple flow algorithms to calculate RUSLE factors of slope length (L) and slope steepness (S) in Switzerland. Geomorphology 2019, 346, 106850. [Google Scholar] [CrossRef]
  85. Inventario Nacional de Erosión de Suelos (INES). Provincial de Jaén, Escala 1:250.000. Min.; Agricultura, Alimentación y Medio Ambiente: Madrid, Spain, 2006; 398p.
  86. Durán-Zuazo, V.; Pleguezuelo, C.R.; Peinado, F.M.; De Graaff, J.; Martínez, J.F.; Flanagan, D. Environmental impact of introducing plant covers in the taluses of terraces: Implications for mitigating agricultural soil erosion and runoff. Catena 2011, 84, 79–88. [Google Scholar] [CrossRef]
  87. Espejo-Pérez, A.J.; Rodríguez-Lizana, A.; Ordóñez, R.; Giráldez, J.V. Soil Loss and Runoff Reduction in Olive-Tree Dry-Farming with Cover Crops. Soil Sci. Soc. Am. J. 2013, 77, 2140–2148. [Google Scholar] [CrossRef] [Green Version]
  88. Repullo-Ruibérriz De Torres, M.A.; Ordóñez-Fernández, R.; Giráldez, J.V.; Márquez-García, J.; Laguna, A.; Carbonell-Bojollo, R. Efficiency of four different seeded plants and native vegetation as cover crops in the control of soil and carbon losses by water erosion in olive orchards. Land Degrad. Dev. 2018, 29, 2278–2290. [Google Scholar] [CrossRef]
  89. Taguas, E.; Ayuso, J.; Pérez, R.; Giráldez, J.; Gomez, J.A. Intra and inter-annual variability of runoff and sediment yield of an olive micro-catchment with soil protection by natural ground cover in Southern Spain. Geoderma 2013, 206, 49–62. [Google Scholar] [CrossRef]
  90. Sastre, B.; Barbero-Sierra, C.; Bienes, R.; Marques, M.J.; García-Díaz, A. Soil loss in an olive grove in Central Spain under cover crops and tillage treatments, and farmer perceptions. J. Soils Sediments 2016, 17, 873–888. [Google Scholar] [CrossRef]
  91. Alcantara, C.; Pujadas, S.; Saavedra, M.S. Management of cruciferous cover crops by mowing for soil and water conservation in Southern Spain. Agric. Water Manag. 2011, 98, 1071–1080. [Google Scholar] [CrossRef]
  92. Novara, A.; Cerda, A.; Barone, E.; Gristina, L. Cover crop management and water conservation in vineyard and olive orchards. Soil Tillage Res. 2021, 208, 104896. [Google Scholar] [CrossRef]
  93. Duan, X.; Shi, X.; Li, Y.; Rong, L.; Fen, D. A new method to calculate soil loss tolerance for sustainable soil productivity in farmland. Agron. Sustain. Dev. 2016, 37, 2. [Google Scholar] [CrossRef] [Green Version]
  94. Ajon, A.; Agber, P. Evaluation of Soil Erosion Effects on Soil Productivity Using Productivity Index Model in Makurdi, Benue State, Nigeria. World J. Res. Rev. 2018, 7, 26–31. [Google Scholar]
  95. Meena, R.S.; Kumar, S.; Yadav, G.S. Soil Carbon Sequestration in Crop Production. In Nutrient Dynamics for Sustainable Crop Production; Springer: Singapore, 2019; pp. 1–39. [Google Scholar] [CrossRef]
  96. Bogunovic, I.; Telak, L.J.; Pereira, P.; Filipovic, V.; Filipovic, L.; Percin, A.; Durdevic, B.; Birkás, M.; Dekemati, I.; Comino, J.R. Land management impacts on soil properties and initial soil erosion processes in olives and vegetable crops. J. Hydrol. Hydromech. 2020, 68, 328–337. [Google Scholar] [CrossRef]
  97. United Nations. Transforming Our World: The 2030 Agenda for Sustainable Development; United Nations: New York, NY, USA, 2015. [Google Scholar]
  98. Abd-Elmabod, S.K.; Muñoz-Rojas, M.; Jordán, A.; Anaya-Romero, M.; Phillips, J.D.; Jones, L.; Zhang, Z.; Pereira, P.; Fleskens, L.; van der Ploeg, M.; et al. Climate change impacts on agricultural suitability and yield reduction in a Mediterranean region. Geoderma 2020, 374, 114453. [Google Scholar] [CrossRef]
  99. Arenas-Castro, S.; Gonçalves, J.F.; Moreno, M.; Villar, R. Projected climate changes are expected to decrease the suitability and production of olive varieties in Southern Spain. Sci. Total Environ. 2020, 709, 136161. [Google Scholar] [CrossRef] [PubMed]
  100. Fraga, H.; Pinto, J.G.; Viola, F.; Santos, J.A. Climate change projections for olive yields in the Mediterranean Basin. Int. J. Clim. 2020, 40, 769–781. [Google Scholar] [CrossRef] [Green Version]
  101. Orlandi, F.; Rojo, J.; Picornell, A.; Oteros, J.; Pérez-Badia, R.; Fornaciari, M. Impact of Climate Change on Olive Crop Production in Italy. Atmosphere 2020, 11, 595. [Google Scholar] [CrossRef]
  102. Aguilera-Huertas, J.; Lozano-García, B.; González-Rosado, M.; Parras-Alcántara, L. Effects of Management and Hillside Position on Soil Organic Carbon Stratification in Mediterranean Centenary Olive Grove. Agronomy 2021, 11, 650. [Google Scholar] [CrossRef]
  103. Fraga, H.; Moriondo, M.; Leolini, L.; Santos, J.A. Mediterranean Olive Orchards under Climate Change: A Review of Future Impacts and Adaptation Strategies. Agronomy 2020, 11, 56. [Google Scholar] [CrossRef]
Figure 1. Aerial view of the experimental plots at Torredelcampo (Jaén, Spain). The evolution of the study area and management is marked by different letters: conventional tillage (CT), no tillage (NT + H), and no tillage with cover (NT-CC). (A) situation in 2004, (B) in 2015, and (C) in 2017. Colour (blue, yellow, and orange) circles represent the soil sampling points.
Agronomy 11 00812 g001
Figure 2. Infiltration rate results (mm h−1) for conventional tillage (CT0; CT1), no tillage with herbicide (NT + H), and no tillage with cover (NT-CC).
Agronomy 11 00812 g002
Figure 3. Productivity Index (PI), taking into account the entire soil profiles. CT0: conventional tillage 2004; CT1: conventional tillage 2019; NT + H: no tillage 2019; NT + CC: no tillage with cover.
Agronomy 11 00812 g003
Figure 4. Variation in PI in soil profiles under different management systems. Conventional tillage (CT0; CT1), no tillage with herbicide (NT + H), and no tillage with cover (NT-CC).
Agronomy 11 00812 g004
Table 1. Soil physical and chemical properties at the three research plots (average ± SD).
Tillage PracticeHor.Depth
(cm)
Gravel
(%)
Sand
(%)
Silt
(%)
Clay
(%)
BD
(Mg m−3)
OM
(%)
pH
(H2O)
Ap0–27.312.8 ± 1.7 Aa8.7 ± 0.6 Aa19.8 ± 1.5 Aa71.5 ± 0.9 Aa1.41 ± 0.03 Aa1.22 ± 0.06 Aa7.72 ± 0.10 Aa
CT0Bw27.3–56.013.6 ± 1.5 Aa5.5 ± 1.6 Ba22.9 ± 1.4 Aa71.6 ± 0.6 Aa1.42 ± 0.02 Aa1.01 ± 0.05 Aa8.02 ± 0.11 Ba
BC56.0–89.017.6 ± 1.2 Ba3.8 ± 0.8 Ca24.8 ± 1.7 Aa71.4 ± 1.9 Aa1.43 ± 0.03 Aa0.76 ± 0.04 Ba8.15 ± 0.05 Ba
C89.0–115.712.6 ± 0.5 Aa4.1 ± 0.9 Ca21.9 ± 1.6 Aa74.0 ± 0.7 Aa1.44 ± 0.02 Aa0.71 ± 0.02 Ba8.07 ± 0.10 Ba
Ap0–32.715.6 ± 3.6 Aa9.2 ± 5.2 Aa19.1 ± 5.0 Aa71.6 ± 2.8 Aa1.35 ± 0.14 Aa0.88 ± 0.29 Ab7.81 ± 0.10 Aa
CT1Bw32.7–6515.8 ± 5.1 Aa3.6 ± 4.4 Ca21.0 ± 2.0 Aa75.3 ± 7.0 Aa1.35 ± 0.07 Aa0.59 ± 0.10 Bb8.11 ± 0.10 Ba
BC65–89.721.7 ± 2.2 Ba6.5 ± 3.6 Ba20.6 ± 4.8 Ab72.9 ± 2.8 Aa1.37 ± 0.09 Aa0.38 ± 0.19 Cb8.17 ± 0.05 Ba
C89.7–119.712.2 ± 0.3 Aa9.7 ± 0.5 Ab21.5 ± 0.1 Aa68.7 ± 2.2 Ab1.39 ± 0.04 Aa0.29 ± 0.14 Cb8.11 ± 0.13 Ba
A0–21.715.0 ± 2.5 Aa9.8 ± 2.1 Aa26.7 ± 5.9 Ab63.5 ± 4.8 Ab1.37 ± 0.07 Aa0.74 ± 0.20 Ac7.82 ± 0.07 Aa
NT + HBw21.7–6017.6 ± 2.1 Aa12.9 ± 5.6 Ab25.9 ± 4.9 Aa61.2 ± 6.2 Ab1.40 ± 0.03 Aa0.43 ± 0.18 Bc8.09 ± 0.17 Ba
BC60–84.721.5 ± 1.2 Ba12.3 ± 9.6 Ab29.1 ± 5.5 Aa58.6 ± 7.9 Ab1.42 ± 0.04 Aa0.27 ± 0.09 Cc8.05 ± 0.09 Ba
C84.7–11012.7 ± 0.8 Aa6.9 ± 0.72 Ba24.8 ± 3.4 Aa68.2 ± 7.6 Ab1.39 ± 0.03 Aa0.27 ± 0.09 Cb8.17 ± 0.13 Ba
A0–23.58.75 ± 3.2 Ab7.72 ± 2.5 Aa21.7 ± 3.9 Aa70.60 ± 4.6 Aa1.26 ± 0.05 Ab0.85 ± 0.13 Ab7.83 ± 0.12 Aa
NT-CCBw23.5–64.49.81 ± 2.6 Ab8.13 ± 1.4 Ab20.2 ± 4.6 Aa71.63 ± 5.3 Aa1.41 ± 0.07 Ba0.62 ± 0.16 Ab7.77 ± 0.09 Ab
BC64.4–82.222.95 ± 1.3 Ba6.45 ± 0.8 Aa20.9 ± 2.5 Ab72.67 ± 3.9 Aa1.37 ± 0.03 Bb 0.41 ± 0.08 Bb8.18 ± 0.10 Ba
C82.2–107.724.93 ± 1.1 Bb9.95 ± 1.5 Bb22.0 ± 0.9 Aa68.02 ± 5.1 Ab1.39 ± 0.05 Ba0.32 ± 0.10 Bb8.17 ± 0.05 Ba
Data (average values). CT0: conventional tillage 2004; CT1: conventional tillage 2019; NT + H: no tillage with herbicide 2019; NT-CC: no tillage with cover 2019; Hor: Horizon type; Depth: Horizon thickness; BD: Bulk density; OM: Organic matter. Numbers followed by different capital letters within the same column have significant differences (p < 0.05) between depths considering the same land management. Numbers followed by different lower-case letters within the same column have significant differences (p < 0.05) between the same soil horizon in different land management considering the same variable.
Table 2. Porosity and soil water retention properties at the three research plots (average ± SD) in Mediterranean olive groves. Initial situation (2004) and final situation (2019).
SamplingHorTP
(m3 m−3)
Μ
(m3 m−3)
M
(m3 m−3)
PWP
%
FC
%
AWC
(mm cm−1)
CT0Ap0.45 Aa0.226 Aa0.221 Aa55.4 Aa42.7 Aa1.79 Aa
Bw0.47 Aa0.241 Ba0.233 Aa55.8 Aa43.0 Aa1.82 Aa
BC0.43 Aa0.220 Aa0.215 Aa55.8 Aa42.9 Aa1.84 Aa
C0.42 Aa0.223 Aa0.202 Aa56.9 Ba44.4 Aa1.80 Aa
CT1Ap0.46 Aa0.236 Aa0.230 Aa55.3 Aa42.8 Aa1.70 Ab
Bw0.46 Aa0.226 Aa0.234 Aa57.5 Bb45.1 Bb1.67 Ab
BC0.45 Aa0.235 Aa0.217 Aa56.2 Aa43.7 Aa1.71 Ab
C0.44 Aa0.251 Aa0.193 Aa54.0 Ab41.0 Ab1.81 Ba
NT + HAp0.46 Aa0.238 Aa0.225 Aa51.6 Ab37.9 Ab1.82 Aa
Bw0.47 Aa0.226 Aa0.242 Aa48.8 Bc36.2 Ac1.79 Aa
BC0.43 Aa0.286 Bb0.145 Bb48.8 Bb34.6 Ab2.02 Bc
C0.44 Aa0.255 Aa0.189 Ba54.1 Cb40.9 Bb1.83 Aa
Ap0.51 Bb0.190 Ab0.316 Ab55.1 Aa42.3 Aa1.64 Ab
NT-CCBw0.45 Aa0.239 Ba0.207 Ba55.5 Aa42.8 Aa1.77 Ba
BC0.45 Aa0.240 Ba0.207 Ba56.1 Aa43.5 Aa1.73 Bb
C0.44 Aa0.214 Aa0.227 Ba53.6 Bb40.6 Bb1.81 Ba
Data in average value: CT0: conventional tillage 2004; CT1: conventional tillage 2019; NT + H: no tillage 2019; NT-CC: no tillage with cover; Hor: Horizon type; TP: total porosity; μ: Microporosity; M: Macroporosity; FC: Field Capacity −33 kPa; PWP: Permanent Wilting Point −1500 kPa; AWC: Available water content. Numbers followed by different capital letters within the same column have significant differences (p < 0.05) between depths considering the same land management. Numbers followed by different lower-case letters within the same column have significant differences (p < 0.05) between the same soil horizon in different land management considering the same variable.
Table 3. Soil loss predicted by the RUSLE-Model. Initial situation (2004) and final situation (2019).
Management
Practice
K Factor
(t ha h ha−1 MJ−1 mm−1)
RUSLE Model
(Mg ha−1 Year−1)
CT00.02009.71
CT10.02029.82
NT+ H0.025013.88
NT-CC0.02072.06
Data (average values). CT0: conventional tillage 2004; CT1: conventional tillage 2019; NT + H: no tillage with herbicide 2019; NT-CC: no tillage with cover 2019.
Publisher’s Note: MDPI stays neutral with regard to jurisdictional claims in published maps and institutional affiliations.

