Article

Rice Blast (Magnaporthe oryzae) Occurrence Prediction and the Key Factor Sensitivity Analysis by Machine Learning

1
Department of Civil Engineering, National Pingtung University of Science and Technology, Pingtung County 91201, Taiwan
2
Zachary Department of Civil and Environmental Engineering, Texas A&M University, College Station, TX 77840, USA
3
Pingtung Agricultural Biotechnology Park, Pingtung County 90846, Taiwan
4
Department of Plant Industry, National Pingtung University of Science and Technology, Pingtung County 91201, Taiwan
5
General Research Service Center, National Pingtung University of Science and Technology, Pingtung County 91201, Taiwan
*
Author to whom correspondence should be addressed.
Agronomy 2021, 11(4), 771; https://doi.org/10.3390/agronomy11040771
Submission received: 14 February 2021 / Revised: 8 April 2021 / Accepted: 12 April 2021 / Published: 15 April 2021
(This article belongs to the Special Issue Machine Learning Applications in Digital Agriculture)

Abstract

:
This study aimed to establish a machine learning (ML)-based rice blast predicting model to decrease the appreciable losses based on short-term environment data. The average, highest and lowest air temperature, average relative humidity, soil temperature and solar energy were selected for model development. The developed multilayer perceptron (MLP), support vector machine (SVM), Elman recurrent neural network (Elman RNN) and probabilistic neural network (PNN) were evaluated by F-measures. Finally, a sensitivity analysis (SA) was conducted for the factor importance assessment. The study result shows that the PNN performed best with the F-measure (β = 2) of 96.8%. The SA was conducted in the PNN model resulting in the main effect period is 10 days before the rice blast happened. The key factors found are minimum air temperature, followed by solar energy and equaled sensitivity of average relative humidity, maximum air temperature and soil temperature. The temperature phase lag in air and soil may cause a lower dew point and suitable for rice blast pathogens growth. Through this study’s results, rice blast warnings can be issued 10 days in advance, increasing the response time for farmers preparing related preventive measures, further reducing the losses caused by rice blast.

1. Introduction

The impact of blast fungus (Magnaporthe oryzae syn. Pyricularia oryzae) is a global rice (Oryza sativa L.) production issue [1]. The fungus has been found in at least 85 rice-growing countries [2] and is a particular threat to food security in South Asia and Africa [3]. Rice blast disease caused the loss of 157 million tons of rice worldwide between 1975 and 1990, resulting in maximum possible losses corresponding to 30% of global rice production [4,5,6] and annual food losses for 60 million people [1]. The cost of chemical control may exceed approximately USD 70/ha/year [7]. In addition, blast fungus has been found to affect not only rice but also barley (Hordeum vulgare) [8]. Due to the threat to food security under and farmers’ income, blast fungus has been evaluated as the most destructive fungus globally [9] and has been identified as one of the significant and omnipresent rice cultivation constraints [10]. Fungal blast poses an especially severe threat to the tropical rice-growing regions, which feed more than 33% of the global population [11]. Thus, growers have a great need to determine when the disease will start, how severe an epidemic will be and when they should apply fungicides [12].
The rice blast pathogen develops in the nodes, leaves, collars, necks, panicles, seeds and roots over the entire growth period [13,14]. 
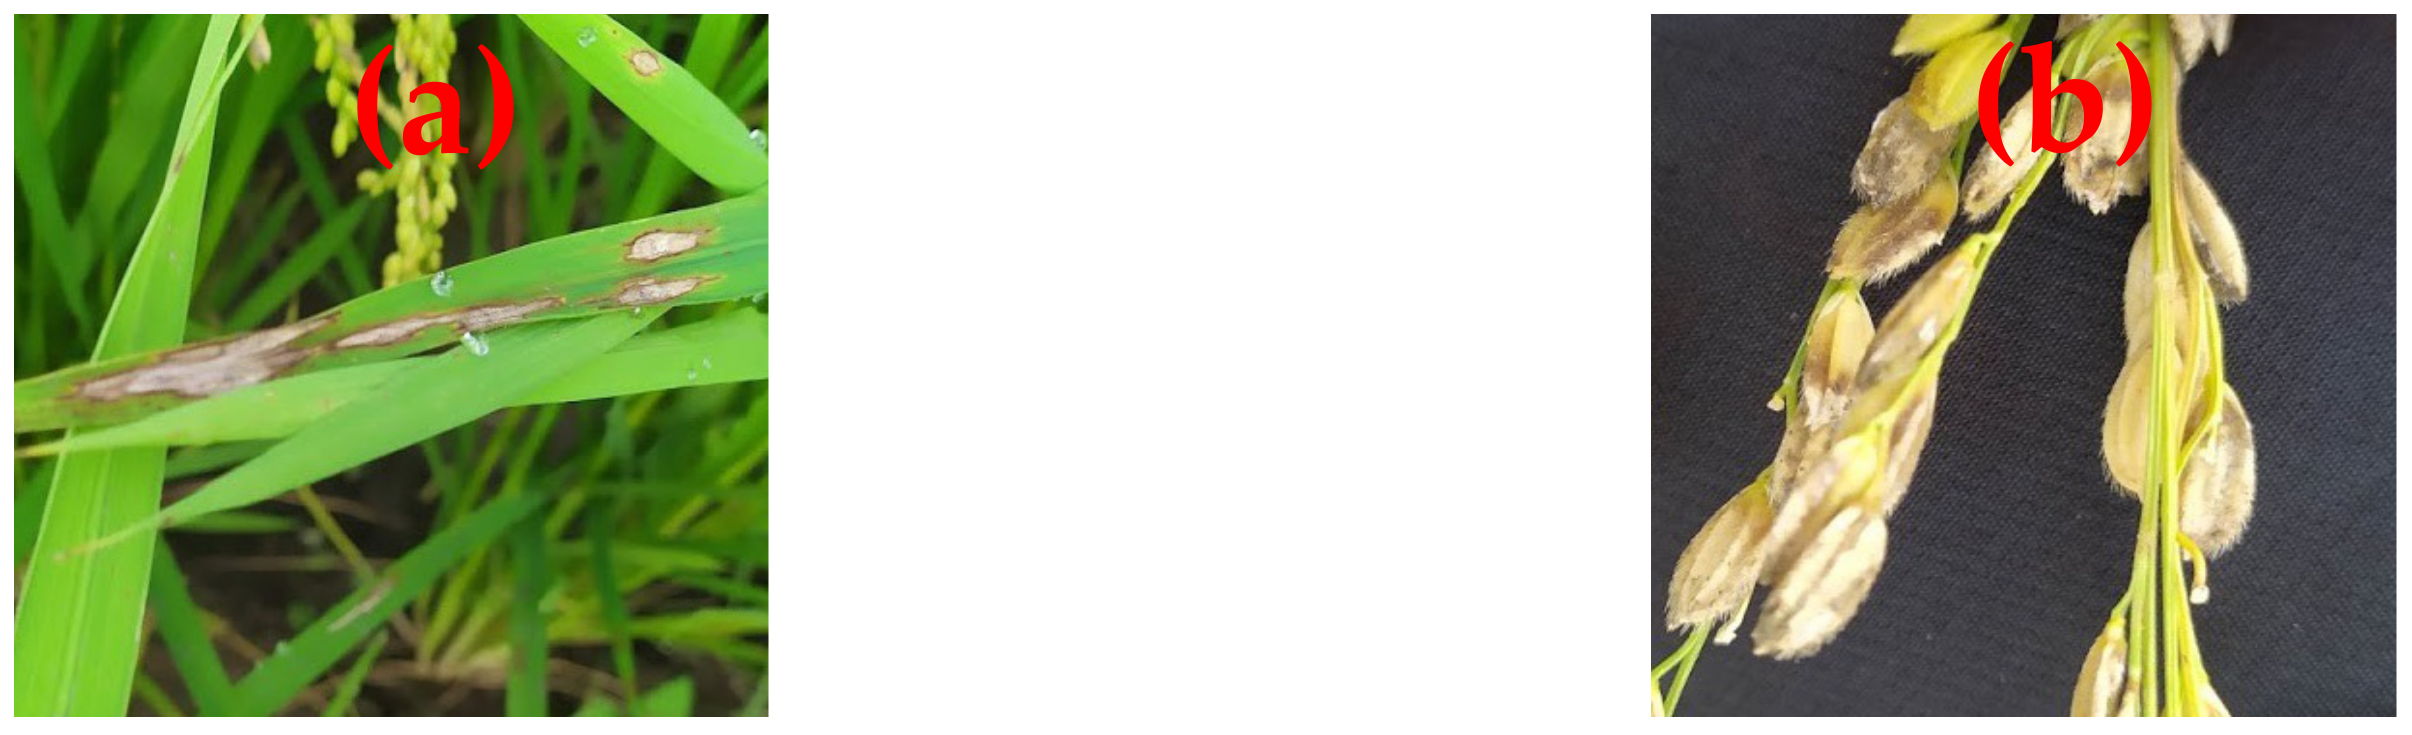
Figure 1 shows the leaf and panicle symptom of rice blast. The fungus subsequently invades the above-ground parts of the rice plant and, in severe epidemics, large ellipsoid lesions can engulf the entire surface of a leaf [15]. Based on the rice blast attack mechanism, it has been found that the damage is very much influenced by environmental factors. The disease can survive throughout the year in the air and can be severed during periods of low temperatures and high moisture; while conidia do not germinate under direct sunlight, overcast conditions and dew encourage blast spread [16]. Blast lesions occur in suitable weather, leading to increased blast incidence and severity for 7 to 10 days [17]; their life cycle is 7 to 14 days [18,19,20], then destroying plants within 15 to 20 days, causing yield losses of up to 100% [21]. Moreover, inappropriate farming practices, e.g., excessive fertilizer [22], may lead to severe rice blast happening. Although ongoing research is working to develop rice blast resistant varieties, it has been found that the resistance is being lost and even vanishes within a few years [23].
Considering the severity of rice blast effects on rice production, many researchers have developed rice blast forecasting models for early warning. Katsantonis, et al. [24] reviewed 52 rice blast forecasting models and concluded that the parameters applied (with frequencies) included air temperature (T, 67.3%), relative humidity (RH, 57.7%), rainfall (55.8%), leaf wetness (34.6%), sunlight (30.8%), wind speed (30.8%) and dewpoint (15.4%). The variables most often combined were air temperature (T) and relative humidity (RH). Moreover, under the growth mechanism of the rice blast pathogen, the disease occurrence has been found to be positively related to soil temperature (TS). Hemi and Abe [25] used a modified Wisconsin soil temperature tank for a rice blast experiment in the seeding stage, considering the effect of TS. Incidence of rice blast at 20 °C, 24 °C, 28 °C and 32 °C was 33.95%, 17.28%, 17.85% and 13.70%, respectively. Abe [26] found that rice blast incidence was lowest in seedlings grown at TS of 27.8 °C with highest in those grown at 20 °C A similar finding from Hemi, et al. [27] showed that the rice blast incidence after the booting stage with TS of 20 °C to 29 °C and 18 °C to 24 °C was 28.46% and 56.02%, respectively. Hashioka [28] reported that resistance increases with the rise of both air and soil temperatures. The ratio of carbon to nitrogen in the leaves is increased in proportion to the rise in temperature. Suzuki [29] inoculated the panicles of two resistant and two susceptible rice varieties grown at low and normal soil temperatures. Disease development in all plants in the low temperature series was 75 to 100%, whereas at the normal temperature, it was 0 to 13.3% for the resistant and 20 to 33.3% for susceptible varieties. These forecasting models could be used to identify which years are conducive and whether fungicide application would be cost-effective or risky under those conditions. Both empirical and explanatory simulation models via regression analysis have been developed for rice blast prediction in many countries [24]. However, due to climate change affects the rice field environment variate intensely, the conventional prediction model might lose the predicting accuracy [30].
In recent years, a few researchers have considered the rice blast mechanism to be a nonlinear system and have adopted machine learning (ML), especially artificial neural networks (ANNs), known as sophisticated problem-solving algorithms, for the development of rice blast forecasting models. This approach was first explored by Kaundal, Kapoor and Raghava [12]. The researchers collected 5 years of data on rice blast events and weekly weather data (from 2000 to 2004) in India for the development of a long-term forecasting model, including “cross-location” and “cross-year” scenarios. The model included multiple regression (REG), the backpropagation neural network (BPNN), generalized regression neural network (GRNN) and support vector machines (SVM). Approximately 80% of data were used for model training and validation, the remaining 20% for model testing. The average correlation coefficients (r) between observed and modeled rice blast happening probability in REG, BPNN, GRNN and SVM were 0.48, 0.56, 0.66 and 0.74 for the cross-location model and 0.50, 0.60, 0.70 and 0.77 for the cross-year model, respectively. In the factor importance analysis, rainfall was most influential in predicting the disease, followed by rainy days/week, minimum RH (RHmin), maximum RH (RHmax), minimum T (Tmin) and maximum T (Tmax). Mojerlou, et al. [31] applied weather data including precipitation, daily Tmin, Tmax, RHmin, RH max and duration of sunny hours from 2006 to 2008 for rice blast spore population forecasting in Iran. A multilayer perceptron (MLP) was employed for model development. In total, 80% of the data were used for model training and validation and 20% of the testing data. The highest coefficient of determination (R2) obtained was 0.552. The results indicate that RH and T were the most important meteorological factors and form a suitable base for predicting the spore population, according to the findings of Calvero, et al. [32]. Kim, Roh and Kim [14] applied a long short-term memory (LSTM) recurrent neural network (RNN) to establish an early rice blast event forecasting model for four regions in Korea. Climatic data, including T, RH and sunlight, were obtained in June and July from 2003 to 2016 during the rice blast data collection period. This study used 70% of the training data, 10% for validation and 20% for testing. An early (1 year) rice blast model was developed. The highest accuracy and F1-score was 79.4%. Nettleton, et al. [33] compared 4 models (two role-based, called YOSHINO and WARM, the other two for ML were M5RULES and LSTM RNN) for rice blast disease prediction. The inputs for the ANN models included daily Tmin, Tmax, RH and leaf wetness. The result showed that the LSTM RNN achieved the highest averaged r (0.7). The authors indicated that these 4 models exhibit significant signals during the early warning period, with a similar performance level.
Compare the traditional REG model, these ML-based rice blast predicting models, e.g., BPNN, GRNN, SVM, RNN, have developed a reliable forecasting result, according to relative environment factors, such as temperature, relative humidity and sunlight. However, regarding soil temperature, it has been found that it affects the blast pathogen growth and spread; in addition, the blast occurrence is known to relate to soil conditions, which is yet to be seen in relevant applied research. Therefore, this study considered the influence of Ts as one of the variables for forecasting model development and discuss the effect mechanism.
This study aims to develop a reasonable and reliable rice blast forecasting model based on the mechanism of rice blast pathogen growth and spread using ML techniques. Accordingly, the objectives were as follows:
(1)
Based on rice blast pathogen growth and spread mechanisms, to determine short-term environment data for establishing models.
(2)
To employ ML as rice blast forecasting models and to assess model performance by confusion matrix.
(3)
Conduct sensitivity analysis on high performance ML model, to evaluate the important rice blast influence factors.
To achieve the aims of this study, firstly, regional weather data and rice blast event were collected. Secondly, the collected data were applied to selected ML algorithms for rice blast event forecasting model development. In the third step, the performances of each model were evaluated to find the best-fit model. Finally, the sensitivity analysis was conducted in highest performance model to identify the relative importance from each input to the model.

2. Materials and Methods

2.1. Study Area

In Taiwan, Yuin-Lin, Chia-Yi and Tai-Nan (YCN) counties contribute towards 41.4% of rice production out of 22 counties, with 37.6% of the area planted in rice in two crop seasons (Table 1). These three counties are located in a 250,000 ha alluvial plain in Southern Taiwan (Figure 2), with a similar meteorological environment. In total, three weather stations were selected to represent the regional weather. The monthly T, RH, sunlight hours and rainfall are 23.7 °C, 78.9%, 176.98 h and 144.69 mm, respectively. Based on the published observations [34], the average rice blast rate (infected area divide total paddy area) in the YCN area was 48.67% from 2009 to 2013 (Table 2).

2.2. Data Collection

This study used environmental data for 10 days (D10) and 10 days to 20 days (D20) with corresponding rice blast events in the YCN area to develop rice blast forecasting models. The data were published in the columns for farming activities, agro-meteorology and disasters in the Agro-Meteorological Bulletin (AMB) by the Central Weather Bureau [35], Taiwan, including 10-day climatic summaries (such as for T, RH and rainfall) and agricultural disaster warnings (for rice blast and other diseases), published every 10 days.

2.2.1. Rice Blast Data

The AMB text file provided in the open government data for rice blast decision-making information was collected for the period between the years 2004 and 2019. However, the rice blast events were in text form; thus, the semantic keyword of “YCN area” and “rice blast” were extracted and “infected” and “not infected” were classified as the variable for identifying rice blast events.

2.2.2. Weather Data

Daily Tmax, Tmin and Tavg, averaged RH (RHavg) and total sunlight energy (SE) were used for model development. Moreover, according to the mechanism of rice blast pathogen growth and spread, rice blast occurrence is known to relate to soil; therefore, Ts was selected for one of the model input. These data were observed by Yuin-Lin station, Yi-Chu station (Chia-Yi station) and the livestock research institute (Tai-Nan station) of the Council of Agriculture, Taiwan (Figure 2).

2.3. Machine Learning (ML)

ML techniques, especially ANNs and SVM, have been employed for rice blast forecasting and have acquired satisfactory performance. This study used NeuroSolution 7.1 software from NeuroDimension, Inc (Gainesville, FL, USA) to develop the ANN and SVM rice blast models. Moreover, data normalization was conducted for the preventative purpose of overcoming errors associated with extreme values. In addition, this procedure was able to randomize the data with stochastic statistics to understand the relative degree of change in the database. Therefore, in this study, data normalization was processed by Equations (1) and (2) for Tmax, Tmin, Tavg, RHavg, SE and TS, in the range of 0 to 1.
x n o r m = x x m i n x m a x x m i n
x = x n o r m × x m a x x m i n + x m i n
where xnorm is the dimensionless normalized x variable; x is the observed data vector; xmin is the minimum value of the variable and xmax is the maximum value of the variable.

2.3.1. Multilayer Perceptron (MLP)

The multilayer perceptron is a traditional and classic ANN model. The structure is composed of the input layer, hidden layer and output layer. Typically, the MLP model consists of a backpropagation algorithm for error adjustment, also called BPNN which was established by Rumelhart et al. in 1986 [36]. The layers of nodes whose input and output are seen only by other nodes are termed hidden layers. The connection weights are computed utilizing a learning algorithm. In this study, a single hidden layer was conducted with an optimized perceptron element. The Levenberg Marquardt gradient search method is used with the batch update. In total, there were 1000 epochs, with a learning rate of 0.001 and an early stopping callback to prevent overfitting.

2.3.2. Support Vector Machines (SVM)

The support vector machine was proposed by Vapnik [37] based on the combination of the principle of structural risk minimization and the statistics of the Vapnik–Chervonenkis (VC) dimension theory. The advantages of SVM include target classification and pattern recognition. The output is a hyperplane that separates the classes of a given problem instance. A nonlinear algorithm can be applied by transforming input X into higher dimensional feature space through a nonlinear mapping Φ(X) and then applying standard linear SVM over features Φ(X). The function can be expressed as a linear combination of inner products with data points XNs, defined as kernel function K(X, XNs), which defines the inner products (Φ(X), Φ(XNs)) in some feature space [38]. The main logic can be summarized in two points. First, for the case of linear inseparability, a nonlinear algorithm is used to map the linearly inseparable sample to the high-dimensional feature space. It may cause a linear algorithm in high-dimensional feature space to perform linear analysis on the nonlinear characteristics of the sample. Second, based on structural risk minimization, the feature space develops the optimal segmentation hyperplane within it, achieving global optimization. In this study, the radius basis function (RBF) was selected as the kernel function, penalty parameter C and the kernel function’s parameter γ for the SVM were determined through the grid-search algorithm. A grid search tries the values of each parameter across the specified search range using geometric steps. If the model’s fit improves, the search center moves to the new point and the process is repeated. If no improvement is found, the step size is reduced and the search is tried again. The learning rate is 0.01 and epochs are 1000; the gradient search method is momentum.

2.3.3. Recurrent Neural Networks (RNN)

Recurrent neural networks can describe temporal dynamic behavior because an RNN varies the states of its network so that it can accept a broader range of time series structural input. The temporal memory is implied in the interconnected input layer and the hidden layer. Due to their infinite memory depth, a relationship through time, as well as through the input space, could be found [39]. RNNs have already revealed their capability for rice blast forecasting [14,33]. In this study, the Elman RNN [40] is conducted with momentum gradient search method and batch update. In total, 1000 epochs with a learning rate of 0.001 were used with four perceptron elements.

2.3.4. Probabilistic Neural Network (PNN)

The PNN is a feedforward neural network, which was introduced by Specht [41]. The network is composed of four sub-network layers, including the input layer, pattern layer, summation layer and decision layer [42]. Euclidean distance (ED) was used for the evaluation of differences between input vectors and training datasets. If the ED is small, the Gaussian function will be closer to 1. The pattern for the summation layer represents the classification information of the training data. Each class is the sum of the weighted input vectors. Bayes’ theorem was applied to calculate the probability of the final output. The PNN is related to the Parzen window-based probability density function estimator, which can be broken up into a large number of simple processes implemented into classes in the summation layer [43]. The epoch is 3 and the perceptron element is 236 in this study. It is different from other ML algorithms due to the model characteristics.

2.4. Model Performance Assessment

Referring to Pan and He [44], Jiang, et al. [45], Burgos-Artizzu, et al. [46], Gan, et al. [47], Majeed, et al. [48], Zhao, et al. [49], Zhang, et al. [50], Majeed, et al. [51], model performance assessment included confusion matrix (Table 3), accuracy, precision, recall and F-measure as the evaluation indices for result assessment in the model testing phase. These indices are described in Equations (3)–(6). The accuracy is defined as the ratio of correctly predicted rice blast events (TP + TN) by the total rice blast events (TP + TN + FP + FN), which means that how often is the classifier correct. The precision is the ratio of correct positive rice blast events (TP) to the total predicted rice blast events (TP + FP), which represents how often is it correct when the rice blast events have been predicted. The recall is the ratio of correct positive rice blast events (TP) to the total correct predictions (TP + FN), which means that how often does the classifier predict correct rice blast events on all correct predictions. Finally, the F-measure is weighted (β) by recall and, precision based on the occurrence importance evaluation, it estimates one of precision or recall more than the other. If β = 1, equal weight is given to recall and precision, termed F1-score; β = 2 (F2-score) indicates that recall is twice as important as the accuracy; and β = 0.5 (F0.5-score) signifies that the accuracy is twice as important as the recall.
A c c u r a c y   % = T P + T N T P + T N + F P + F N
P r e c i s i o n   % = T P T P + F P
R e c a l l   % = T P T P + F N
F m e a s u r e   % = 1 + β 2 × P r e c i s i o n × R e c a l l β 2 × P r e c i s i o n + R e c a l l
where TP is true positive, TN is false negative, FP is false positive and TN is true negative, respectively, based on the rice blast forecasting results; β is a weight factor which assumes nonnegative value. The weight of recall increases as the value of β increases.

2.5. Sensitivity Analysis

Sensitivity analysis (SA) is a tool to assess the relative importance of model inputs based on the rice blast events happening probability from model output. The highest performance model is selected for sensitivity analysis to find the inputs contribution to the model. By referring to the SA procedure of Jha and Sahoo [52] and Hsieh, et al. [53], Equation (7) behaves as follows. When the change resulting from an input is small, that input is less sensitive in the model; on the contrary, when changes are significant, the input is highly sensitive.
S k = p = 1 p n = 1 n y i p y i p ¯ σ k 2
where Sk is the sensitivity index for input k, y i p ¯ is the ith output obtained with the fixed weights for the p pattern, n is the number of network outputs, p is the number of patterns and σk2 is variance of the input k.

3. Results and Discussion

The study results, including the treatment data, model performance assessment and sensitivity analysis of the selected model, are presented and discussed in the following sections.

3.1. Data Treatment

Totally 177 AMB data were pared with unmissed weather data from each weather station in YCN area [35], which contains 31 infected rice blast events and 146 noninfected events. The imbalance dataset will bias and towards the majority class [54]; therefore, the random under-sampling (RUS) method was confirmed to improve model performance with respect to parameters such as recall, precision, F-measure and the FP rate of the ANN classifier [55]. Yap, Rani, Rahman, Fong, Khairudin and Abdullah [54] applied random oversampling (ROS), RUS, bagging and boosting to handle imbalanced datasets, then noted that ROS and RUS work well for improving classification of the imbalanced dataset in ML algorithms. Thus, this study used the RUS method to reduce the sample number of “not infected” data from 146 to 31. Independent sample t-test was conducted to verify the difference between whole dataset and the dataset after RUS was significant or not under p-value of 0.05. The result shows that, after RUS processing, no significant differences were found from the original dataset both in D10 and D20 (Table 4).

3.2. Model Development and Performance Assessment

In total, 31 infected and 31 not infected data were conducted for modeling. Among them, 38 randomized data (61.3% of the dataset) were used for model training, 12 data (19.35% of the dataset) for model cross-validation (CV) and 12 data (19.35% of the dataset) for model testing. As the network learns, the error will drop towards zero. However, lower error does not always mean a better network; it is possible to overtrain a network. Therefore, the CV dataset is used to avoid overfitting for model training, which adjusts the hyperparameter and computes the error during CV. After that, the testing data is used to test the adjusted network. The testing data are unaware of training and CV data set. If the network is able to generalize rather precisely the output for this testing data, then it means that the neural network is able to predict the output accurately for new data and, hence, the network is validated.
Based on the developed ANN models, the confusion matrix is shown in Table 5. The model performance assessment result is shown in Table 6. F-measure comparisons from β = 0.1 to β = 2.0 with 0.1 increments of the MLP, SVM, Elman RNN and PNN models are shown in Figure 3. Representative model selection depends on the user’s tolerance for type I errors or type II errors, i.e., higher or lower β. When β = 0.5, which means the importance of precision is twice than recall, in the opposite, β = 2 represents the importance of recall is double than precision. In this study, a lower allowance of rice blast event prediction error is required to lower farmer’s losses. An early prevention alarm with slight uncertainty is acceptable for farmer to conduct preventing measures, which means a higher β (β = 2) should be considered in represent model selection. On the other hand, user can select lower β (β = 0.5 or β = 1) if the rice yield is not significantly affected by rice blast, e.g., farming with rice blast resistant varieties. Based on the F-measure comparison result, PNN model showed the highest F-measure (96.8%) when β = 2, i.e., the F2-score was 96.8%. Thus, the PNN model was selected for rice blast forecasting. Sensitivity analysis was also conducted on PNN model for evaluation of the relative importance of inputs.

3.3. Sensitivity Analysis of the Selected Model

A sensitivity analysis was performed on the PNN model forecasting results to understand the relative importance of each input to the output by sensitivity index (SI). The SI evaluation stander is shown in Table 7. The PNN SA results and ranked results are shown in Table 8. The model influence was defined based on counted sensitivity amount (Sa) when SI = 1, 2 (very high sensitivity and high sensitivity). The SA result showed that the factor with the greatest influence in D10 was Tmin (Sa = 3), followed by Tmax, RHavg and SE at an equivalent degree of sensitivity (Sa = 1), totaling Sa = 6 for D10. For D20, the highest Sa = 2 for the factor SE and the factor with the second greatest influence was TS with Sa = 1, for a total Sa = 3 in D20. Based on the SA result, it could be concluded that D10 has a stronger influence than D20; Tmin and SE have the highest influence (Sa = 3, respectively), followed by Tmax, TS and RHavg (Sa = 1). Tavg was found to have no significant influence in the model, perhaps because the contribution was accounted for by the Tmin and Tmax factors. The high sensitivity index (SI = 1) have higher relative importance to the PNN mode, which can be used for model rebuild to reduce the degrees of freedom. Therefore, this study re-develops PNN model (SA-PNN) by nine high sensitivity factors (SI = 1) and compares the model performance with established PNN model. The SA-PNN modeling results are shown in Table 9 and the model performance compared between SA-PNN and established PNN is shown in Table 10. It seems that the model performances have some reductions, but the model’s degrees of freedom are significantly decreased with acceptable accuracy.

4. Discussion

Katsantonis, Kadoglidou, Dramalis and Puigdollers [24] reviewed 52 rice blast forecasting models indicating that weather variables, such as T, RH, spore dissemination and leaf wetness, are among the most critical model inputs, since these variables play essential roles in rice blast pathogen growth. In ML models, T, RH and sunlight have been found to be effective factors for rice blast forecasting model development. However, due to climate change, which has intensely affected rice field environmental variation [30], the conventional prediction model may inappropriate for rice blast modeling. In addition, the rice blast spore mechanism involves a short-term effect that lasts only 7 to 14 days [17,18,19,20]. This indicates the long-term rice blast forecasting model might show reduced prediction accuracy. However, TS has been found to be highly influential when considering the growth mechanism of the rice blast pathogen [25,26,27,28,29]. Thus, this study adopted TS along with conventional environmental factors for rice blast forecasting. In addition, under the mechanism of the rice blast pathogen, blast lesions occur with elevated blast incidence and severity 7 to 10 days after suitable weather conditions. Sporulation takes only 7 to 14 days as a short-term effect [17,18,19,20]; this investigation used D10 (before 10 days of rice blast occurred) and D20 (10 days to 20 days after the initiation of rice blast) as input variable periods. The weather data shows that the largest difference between D20 and D10 in an infection event was observed for SE and the smallest difference was observed for RHavg. Values for most factors, such as Tmin, Tmax, Tavg, TS and SE, increased. Only RHavg decreased. In the “not infected” result, a slight difference between each factor could be found. Only RHavg differences were positive and differences for the other five variables were negative. This shows an opposite pattern compared with data from infections. The variation of “infected” data was higher than for “not infected” data. This reveals that the rice blast occurrences corresponded with significant weather change from D10 to D20.
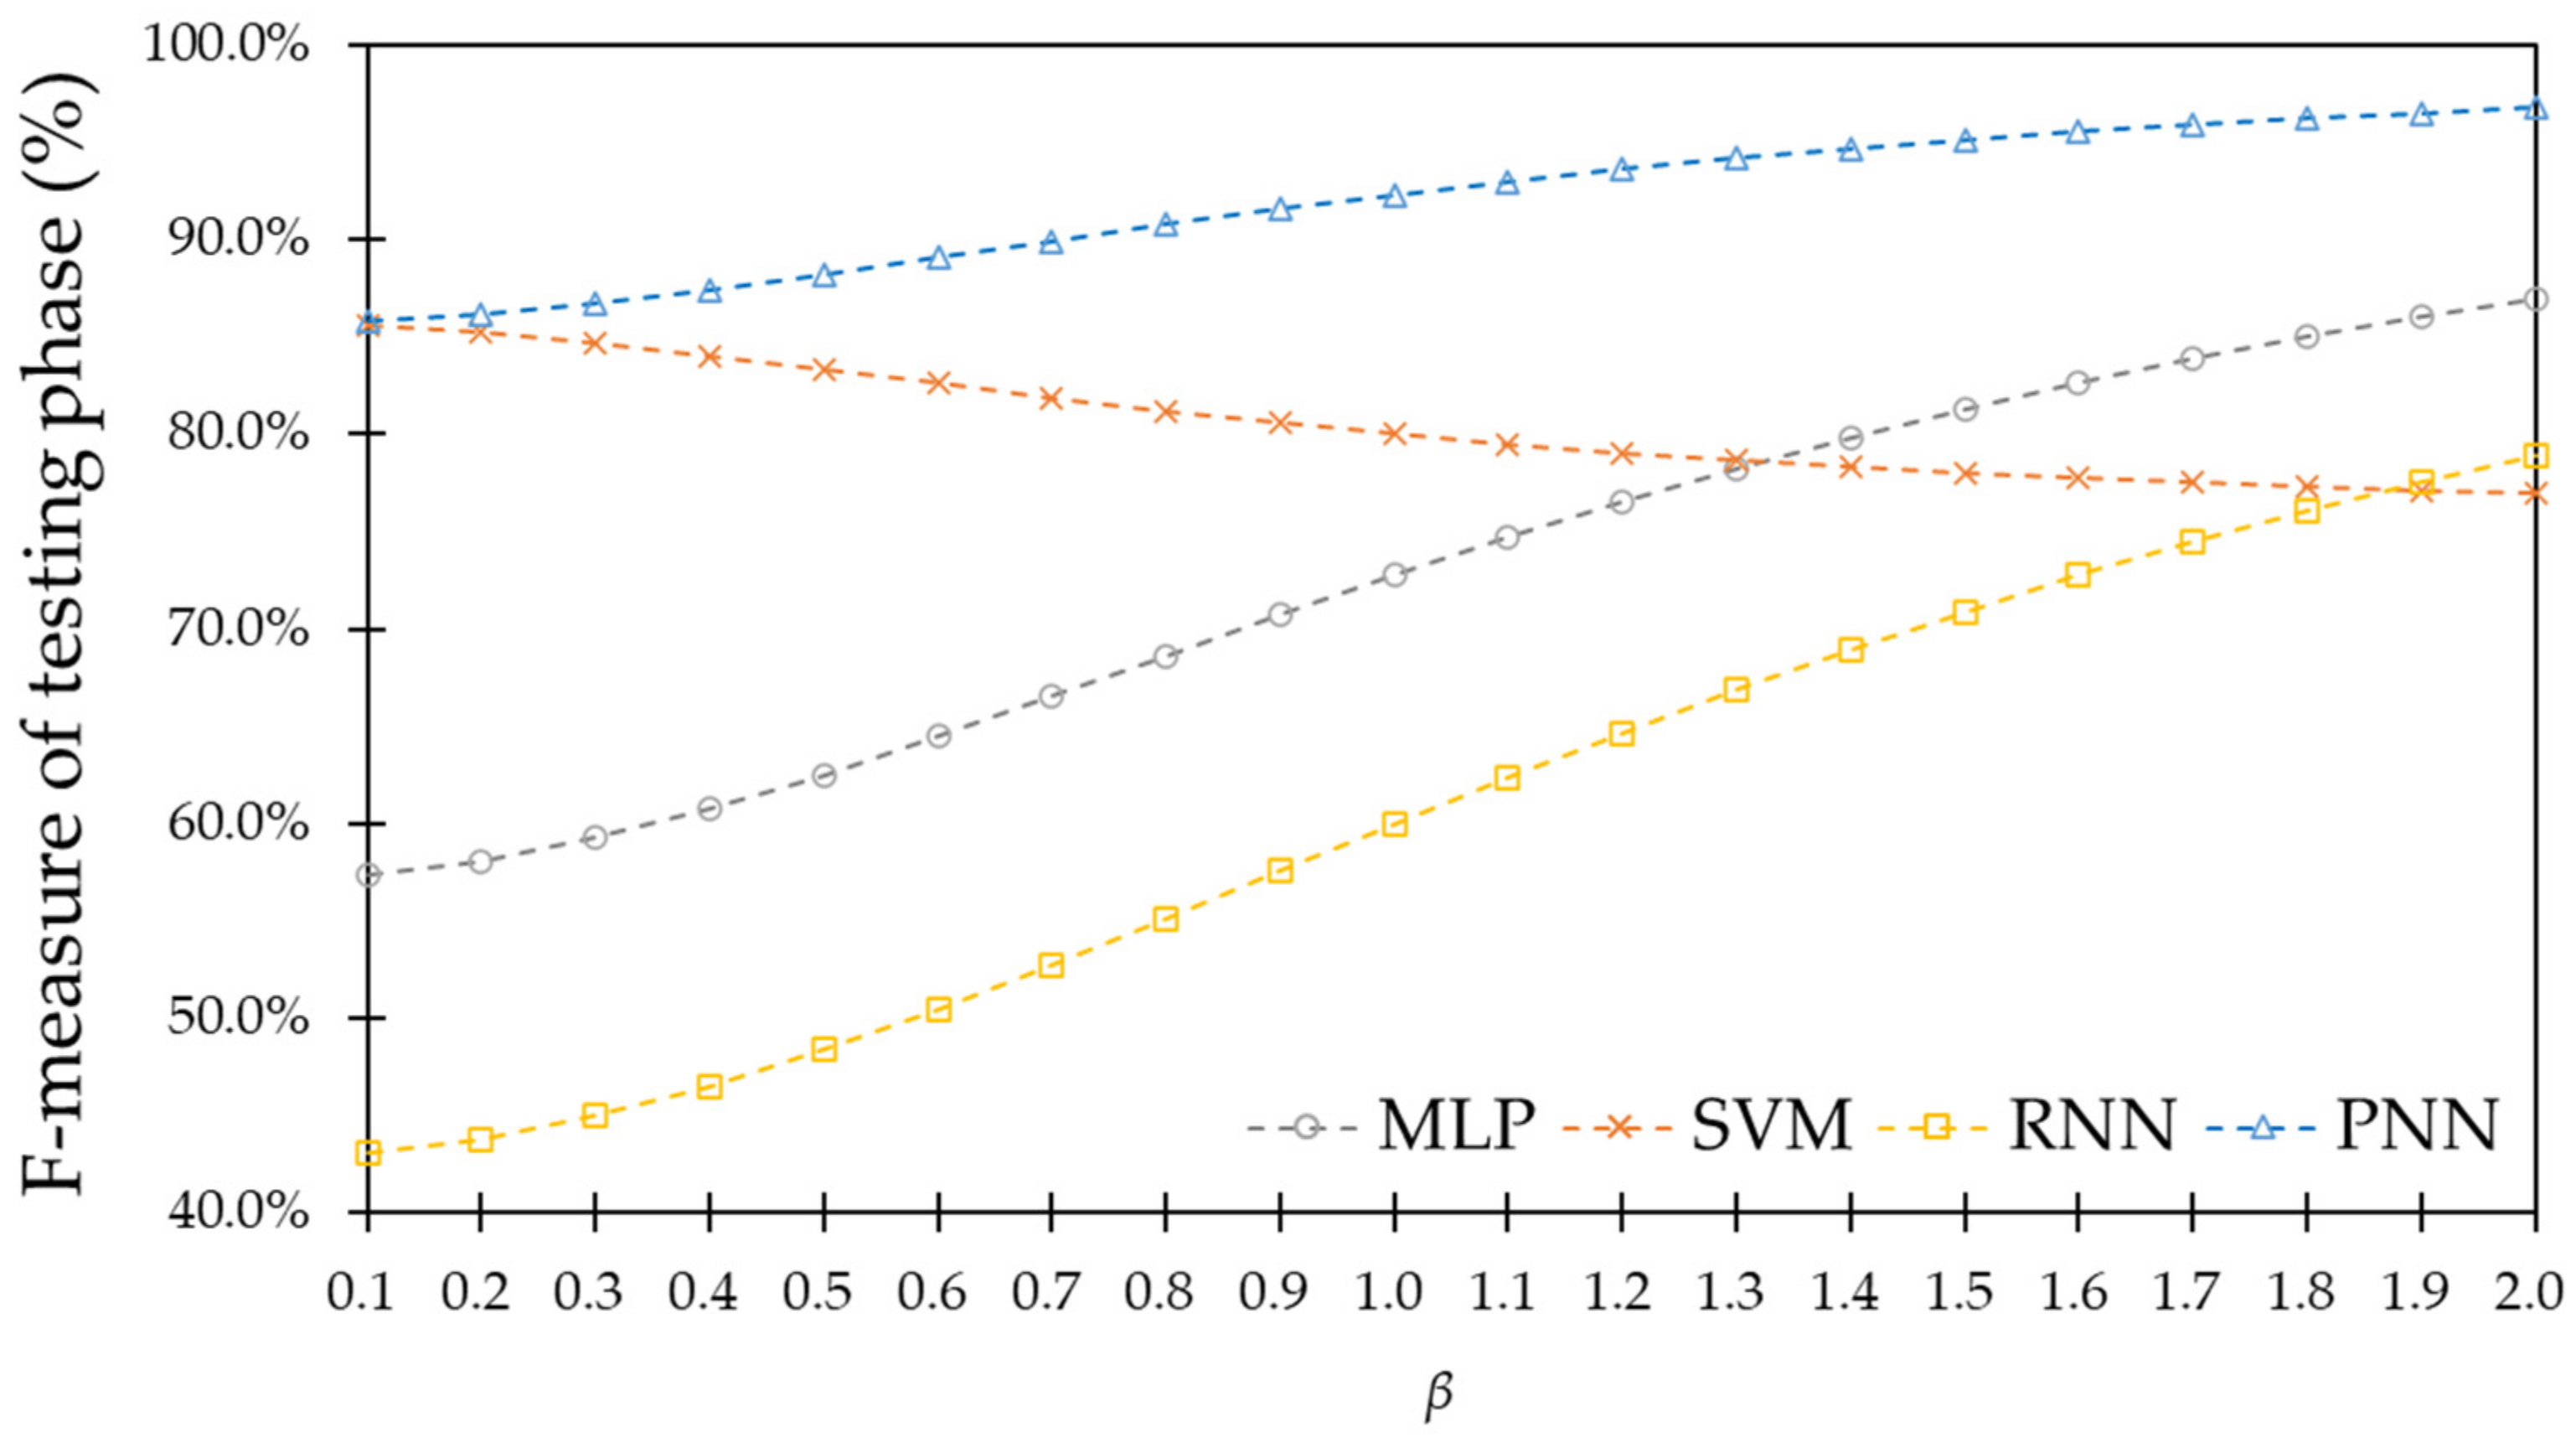
After data treatment, the ANN algorithms were applied, including traditional rice blast forecasting models MLP, SVM and Elman RNN, as well as a model not previously used for rice blast forecasting called PNN, to develop rice blast forecasting models. The developed models were mainly evaluated by F-measure, particularly with higher β, for which the infection event is more important than the noninfected period. Therefore, F2-scores were used for model performance assessment. The F2-scores for MLP, SVM, Elman RNN and PNN models were 87.0%, 76.9%, 59.5% and 96.8%, respectively. Comparing model performance with previous research, periods predicted have ranged from 14 to 15 days [56] to 1 year [14] in advance with model prediction accuracy of 79.4% [14] to 87.2% [56]. The only F1-score was obtained by Kim, Roh and Kim [14] with a value of 79.4%. In this study, the predicted period was 10 days, with accuracy 91.7% and F1-score 92.3%. The developed rice forecasting PNN model was found to perform similarly to or slightly better than models from previous studies. Thus, the PNN model is recommended for rice blast forecasting in the YCN area. Moreover, a sensitivity analysis (SA) was conducted of the PNN to evaluate the importance of factors in the model. D10 was found to have a stronger influence than D20. In addition, the most influential factors were Tmin and SE, followed by Tmax, TS and RHavg. The last factor Tavg was not found to have a significant influence in the model, perhaps because the contribution was accounted for by Tmin and Tmax. The impact of soil temperature (TS) may result from the phase lag in the diurnal variations of temperature (T). At some point in daily T and TS variation, TS is warmer than T (T < TS). Radiative cooling near the ground is very clear at night, leading to T values lower than TS [57]. In this case, a lower dewpoint has been reached. This causes RH to approach 100%, then mist appears in the field. Thus, the rice blast pathogen has an ideal environment for growth and spread. Under the opposite condition (T > TS), a similar mechanism also occurs.
Based on the developed rice blast forecasting model, a disease warning could be issued to farmers 10 days before the disease occurs and spreads across a vast area. Several prevention measures are possible to implement, such as ferric chloride, di-potassium hydrogen phosphate, salicylic acid, nano-chitosan and resistance-inducing compounds produced by F. solani [58,59,60,61]. Among them, the application of nano-chitosan and F. solani have been shown to exert 10 to 14 days of resistance ability. These could perhaps be used in conjunction with the model developed in this study.

5. Conclusions

Rice blast causes high yield losses across the world. Due to climate change, existing rice blast forecasting models may lose their accuracy. This study used random under-sampling method to prevent unequal proportional dataset by trimmed the not infected data from 146 to 31 (equal to the infected data). Finally, the ML-based rice blast forecasting models have been developed as a short-term (10 days before rice blast occurrence) warning for farmers to implement their prevention measures, such as nano-chitosan and F. solani. Moreover, unnoticed factors contributing to rice blast modeling was discovered. The soil temperature is an important factor because of the phase lag in the diurnal variations between air temperature and soil temperature. This may be considered relevant in further studies of rice blast disease. In addition, the established rice blast forecasting model in this study is based on large-scale environment observation. We suggest that in-situ environment monitoring system, e.g., Internet of Things based smart irrigation control system [62], may be used to collect microclimate for each field and to develop the small-scale rice blast forecasting model in further studies. Moreover, the large-scale dataset with advanced ML even deep learning algorithms, such as long short-term memory (LSTM), random vector functional link network (RVFL) and generative adversarial network (GAN), may be considered for the further research on rice blast forecasting.

Author Contributions

Conceptualization, Y.-M.W.; methodology, Y.-M.W., S.-J.L. and S.-H.H.; software, L.-W.L.; validation, Y.-M.W., S.-J.L., S.-H.H. and W.-S.L.; Writing—Original draft preparation, L.-W.L.; Writing—Review and editing, Y.-M.W. and W.-S.L.; visualization, L.-W.L.; supervision, Y.-M.W. and W.-S.L.; funding acquisition, Y.-M.W. and L.-W.L. All authors have read and agreed to the published version of the manuscript.

Funding

This research was partially funded by Ministry of Science and Technology (MOST), Taiwan, under the grant of “Graduate Students Study Abroad Program” (grant number 109-2917-I-020-001).

Institutional Review Board Statement

Not applicable.

Informed Consent Statement

Not applicable.

Data Availability Statement

Data sharing not applicable.

Acknowledgments

The authors gratefully acknowledge Jing-Qi Pan.

Conflicts of Interest

The authors declare no conflict of interest.

References

  1. Pennisi, E. Armed and dangerous. Science 2010, 327, 804. [Google Scholar] [PubMed] [Green Version]
  2. Kato, H. Rice blast disease. Pestic. Outlook 2001, 12, 23–25. [Google Scholar] [CrossRef]
  3. Wang, G.-L.; Valent, B. Durable resistance to rice blast. Science 2017, 355, 906–907. [Google Scholar] [CrossRef] [PubMed]
  4. Baker, B.; Zambryski, P.; Staskawicz, B.; Dinesh-Kumar, S. Signaling in plant-microbe interactions. Science 1997, 276, 726–733. [Google Scholar] [CrossRef] [PubMed]
  5. Skamnioti, P.; Gurr, S.J. Against the grain: Safeguarding rice from rice blast disease. Trends Biotechnol. 2009, 27, 141–150. [Google Scholar] [CrossRef] [PubMed] [Green Version]
  6. Nalley, L.; Tack, J.; Durand, A.; Thoma, G.; Tsiboe, F.; Shew, A.; Barkley, A. The production, consumption, and environmental impacts of rice hybridization in the United States. Agron. J. 2017, 109, 193–203. [Google Scholar] [CrossRef] [Green Version]
  7. Nalley, L.; Tsiboe, F.; Durand-Morat, A.; Shew, A.; Thoma, G. Economic and environmental impact of rice blast pathogen (Magnaporthe oryzae) alleviation in the United States. PLoS ONE 2016, 11, e0167295. [Google Scholar] [CrossRef]
  8. Wilson, R.A.; Talbot, N.J. Under pressure: Investigating the biology of plant infection by Magnaporthe oryzae. Nat. Rev. Microbiol. 2009, 7, 185–195. [Google Scholar] [CrossRef]
  9. Dean, R.; Van Kan, J.A.; Pretorius, Z.A.; Hammond-Kosack, K.E.; Di Pietro, A.; Spanu, P.D.; Rudd, J.J.; Dickman, M.; Kahmann, R.; Ellis, J. The Top 10 fungal pathogens in molecular plant pathology. Mol. Plant Pathol. 2012, 13, 414–430. [Google Scholar] [CrossRef] [Green Version]
  10. Wang, J.; Correll, J.; Jia, Y. Characterization of rice blast resistance genes in rice germplasm with monogenic lines and pathogenicity assays. Crop Prot. 2015, 72, 132–138. [Google Scholar] [CrossRef]
  11. Bhargava, T.; Hamer, J. Molecular aspects of host-pathogen interactions in the rice-blast system. In Major Fungal Diseases of Rice; Springer: Berlin/Heidelberg, Germany, 2001; pp. 61–86. [Google Scholar]
  12. Kaundal, R.; Kapoor, A.S.; Raghava, G.P. Machine learning techniques in disease forecasting: A case study on rice blast prediction. BMC Bioinform. 2006, 7, 485. [Google Scholar] [CrossRef] [PubMed] [Green Version]
  13. Sesma, A.; Osbourn, A.E. The rice leaf blast pathogen undergoes developmental processes typical of root-infecting fungi. Nature 2004, 431, 582–586. [Google Scholar] [CrossRef] [PubMed]
  14. Kim, Y.; Roh, J.-H.; Kim, H.Y. Early forecasting of Rice blast disease using long short-term memory recurrent neural networks. Sustainability 2018, 10, 34. [Google Scholar] [CrossRef] [Green Version]
  15. Talbot, N.J. Having a blast: Exploring the pathogenicity of Magnaporthe grisea. Trends Microbiol. 1995, 3, 9–16. [Google Scholar] [CrossRef]
  16. Ou, S.H. Rice Diseases; Commonwealth Mycological Institute: Kew, UK, 1985. [Google Scholar]
  17. Mousanejad, S.; Alizadeh, A.; Safaie, N. Effect of weather factors on spore population dynamics of rice blast fungus in Guilan Province. J. Plant Prot. Res. 2009. [Google Scholar] [CrossRef]
  18. Manibhushanrao, K.; Krishnan, P. Epidemiology of blast (EPIBLA): A simulation model and forecasting system for tropical rice in India. In Proceedings of the International Rice Research Conference, Seoul, Korea, 27–31 August 1991; pp. 31–38. [Google Scholar]
  19. Teng, P.; Klein-Gebbinck, H.; Pinnschmidt, H. An analysis of the blast pathosystem to guide modeling and forecasting. In Proceedings of the International Rice Research Conference, Seoul, Korea, 27–31 August 1991; pp. 1–30. [Google Scholar]
  20. Suzuki, H. Meteorological factors in the epidemiology of rice blast. Annu. Rev. Phytopathol. 1975, 13, 239–256. [Google Scholar] [CrossRef]
  21. Musiime, O.; Tenywa, M.; Majaliwa, M.; Lufafa, A.; Nanfumba, D.; Wasige, J.; Woomer, P.; Kyondha, M. Constraints to rice production in Bugiri district. In African Crop Science Conference Proceedings; Uganda, 2005; pp. 1495–1499. [Google Scholar]
  22. Sime, H.D.; Mbong, G.; Malla, D.; Suh, C. Effect of different doses of NPK fertilizer on the infection coefficient of rice (Orysa sativa L.) Blast in Ndop, North West of Cameroon. Agron. Afr. 2017, 29, 245–255. [Google Scholar]
  23. Han, S.; Ryu, J.; Shim, H.; Lee, S.; Hong, Y.; Cha, K. Breakdown of resistant cultivars by new race KI-1117a and race distribution of rice blast fungus during 1999–2000 in Korea. Res. Plant Dis. 2001, 7, 86–92. [Google Scholar]
  24. Katsantonis, D.; Kadoglidou, K.; Dramalis, C.; Puigdollers, P. Rice blast forecasting models and their practical value: A review. Phytopathol. Mediterr. 2017, 56, 187–216. [Google Scholar]
  25. Hemi, T.; Abe, T. A Study on Rice Blast (Part 2); Ministry of Agriculture: Kasumigaseki, Japan, 1932; Volume 47. [Google Scholar]
  26. Abe, T. On the influence of soil temperature upon the development of the blast disease of rice. Forsch. Gebiet Pflanzenkr. 1933, 2, 30–54. [Google Scholar]
  27. Hemi, T.; Abe, T.; Inoue, Y. Studies on Rice Blast (Part 6)-the Relationship between the Occurrence of Rice Blast and the Environment; Ministry of Agriculture: Kasumigaseki, Japan, 1941; Volume 157. [Google Scholar]
  28. Hashioka, Y. Studies on the rice blast disease in the tropics. IV. Influence of temperature of air and soil upon the resistance of the rice plants to the blast disease. Jpn. Soc. Trop. Agric. 1944, 15, 163–176. [Google Scholar]
  29. Suzuki, H. Studies on the relation between the susceptibility of pedicel of panicle (‘hokubid’) of rice plant to blast disease caused by low soil temperatures and its anatomical character. Annu. Rev. Phytopathol. 1951, 15, 72–78. [Google Scholar] [CrossRef] [Green Version]
  30. Asibi, A.E.; Chai, Q.; Coulter, J.A. Rice Blast: A Disease with Implications for Global Food Security. Agronomy 2019, 9, 451. [Google Scholar] [CrossRef] [Green Version]
  31. Mojerlou, S.; Mousanejad, S.; Safaie, N. Modeling fluctuation of Pyricularia grisea spore population as affected by meteorological factors in Guilan province (Iran) using artificial neural network. J. Crop Prot. 2013, 2, 501–514. [Google Scholar]
  32. Calvero, S.; Coakley, S.; Teng, P. Development of empirical forecasting models for rice blast based on weather factors. Plant Pathol. 1996, 45, 667–678. [Google Scholar] [CrossRef]
  33. Nettleton, D.F.; Katsantonis, D.; Kalaitzidis, A.; Sarafijanovic-Djukic, N.; Puigdollers, P.; Confalonieri, R. Predicting rice blast disease: Machine learning versus process-based models. BMC Bioinform. 2019, 20, 514. [Google Scholar] [CrossRef]
  34. Lin, G.-C. Occurrence and Comprehensive Management of Rice Blast in Yuin-Lin, Chia-Yi, and Tai-Nan Countues. In Agriculture Issue in Tainan District; Council of Agriculture (COA): Taipei, Taiwan, 2014; pp. 22–25. [Google Scholar]
  35. Central Weather Bureau, C. Column of Farming Activities, Agro-Meteorology, and Disasters. Available online: https://www.cwb.gov.tw/V8/C/L/agri_pdf.html (accessed on 12 May 2020).
  36. Rumelhart, D.E.; Hinton, G.E.; Williams, R.J. Learning representations by back-propagating errors. Nature 1986, 323, 533–536. [Google Scholar] [CrossRef]
  37. Vapnik, V. The Nature of Statistical Learning Theory; Springer Science & Business Media: Berlin, Germany, 1995. [Google Scholar]
  38. Van Evert, F.K.; Fountas, S.; Jakovetic, D.; Crnojevic, V.; Travlos, I.; Kempenaar, C. Big data for weed control and crop protection. Weed Res. 2017, 57, 218–233. [Google Scholar] [CrossRef] [Green Version]
  39. Haykin, S.S. Neural Networks: A Comprehensive Foundation; Prentice Hall: Hoboken, NJ, USA, 1999. [Google Scholar]
  40. Elman, J.L. Finding structure in time. Cogn. Sci. 1990, 14, 179–211. [Google Scholar] [CrossRef]
  41. Specht, D.F. Probabilistic neural networks. Neural Netw. 1990, 3, 109–118. [Google Scholar] [CrossRef]
  42. Traore, S.; Luo, Y.; Fipps, G. Deployment of artificial neural network for short-term forecasting of evapotranspiration using public weather forecast restricted messages. Agric. Water Manag. 2016, 163, 363–379. [Google Scholar] [CrossRef]
  43. Fernandes, S.; Setoue, K.; Adeli, H.; Papa, J. Fine-tuning enhanced probabilistic neural networks using metaheuristic-driven optimization. In Bio-Inspired Computation and Applications in Image Processing; Elsevier: Amsterdam, The Netherlands, 2016; pp. 25–45. [Google Scholar]
  44. Pan, J.; He, Y. Recognition of plants by leaves digital image and neural network. In Proceedings of the 2008 International Conference on Computer Science and Software Engineering, Wuhan, China, 12–14 December 2008; pp. 906–910. [Google Scholar]
  45. Jiang, Y.; Cukic, B.; Ma, Y. Techniques for evaluating fault prediction models. Empir. Softw. Eng. 2008, 13, 561–595. [Google Scholar] [CrossRef]
  46. Burgos-Artizzu, X.P.; Ribeiro, A.; Guijarro, M.; Pajares, G. Real-time image processing for crop/weed discrimination in maize fields. Comput. Electron. Agric. 2011, 75, 337–346. [Google Scholar] [CrossRef] [Green Version]
  47. Gan, H.; Lee, W.S.; Alchanatis, V.; Ehsani, R.; Schueller, J.K. Immature green citrus fruit detection using color and thermal images. Comput. Electron. Agric. 2018, 152, 117–125. [Google Scholar] [CrossRef]
  48. Majeed, Y.; Zhang, J.; Zhang, X.; Fu, L.; Karkee, M.; Zhang, Q.; Whiting, M.D. Apple tree trunk and branch segmentation for automatic trellis training using convolutional neural network based semantic segmentation. IFAC-Pap. 2018, 51, 75–80. [Google Scholar] [CrossRef]
  49. Zhao, B.; Zhang, J.; Yang, C.; Zhou, G.; Ding, Y.; Shi, Y.; Zhang, D.; Xie, J.; Liao, Q. Rapeseed seedling stand counting and seeding performance evaluation at two early growth stages based on unmanned aerial vehicle imagery. Front. Plant Sci. 2018, 9, 1362. [Google Scholar] [CrossRef]
  50. Zhang, J.; He, L.; Karkee, M.; Zhang, Q.; Zhang, X.; Gao, Z. Branch detection for apple trees trained in fruiting wall architecture using depth features and Regions-Convolutional Neural Network (R-CNN). Comput. Electron. Agric. 2018, 155, 386–393. [Google Scholar] [CrossRef]
  51. Majeed, Y.; Zhang, J.; Zhang, X.; Fu, L.; Karkee, M.; Zhang, Q.; Whiting, M.D. Deep learning based segmentation for automated training of apple trees on trellis wires. Comput. Electron. Agric. 2020, 170, 105277. [Google Scholar] [CrossRef]
  52. Jha, M.K.; Sahoo, S. Efficacy of neural network and genetic algorithm techniques in simulating spatio-temporal fluctuations of groundwater. Hydrol. Processes 2015, 29, 671–691. [Google Scholar] [CrossRef]
  53. Hsieh, S.-H.; Liu, L.-W.; Chung, W.-G.; Wang, Y.-M. Sensitivity analysis on the rising relation between short-term rainfall and groundwater table adjacent to an artificial recharge lake. Water 2019, 11, 1704. [Google Scholar] [CrossRef] [Green Version]
  54. Yap, B.W.; Rani, K.A.; Rahman, H.A.A.; Fong, S.; Khairudin, Z.; Abdullah, N.N. An application of oversampling, undersampling, bagging and boosting in handling imbalanced datasets. In Proceedings of the First International Conference on Advanced Data and Information Engineering; (DaEng-2013); Springer: Singapore, 2014; pp. 13–22. [Google Scholar] [CrossRef]
  55. Laza, R.; Pavón, R.; Reboiro-Jato, M.; Fdez-Riverola, F. Evaluating the effect of unbalanced data in biomedical document classification. J. Integr. Bioinform. 2011, 8, 105–117. [Google Scholar] [CrossRef]
  56. Chen, W.-L.; Lin, Y.-B.; Ng, F.-L.; Liu, C.-Y.; Lin, Y.-W. RiceTalk: Rice Blast Detection using Internet of Things and Artificial Intelligence Technologies. IEEE Internet Things J. 2019, 7, 1001–1010. [Google Scholar] [CrossRef]
  57. Jin, M.S.; Mullens, T. A study of the relations between soil moisture, soil temperatures and surface temperatures using ARM observations and offline CLM4 simulations. Climate 2014, 2, 279–295. [Google Scholar] [CrossRef] [Green Version]
  58. Manandhar, H.; Jørgensen, H.L.; Mathur, S.; Smedegaard-Petersen, V. Resistance to rice blast induced by ferric chloride, di-potassium hydrogen phosphate and salicylic acid. Crop Prot. 1998, 17, 323–329. [Google Scholar] [CrossRef]
  59. Mentlak, T.A.; Kombrink, A.; Shinya, T.; Ryder, L.S.; Otomo, I.; Saitoh, H.; Terauchi, R.; Nishizawa, Y.; Shibuya, N.; Thomma, B.P. Effector-mediated suppression of chitin-triggered immunity by Magnaporthe oryzae is necessary for rice blast disease. Plant Cell 2012, 24, 322–335. [Google Scholar] [CrossRef] [Green Version]
  60. Cheng, P.; Meng, F.; Zhang, D. Fatal Fusarium solani infection after stem cell transplant for aplastic anemia. Exp. Cinical Transplant. 2014, 12, 384–387. [Google Scholar]
  61. Manikandan, A.; Sathiyabama, M. Preparation of chitosan nanoparticles and its effect on detached rice leaves infected with Pyricularia grisea. Int. J. Biol. Macromol. 2016, 84, 58–61. [Google Scholar] [CrossRef]
  62. Liu, L.-W.; Ismail, M.H.; Wang, Y.-M.; Lin, W.-S. Internet of Things based Smart Irrigation Control System for Paddy Rice Field. AGRIVITA J. Agric. Sci. 2021, 43. [Google Scholar] [CrossRef]
Figure 1. The symptom of rice blast in (a) leaf and (b) panicle.
Agronomy 11 00771 g001
Figure 2. Map showing the location of the Yuin-Chia-Nan (YCN) area.
Agronomy 11 00771 g002
Figure 3. F-measure comparison of MLP, SVM, Elman RNN and PNN model testing phases.
Agronomy 11 00771 g003
Table 1. The planting area and yield in the study area.
CountyPaddy Rice
Planting AreaHarvest Amount
Ha%Ton%
Yuin-Lin44,83416.6%268,96518.8%
Chia-Yi 32,72512.1%190,63613.3%
Tai-Nan24,0768.9%131,1569.2%
Sum.101,63637.6%590,75741.4%
Taiwan270,068100.0%1,428,251100.0%
Table 2. The rice blast incidence in the YCN area [34].
YearRice Blast Rate (%)
200942.55%
201028.28%
201137.39%
201259.42%
201375.72%
Avg.48.67%
Table 3. Illustration of the confusion matrix.
Predicted Rice Blast
PositiveNegative
Actual rice blastTrueTrue positive (TP)False negative (FN)
FalseFalse positive (FP)True negative (TN)
Table 4. Dataset differences significance test by independent sample t-test.
VariablesStationsD10D20
p-ValueSignificance *p-ValueSignificance *
TminYL0.9130-0.8784-
CY0.9212-0.9332-
TN0.8189-0.8353-
TmaxYL0.8385-0.8384-
CY0.7311-0.8691-
TN0.9371-0.8472-
TavgYL0.7802-0.9516-
CY0.9714-0.9145-
TN0.9316-0.8134-
TSYL0.8702-0.3495-
CY0.7992-0.9077-
TN0.7836-0.8992-
RHavgYL0.9807-0.4614-
CY0.2147-0.3983-
TN0.5544-0.5282-
SEYL0.7527-0.8487-
CY0.9685-0.3542-
TN0.9791-0.2499-
* Symbol “-” represent the differences between original 177 AMB data and the 31 data after random under-sampling (RUS) in not significant under p-value of 0.05.
Table 5. Confusion matrix of MLP, SVM, Elman RNN and PNN model.
Predicted
PositiveNegative
MLPSVMElman RNNPNNMLPSVMElman RNNPNN
ActualTrueTraining919619219419
CV33230100
Testing46360200
Total16281128222419
FalseTraining100120170160
CV22327677
Testing31415355
Total1531932992812
Table 6. Model performance of MLP, SVM, Elman RNN and PNN model.
IndicesMLPSVM
TrainingCVTestingTrainingCVTesting
Accuracy (a)68.4%83.3%75.0%100.0%75.0%75.0%
Precision (p)47.4%60.0%57.1%100.0%60.0%85.7%
Recall (r) 81.8%100.0%100.0%100.0%75.0%75.0%
F0.5-score (F0.5)51.7%65.2%62.5%100.0%62.5%83.3%
F1-score (F1)60.0%75.0%72.7%100.0%66.7%80.0%
F2-score (F2)71.4%88.2%87.0%100.0%71.4%76.9%
IndicesElman RNNPNN
TrainingCVTestingTrainingCVTesting
Accuracy (a)57.9%75.0%66.7%100.0%83.3%91.7%
Precision (p)33.3%40.0%42.9%100.0%60.0%85.7%
Recall (r) 75.0%100.0%100.0%100.0%100.0%100.0%
F0.5-score (F0.5)37.5%45.5%48.4%100.0%65.2%88.2%
F1-score (F1)46.2%57.1%60.0%100.0%75.0%92.3%
F2-score (F2)60.0%76.9%78.9%100.0%88.2%96.8%
Table 7. Evaluation stander of sensitivity and associated ranks.
Sensitivity EvaluationValue of SIRank
1. Very high sensitivity>0.11
2. High sensitivity0.05 to 0.12
3. Moderate sensitivity0.01 to 0.053
4. Low sensitivity0.005 to 0.014
5. Very low sensitivity≤0.0055
Table 8. Sensitivity analysis results and ranked result of the PNN model.
VariablesStationsD10D10 RankD20D20 Rank
TminYL0.358028910.00000875
CY0.399011410.00003445
TN0.312989310.00000625
TmaxYL0.000023150.00107755
CY0.192436510.00944834
TN0.000041550.00018205
TavgYL0.000875650.00025445
CY0.001325250.00007345
TN0.000339650.00062735
TSYL0.007381940.12954561
CY0.000383550.00000435
TN0.000000150.00099625
RHavgYL0.128192010.02250783
CY0.000014950.00003775
TN0.000405650.00020795
SEYL0.155232110.00243495
CY0.000007250.22052851
TN0.000227150.26557211
Table 9. Rebuild SA-based PNN model (SA-PNN) modeling result.
Predicted
TrainingCVTesting
ActualClassPositiveNegativePositiveNegativePositiveNegative
True2043262
False0142504
Table 10. Model performance comparison between established PNN model and SA-based PNN (SA-PNN) model.
IndicesTrainingCVTesting
PNNSA-PNNPNNSA-PNNPNNSA-PNN
Accuracy (a)100.0%89.5%83.3%66.7%91.7%83.3%
Precision (p)100.0%100.0%60.0%60.0%85.7%100.0%
Recall (r)100.0%83.3%100.0%60.0%100.0%75.0%
F0.5-score (F0.5)100.0%96.2%65.2%60.0%88.2%93.8%
F1-score (F1)100.0%90.9%75.0%60.0%92.3%85.7%
F2-score (F2)100.0%86.2%88.2%60.0%96.8%78.9%
Publisher’s Note: MDPI stays neutral with regard to jurisdictional claims in published maps and institutional affiliations.

