Article

Amaranthus retroflexus L. (Redroot Pigweed): Effects of Elevated CO2 and Soil Moisture on Growth and Biomass and the Effect of Radiant Heat on Seed Germination

by
Sandra Weller
1,
Singarayer Florentine
1,*,
Muhammad Mansoor Javaid
2,
Amali Welgama
1,
Aakansha Chadha
1,
Bhagirath Singh Chauhan
3 and
Christopher Turville
4
1
Centre for Environmental Management, School of Science, Psychology and Sport, Federation University, Mount Helen, VIC 3350, Australia
2
Department of Agronomy, University College of Agriculture, University of Sargodha, Sargodha 40100, Pakistan
3
Queensland Alliance for Agriculture and Food Innovation (QAAFI) and School of Agriculture and Food Sciences (SAFS), The University of Queensland, Gatton, QLD 4343, Australia
4
School of Engineering, IT and Physical Sciences, Federation University, Mount Helen, VIC 3350, Australia
*
Author to whom correspondence should be addressed.
Agronomy 2021, 11(4), 728; https://doi.org/10.3390/agronomy11040728
Submission received: 14 March 2021 / Revised: 29 March 2021 / Accepted: 3 April 2021 / Published: 9 April 2021
(This article belongs to the Special Issue Agriculture and Crop Protection: Relationship with Climate Change)

Abstract

:
Amaranthus retroflexus L. (Amaranthaceae), Redroot pigweed, is native to North America, but has become a weed of agriculture worldwide. Previous research into competition with food crops found it significantly reduces yields. Additionally, taxonomy, biomass allocation, physiological responses to light intensity, water stress, elevated CO2, and herbicide resistance have been investigated. To extend other research findings, we investigated growth and biomass yield in response to (i) soil moisture stress, and (ii) drought and elevated CO2. Additionally, we investigated seed germination rates following exposure to three elevated temperatures for two different time periods. Overall, moisture stress reduced plant height, stem diameter, and number of leaves. Elevated CO2 (700 ppm) appeared to reduce negative impacts of drought on biomass productivity. Heating seeds at 120 °C and above for either 180 or 300 s significantly reduced germination rate. These results inform an understanding of potential responses of A. retroflexus to future climate change and will be used to predict future occurrence of this weed. The finding that exposing seeds to high temperatures retards germination suggests fire could be used to prevent seed germination from soil seed banks, particularly in no-till situations, and therefore may be used to address infestations or prevent further spread of this weed.

1. Introduction

Amaranthus retroflexus L. (Amaranthaceae) is native to North America, has become a naturalized weed in many countries in both the Northern and Southern hemispheres [1,2], and is classified as a noxious weed in Canada [3]. This species, and those closely related to it, provided an important grain food crop for the Aztec civilization of central America [4], although it is no longer used for this purpose. It is an annual C4 species capable of producing up to 100,000 seeds per plant [1], although this can be much higher under optimum growing conditions [5]. Seeds are principally dispersed by wind, water, and animals, but also through human disturbance, e.g., when entrapped in soil on farming machinery. Although some researchers report seeds may remain viable for prolonged periods [1], others have concluded that viability of buried seeds is significantly reduced after two years [6]. Because the seeds are small (approximately 1 mm) germinants typically emerge from relatively shallow soil depths [7].
This species is tolerant of a range of soil types, but prefers nutrient-enriched soils, particularly those with high levels of nitrogen fertilizer [8]. It can tolerate a wide pH range (4.2 to 9.1), although it is less common in acidic soils [9]. It is thus unsurprising that it is one of the most common agricultural weeds, affecting over 25 species of agricultural commodities from 14 different families, including Poaceae: oats (Avena sativa), sorghum (Sorghum bicolor), wheat (Triticum sp.) and maize (Zea mays); Fabaceae: soybean (Glycine max), pea (Pisum sativum), and peanut (Arachis hypogaea); Asteraceae: sunflowers (Helianthus sp.); Chenopodiaceae: beetroot (Beta vulgaris subsp. vulgaris); Brassicaceae: canola (Brassica napus); Solanaceae: capsicum (Capsicum annuum) and potato (Solanum tuberosum); Liliaceae: onion (Allium cepa) and asparagus (Asparagus officinalis) [1].
This species poses a threat to both crop production and livestock. It is an aggressive competitor with crop species, partly due to allelopathic compounds [10], as well as a host for numerous pests and diseases of crop species [3]. Although it is sometimes cited as a useful and possibly nutritious forage resource [3], livestock may be poisoned by it due to its capacity to concentrate oxalates and nitrates in leaves, stems, and branches [11,12,13,14]. Chemical control has been successfully used in past decades to manage this weed, but it has recently begun to develop resistance to multiple herbicides [15,16,17]. The impacts of A. retroflexus on agriculture in Australia have not been well researched, apart from one investigation regarding whether it, and related species, might damage cotton crops [18].
Much of the previous research of this weed from overseas has revealed a wealth of information about its biology, ecology, and impacts on agriculture. However, more information about biomass productivity and physiological responses of these plants from reduced soil water availability, together with the combined impacts of drought and elevated CO2, will increase understanding of the potential future impacts of this weed on cropping species under climate change [19]. The current research investigates the effects of variable soil moisture availability (100%, 70%, 50%, and 25% of water holding capacity) on the growth of this species, as well as the responses of plants exposed to drought in combination with two different atmospheric concentrations of CO2, the current concentration of atmospheric CO2 400 ppm (ambient) and 700 ppm (elevated). Additionally, heat treatment of seeds prior to germination was investigated to predict the effects of fire on the soil seed bank. Stubble burning is an established control method for other weed species [20], and it may become necessary as an alternate to herbicide application for this species [15,16,17]. This work aims to derive a more thorough understanding of how anthropogenic climate change affects the biology and ecology of this important agricultural weed, through a closer investigation of some principles of its basic biology, since the combined effects of elevated atmospheric carbon dioxide and drought on this species are yet to be fully understood. This will enable more accurate predictions for the response of this species to control factors and give guidance for future research into control measures.

2. Materials and Methods

2.1. Effects on Growth Rate and Biomass Productivity by Variation of Soil Moisture

To assess the effect of variation in soil moisture on A. retroflexus, 40 plants were grown from seeds obtained from Gatton (Queensland, Australia: Long. −27.540310; Lat, 152.336029). The seeds were germinated in 13 cm wide and 14 cm high pots in a 2:1 mixture of garden soil and potting mix. Plants were grown to maturity over an eight-week period under 24/18 °C day/night conditions with 60–70% relative humidity. After the seeds were planted and germinants had achieved (2 leaf stage), four sets of 10 plants were randomly allocated to the soil moisture treatments. These treatments comprised four different soil moisture percentages, based on the soil water holding capacity (100, 75, 50, and 25%). Pots were weighed every 2–3 days and the required amount of water was added to ensure constancy of soil moisture percentage.

2.1.1. Growth Rate over Time

To record growth rate over time, weekly measurements of plant height, stem diameter, and number of leaves were taken for the following eight weeks.

2.1.2. Biomass Productivity

After the conclusion of the experiment in week 9, plants were harvested, and the final growth parameters for shoots (height, fresh and dry weights), roots (length, fresh and dry weights), leaves (number per plant and total leaf area), and inflorescences (length) was recorded. To obtain these measures, plants were removed from pots and the stems cut from roots. The roots were carefully washed and allowed to air dry. Fresh weights of stems and roots were recorded, after which each was placed into separate paper bags, dried in a laboratory oven at 70 °C for 48 h and weighed to obtain the dry weight results.

2.2. Effects on Photosynthetic Response and Biomass Productivity by Drought Conditions and Elevated CO2 Levels

Seed from the same source previously described was used to grow four sets of five plants to maturity, by the same method described in Part 1 (20 plants in total). Each set of plants was randomly assigned to one of four CO2 and drought treatments: (i) well-watered and ambient CO2; (ii) well-watered and elevated CO2; (iii) drought conditions and ambient CO2 and (iv) drought conditions and elevated CO2. Ten plants were placed into each of two CO2 cabinets, with five plants for each of the two water treatments. One cabinet was set to 400 ppm CO2, representing the current ambient atmospheric CO2 concentration, and the other at 700 ppm, representing projected atmospheric CO2 concentrations by 2100 [21].
To mirror drought conditions, water was withheld from the drought treatment plants for 10 days, after which normal watering was recommenced for two days (12 days in total). This allowed the observation of plant response during recovery after drought. The other ten plants were watered normally throughout the entire treatment time.

2.2.1. Physiological Responses

To quantify the effect of CO2 exposure under drought conditions, 10 plant physiological response parameters were recorded with a LICOR (6400 XT) instrument. These parameters were (i) photosynthesis rate (Photo), (ii) stomatal conductance (Cond), (iii) transpiration rate (Tμmol), (iv) intercellular CO2 concentration (Ci), (v) photochemical efficiency of Photosystem 2 (PSII), (vi) photochemical quenching (qP), (vii) minimum fluorescence (Fo’), (viii) maximum fluorescence (Fm’), (ix) quantum yield of PSII (φPSII) (Fv’/Fm’), and (x) vapor pressure deficit based on leaf temperature (vpdl). All parameters were recorded after dark adaptation of the leaves, on every second day for the entire 12 days of this experiment.
Block and leaf temperature was kept at 20 °C during all measurements based on the average temperature of the CO2 chamber. Photosynthetic photon flux density was kept at 1000 µmol m−1 s−1 which was the same as that in the CO2 chamber. Leaf cuvette area was set at 2 cm2 and flow rate was adjusted to 500 µmol m−2 s−1.

2.2.2. Partitioned Biomass

To measure the amount of biomass produced according to type of plant anatomical structure (stems, branches, leaves, roots), the plants were harvested at the conclusion of the experiment on day 12. Plants were removed from pots and stems were cut from the roots. Fresh plant material was used to record the final growth parameters of plant height, stem diameter, number of branches per plant, number of leaves per plant, total leaf area, leaf thickness and shoot fresh weight, as well as root fresh weight after these were carefully washed and air dried. Stems, leaves and roots were placed separately in paper bags, dried in a laboratory oven at 70 °C for 48 h and weighed to obtain the dry weight results. The following 12 measurements were recorded; (i) plant height, (ii) stem diameter was measured with digital caliper, (iii) shoot fresh weight, (iv) shoot dry weight, (v) root fresh weight, (vi) root dry weight, (vii) leaf thickness was measured with digital caliper, (viii) total leaf area per plant, (ix) number of leaves per plant, (x) number of branches per plant, (xi) fresh weight of leaves, and (xii) dry weight of leaves.

2.3. Effect on Seed Germination from Exposure to Varying Temperatures

To investigate the effect of radiant heat from fire on germination of A. retroflexus, seeds (sourced as for Part 1) were exposed to three different temperatures (60, 120 and 180 °C) in a laboratory oven (Model: ULE500; Manufacturer: Memmert, Schwabach, Germany) for two different time periods (180 and 300 s). Afterwards, six replicates of 20 seeds from each temperature treatment were placed into Petri dishes on filter paper moistened with RO water, then into a seed germination cabinet (30/20 °C) and monitored for 30 days. When the seeds had produced a radicle 2 mm long, germination was judged to be successful [22].

2.4. Statistical Analysis

For the parameters relating to (i) soil moisture availability (plant growth over time and biomass after harvest), and (ii) moisture treatment and exposure to CO2 (biomass after harvest), the means and standard errors were calculated using Microsoft Excel (2013).
For each parameter, SPSS (26.0) was used to perform a two-factor repeated measures ANOVA, including Tukey’s HSD post-hoc test, to determine which of the factors of water availability or time of measurement, and, separately, drought or CO2, was the most influential on the results, and whether there was any interaction between these factors. Any significant interactions were investigated by examining the simple main effects with Bonferroni adjustments. To investigate the effects of drought and recovery following re-watering, results of the 10 physiological parameters recorded on days 0, 10 and 12 were analysed with SPSS (26.0), using a three-factor ANOVA. These factors were (i) time of observation, (ii) level of CO2 and (iii) water treatment. The interactions of these factors were also analysed. Each response was analysed separately using a repeated-measures ANOVA with the three time periods as the ‘within’ subjects’ factor and the CO2 and water treatment as the ‘between’ factors. Data obtained on the effect of seed germination from exposure to varying temperatures were analysed using two-way ANOVA. All main effects and two-way interactions were examined, with any significant main effects further investigated using Tukey’s HSD test. Any significant interactions were investigated by examining the simple main effects with Bonferroni adjustments.

3. Results

3.1. Effects on Growth Rate and Biomass Productivity by Variation of Soil Moisture

3.1.1. Growth Rate of Plants

The trends for weekly measurements of plant height, stem diameter, and number of leaves are presented in Figure 1a–c. The ANOVA results obtained from SPSS 26.0 are given in Table 1.
Overall, moisture stress reduced plant height, stem diameter and number of leaves, with a clustering of results separating the higher (≥75%) from the lower (≤50%) moisture levels. For each of the three growth parameters (plant height, stem diameter and number of leaves), moisture and time were significant (p < 0.001), and the interaction of moisture and time were significant for stem diameter and number of leaves (p = 0.002), but not plant height (p = 0.072) (Table 1).
Whilst the initial growth rates in the early weeks showed little difference, by week 3 the plants in the 100% and 75% water treatments were taller than those in the other two treatments (Figure 1a). The differences between these two sets of treatments increased through the remainder of the experiment, and after week 7 the plants in the 75% water treatment were taller than those in all other treatments.
The pattern of results for stem diameter over the duration of the experiment were similar to those observed for plant height (Figure 1b). After three weeks, the 100% and 75% treatments had thicker stems compared to the other two treatments. These differences then remained steady for the duration of the experiment.
After two weeks, the 100% and 75% treatments had more leaves compared to the other two treatments (Figure 1c). After three weeks, the 75% treatment had produced the largest number of leaves and the 25% treatment had produced the lowest. This pattern continued throughout the experiment with the differences in number of leaves diverging over time.

3.1.2. Partitioned Biomass of Plants

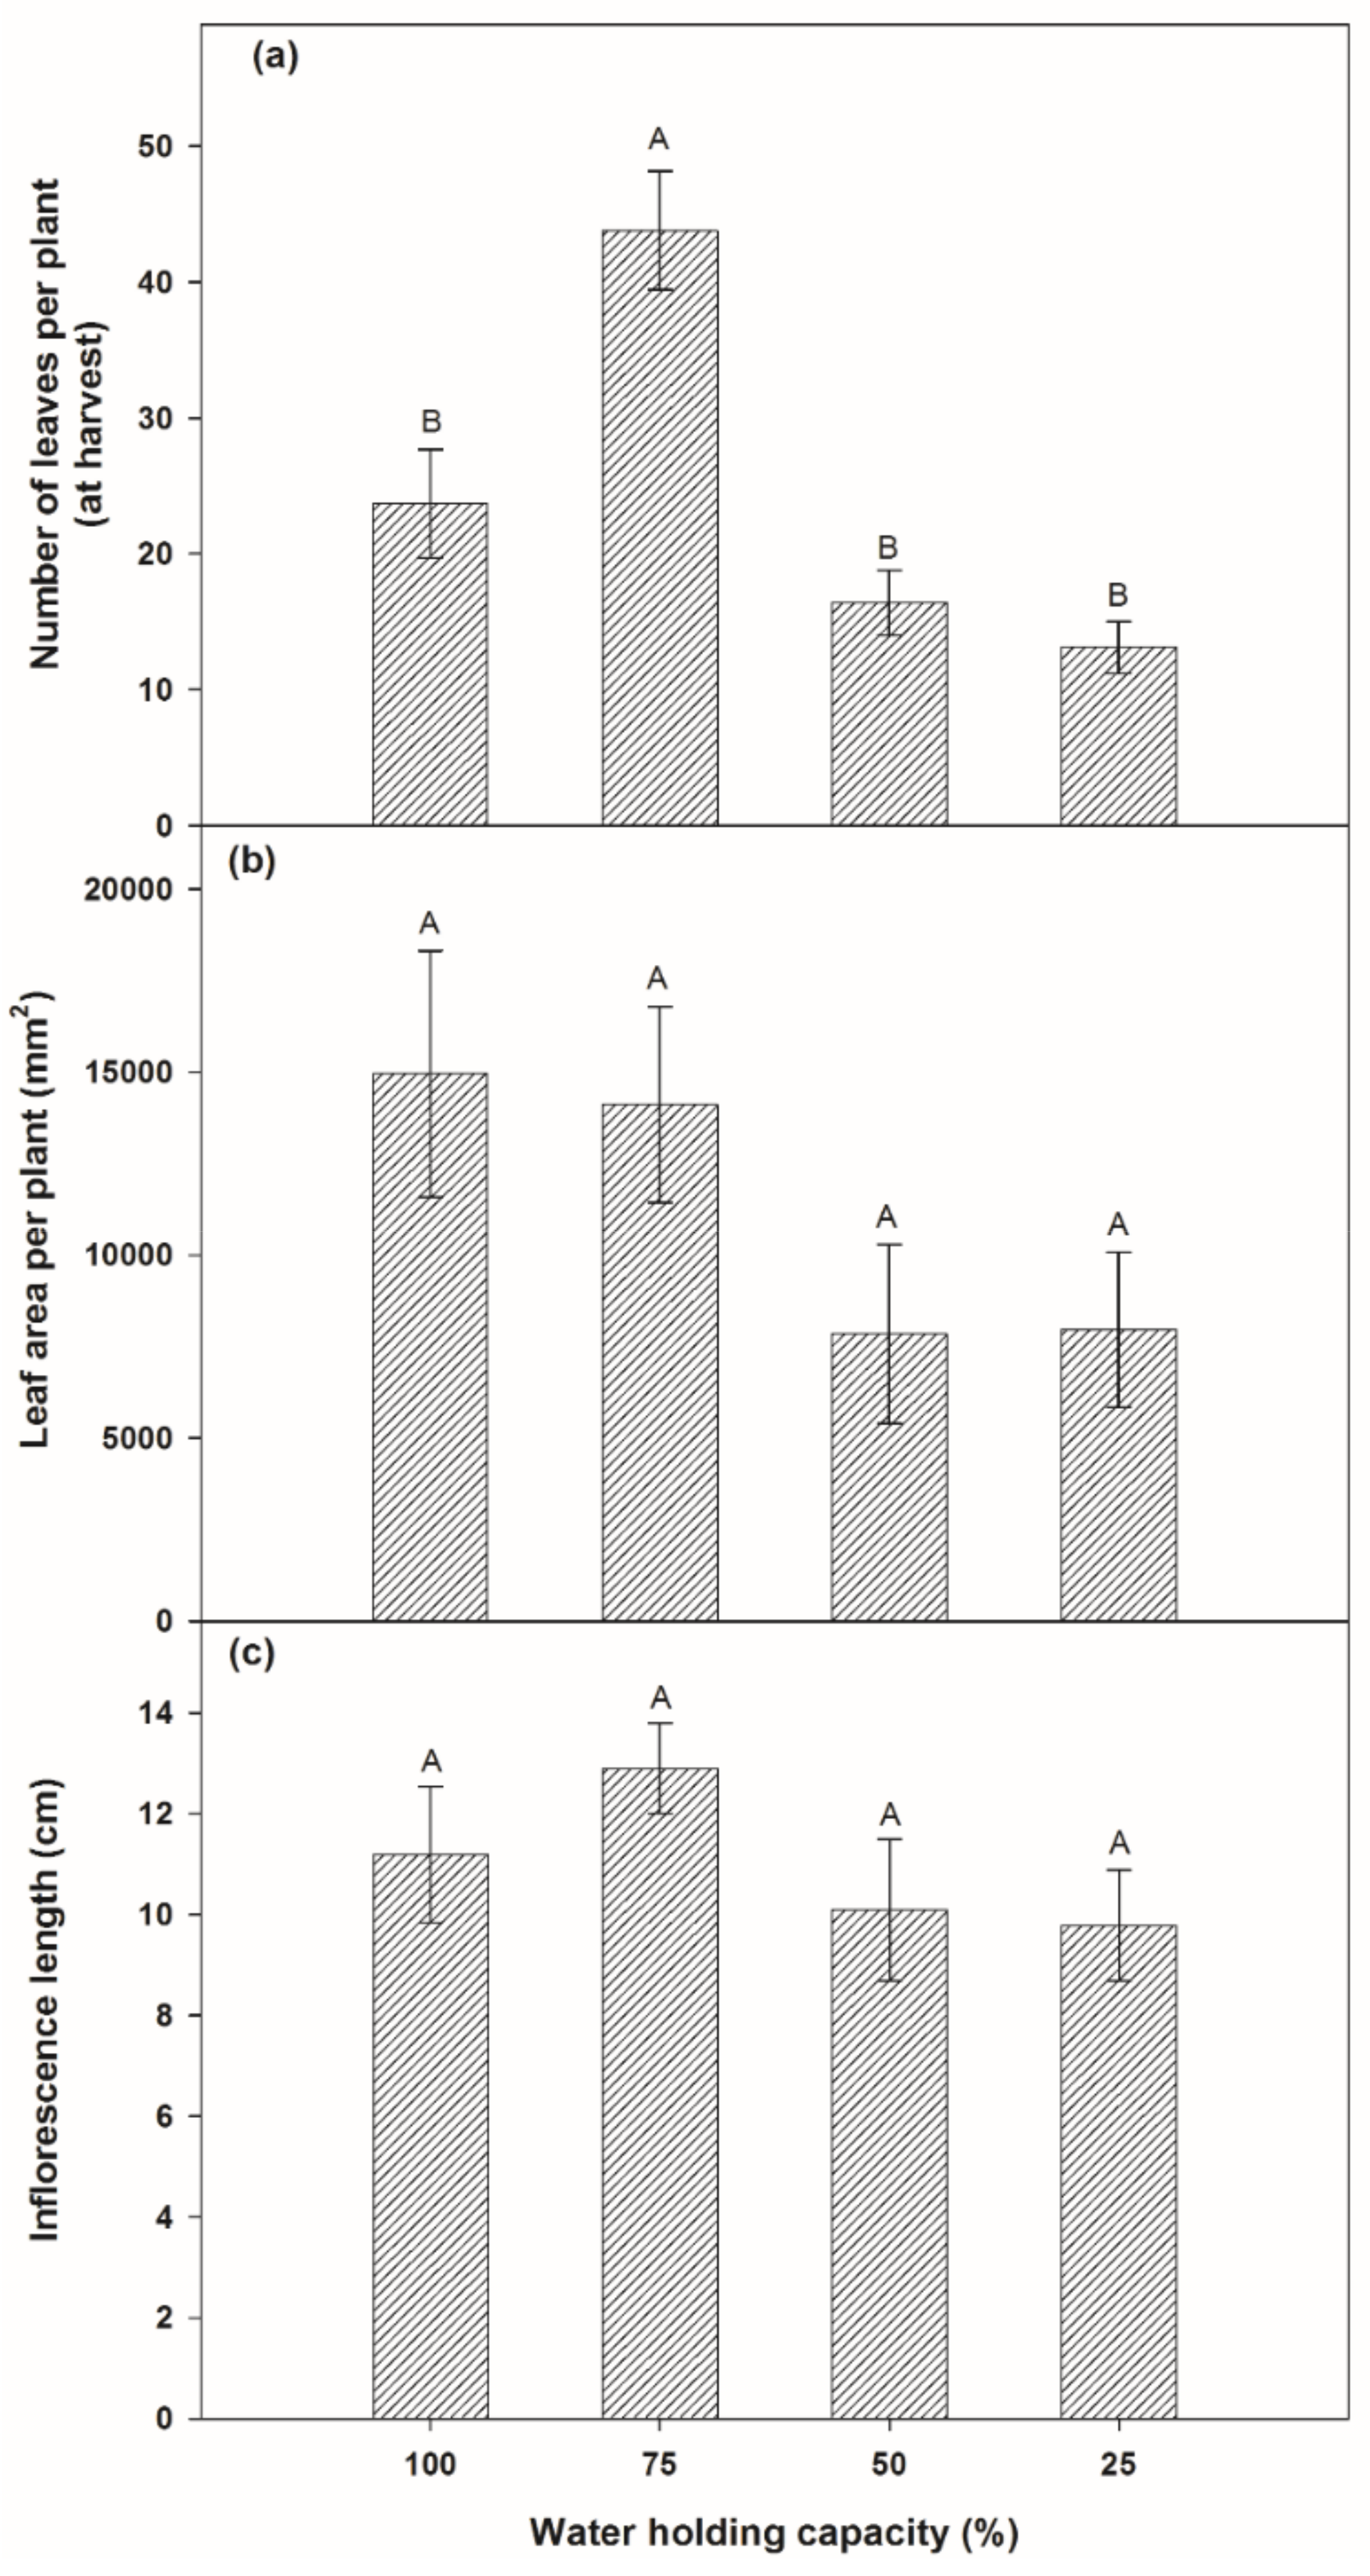
Comparative trends for shoots (height, fresh and dry weights) and roots (length, fresh and dry weights) are shown in Figure 2a–f. The results for leaves (number per plant and total leaf area), and inflorescences (length) are shown in and Figure 3a–c. The ANOVA results obtained from SPSS 26.0 for all nine parameters are given in Table 2.
The effect of water treatment was significant for shoot height and number of leaves (p < 0.001) (Table 2). Although differences between treatments were not significant for root length or root fresh and dry weights, a lack of moisture effected an increase in root length, which contrasted with the result for shoot length. By the conclusion of the experiment, the longest shoots were observed in the 75% treatment, although there was little difference from the 100% treatment (Figure 2a). Shoot fresh weight was almost identical in the 100 and 75% treatments, slightly less in the 50% treatment, but the dry weights for these three treatments were almost identical (Figure 2b,c). Root length was longest in the 25% water treatment, followed by the 100%, 50%, and 75% treatments (Figure 2d). However, there was little variation between the three highest water treatments. Root fresh weight was lowest in the 100% treatment, but there was little variation among the remaining three lower water treatments (Figure 2e). However, after the roots were dried, the highest weights were observed in the 75% and 25% treatments (Figure 2f). The 50% treatment had a larger variation between fresh weight and dry weight compared to 75% and 25%, but the 100% treatment had the lowest fresh and dry weights of all treatments (Figure 2e,f).
For the number of leaves, leaf area per plant and inflorescence length, the plants in the 75% treatment had the largest number of leaves (Figure 3a) and the longest inflorescences (Figure 3c), but the only significant result was for number of leaves (p < 0.001). Plants in the 75% treatment had significantly more leaves than any of the other three treatments (Figure 3a, Table 2). Leaf area per plant (Figure 3b) was highest in the 100% treatment, suggesting that although far fewer leaves were produced in this treatment, they would have been noticeably larger compared to the other treatments.

3.2. Effects on Photosynthetic Response and Biomass Productivity by Drought Conditions and Elevated CO2 Levels

3.2.1. Photosynthetic Response of Plants

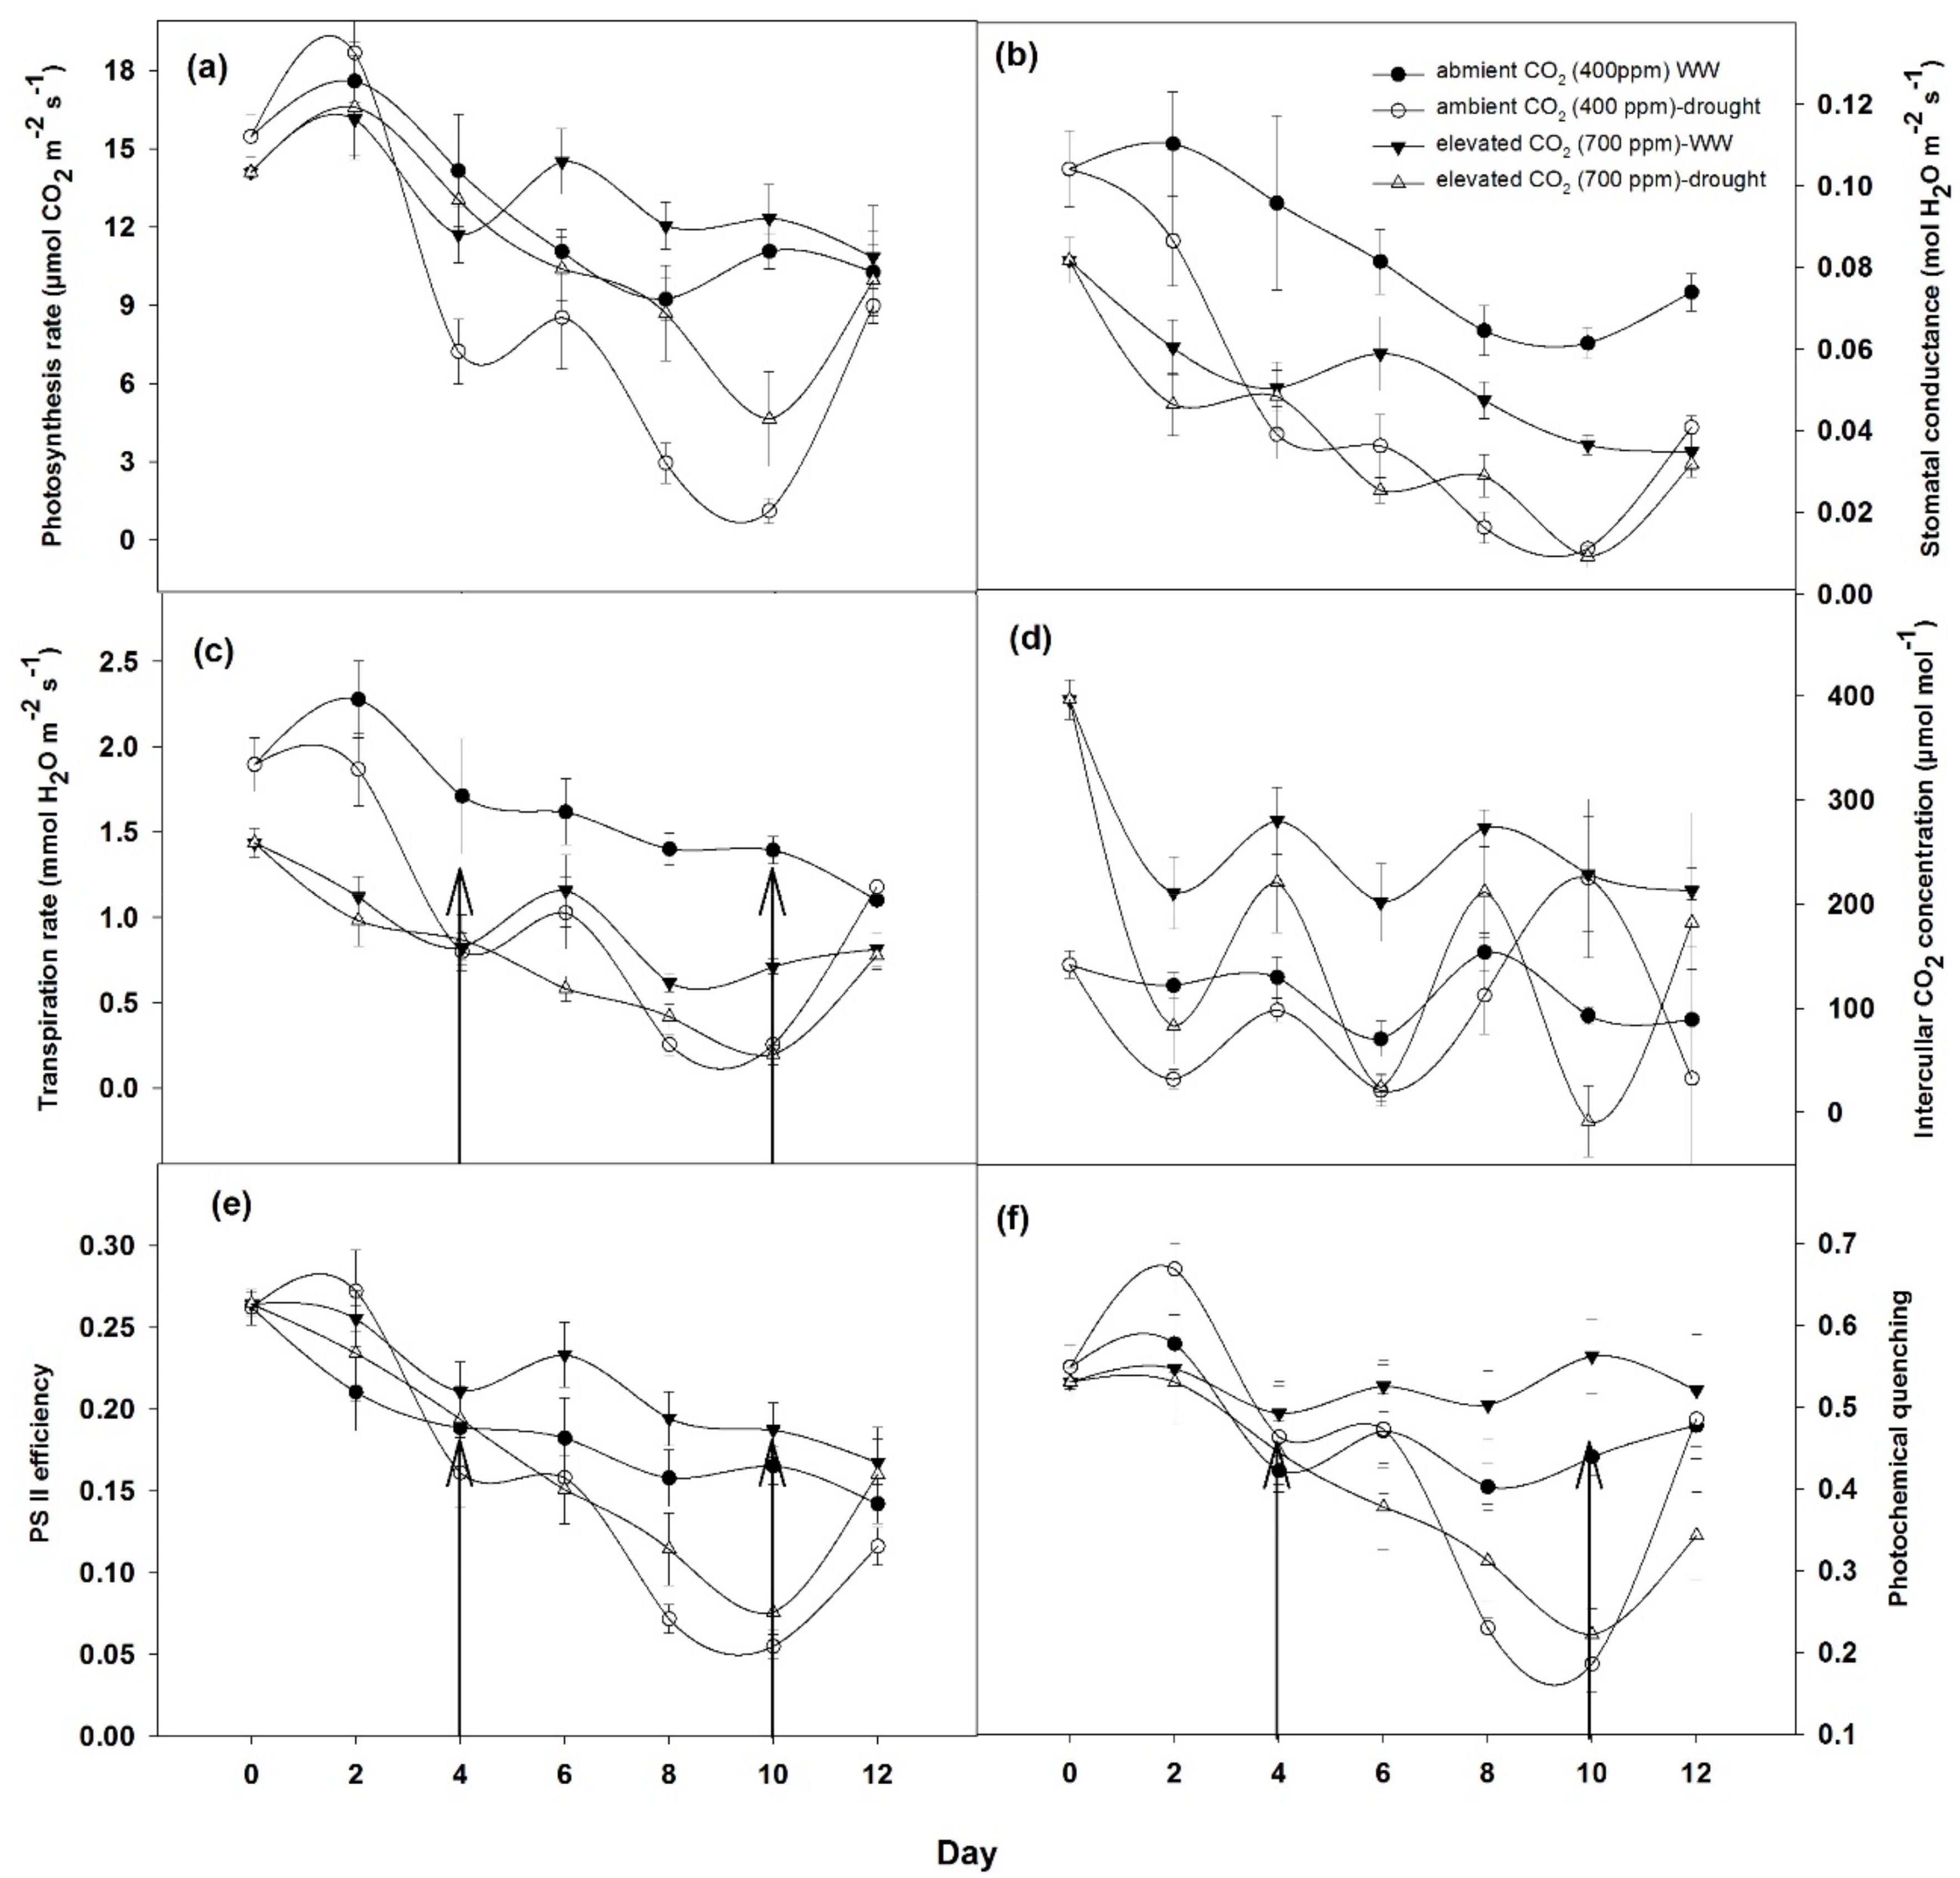
Ten plant physiological response parameters were recorded as previously described in Materials and Methods, and results are displayed in Figure 4a–f and Figure 5a–d.
The rate of photosynthesis (photo) declined under increasing water stress, but elevated carbon dioxide did not appear to redress this over the entire time, although there was an increase in the 700 ppm carbon dioxide well-watered treatment relative to the same water treatment at 400 ppm on Days 6, 8 and 10, and the 700 ppm drought treatment outperformed the 400 ppm one on all days except for Days 0 and 2. Ward
Stomatal conductivity (cond) was initially lower in drought affected than well-watered in both carbon dioxide treatments, and greater more consistently in well-watered throughout the 12 days of measurement. Elevated carbon dioxide and well-watered treatments began to show less reduction than 400 drought by day 4, and this trend continued until Day 12. After an initial phase above the trends for elevated carbon dioxide, both water treatments, the 400 ppm drought treatment conductance rates declined steadily. The pattern between these and the 700 ppm drought treatments were closely aligned for the remainder of the experimental period.
There was a downward trend overall for transpiration rate (Trμmol) as well, and the well-watered tended to outperform the drought treatments, but elevated carbon dioxide did not appear to confer any advantage. However, the valued from Day 4 to Day 10 were higher in the 700 ppm well-watered than for the 400 ppm drought treatment. There was a recovery on the final day for both drought treatments, also.
Overall, the values for Intercellular carbon dioxide concentration (Ci) were somewhat variable, although the highest values were observed more consistently in the 700 ppm carbon dioxide treatment, particularly under well-watered conditions. However, the most volatile values were in the 700 ppm drought treatment, since these values fluctuated wildly at each measurement. The 400 ppm drought treatment generally had the lowest values for the first 6 days, but then it increased until peaking at the highest value on Day 10. The 400 ppm well-watered treatment had the most consistent trend, although values did fluctuate considerably.
There was an overall downward trend in quantum yield of PSII (φPS2) over time, but by Day 6 there was a trend towards the well-watered treatments outperforming the drought treatments, until the last day when the trends reversed. In this case, elevated carbon dioxide did appear to give a slight benefit compared to ambient, until the water treatment was re-instated.
The trend for photochemical quenching (qP) was broadly similar to that for quantum yield, including for the response on Day 12.
Minimum and maximum fluorescence values (Fo’ and Fm’) were reasonably consistent between measurements, but with an overall trend of reducing values over the time of the experiment. There was no clear difference according to either carbon dioxide or drought treatment, but by the conclusion the well-watered treatments were higher than the drought treatments.
Vapor pressure deficit based on leaf temperature (vpdl) was also somewhat variable, however in contrast to the others, there was a net increase in values by Day 12. In this case, elevated carbon dioxide did not confer any advantage, since both of the 400 ppm treatments were mostly consistently higher than the 700 ppm treatments.

3.2.2. Partitioned Biomass of Plants

The results for the 12 plant biomass parameters are displayed inFigure 6a–f and Figure 7a–f. Results for a two-way ANOVA of these biomass parameters on day 12 are given in Table 3.
Overall, each biomass parameter was decreased by drought, but increased by elevated CO2 (Figure 6 and Figure 7). CO2 and water were significant for most parameters as single factors (p ≤ 0.05), apart from the effect of CO2 for stem diameter (p = 0.060), but the interactions of CO2 and water were significant only for plant height, root fresh weight and root dry weight (p < 0.001) and shoot fresh weight (p = 0.028) (Table 3).

3.3. Effect on Seed Germination from Exposure to Varying Temperatures

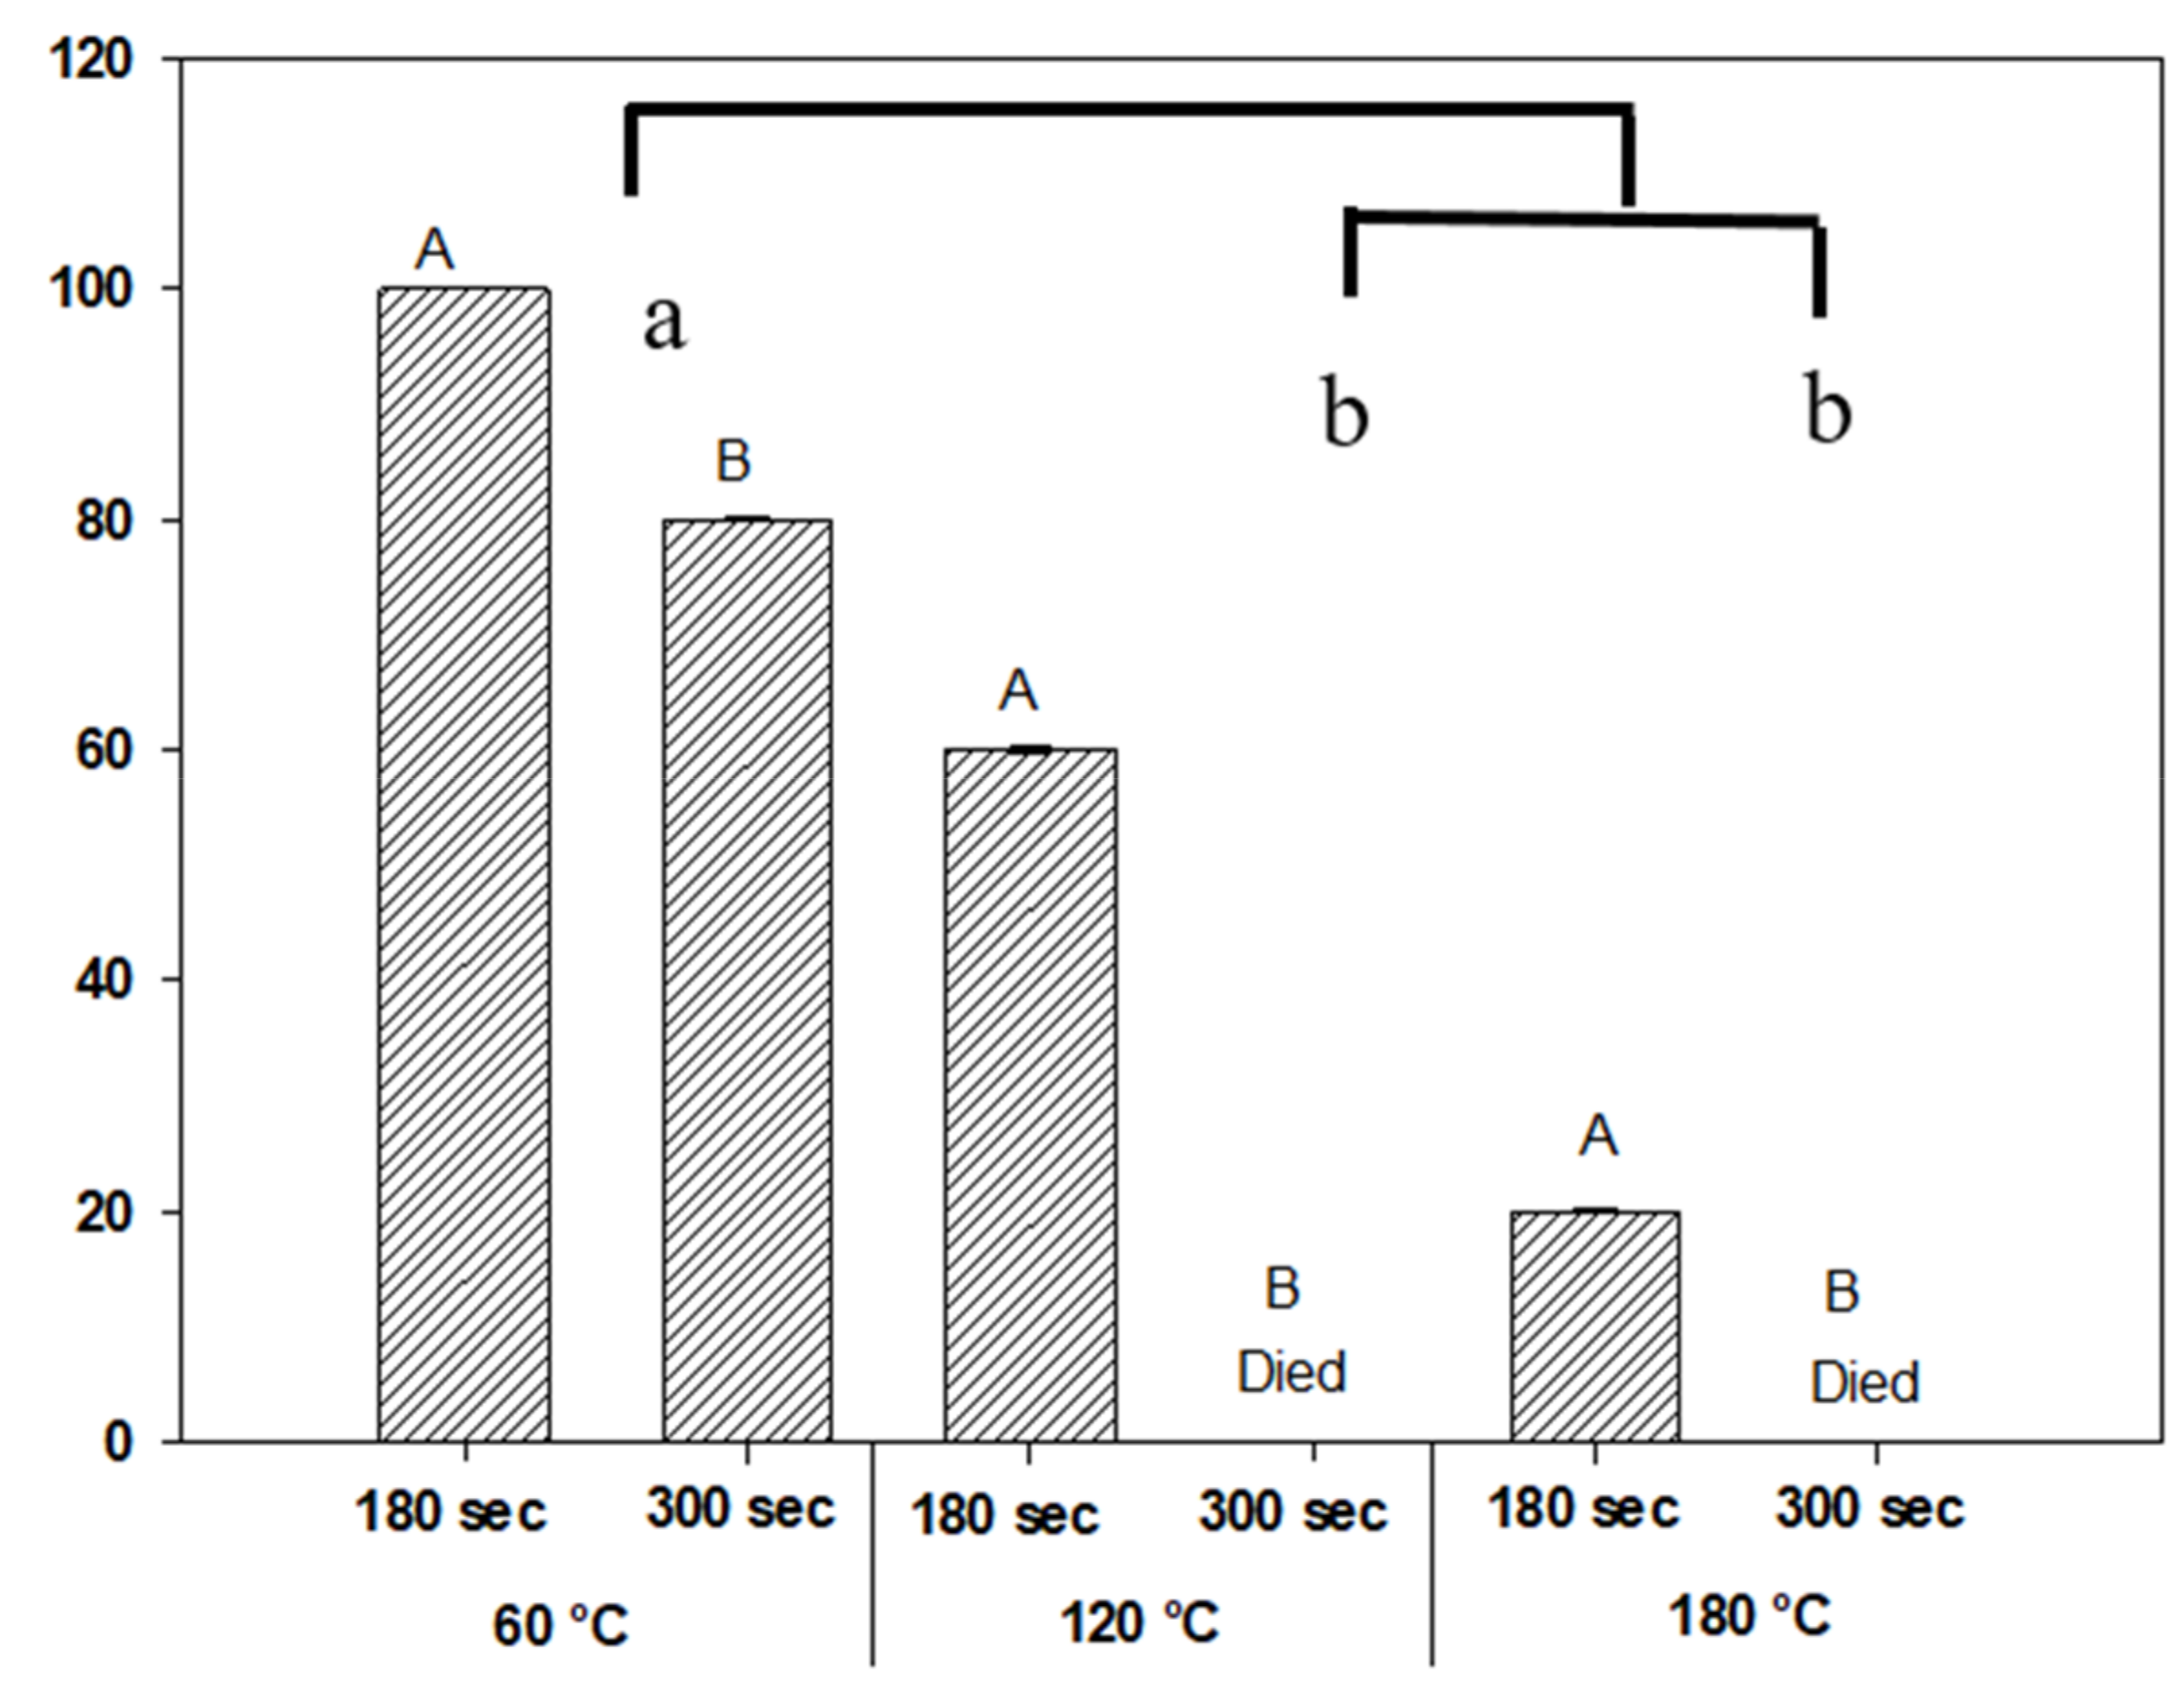
The results from the two-way ANOVA showed that temperature (p < 0.001) and length of exposure (p = 0.013) both contributed to reduce the rate of germination of A. retroflexus (Figure 8). The interaction of temperature and duration was not significant (p = 0.336). Overall, the longer duration of 300 s and the higher temperatures of 120 and 180 °C treatments reduced the germination significantly. In the lowest temperature, 60 °C, 100% germination was observed for seeds heat treated for 180 s. Germination was completely extinguished at the longer time of exposure (300 s) in the 120 and 180 °C treatments.

4. Discussion

4.1. Effects on Growth Rate and Biomass Productivity by Variation of Soil Moisture

The results for soil moisture availability suggest that Amaranthus retroflexus, despite being identified as a riparian pioneer species [3], may not necessarily tolerate completely saturated soil conditions. A higher growth rate was observed for the 75% treatment in each of plant height, stem diameter and number of leaves than in the 100% treatment, and almost all plant biomass measures, apart from total leaf area per plant, were slightly lower in the 100% water treatment compared to all other treatments. However, it does appear that this species requires at least moderately high levels of soil moisture during early growth stages. The findings from this study are similar to those of other researchers investigating this and other Amaranthus species [23], as well as other C4 species. Shoot height, fresh and dry biomass weights, number of leaves, and inflorescence length were all reduced under drought conditions in Amaranthus crutenus [24]. Similarly, cotton plants have been shown to respond to drought with a reduction in stem height, reduced number of leaves and leaf area, and lower dry weight of biomass [25].
The patterns for biomass production in our study suggests a differential response, according to anatomical feature of A. retroflexus, to variability in soil moisture availability, since the highest results for length of shoots and roots were found in the 75% and 25% treatments, respectively. Additionally, the highest number of leaves was observed in the 75% treatment, although the 100% treatment did have larger, if significantly fewer, leaves.
The finding that lack of soil moisture appears to force this species to extent its root system to seek water is similar to the response observed for A. crutenus [24]. However, it is noted that the differences between root fresh and dry weights in combination with root length differed with observations for A. crutenus [24] and cotton (Gossypium hirsutum L.) [25]. Although the roots of both species were longest in the reduced water treatments, they were not the heaviest samples after drying, as may have been expected. This therefore contrasts with our findings, since although the differences between treatments were not statistically significant, the heaviest fresh and dry root weights were observed in the 25% treatment. It appears that drought influences growth in the roots of this and other Amaranthus species in a similar manner, although the specificity and degree of this response varies according to species or variety [26].
Our study also contrasts with findings by other researchers for the number of leaves produced per plant, inasmuch as Jomo and colleagues (2015) observed the largest number of leaves for A. retroflexus in the 100% (control) treatment, with the number of leaves reducing incrementally in each of the 75%, 50%, and 25% treatments. This pattern was also observed in the remaining five Amaranthus species, which were investigated [23]. Other C4 species respond to reducing water availability in a similar manner, with the number and area of leaves also being reduced in Centaurea nigra under drought conditions [27].

4.2. Effects on Photosynthetic Response and Biomass Productivity by Drought Conditions and Elevated CO2 Levels

For the photosynthetic response, there were contrasting patterns across most parameters (photo, cond, Trμmol, ci, φPSII, qP, Fo’, Fm’, Fv’/Fm’, vpdl) with an overall reduction in response over time prior to re-watering for the last two days. By contrast, vapor pressure deficit based on leaf temperature (vpdl) had increased slightly by the conclusion of the experiment. Each of these parameters is discussed below.
Previous work on Amaranthus retroflexus found lower rates of photosynthesis (photo) and stomatal conductivity (cond) under elevated CO2 (70 pa) compared to ambient (35 pa) prior to the commencement of water stress treatments [28]. In our study, we found a similar trend for both photo and cond, as well as transpiration rate (Trμmol). In each case, values were lower in the elevated treatment prior to commencement of drought stress, after which there was a downward trend in all parameters for both well-watered and drought treated plants until Day 10. After watering recommenced, trends for recovery were also broadly similar to those to the previous study, although carbon dioxide was found to be less significantly influential for photo than for cond and Trμmol.
Overall, the values for Intercellular CO2 Concentration (ci) were somewhat volatile, although the highest values were observed more consistently in the 700 ppm CO2 treatment, particularly under well-watered conditions, a finding that is broadly similar to previous observations of Amaranthus caudatus [29]. In both the current and previous studies, initial values for ci were significantly higher prior to commencement of drought treatment and there was also somewhat of a divergence in the ci values according to CO2 treatment by the conclusion of the experiment. However, the daily values observed in our study were somewhat more variable compared to the previous study.
There was no overall clear trend for Photochemical Efficiency of Photosystem II (PSII) and Photochemical Quenching (qP) apart from a gradual decline in this parameter, and a recovery after re-watering. This contrasts to findings for Glycine max L. Mer., where an increase in both of these parameters was observed under drought conditions with elevated CO2 [30].
Trends for Minimum (Fo’) and Maximum (Fm’) Fluorescence values showed fairly consistent trends of an overall reduction of values over the time of the experiment, as has been observed for Phaseolus vulgaris L. [31] and cucumber plants [32]. Elevated CO2 did appear to give some compensation for drought stress, however, although this has not always been reported for other species [32,33]. In our study, there was a larger divergence in values by Day 12 for the ambient CO2 treatments compared to elevated. There was no clear difference according to either CO2 or drought treatment, but by the conclusion the well-watered treatments had higher values than the drought treatments.
From the data for Quantum Yield of PSII, (φPSII) there was an indication of plant stress across all treatments. The maximum quantum efficiency of PSII (Fv’/Fm’) was less than 0.3 for the entire period of the experiment, a figure which is significantly less than might be expected from unstressed plants (0.773) [34]. This finding indicates that the plants were likely stressed regardless of water or CO2 treatment. In a similar manner to the responses for drought and CO2, plants exposed to drought gave a lower response for most parameters, but some were slightly increased with additional CO2, and also during the drought recovery period. In our study, an overall downward trend in Fv’/Fm’ was observed over time, but by day 6 there was a trend towards the well-watered treatments outperforming the drought treatments, until the last day when the trends reversed. In this case, elevated CO2 did appear to give a slight benefit compared to ambient, until the water treatment was re-instated. However, in comparison with the findings of other researchers, this recovery was modest at best [32].
Research in to cropped species suggest that the vapor pressure deficit based on leaf temperature (vpdl) parameter may be increased by elevated CO2 [33]. In our study, vpdl was somewhat volatile, but in contrast to other factors there was a net increase by day 12. However, elevated CO2 did not confer any advantage, since both of the 400 ppm treatments were mostly consistently higher than the 700 ppm treatments.
For the biomass parameters recorded in this study, the overall responses of A. retroflexus to drought and elevated CO2 were broadly aligned with findings from previous research, in that an increase in biomass under elevated CO2 was observed [35,36,37,38,39,40,41,42,43,44,45]. In addition, elevated CO2 levels may provide resilience under drought conditions, since an increase in biomass results from exposure to elevated CO2 in A. retroflexus [38,42] as well as other C4 species, such as Centaurea nigra [27] and Withania somnifera [43]. Furthermore, there were significant increases in plant height, shoot fresh and dry weight, and root fresh weight, according to both drought and CO2, suggesting an influence on partitioning from CO2 and drought on A. retroflexus. However, although these parameters were significantly increased by either water and CO2 as individual factors, there was no interaction between them.
However, other researchers have concluded that neither an increased biomass nor a partitioning of biomass occurred in A. retroflexus in response to an increase in CO2 [40]. The reasons for this contradiction appear to be related to the metabolic status of A. retroflexus and its response to the availability of soil nutrients. Early research into the differences between C3 and C4 plants had concluded that, because of the ways in which each metabolizes CO2, C3 plants would be advantaged over C4 under elevated atmospheric CO2 [41]. Therefore, it was initially concluded that A. retroflexus would not respond to elevated CO2 by increases in biomass, either overall, according to partitioning to different parts of the plant or by alteration in metabolic activity. However, Ward et al. (1999) [28] and Valerio et al. (2013) [42] both concluded that these responses for A. retroflexus did not occur as had been predicted. Further investigation of what may have influenced earlier findings suggested that nutrient availability, and in particular nitrogen, is a key factor to explain observed increased in biomass of A. retroflexus under drought in elevated CO2, since this phenomenon has also been observed in other C4 species. Wong (1979) [46] concluded that biomass dry weight of cotton plants increased more in elevated CO2 compared to ambient, in non-limiting nitrogen conditions. Another example of a contradiction to the previously down-played response of C4 plants to increasing atmospheric CO2 was observed by Ziska and Bunce (1997) [39], who concluded that exposure of A. retroflexus to elevated CO2 resulted in an increase of biomass in a more similar way to C3 plants than had been previously observed. Additionally, adverse competition between a cropped species (soybean, C3) and A. retroflexus is indicated, due to the capacity of the weed to respond more positively to elevated CO2 [40]. In our experiment, the plant biomass differences clearly indicated a pattern of influence due to elevated CO2. There was an increase in all 12 parameters in plants exposed to 700 ppm CO2, regardless of moisture treatment, which has also been observed by other researchers [38,42]. Similarly, there was a reduction in plant biomass if plants were deprived of water, but an apparent compensation with elevated CO2, since plants in the elevated treatment were larger than those in ambient [27,42].

4.3. Effect on Seed Germination from Exposure to Varying Temperatures

Although the lowest temperature did not significantly reduce germination, our results indicate that fire may be a useful adjunct for control of this species in both agricultural and conservation settings. Germination of A. retroflexus seeds exposed to 120 °C for the shortest time period of 180 s was significantly reduced, but an even greater reduction was achieved for seeds exposed to the highest temperature of 180 °C. However, the longer time of 300 s was required to eliminate germination altogether at each of these temperatures. Seed size is one possible factor in this result, since in two other small-seeded species, Nicotiana glauca [45] and Dinebra panicea [46], exposure to temperatures of 100 °C and above for a short time (180 s) significantly reduced germination. The finding in this study that the time of exposure required to reduce seed viability is reduced according to increase in temperature aligns with previous research [20]. Therefore, we recommend fire, possibly in the form of stubble burning, be further investigated for use in the control of this weed in cropping situations.

5. Conclusions

Overall, our findings confirm that A. retroflexus is able to compensate for a lack of soil moisture with a greater growth of its root system and it takes advantage of elevated atmospheric CO2 to increase overall biomass. The finding that heating seeds for relatively short times can significantly reduce germination indicates the possibility to use flame weeding to control this weed in the crops.

Author Contributions

Writing—original draft preparation and editing, S.W.; project administration, writing—review and editing, S.F.; conceptualization, methodology, and investigation M.M.J.; writing—review and editing, B.S.C., A.W. and A.C.; data analysis, C.T.; All authors have read and agreed to the published version of the manuscript.

Funding

No funding received for this project.

Institutional Review Board Statement

Not applicable.

Informed Consent Statement

Not applicable.

Data Availability Statement

Not applicable.

Conflicts of Interest

The authors declare no conflict of interest.

References

  1. Weaver, S.E.; McWilliams, E.L. The biology of Canadian weeds. 44. Amaranthus retroflexus L., A. powellii S. Wats A. hybridus L. Can. J. Plant Sci. 1980, 60, 1215–1234. [Google Scholar] [CrossRef]
  2. AVH. Occurrence Records: Amaranthus Retroflexus. The Australasian Virtual Herbarium. Available online: https://avh.ala.org.au/occurrences/search?taxa=Amaranthus+retroflexus#tab_mapView (accessed on 28 July 2020).
  3. Costea, M.; Weaver, S.E.; Tardif, F.J. The biology of Canadian weeds. 130. Amaranthus retroflexus L., A. powellii S. Watson and A. hybridus L. Can. J. Plant Sci. 2004, 84, 631–668. [Google Scholar] [CrossRef]
  4. Sauer, J.D. The grain amaranths: A survey of their history and classification. Ann. Mo. Bot. 1950, 37, 561–632. [Google Scholar] [CrossRef]
  5. Stevens, O. Weights of seeds and numbers per plant. Weeds 1957, 5, 46–55. [Google Scholar] [CrossRef]
  6. Egley, G.H.; Chandler, J.M. Germination and viability of weed seeds after 2.5 years in a 50-year buried seed study. Weed Sci. 1978, 26, 230–239. [Google Scholar] [CrossRef]
  7. Siriwardana, T.; Zimdahl, R. Competition between barnyard grass (Echinochloa crus-galli) and red-root pigweed (Amaranthus retroflexus). Weed Sci. 1984, 32, 218–222. [Google Scholar] [CrossRef]
  8. Mohammadi, V.; Moghaddam, S.R. Influence of weed densities and different nitrogen levels on growth indices of corn, red root pigweed (Amaranthus retroflexus L.) and millet (Panicum miliaceum L.). Agroecology 2018, 9, 1084–1098. [Google Scholar]
  9. CABI. Datasheet: Amaranthus retroflexus. (Redroot Pigweed) Invasive Species Compendium. Available online: https://www.cabi.org/isc/datasheet/4652 (accessed on 7 March 2020).
  10. Athanassova, D.P. Allelopathic effect of Amaranthus retroflexus L. on weeds and crops. In Proceedings of the Seizième Conférence du COLUMA, Journées Internationales sur la Lutte Contre les Mauvaises Herbes, Sixteenth COLUMA Conference, International Days on Weed Control, Reims, France, 6–8 December 1995; Association Nationale Pour la Protection des Plantes (ANPP): Paris, France, 1996; Volume 1, pp. 437–442. [Google Scholar]
  11. Nuss, R.; Loewus, F.A. Further studies on oxalic acid biosynthesis in oxalate-accumulating plants. Plant Physiol. 1978, 61, 590–592. [Google Scholar] [CrossRef] [Green Version]
  12. Torres, M.B.; Kommers, G.D.; Dantas, A.F.; de Barros, C.L. Redroot pigweed (Amaranthus retroflexus) poisoning of cattle in southern Brazil. Vet. Hum. Toxicol. 1997, 39, 94–96. [Google Scholar]
  13. Casteel, S.W.; Johnson, G.C.; Miller, M.A.; Chudomelka, H.J.; Cupps, D.E.; Haskins, H.E.; Gosser, H.S. Amaranthus retroflexus (redroot pigweed) poisoning in cattle. J. Vet. Am. 1994, 204, 1068–1070. [Google Scholar]
  14. Stuart, B.P.; Nicholson, S.S.; Smith, J.B. Perirenal edema and toxic nephrosis in cattle, associated with ingestion of pigweed. J. Vet. Am. 1975, 167, 949–950. [Google Scholar]
  15. Heap, I.M. International Survey of Herbicide-Resistant Weeds; Annual Report; Weed Science Society of America: Westminster, CO, USA, 1997. [Google Scholar]
  16. McNaughton, K.E.; Letarte, J.; Lee, E.A.; Tardif, F.J. Mutations in ALS confer herbicide resistance in redroot pigweed (Amaranthus retroflexus) and Powell amaranth (Amaranthus powellii). Weed Sci. 2005, 53, 17–22. [Google Scholar] [CrossRef]
  17. Davis, G.; Letarte, J.; Grainger, C.M.; Rajcan, I.; Tardif, F.J. Widespread herbicide resistance in pigweed species in Ontario carrot production is due to multiple Photosystem II mutations. Can. J. Plant Sci. 2019, 100, 56–67. [Google Scholar] [CrossRef]
  18. Khan, A.; Hereward, J.; Werth, J.; Walter, G.; Chauhan, B. Amaranthus: Emerging weeds of cotton systems in Australia? In Proceedings of the Cotton Research Conference, Armidale, Australia, 5–7 September 2017; CRCD: Narrabri, Australia, 2017. [Google Scholar]
  19. IPCC. Climate Change 2014: Synthesis Report. Contribution of Working Groups I, II and III to the Fifth Assessment Report of the Intergovernmental Panel on Climate Change; Pachauri, R.K., Meyer, L.A., Eds.; IPCC: Geneva, Switzerland, 2014; p. 151. [Google Scholar]
  20. Norsworthy, J.K.; Green, J.K.; Barber, T.; Roberts, T.L.; Walsh, M.J. Seed destruction of weeds in southern US crops using heat and narrow-windrow burning. Weed. Technol. 2020, 34, 589–596. [Google Scholar] [CrossRef]
  21. IPCC. Carbon Dioxide—Data Distribution Centre, IPCC. Available online: https://www.ipcc-data.org/observ/ddc_co2.html (accessed on 13 March 2020).
  22. Ferrari, F.N.; Parera, C.A. Germination of six native perennial grasses that can be used as potential soil cover crops in drip-irrigated vineyards in semiarid environs of Argentina. J. Arid Environ. 2015, 113, 1–5. [Google Scholar] [CrossRef]
  23. Jomo, M.O.; Netondo, G.W.; Musyim, D.M. Growth changes of seven Amaranthus (spp.) during the vegetative and reproductive stages of development as influenced by variations in soil water deficit. Int. J. Res. Innov. Earth Sci. 2015, 2, 157–167. [Google Scholar]
  24. Mlakar, S.G.; Bavec, M.; Jakop, M.; Bavec, F. The Effect of Drought Occurring at Different Growth Stages on Productivity of Grain Amaranth Amaranthus cruentus G6. J. Life Sci. 2012, 6, 283–286. [Google Scholar]
  25. Pace, P.F.; Cralle, H.T.; El-Halawany, S.H.; Cothren, J.T.; Senseman, S.A. Drought-induced changes in shoot and root growth of young cotton plants. J. Cotton Sci. 1999, 3, 183–187. [Google Scholar]
  26. Liu, F.; Stützel, H. Biomass partitioning, specific leaf area, and water use efficiency of vegetable amaranth (Amaranthus spp.) in response to drought stress. Sci. Hortic-Amst. 2004, 102, 15–27. [Google Scholar] [CrossRef]
  27. Qaderi, M.M.; Lynch, A.L.; Godin, V.J.; Reid, D.M. Single and interactive effects of temperature, carbon dioxide, and watering regime on the invasive weed black knapweed (Centaurea nigra). Ecoscience 2013, 20, 328–338. [Google Scholar] [CrossRef]
  28. Ward, J.K.; Tissue, D.T.; Thomas, R.B.; Strain, B.R. Comparative responses of model C3 and C4 plants to drought in low and elevated CO2. Glob. Chang. Biol. 1999, 5, 857–867. [Google Scholar] [CrossRef]
  29. Hamim, H. Photosynthesis of C3 and C4 species in response to increased CO2 concentration and drought stress. Hayati J. Biosci. 2005, 12, 131–138. [Google Scholar] [CrossRef]
  30. Wang, A.; Lam, S.K.; Hao, X.; Li, F.Y.; Zong, Y.; Wang, H.; Li, P. Elevated CO2 reduces the adverse effects of drought stress on a high-yielding soybean (Glycine max (L.) Merr.) cultivar by increasing water use efficiency. Plant Physiol. Bioch. 2018, 132, 660–665. [Google Scholar] [CrossRef] [PubMed]
  31. Mathobo, R.; Marais, D.; Steyn, J.M. The effect of drought stress on yield, leaf gaseous exchange and chlorophyll fluorescence of dry beans (Phaseolus vulgaris L.). Agric. Water Manag. 2017, 180, 118–125. [Google Scholar] [CrossRef] [Green Version]
  32. Li, Q.M.; Liu, B.B.; Wu, Y.; Zou, Z.R. Interactive effects of drought stresses and elevated CO2 concentration on photochemistry efficiency of cucumber seedlings. J. Integr. Plant Biol. 2008, 50, 1307–1317. [Google Scholar] [CrossRef]
  33. Choi, E.Y.; Seo, T.C.; Lee, S.G.; Cho, I.H.; Stangoulis, J. Growth and physiological responses of Chinese cabbage and radish to long-term exposure to elevated carbon dioxide and temperature. Hortic. Environ. Biotechnol. 2011, 52, 376. [Google Scholar] [CrossRef]
  34. Björkman, O.; Demmig, B. Photon yield of O2 evolution and chlorophyll fluorescence characteristics at 77 K among vascular plants of diverse origins. Planta 1987, 170, 489–504. [Google Scholar] [CrossRef]
  35. Garbutt, K.; Williams, W.E.; Bazzaz, F.A. Analysis of the differential response of five annuals to elevated CO2 during growth. Ecology 1990, 71, 1185–1194. [Google Scholar] [CrossRef]
  36. Poorter, H. Interspecific variation in the growth response of plants to an elevated ambient CO2 concentration. In CO2 and Biosphere; Rozema, J., Lambers, H., Van de Geijn, S.C., Cambridge, M.L., Eds.; Springer: Dordrecht, The Netherlands, 1993; pp. 77–98. [Google Scholar]
  37. Tremmel, D.C.; Patterson, D.T. Responses of soybean and five weeds to CO2 enrichment under two temperature regimes. Can. J. Plant Sci. 1993, 73, 1249–1260. [Google Scholar] [CrossRef] [Green Version]
  38. Rogers, H.H.; Runion, G.B.; Krupa, S.V. Plant responses to atmospheric CO2 enrichment with emphasis on roots and the rhizosphere. Environ. Pollut 1994, 83, 155–189. [Google Scholar] [CrossRef]
  39. Ziska, L.H.; Bunce, J.A. Influence of increasing carbon dioxide concentration on the photosynthetic and growth stimulation of selected C4 crops and weeds. Photosynth. Res. 1997, 54, 199–208. [Google Scholar] [CrossRef]
  40. Ziska, L.H. The impact of elevated CO2 on yield loss from a C3 and C4 weed in field-grown soybean. Glob. Chang. Biol. 2000, 6, 899–905. [Google Scholar] [CrossRef]
  41. Lovelli, S.; Perniola, M.; Ferrara, A.; Amato, M.; Di Tommaso, T. Photosynthetic response to water stress of pigweed (Amaranthus retroflexus) in a Southern-Mediterranean area. Weed Sci. 2010, 58, 126–131. [Google Scholar] [CrossRef]
  42. Valerio, M.; Tomecek, M.B.; Lovelli, S.; Ziska, L.H. Quantifying the effect of drought on carbon dioxide-induced changes in competition between a C3 crop (tomato) and a C4 weed (Amaranthus retroflexus). Weed Res. 2011, 51, 591–600. [Google Scholar] [CrossRef]
  43. Sharma, R.; Singh, H.; Kaushik, M.; Nautiyal, R.; Singh, O. Adaptive physiological response, carbon partitioning, and biomass production of Withania somnifera (L.) Dunal grown under elevated CO2 regimes. 3. Biotechnology 2018, 8, 267. [Google Scholar] [CrossRef]
  44. Wong, S.C. Elevated atmospheric partial pressure of CO2 and plant growth. Oecologia 1979, 44, 68–74. [Google Scholar] [CrossRef]
  45. Florentine, S.K.; Weller, S.; Graz, P.F.; Westbrooke, M.; Florentine, A.; Javaid, M.; Fernando, N.; Chauhan, B.S.; Dowling, K. Influence of selected environmental factors on seed germination and seeding survival of the arid zone invasive species tobacco bush (Nicotiana glauca R. Graham). Rangel. J. 2016, 38, 417–425. [Google Scholar] [CrossRef]
  46. Weller, S.L.; Florentine, S.K.; Chauhan, B.S. Influence of selected environmental factors on seed germination and seedling emergence of Dinebra panicea var. brachiata (Steud.). Crop. Prot. 2019, 117, 121–127. [Google Scholar] [CrossRef]
Figure 1. (ac): Growth of Amaranthus retroflexus to response variation in soil moisture (100, 75, 50 and 25%) as indicated by changes in (a) plant height, (b) stem diameter and (c) number of leaves (mean ± SE).
Agronomy 11 00728 g001
Figure 2. (af): (a) Shoot height, (b) Shoot fresh weight, (c) Shoot dry weight, (d) Root length, (e) Root fresh weight and (f) Root dry weight of Amaranthus retroflexus according to soil moisture percentage (mean ± SE). Same letters indicate means are not statistically different when tested with Tukey’s HSD test.
Agronomy 11 00728 g002
Figure 3. (ac): (a) Number of leaves per plant, (b) Total leaf area per plant and (c) Inflorescence length of Amaranthus retroflexus according to soil moisture percentage (mean ± SE). Same letters indicate means are not statistically different when tested with Tukey’s HSD test.
Agronomy 11 00728 g003
Figure 4. (af): Amaranthus retroflexus physiological responses to drought and elevated CO2 (mean ± SE). (a) Photosynthesis rate, (b) stomatal conductance, (c) transpiration rate, (d) intercellular CO2 concentration, (e) photochemical efficiency of Photosystem 2 (PSII), (f) photochemical quenching. Arrow indicates water was added to the drought treatment pots.
Agronomy 11 00728 g004
Figure 5. (ad): Amaranthus retroflexus physiological responses to drought and elevated CO2 (mean ± SE). (a) minimum fluorescence, (b) maximum fluorescence, (c) quantum yield of PSII (φPS2), (d) Vapor Pressure Deficit based on leaf temperature. Arrow indicates water was added to the drought treatment pots.
Agronomy 11 00728 g005
Figure 6. (af): Biomass of Amaranthus retroflexus according to CO2 concentration (400 = Ambient, 700 = Elevated, values in ppm) and water treatments (Well water = well-watered) (mean ± SE). (a) plant height, (b) stem diameter, (c) shoot fresh weight, (d) shoot dry weight, (e) root fresh weight, (f) root dry weight. Same letters indicate means are not statistically different when tested with Tukey’s HSD test.
Agronomy 11 00728 g006
Figure 7. (af): Biomass of Amaranthus retroflexus according to CO2 concentration (400 = Ambient, 700 = Elevated; values in ppm) and water (WW = well-watered) treatments (mean ± SE). (a) leaf thickness, (b) leaf area per plant, (c) number of leaves per plant, (d) number of branches per plant, (e) leaf fresh weigh per plant, (f) leaf dry weight per plant. Same letters indicate means are not statistically different when tested with Tukey’s HSD test.
Agronomy 11 00728 g007
Figure 8. Effect of heat pre-treatment on dry seed germination of Amaranthus retroflexus in a 30/20 °C (12-h alternating) light-dark regime for 30 days. Same letters indicate means are not statistically different when tested with Tukey’s HSD test.
Agronomy 11 00728 g008
Table 1. Statistical significances for Amaranthus retroflexus response to variation in water holding capacity.
ParameterMoistureTime Time ∗ Moisture
p-Values HSD at 0.05p-Values HSD at 0.05p-Values HSD at 0.05
Plant height (cm)0.0005.4580.0009.1060.07222.713
Stem diameter (mm)0.0000.6620.0001.1050.0022.756
Number of leaves0.0004.2120.0007.0270.00217.529
Table 2. Statistical significances for partitioned post-harvest biomass (shoots, leaves, roots) for Amaranthus retroflexus response to variation in soil water holding capacity.
Growth Parameterp-ValueHSD at 0.05
Shoot height (cm)0.000 13.167
Shoot fresh weight (g)0.723 10.511
Shoot dry weight (g)0.8543.283
Root length (cm)0.487 7.069
Root fresh weight (g)0.757 2.479
Root dry weight (g)0.794 0.768
Number of leaves0.000 12.703
Leaf area (cm2)0.126 10250
Inflorescence length (cm)0.267 4.588
Table 3. Statistical significances for partitioned post-harvest biomass of Amaranthus retroflexus in response to drought and elevated CO2.
Post-Harvest ParameterCO2Water CO2 ∗ Water
p-ValuesHSD at 0.05p-ValuesHSD at 0.05p-ValuesHSD at 0.05
Significant difference according to treatment, including interaction
Plant height (cm)0.0003.0860.0003.080.0005.889
Root fresh weight per plant (g)0.0000.1360.0000.1360.0000.261
Shoot dry weight per plant (g)0.0000.1570.0000.1570.0000.300
Shoot fresh weight per plant (g)0.0011.5940.0001.5940.0283.041
Significant difference according to treatment, but interaction is not significant
Number of leaves per plant0.0003.6700.0003.6730.5347.009
Leaf Area Per Plant (cm2)0.00024.0250.00024.0250.06845.839
Leaves fresh weight per plant (g)0.0000.6780.0000.6790.1341.295
Number of branches per plant0.0031.9660.0001.9670.0703.753
Leaf Thickness(mm)0.0100.0980.0000.0980.9750.187
Root dry weight per plant (g)0.0060.1110.0040.1110.3550.212
Leaves dry weight per plant (g)0.0040.1800.0000.1800.2190.345
One parameter not significant, other is significant, interaction is not
Stem diameter (mm)0.0601.0560.0121.0560.4972.015
Publisher’s Note: MDPI stays neutral with regard to jurisdictional claims in published maps and institutional affiliations.