Article

Biochar for Circular Horticulture: Feedstock Related Effects in Soilless Cultivation

1
Plant Sciences Unit, Flanders Research Institute for Agriculture, Fisheries and Food, Burg. Van Gansberghelaan 109, 9820 Merelbeke, Belgium
2
ECN Part of TNO, Westerduinweg 3, 1755 ZG Petten, The Netherlands
3
Department of Applied Mathematics, Computer Science and Statistics, Ghent University, Krijgslaan 281 S9, 9000 Ghent, Belgium
*
Author to whom correspondence should be addressed.
Agronomy 2021, 11(4), 629; https://doi.org/10.3390/agronomy11040629
Submission received: 8 March 2021 / Revised: 15 March 2021 / Accepted: 23 March 2021 / Published: 26 March 2021

Abstract

:
Biochar has previously been used in growing media blends as fertilizer or for improving plant growth, disease suppression, and as a sustainable replacement of peat. To achieve optimal circular horticulture, we propose here to reuse the biochar from spent growing media. However, it is unclear to what extent the biochar feedstock determines the mode of action of the biochar and if use of spent growing media biochar may encounter nutrient or salt problems. Differences in chemical characteristics, nutrient release, and interaction in a leaching experiment and effects on plant growth, nutrient uptake, and disease suppression in a strawberry greenhouse trial were studied for 11 biochars either processed from spent growing media or from lignocellulosic biomass. A well-studied biochar produced from oak wood was set as reference. Biochars produced from spent growing media were characterized by higher electrical conductivity, extractable and total nutrient concentrations compared with biochars produced from lignocellulosic biomass. Especially in the first phase of the leaching experiment, all biochars showed nutrient and salt release, with most prominent effects for spent growing media biochars and the reference biochar. The latter biochars were an important source of phosphorus and in particular of potassium. Only for the reference biochar, strawberry plants showed increased uptake of phosphorus, potassium and calcium, and increased chlorophyll concentration. No Bortrytis cinerea disease suppression and no increase in plant growth was observed for the tested biochars. It is concluded that spent growing media can be recycled as biochar in growing media without adverse effects compared to biochars produced from lignocellulosic biomass.

Graphical Abstract

1. Introduction

1.1. Biochar: Definition and Use

Biochar is one of the products of pyrolysis, i.e., heating of biomass with no or limited presence of air [1]. Its intended use is soil application or environmental management. Biochar application in the field can facilitate carbon sequestration and improve soil fertility [2]. Biochar is also a useful amendment for composting, by reducing N losses and improving the composting process and resulting quality [3]. Use of biochar has been reported for soilless cultivation on peat-based growing media (e.g., Nieto et al. [4]). Peat is widely used as major constituent in growing media, but is controversial due to damage to peatlands and greenhouse gas emissions at harvesting accounting 2 Gigatons a−1 [5]. Therefore, partial replacement of peat by biochar is of increasing interest. Biochar has excellent properties regarding structural stability and water and air capacity, important for use in growing media [1].
Blending biochar into growing media affects the physical, chemical and biological properties [6]. Applications with high and low biochar doses in growing media exist. Successful bulk peat replacement with 10–25% biochar has been reported [7,8,9]. However, biochar can also be used as an additive and even small quantities of 3% biochar enhanced root formation, plant biomass, fruit production, and disease resistance for strawberries growing in white peat [10,11]. Possible modes of action are biochar induced effects on plant defense, nutrients and/or the microbial community in the growing media.

1.2. Nutrients of Biochar

Biochar containing CaCO3 can act as a liming agent and thereby increase the pH of the growing medium. Biochar addition can have several effects on nutrient interactions. Biochar contains nutrients originating from the feedstock, which can potentially be released by use in growing media. Increased concentrations of nitrate (NO3), phosphate and especially potassium (K) in pore water have been reported [11,12,13]. The added nutrients can also be used by plants. Adding biochar on top of the mineral fertilizer application, increased phosphorus (P) contents in wheat [14], K, magnesium (Mg) and manganese (Mn) contents in maize plants [15] and nitrogen (N) and P levels and uptake efficiency in tomato and sweet pepper [16]. Therefore, it was already suggested that biochar can substitute mineral fertilizers or standard fertigation in growing media [17]. However, it is not clear if the amounts of, e.g., K and P added by biochar are sufficient for plant nutrition during the whole growth season [18].
Besides the possible release of nutrients, biochar contains carboxylate functional groups and therefore cation exchange capacity at relevant pH conditions, creating sorption options for positively charged nutrients present in the fertigation solution [1]. Also limited anion exchange capacity for biochar is reported [19], influencing interactions with anionic nutrients as NO3 and HxPO4. For HxPO4, retention by specific ligand exchange on biochar functional groups is possible as well. As a result of these various sorption reactions, biochar can influence nutrient availability or level off peak concentrations.
Last but not least, biochar addition can alter the pH of the soil or growing media, which influences nutrient mobility and availability [6]. In most cases pH is increased with diverging effects depending on the specific nutrient. The Ca2+ present in many biochars (e.g., as carbonates) can also precipitate as Ca phosphates, decreasing phosphate availability [20].

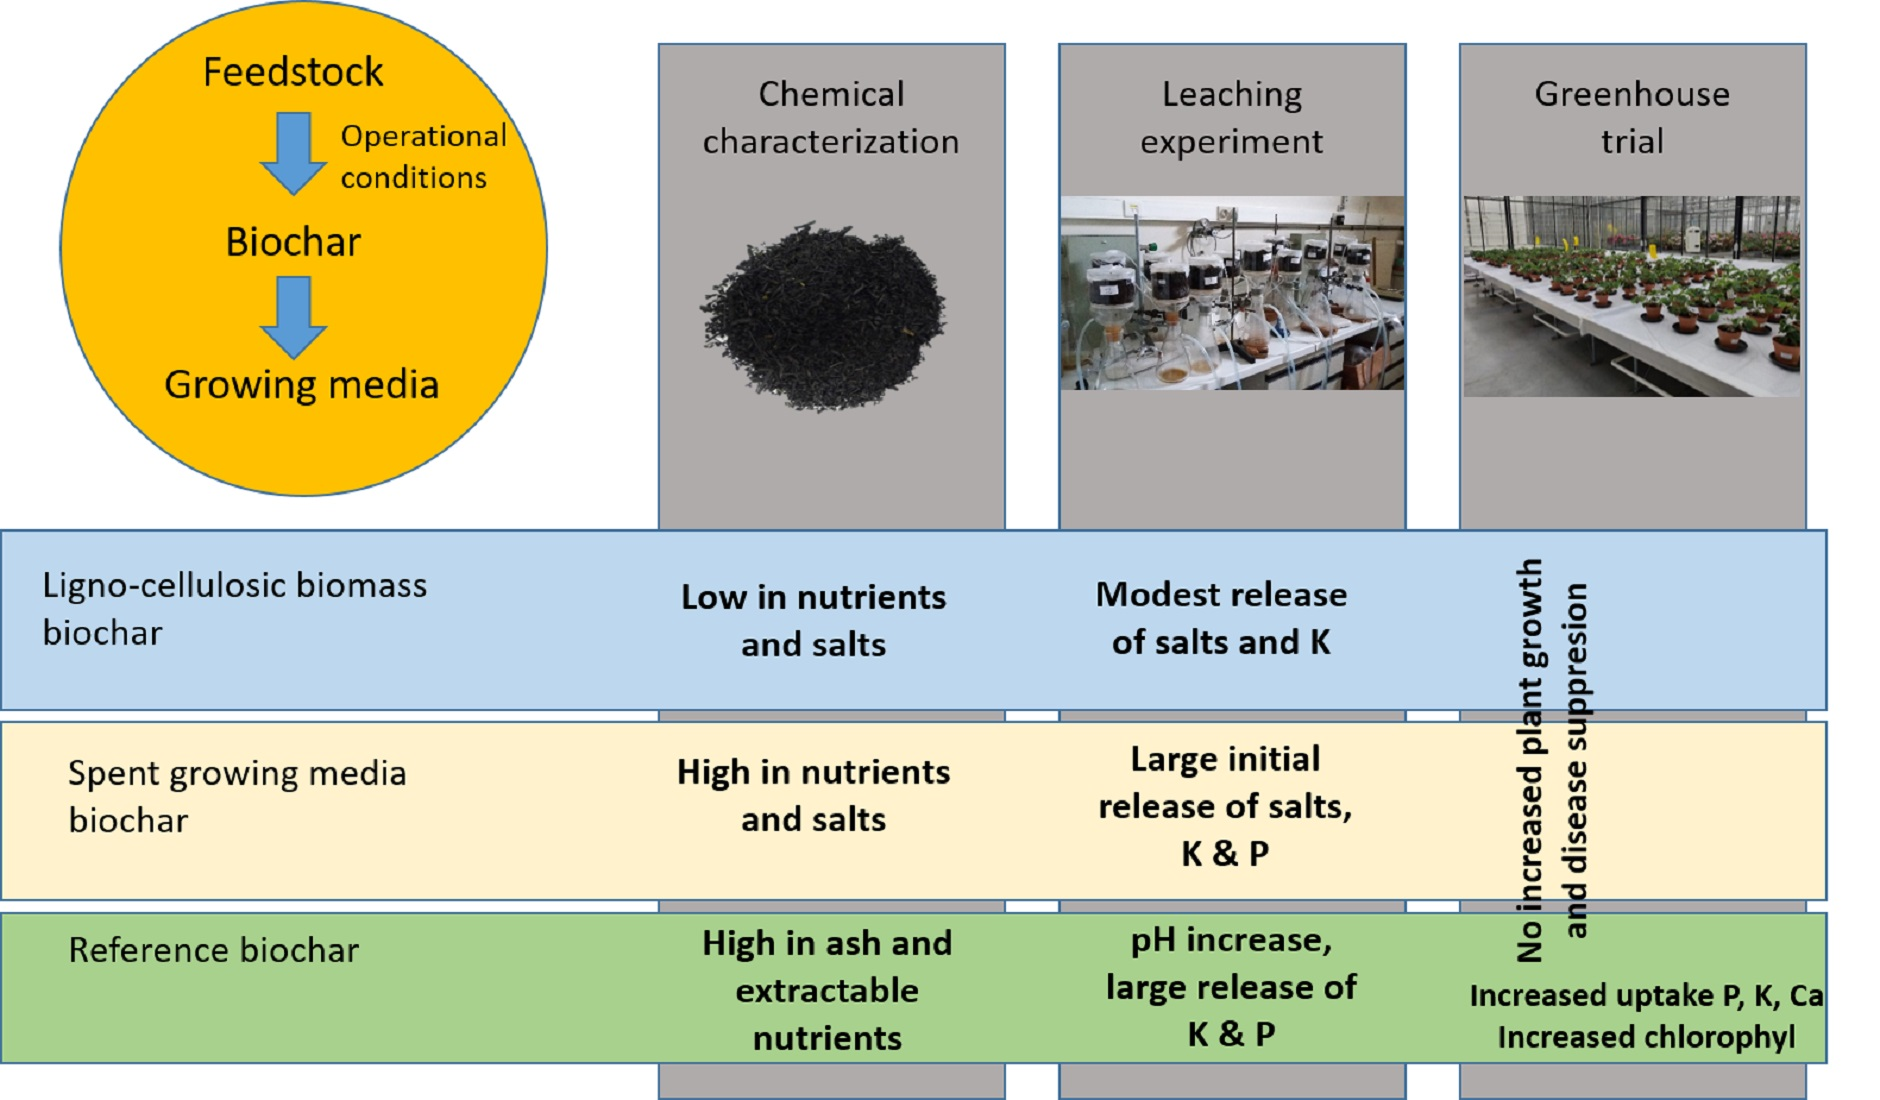
1.3. Feedstock Related Effects

Biochar can be produced from a wide variety of feedstocks, ranging from lignocellulosic materials (as wood, reed, and grass) to nutrient rich waste streams as manure. It was already shown that the feedstock origin strongly influences the biochar physical properties as bulk density, total pore space, specific surface area, and moisture characteristics, which are important for their fitness for use in growing media [7]. The nutrient properties of the biochar are largely determined by the nutrients present in the feedstock [1]. As a result, the widely diverging feedstocks will affect the suitability of the resulting biochars for their use in growing media, but it is not clear to what extent.
Although soilless cultivation based on growing media can be circular in a high degree, there still is “waste”, including the remaining crop residues after harvest and the spent growing media. Spent growing media (SGM) are an example of nutrient rich waste materials [21]. They can be directly incorporated into the soil as soil improver, used as bulking agent for composting [22,23], directly reused as substrate with or without hygienization step (e.g., [21]), or used as feedstock for energy [24] and/or biochar production. Recycling of nutrients (N, P, and K) in SGM attributes to circular horticulture and environmental sustainability. Spent growing media may suffer from high nutrient and salt concentrations, reducing their capacity for recycling, e.g., direct use as soil amendment or use as bulking agent in composting. The nutrient and salt concentrations of the SGM are thus an important estimate for their potential for reuse. It is unclear to what extent biochar from SGM can be used in new growing media and how it can effect nutrients and plant growth.

1.4. Biochar Effecting Disease Suppression against Bortrytis cinerea on Strawberry

The worldwide second most significant fungal pathogen and the most important fungal disease for strawberry, including high risk for fungicide resistance, is Botrytis cinerea [25]. The need for environmentally friendly alternatives for fungicides, such as biochar addition to the growing medium, is high.
A woody and a greenhouse waste biochar showed to induce systemic resistance in strawberry leaves against B. cinerea [26]. In addition, we showed in previous research that, under low nutrient conditions, the amendment of a biochar based on stone oak resulted in enhanced root formation, fruit production, and postharvest resistance of strawberry fruits against B. cinerea [11]. Following hypotheses were made for the mechanisms involved in the disease suppressive effect against B. cinerea: (1) A nutrient addition effect of biochar, as the susceptibility of plants to diseases is known to be influenced by its nutritional status [27]; (2) a rhizosphere microbiome effect due to biochar, since the susceptibility of plants to diseases is influenced by its rhizosphere microbiome (e.g., [28]); (3) an effect of biochar by inducing the plant’s systemic resistance [29]. It is unclear whether this effect is attributed to the changes in the rhizosphere microbiome described above and/or whether biochar acts directly as an elicitor/priming agent. It is difficult to differentiate between these 3 mechanisms and possibly a combination of mechanisms are involved. Moreover, it is not clear what the effect is of the nutrient concentrations supplied during cultivation on these mechanisms. Higher nutrient concentrations are usually supplied [27] than was the case in the experiments of De Tender et al. [10,11].

1.5. Research Questions and Hypothesis

In the present study, eleven biochars were processed from two types of residues: Lignocellulosic material (wood, flax shives, or Miscanthus straw) versus spent growing media. Our previous experiments involved only one specific biochar produced from holm oak wood [10,11], further called the reference biochar. Positive effects of the addition of the reference biochar on plants, roots, fruits, and disease suppression were observed as described above. Addition of the reference biochar increased the K content in the growing media, but it was not clear if K was taken up by the strawberry plants.
The research questions are: (i) How do biochars based on other feedstocks than the reference biochar [10,11] differ in their effects on plant growth, nutrient uptake and disease suppression? Can potential differences among the biochars for nutrient and salt leaching, interaction with fertigation, and plant uptake be related to the type of feedstock (lignocellulosic material versus spent growing media)? (ii) Is the disease suppressive effect and the plant growth promotion of the reference biochar in limed peat similar as described in De Tender et al. [10,11]? (iii) Is there a positive effect of the biochars based on spent growing media on plant growth as source of nutrients and on disease suppression, or are there negative effects (i.e., salts)? We hypothesize that biochar from spent growing media has diverging properties and modes of action in a peat-based growing medium, compared to lignocellulosic biochar. We evaluated this hypothesis by a 3-step approach: (i) Chemical characterization, (ii) a column test with fertigation and (iii) a greenhouse strawberry trial with peat blended with different biochars and with increasing mineral fertilizer doses.

2. Materials and Methods

In total, 11 biochars were produced from lignocellulosic materials (n = 6) and spent growing media (n = 5). First, the composition of the produced biochars was compared between the groups, and with the biochar feedstocks. Second, a selection of the biochars (Table S1) was tested in a leaching experiment to assess interaction between nutrients, limed peat and biochars. Finally, three biochars and the reference biochar (Table S1) were tested in a greenhouse trial with strawberry for evaluation of their effects on plant growth and yield, nutrient uptake and disease suppression.

2.1. Biochar Production and Characterization

2.1.1. Biochar Production

The reference biochar has already been tested in numerous studies [30,31,32,33,34,35,36] and was made from holm oak by slow pyrolysis at 650 °C, at atmospheric pressure, with a residence time in the kiln of 12–18 h, 0% oxygen content (Proininso Inc., Málaga, Spain) and was previously tested by De Tender et al. [10,11] for strawberry cultivation. The other biochars were produced by ECN > TNO using the Pyromaat reactor under controlled conditions. The Pyromaat reactor is an indirectly heated screw reactor and is able to convert typically 3–5 kg h−1 of fuel in an atmosphere of choice at temperatures up to 800 °C. The heat needed in the reactor was supplied indirectly by the reactor wall. The pyrolysis experiments included a variety of feedstocks (see below) at a fixed furnace temperatures (400 vs. 650 °C as measured at the inside of the outer wall of the reactor). The reactor was a cylindrical horizontal vessel, in which the material is transported and mixed by an internal screw. The reactor allowed for a gas flow in countercurrent mode to prevent tar condensation. For all biochars used in the present study a mixture of steam and nitrogen gas was used. Biochar quantities of approximately 1–1.5 kg per hour have been produced for each processing condition and feedstock. Each pyrolysis run lasted at least three hours (with 30 min residence time for the biomass) to ensure sufficient biochar product for characterization and experiments. All biochars were activated to some extend due to the use of heated N2 and steam during the 1-step gasification production process, except for the wood from forestry management processed at 400 °C, that was treated with 30 L N2 only. In total, 11 biochars were produced based on seven feedstock materials (Table 1): (i) Three lignocellulosic materials (flax shives, miscanthus straw and wood from forestry management) gasified at two temperatures (400 °C and 650 °C), resulting in 6 lignocellulosic biochars, and (ii) four batches spent growing media from which one gasified at two temperatures (400 °C and 650 °C), and three gasified only at 650 °C, resulting in five spent growing media biochars.

2.1.2. Chemical Characterization and Data Handling

The biochars, their feedstocks, the limed peat of the leaching experiment and the peat blends of the greenhouse trial were chemically characterized using methods based on European Standards developed by CEN, the European Committee for standardization. Dry matter content, moisture content and laboratory compacted bulk density were determined according to EN 13040. Total pore space was calculated based on EN 13041 and included both the internal pores of the particles and the pore spaces between particles. Organic matter (OM) content and ash (=100−%OM) were determined according to EN 13039. Total N content was determined according to the Dumas method (EN 13654-2) with a Thermo Scientific flash 4000 analyzer (Thermo Scientific, Waltham, MA, USA). Organic (OC) and inorganic (IC) C were measured with a Skalar Primacs SLC TOC analyzer or Skalar Primacs SN100-IC C/N analyzer (Skalar Analytical B.V., Breda, The Netherlands), and C/N ratio was calculated as the ratio of OC over total N. Total Al, Ca, K, Mg, Mn, Na and P were measured by a 5110 VDV Agilent ICP-OES (Agilent, Santa Clara, CA, USA) after digestion of 0.2 g biochar with 8 mL HNO3 (p.a. 65%) and 4 mL H2O2 (p.a. 30%) in a 2:1 ratio using a Milestone ETHOS One high performance microwave digestion system (in 15 min to 200 °C, hold 15 min at 200 °C, max. 1500 W). The electrical conductivity (EC, EN 13038), pH-H2O (EN 13037) and several water-extractable elements (-H2O) were measured (EN 13652) in a water extract (1:5 solid:water v/v): C and P by a 5110 VDV Agilent ICP-OES (Agilent, Santa Clara, CA, USA), NO3-N, Cl and SO4 with a Dionex DX-3000 IC ion chromatograph (Dionex, Sunnyvale, CA) and NH4-N with a Skalar SAN++ flow analyzer (Skalar Analytical B.V., Breda, The Netherlands). Ammonium acetate extractable Ca, K, Mg, Mn, Na and P were measured by ICP-OES after extracting the sample in ammonium acetate (pH 4.65, 1:5 solid:water v/v). The cation exchange capacity (CEC) was determined by ammonium acetate at pH 7.0 and KCl, modified by Vandecasteele et al. [37] from the method by Rajkovich et al. [38]. The characteristics, analyzed on one replicate per sample, were compared with a two sample t-test for the lignocellulosic biochars (6) versus the biochars based on SGM (5), and for the biochars based on SGM (5) versus the initial SGM (4), after verifying that the data was normally distributed and between-sample variability was equal.

2.2. Leaching Experiment

2.2.1. Input Materials for the Leaching Test

The peat used was Prelvex white peat 100% (AVEVE Lammens, Wetteren, Belgium) that was limed 7 days before the beginning of the leaching experiment with 1.4 g growing media magnesium lime per liter of peat (RHP, MG’s-Gravenzande, The Netherlands). Besides the pure limed peat, seven blends of 90 volume percentage of limed peat with 10 volume percentage of varying biochars (Table S1) were tested.

2.2.2. Set-Up

The pure limed peat and the seven blends (in duplicate) were tested in a column leaching experiment [39]. Each leaching column (ROBU, diameter 125 mm and height 110 mm, Figure S1) was filled with 1 L of peat/blend on top of a Macherey-Nagel GF/D filter (2.7 µm) and a glass fiber filter (10–16 µm). On top of the peat (blend), a Macherey-Nagel 640w paper filter was placed. The water or fertigation solution was pumped onto the sample by a peristaltic pump (Watson Marlow 503S/RL) at an average solution addition speed of 0.067 L per day onto one column (0.012 m2). This is comparable to drip fertigation rates for strawberry in greenhouse culture during low evaporation conditions [27]. The composition of the percolated solution was analyzed twice a week after recording the collected volume in the leachate bottle. The pH was measured by a Metrohm 785 DMP Titrino pH meter (Metrohm, Herisau, Switzerland) and EC by a Consort C832 EC meter (Consort, Turnhout, Belgium), both with temperature correction. Anion concentrations (NO3, SO42−) were measured by a Dionex DX-3000 IC ion chromatograph (Dionex, Sunnyvale, CA, USA), elemental concentrations (Al, Ca, Fe, K, Mg, Mn, Na, P) were measured by a 5110 VDV Agilent ICP-OES (Agilent, Santa Clara, CA, USA) and NH4+ by a Skalar SAN++ flow analyzer (Skalar Analytical B.V., Breda, The Netherlands).
The first phase of the leaching experiment consisted of 21 days of dripping a fertigation solution to investigate the interaction between the incoming nutrients and the peat (blend). This fertigation solution was prepared by solving 1 g of N-P-K-Mg 20-5-10-2 fertilizer in 1 L of demineralized water. In the second phase of the leaching experiment (14 days), fertigation was switched to demineralized water to verify if the accumulated nutrients could be leached out.

2.2.3. Data Handling

The net leached mass (NLM) of the elements in the leaching experiment was calculated as the cumulative leached mass subtracted by the total mass added by fertigation, with mass calculated as the product of measured volume and concentration:
NLM   ( element ) = i = 1 n c l , i × V l , i i = 1 m c f , i × V l , i
with NLM in mg, cl and cf the measured concentration in mg L−1 in the leachate and the fertigation solution, respectively, i the number of the collection event, n the total number of leachate collections during the whole leaching experiment and m the total number of leachate collections during the fertigation phase. Vl is the measured leachate volume in L, assuming that this volume is equal to the added fertigation volume (no volume loss).
The net relative accumulated mass (NRAM) of the elements in the leaching experiment was calculated as the total mass added by fertigation subtracted by the cumulative leached mass, given as percentage of the mass added by fertigation (with symbols as explained in the previous paragraph):
NRAM   ( element ) = i = 1 m c f , i × V l , i i = 1 n c l , i × V l , i i = 1 m c f , i × V l , i × 100 %
The concentrations in the leachate, the NLM and the NRAM of the elements were compared between the pure peat and the blends by ANOVA and Dunnett’s test with pure peat as control group. A preliminar leaching experiment with pure peat and peat blends performed with 3 replicates, showed compliance with the ANOVA assumptions [39].

2.3. Greenhouse Strawberry Experiment

2.3.1. Rationale

Biochars made of spent coir and spent peat from strawberry cultivation were tested in a greenhouse experiment with strawberry and compared with other types of biochars (Table S1). A series of fertilizer doses were included as reference. Besides plant growth and yield, the nutrient uptake in aboveground plant parts and fruits was measured to assess the effect of the biochar type on the nutrient use efficiency. The biochars were tested at a dose of 2 g DM L−1 limed peat. This low dose was selected based on previous research using the reference biochar [10,11]. As fertilizer, we selected Haifa Multi-mix Potting Soil 14+16+18 (+micronutrients) PGMix fertilizer (Haifa North West Europe), a combination of several nutrients (most importantly 14%N, 16% P2O5 and 18% K2O) and the related salts. By applying different doses of this fertilizer (see experimental set-up), we combined the assessment of effects of (i) increasing concentrations of nutrients and salts on plant growth and (ii) nutrient release of the four tested biochars relative to the fertilizer doses.

2.3.2. Experimental Set-Up

Strawberry plants were grown in 1.5 L pots containing Prelvex white peat 100% (AVEVE Lammens, Wetteren, Belgium), mixed with different PGMix fertilizer doses (0.70, 1.05, 1.40 and 1.75 g PGMix per L) and 1.43 g lime per L (RHP, MG’s-Gravenzande, The Netherlands). For the biochar treatments, the peat substrate with 1.05 g PGMix per L was mixed with 2 g dry matter (DM) biochar per L peat substrate. Cold-stored bare-root strawberry transplants (cultivar Elsanta) were planted in all pots with pre-incubated blends. The pots were arranged in a semi-randomized design in the greenhouse and plants were grown for 11 weeks at 20 °C. More details on biochar preparation, pre-incubation, replicates and water gift is given in the Supplementary Material.
From week 6 onwards, fruits started to appear on the plants. Ripe fruits were picked per plant, counted and weighed, and this on 6 sampling times. Part of these fruits were inoculated with B. cinerea and the remaining fruits were used for chemical characterization (see below). Strawberry plants (leaves, petioles + remaining fruits) were sampled after 11 weeks of plant growth and weighed (fresh weight (FW) and dry weight (DW, 48 h at 70 °C)). In addition, the root development, depending on the number of visible roots (lateral roots and root hairs) on the surface, was measured by giving a 0–3 developmental score, with 0 = no visible roots, 1 = a few roots; 2 = roots all over the substrate surface; and 3 = substrate surface fully covered with roots.
At the end of the experiment, the total leaf area (TLA) was measured with a high resolution flatbed photo scanner (Konica Minolta Bizhub C224e, Konica Minolta, Tokyo, Japan) and analyzed using ImageJ. Furthermore, chlorophyll content was estimated, as described in detail by Debode et al. [40] and Vandecasteele et al. [37], for each of the three separate leaflets of two fully grown compound leaves of these six plants per treatment (details in Supplementary Material).
Statistical analysis of the plant leaves, fruits, chlorophyll content, and root score was done using a general linear model (lm), as described in De Tender et al. [41]. Homogeneity of variances was checked by means of boxplots and data normality was checked by QQplots.
Plant leaves of 4 plants per treatment were inoculated after ten weeks of plant growth with B. cinerea isolate PCF895 [42] according to the method of Harel et al. [26] and described in detail by De Tender et al. and Vandecasteele et al. [10,37] and in the Supplementary Material.
From the moment strawberry fruits were formed, these were picked and on average ten fruits per treatment were inoculated with B. cinerea according to the method of Reddy et al. [43] and described in detail in De Tender et al. [10]. The area under the disease progress curve (AUDPC) was calculated based on the relative infection scores [44]. In total, the inoculation was repeated independently six times. For B. cinerea infection on fruits, the AUDPC value is used as disease index. A general linear model was used with biochar treatment and repeat (infection was scored on four independent time points) as main effects, according to Schandry [45].

2.3.3. Chemical Characterization of the Growing Media, Plant Leaves, and Strawberry Fruits

The peat substrate was sampled at the beginning and end of the greenhouse experiment. The six biological replicates per treatment were sampled at the end of the experiment, mixed and one composite sample per treatment was analyzed (see Section 2.1.2). Details on the analysis of the leaves, plants, and fruits can be found in the Supplementary Material.
Total uptake in the leaves was compared between the blends by ANOVA and Dunnett’s test with the 1.05 g PGMix L−1 peat as control group, after verifying that the data was normally distributed and between-sample variability was equal.

3. Results

3.1. Chemical Characterization

The materials may differ in their bulk density due to differences in ash and (residual) moisture content. To allow for a better comparison between the materials, pH, EC, and extractable nutrients and salts were expressed on a volume basis. In general, the feedstocks based on spent growing media were characterized by high salt and nutrient contents (Table 1 and Table S2). In comparison with the initial feedstock, the biochars based on SGM had a significantly higher pH-H2O, significantly higher extractable K (K-aa) and Cl (Cl-H2O) concentrations and significantly higher total P, K, Ca, and Na concentrations, higher %OC and C/N ratio and lower mineral N, water-extractable P and CEC values (p < 0.01 for all listed characteristics), but not a higher EC. In general, total elemental concentrations increased 2- to 4-fold during pyrolysis, except for C and N. When compared with the lignocellulosic biochars, the biochars based on SGM were significantly higher in EC, ash, %IC, extractable K, Mn, Ca, SO4, and Cl, total Mg, Ca, Na, and N (Fe data not given since most numbers were below or close to the quantification limit), thus resulting in significantly lower C/N ratios. There was no difference in CEC and in total P and K between the lignocellulosic biochars and the biochars based on SGM. In comparison with the lignocellulosic biochars, the reference biochar was rich in Ca, IC and has a high ash content. The availability of nitrate-N and ammonium-N is below detection limit for all biochars, while the SGM still had detectable mineral N concentrations (Table S2). The biochars based on SGM had a similar total pore space compared to lignocellulosic biochars. Biochars produced at 400 °C had a higher CEC than biochars produced with the same feedstock at 650 °C.

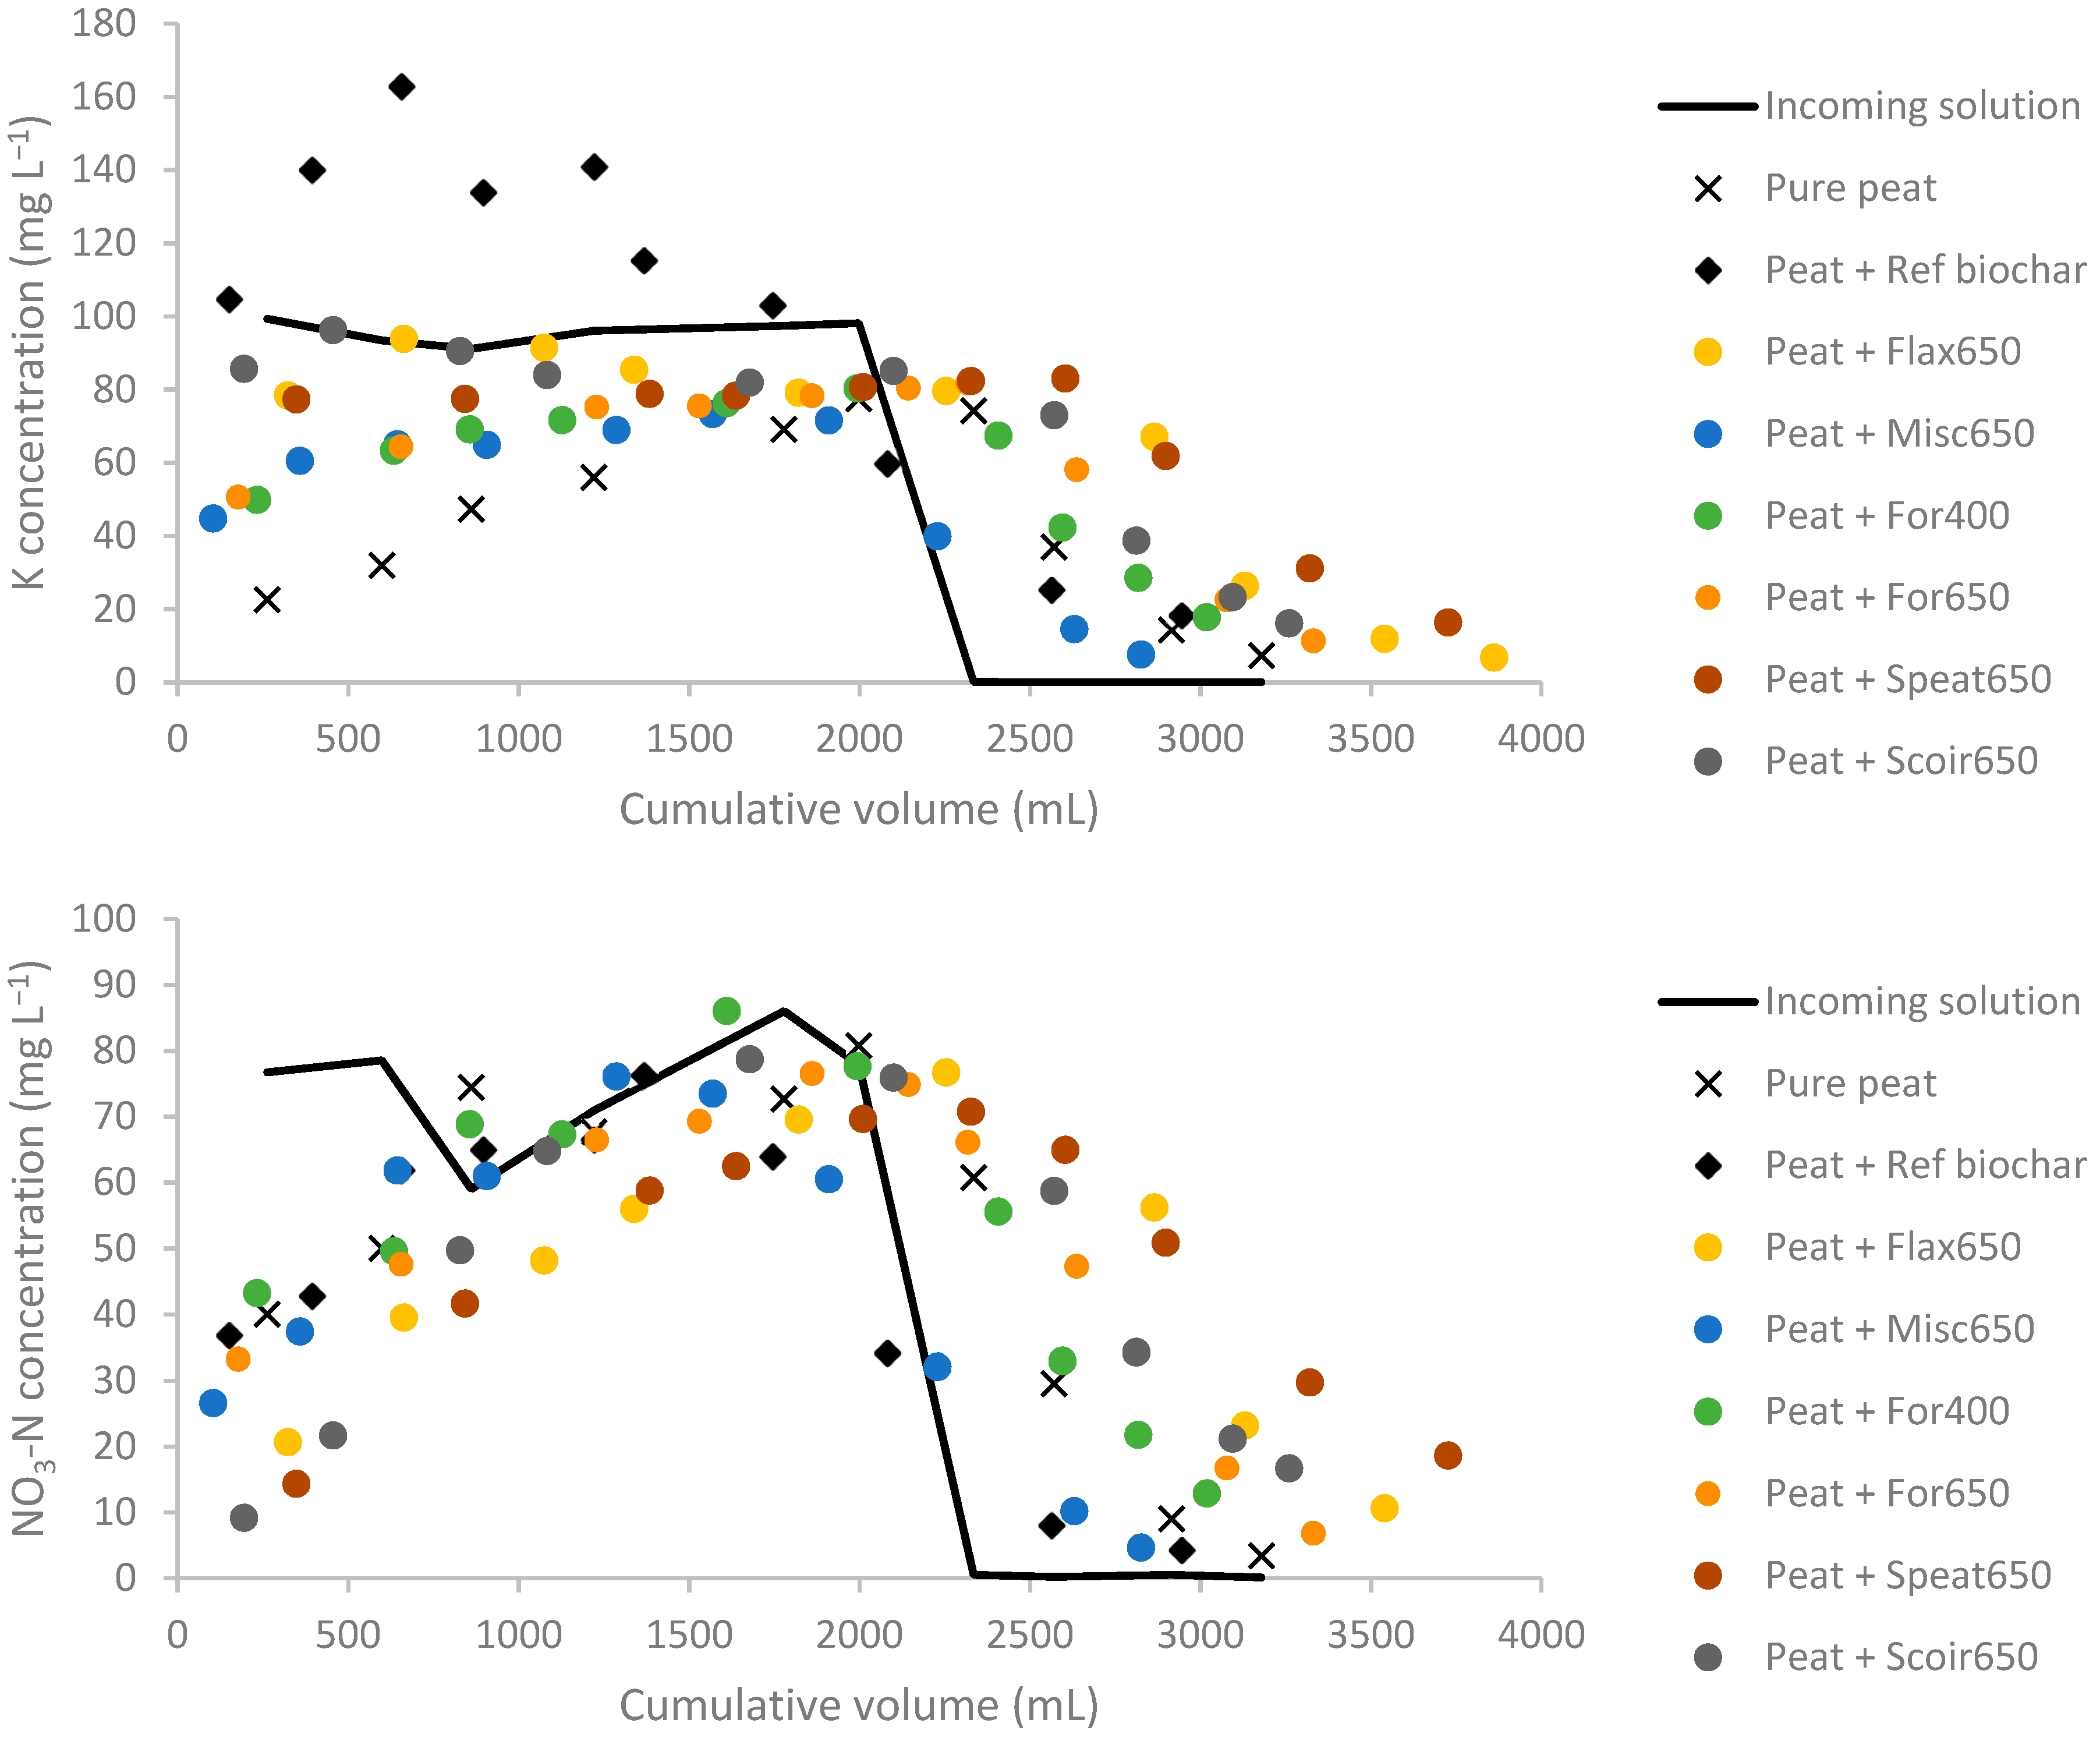
3.2. Leaching Experiment

3.2.1. Course of the Leaching Experiment

The composition of the peat (Table S3) differed significantly from the biochars (Table 1 and Table S2), resulting in differences in leachate composition during both the fertigation (on average 2.0 L) and the water irrigation (on average 1.3 L) phase (Table 2, Figure 1 and Figure S2). During the percolation, elements in the fertigation solution could be accumulated by the peat and/or biochar (e.g., lower K concentration in the leachate compared to the concentration in the fertigation solution, Figure 1 and Table 2). Alternatively, elements present in the peat or biochar could be leached out by the percolating solution, resulting in a higher concentration in the leachate compared to the fertigation solution. In addition, elements temporary accumulated during the fertigation phase can be leached out during the water irrigation phase. The EC of the leachate was in general somewhat smaller in the leachate compared to the fertigation solution.

3.2.2. Interaction of Biochar with Percolating Solution

Peat interacted with the percolating solution resulting in a leachate composition deviating from the fertigation solution composition (Table 2), as was demonstrated and discussed previously [37]. For example, strong K retention by the limed peat was observed (Figure 1, Table 2, Table 3 and Table 4). In order to study the interaction between nutrients and biochar, it is important to compare effects of the peat blends with the limed peat and not with the incoming solution. The pH during the fertigation phase was significantly higher in the leachates of the peat blended with ref biochar, Speat650, and Scoir650 than in the leachates of the pure limed peat (Table 2). Compared to the pure limed peat, some biochars showed an accumulation of Fe, Mg (limited), NO3-N, NH4-N, and release of Mn, Na, P, SO4, Cl, and especially K during the fertigation phase (Figure 1, Figure S2 and Table 2). No significant effects of biochar addition on the EC of the leachate were observed.
Release of elements from the biochars to the leachate is possible if the elements present in the biochar are available for exchange with the percolating solution. This release can be limited or large compared to the total or available mass of the elements present in the biochar. Release can be only temporary or lasting. A temporary release is observed by a larger concentration in the leachates of the biochar-peat blend compared to the pure peat during the fertigation phase but not during the water irrigation phase. This was the case for Na and Cl, and to a lesser extent for SO4 (Figure S2). This temporary release can however be large, e.g., for ref biochar, Speat650, and Scoir650 (Table 2). The total released mass of Na, SO4, and Cl by the biochars (Table 3, taking the released mass by the pure peat into account) equaled the available and total mass of these elements present in the added biochar (Table 1 and Table S2), confirming that all Na, SO4, and Cl was released quickly. For P, the release from the biochars continued to a limited extent during the water irrigation phase for some biochars (Figure S2). The total released mass of P during the column experiment was similar to the ammonium acetate available P mass and approximately half of the total P mass in the biochars (Table 1 and Table S2). Although both the total and ammonium acetate available P in the biochar explained the net released P mass well (p < 0.001), the R2 value was larger for the ammonium acetate available P (0.90) than for the total P mass (0.68). In conclusion, the available P in the biochar was released rather quickly, but some non-available P remained in the biochar and was not immediately subject to leaching. For Mn there was some extended release also during the water irrigation phase for ref biochar and Misc650 (Figure S2). For the latter, all ammonium acetate extractable (so-called available) Mn (Table S2) was released, but for ref biochar and Speat650 most of their rather large ammonium acetate extractable Mn mass was not leached out. As a consequence, the net released Mn mass was not that well explained by both the available (R2 = 0.52) and total Mn mass of the biochar (R2 = 0.64). The release of Ca was not-significant, even for ref biochar with a very high ammonium acetate available Ca mass (Table S2). The net leached Ca mass was therefore not well explained by the total Ca mass (R2 = 0.30) and the ammonium acetate available Ca mass (R2 = 0.24). The largest release from biochar was noticed for K, for all biochars but especially for ref biochar (Figure 1, Table 2 and Table 3). Potassium release even continued during the water irrigation phase but dropped towards the end of the column experiment. At the end the net released mass almost equaled the ammonium acetate available and total K mass of the biochars, with R2 values of 0.95 and 0.94 respectively. Potassium release was not as quick as Na and Cl release, but was also limited in time. Some biochars had much larger Mg, Fe, and Al contents than the pure peat (Table 1 and Table S3), but this resulted not in Mg, Fe, or Al release.
Some of the elements in the fertigation solution were accumulated by the biochars, as could be seen from the difference in leachate concentrations with the pure limed peat: Fe, Mg (limited), NO3-N, and NH4-N (Table 2). Most of these accumulated elements were released again during the water irrigation phase (Figure S2), resulting in no significant difference in the net leached mass of the elements at the end of the leaching experiment (Table 3). Since the total added mass by fertigation depended upon the slightly varying pump speed, it is more correct to compare net accumulated mass of the elements (Equation (2), Table 4). No significant differences of net leached mass of NO3-N were observed between treatments at the end of the column experiment (Table 3 and Table 4), suggesting that the accumulation of NO3-N by some biochars was only temporary. Prolonged accumulation of Fe and NH4-N was observed for ref biochar.
Release and accumulation characteristics of the biochars differed widely. Most blends with lignocellulosic biochars (For650, For400 and Misc650) showed almost no differences with the pure limed peat, except from some initial K release. Misc650 also significantly released Mn. The biochars from SGM (Speat650 and Scoir650) increased the pH and showed especially release from K, Na, SO4, and Cl. Flax650 showed some temporary Ca and NO3-N accumulation and significant release of K and P. Ref biochar showed most pronounced differences with the other biochars: prolonged accumulation of Fe and NH4-N, increase of the pH of the leachate by 2 units and pronounced release of K, P, Na, Ca, and Mn.

3.3. Greenhouse Strawberry Experiment

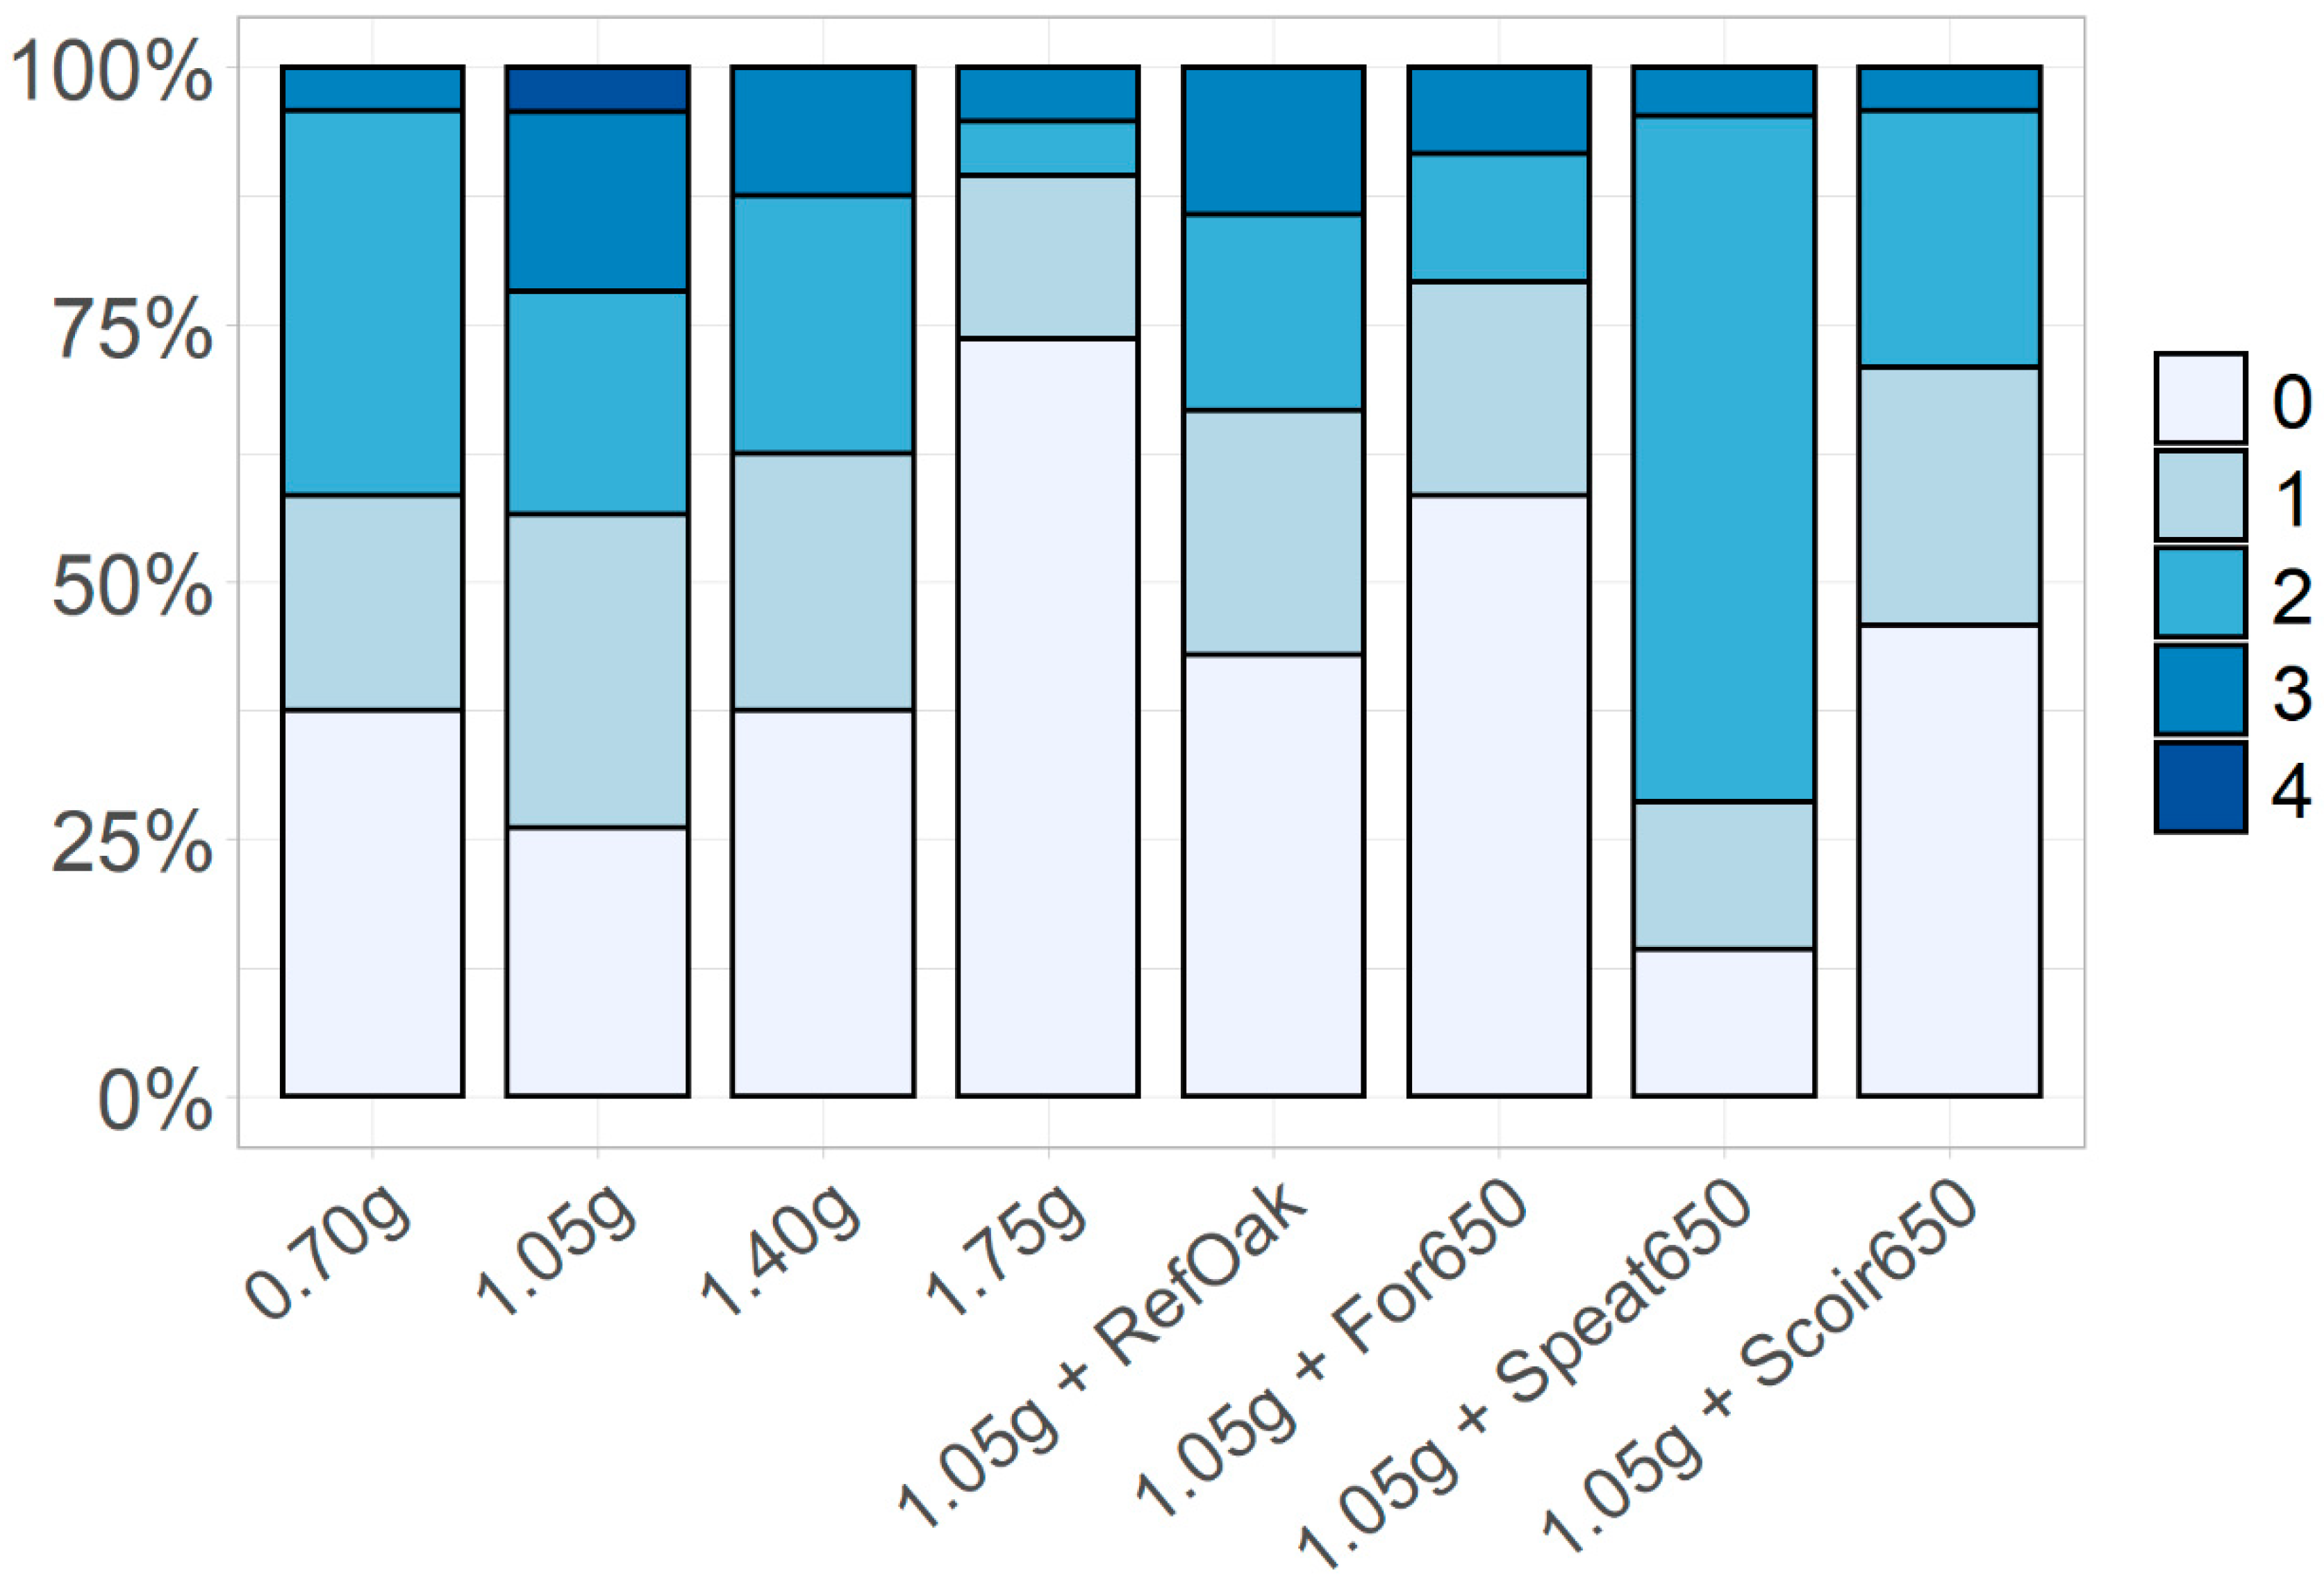
3.3.1. Water Use, Plant Parameters and Disease Resistance

The average water use per pot during the experiment was 6.5 L (Table S4). No significant differences in water use between treatments were observed, but some trends were found: Water use increased with increasing fertilizers levels, and was higher for Ref biochar and Scoir650 than for For650 and Speat650.
Increasing the fertilizer dose did not result in significant higher yields, but there was a tendency of a higher total chlorophyll content at higher fertilizers doses, with a significant lower total plant CCI for the lowest fertilizer dose (0.70 g PGMix L−1) than the reference fertilizer dose (1.05 g PGMix L−1) (Table 5). There was also a tendency that all biochars have a negative effect on plant growth and yield (with For650 a significant lower DW and Speat650 a significant lower TLA compared to the reference fertilizer dose), except for Scoir650 for which no effect was seen. Remarkably, ref biochar had a significant higher CCI as compared to the unamended treatment (1.05 g PGMix).
Adding biochar to the limed peat had no effect on the disease susceptibility of the fruits (Table 5). The highest fertilizer dose and For650 caused a significant lower disease severity on the leaves than the reference fertilizer dose (p < 0.01 and p < 0.05, respectively) (Figure 2). No significant correlation was found between the plant growth parameters and disease severity (p < 0.05).

3.3.2. Nutrient Uptake

Higher values for EC, mineral N, SO4, P (both confirmed for P-H2O and P-aa) and K in the peat blends at increasing fertilizer doses (Tables S5 and S6) illustrate the effect of fertilizer dose. There was no effect of fertilizer or biochar addition on the pH of the blend. In the used limited application dose (2 g L−1), biochar addition did not result in higher available concentrations of mineral N, SO4, P, Ca, and Na in the peat blends at the start of the trial (Tables S5 and S6). The ammonium acetate extractable Ca, P, K, and Mg concentrations were lower for the peat with biochar addition compared to the reference fertilizer treatment. Due to nutrient uptake by the plants, all peat blends had lower values for EC, mineral N, SO4, and P-H2O at the end of the trial than at the start of the trial (Table S5). Only the treatment with the highest fertilizer dose had a residual water extractable mineral N (NO3-N and NH4-N) concentration >20 mg N L−1. This illustrates that fertilizer and biochar nutrients were used by the plants during the trial. The blends with biochar had somewhat higher pH values at the end of the trial, and showed low residual concentrations for water-extractable N and P.
On average higher N, P, K, Mg, Ca, and Na uptake in the aboveground biomass were observed at increasing fertilizer dose, but only the K uptake was significantly higher for the 1.75 g PGMix L−1 versus the reference fertilizer dose (Table 6). One type of biochar was a source of extra P, K and Ca for the plants: adding ref biochar resulted in significantly higher total plant uptake for these elements versus the reference PGMix dose. Although adding the reference biochar did not increase the available nutrient concentrations as measured by water and ammonium acetate extraction, the strawberry plants could access additional P, K, and Ca compared to the reference fertilizer treatment without biochar. Nutrient uptake by strawberry plants in blends with the other biochars was comparable to the reference fertilizer treatment.

4. Discussion

Differences in properties and mode of action of the reference biochar, lignocellulosic biochar, and biochars from spent growing media were confirmed by the (a) chemical characterization, (b) the leaching test, and (c) the greenhouse trial with strawberry.

4.1. Biochar: Effects on Salts and Nutrients

The tested biochars were higher in EC and richer in total and available concentrations of P, K, Ca, Mg, Na, Cl and SO4 than the white peat. Starting from the feedstocks, nutrient concentrations (not N) logically increased due to the pyrolysis process (on average a factor of two-four), with in general higher nutrient concentrations with increasing pyrolysis temperature [1]. The biochars based on SGM had higher total and available nutrient concentrations compared to the lignocellulosic biochars, which was related to their feedstocks. SGM of soilless strawberry cultivation are enriched due to accumulation of nutrients and salts during use in the greenhouse [21]. The characteristics of the reference biochar, made from oak wood, were somewhat distinct from the lignocellulosic biochars, especially regarding Ca, IC, and ash content. This can be both related to differences in feedstock composition and process conditions. The reference biochar was produced in another installation with much longer residence time than the other biochars in this study, with potential consequences for several biochar characteristics [46].
Biochar addition usually increases the EC of the growing media [6], which can be problematic especially for biochars from nutrient rich feedstocks [7]. However, in the strawberry trial of the present study no increased EC nor nutrient concentrations of the peat-biochar blends compared to the reference peat treatment were observed, possibly explained by the low biochar application rate (2 g per L peat) combined with the addition of PGmix fertilizer. For the leaching experiment with higher biochar application rate (10% v/v), no EC increase by biochar addition was observed in the leachate, even not for the biochars from SGM. In contrast, some prominent effects of the biochars on nutrient release in the percolating water were observed. This release was quick and total for Na and Cl. For K and SO4 the release was somewhat slower but by the end of the experiment, all K and SO4 added by the biochars was leached out. This partly (lignocellulosic biochars) or totally (reference and SGM biochars) counteracted the K accumulation by the white peat. Although biochar can bind incoming nutrients by electrostatic forces (CEC and anion exchange capacity, AEC), biochars acted dominantly as a source of Na, Cl, SO4, K, P, and Mn in this study. For P and Mn, however, the total added mass was not released completely, leaving part of the added mass in the peat blend. Since P and Mn concentrations were not elevated at the end of the leaching experiment (Figure S2), this remaining part is not readily available for leaching. Biochar has been reported as a source of K and P before [11,12,13], with variation in the extent of the release. Di- and trivalent ions Ca, Mg, Al, and Fe were not significantly released by the biochars in the present study, although they were sometimes present at high quantities and were extractable by ammonium acetate.
The released Na, K, P, SO4, and Cl amounts were significantly larger for the reference and SGM biochars compared to the lignocellulosic biochars, related to the nutrient rich feedstocks of these biochars, and/or to the difference in pyrolysis conditions for the reference biochar. Prasad et al. [47] observed a wide variety in total and available nutrient content for four commercial biochars from wood waste, paper fibers, and husk, and also differences between the size fractions within one biochar. The amount of P and K released in column studies depended upon the biochar feedstock used in the growing media blends [48]. About 35% of total biochar P was released after a series of leaching events, the same order of magnitude as observed in the present study (details not shown). We observed that the ammonium acetate extractable P was a good estimate of the leachable P amount. Altland and Locke [48] observed that half of the biochar K was released, while this was almost all K in the present study.
Biochars may interact with the fertigation in different ways. We conclude from this experiment that nutrient release rather than retention is expected when using biochars in growing media. The question remains if the nutrients added by biochar application are available for plants. In the strawberry trial, nutrient concentrations in the blends were not increased by the limited biochar addition. However, P and K uptake by the strawberry plants increased by addition of the reference biochar. The strawberry plants could, therefore, access biochar nutrients that were not accounted as available by measurement in water and ammonium acetate extract. Ca uptake by the plants increased significantly for this biochar, in accordance with the increased Ca concentrations at the first stage of the leaching experiment. While the reference biochar had similar or even lower total P, K, and Ca amounts compared to the other biochars, the ammonium acetate extractable P, K, and Ca was distinctly largest for the reference biochar. Ammonium acetate extractable nutrient concentrations are therefore preferred over total amounts to estimate the plant available nutrient concentrations.
For tomato and sweet pepper it was shown that biochar addition to peat increased N and P levels in the plant and the N and P uptake efficiency, especially at reduced fertilizer rates [16]. Biochar P is partly available for grass [49]. Locke et al. [18] showed that biochar P and K can replace fertilizer P and K for initial plant growth (geranium, pansy, sunflower, zinnia and tomato) in growing media. However, at later growth stages P and K concentrations in leaves dropped below deficiency values although the initial P and K additions by biochar should theoretically have been sufficient. Apparently the plants benefit from a constant fertigation by mineral fertilizers compared to the initial provision of K and P by the biochar addition. In the present study, the elevated nutrient concentrations due to release by the biochars decreased to zero at the end of the leaching experiment. It is concluded that biochar can be a source of salts and nutrients in the initial phase, and that fertigation should be adapted accordingly in order to limit salt and nutrient leaching and to increase nutrient efficiency [17]. Especially in the case of nutrient rich biochars as the ones produced from spent growing media, nutrient reuse can be realized (reuse of the nutrients in the biochar) and sustainable production (avoid nutrient accumulation during cultivation) can be achieved by decreasing the initial fertigation concentrations.
In addition to act as a nutrient source, biochars can interact with nutrients by altering the pH and by (temporarily) accumulating the nutrients. The most prominent pH change was caused by the reference biochar, related to the high IC content of this biochar. The pH increase by 2 units to 6.4 is probably the reason for the Fe retention in the reference biochar blend. Biochars are known to absorb ammonium [13,35] by surface precipitation and complex formation [50] or by chemical binding and electrostatic interaction with surface functional groups [51]. A pH increase can increase the effective cation exchange capacity of the biochar and the peat, thereby increasing sorption possibilities for the positively charged ammonium anion. At the pH of the other blends (4.4–5.0) the effective cation exchange will be smaller, explaining the absence of ammonium retention in these blends. In addition, the CEC of the reference biochar is larger than the CEC of the other biochars. The CEC values of biochar are rather limited as also observed by Kharel et al. [52] and Nobile et al. [53], and significantly smaller than the CEC of peat. Increased CEC for growing media is not wanted since this could change ratios of elements in the fertigation solution [7]. Higher CEC values were measured for biochars produced at lower temperature, as was studied before [38]. This is attributed to the reduced presence of organic functional groups at higher pyrolysis temperature [1]. Even higher CEC values were observed for the feedstocks of the biochars. The feedstock type (lignocellulosic versus SGM) had no effect on the CEC of the respective biochars.
Nitrate concentrations in the leachates of the first phase of the column experiment slightly decreased upon biochar addition, similar to other studies [54,55]. At the end of the leaching experiment no significant differences in net leached nitrate mass with the pure peat were observed. This is in accordance with the study of Altland and Locke [12] who observed levelling off and broadening of nitrate peaks by biochar addition. By electrostatic binding of nitrate by the biochar AEC [56], biochar can buffer high nitrate concentrations while maintaining nitrate available for plant uptake. Values of biochar AEC were not measured in this study and the contribution of AEC to the observed temporary nitrate retention can, therefore, not be budgeted. Irreversible nutrient retention was not observed for the tested biochars.

4.2. Biochar and Plant Growth

There was a tendency of negative effect of biochar addition on strawberry plant growth and yield. This was in contrast to the previous studies by De Tender et al. [10,11] where the reference biochar had no or positive effects on strawberry plants. This is probably related to the lower fertilizer doses used in the previous study, where nutrient addition by biochar could improve plant growth. In the present study with higher fertilizer doses, the reference nutrient treatment had already sufficient nutrient availability to avoid that nutrients are the limiting factor for plant growth, and additional nutrient addition by biochar cannot further improve plant growth. The reason for the negative effect of biochar addition upon biomass (For650) and total leaf area (Speat650) is not clear. Negative effects on plant growth originating from increased EC or pH by biochar addition, as reported by Nobile et al. [53], are not likely in the present study given that EC and pH in the peat blends did not change upon the small amount of biochar addition. Disease suppression cannot explain the observed negative effects on plant growth (see Section 4.3). The positive effect of the reference biochar upon chlorophyll could be related to the increased nutrient uptake by the strawberry plants without an increase in plant biomass, resulting in higher nutrient concentrations.

4.3. Biochar and Disease Suppression

The nutritional status of a plant is known to influence its susceptibility to pathogens [57,58,59]. In the current study, both low and high fertilizer doses increase disease resistance against B. cinerea on the strawberry leaves, pointing at the role of fertilizer supply to crops for diseases.
The positive effect on disease suppression on the fruits of the reference biochar in limed peat as described in De Tender et al. [10,11] was not observed in the present study (second research question). We aimed with the reference mineral fertilizer dose in this experimental set-up for measuring the effect on disease suppression without subsequent changes/differences in plant growth or nutrient uptake. Only one biochar (For650) showed a low, but significant suppressive effect on B. cinerea on the leaves. The fact that feedstock is a main determinant for biochar mediated disease suppressions has been reported before [60]. No clear explanation for this feedstock related effect has been found so far. A nutrient effect seems not to be involved in this study as the nutrient uptake in the For650 blend was comparable to the reference fertilizer treatment without biochar. Vice versa, only for the reference biochar larger nutrient uptake was observed, and this biochar had no effect on disease suppression. Alternatively, there can be a trade-off between plant development and plant defense [61]. Mechanisms to mitigate the trade-off between growth and defense, e.g., the energy used for plant defense, inevitably leads to reduced plant fitness and hence compromises yield. However, no significant negative correlation was found between plant growth and plant resistance, indicating that there is no trade-off. Water use by the strawberry plants could not explain the observed disease suppression. Another possibility is that biochar For650 has a more positive impact on the rhizosphere microbiome and/or on inducing the defense response as compared to the other biochars tested (see the three main mechanisms explained in the introduction). Further research, including the metabarcoding of the rhizosphere microbiome and/or qPCR analysis of strawberry plant defense genes, is necessary to confirm this hypothesis.

4.4. Role of Biochar in Growing Media: Bulk Replacement or Additive

Biochars can be applied in growing media from different perspectives, i.e., in small amount or for bulk replacement. Substitution of peat with a large proportion of biochar is achievable if the physical and chemical properties of the biochar are similar to the commercial substrate or are in the ideal range for plant growth [6]. An important limiting factor is the pH and/or the pH buffering capacity of the biochar, which can result in a too high pH of the blend for plant growth [7]. In the case of biochars based on spent growing media, their use for bulk replacement in growing media may be limited due to their high nutrient concentrations, high EC and/or fine structure (i.e., a dusty biochar). However, the biochars can be added in low amounts and have beneficial effects regarding fertilizer replacement and/or establishing a stable microbial community in the growing medium. Due to the rather limited volume of the medium and the intense contact with roots in comparison with open field cultivation, the use of biochar in growing media is an opportunity for ecological intensification. Based on the greenhouse strawberry trial, no negative effects of biochars based on SGM in comparison with the other biochars were observed. In the first phase of the leaching experiment, larger nutrient leaching from the blends with biochar from SGM compared to the lignocellulosic biochars was observed. Upon SGM biochar addition, there was no increase in EC in both the leaching experiment and the greenhouse trial, while the pH was not (greenhouse) or only slightly (leaching experiment) increased. It is concluded that biochars from SGM can be used in growing media, but that at larger application rate the fertigation in the start period should be adapted and/or salt sensitive plants should be avoided. There are also some practical issues in preparing biochar from SGM: The SGM should be dried and well chopped or shredded before processing, and the resulting biochar could be rather “dusty” and hydrophobic, especially in the case of spent coir. The biochar in our study was produced in a batch-fed reactor, while it might be challenging to use SGM as feedstock in a continuous reactor.

5. Conclusions

Diverging interactions with nutrients and strawberry plants were observed for different biochars when added to peat. Biochars produced from SGM had larger nutrient concentrations and larger EC compared with biochars from lignocellulosic biomass. Nutrient concentrations in SGM increased on average by a factor two to four from feedstock to biochar, emphasizing the importance of feedstock for biochar characteristics. All tested biochars showed important releases of Na, P, SO4, Cl and especially K. In this way, biochars can counteract accumulation properties of peat (e.g., for K) and act as a source of nutrients and salts in growing media. The released amounts were significantly larger for the reference biochar based on oak wood and SGM biochars, compared to the lignocellulosic biochars. The available nutrient concentration (e.g., measured by water or ammonium acetate extraction) is superior to the total nutrient concentration of biochars to estimate the amount of nutrients to be released from the blend and to assess the availability of biochar nutrients for uptake by strawberry plants. Increase of strawberry plant nutrient uptake was only observed when the reference biochar was added to the peat, related to the very high available nutrient concentrations in this biochar. Biochar can therefore be used as an additional fertilizer, especially for P and K. By taking nutrient release by biochars into account, fertigation in the first phase of growing media use can be adopted to increase fertilizer efficiency and reduce possible salt stress.
Despite the positive results in nutrient release, no effects of biochar addition on plant growth and disease suppression could be observed. This was in contrast to the previous studies where lower fertilizer application rates were used [10,11]. This indicates that in suboptimal situations biochar application can both boost plant growth and defense by increasing the nutrient concentrations. Besides being a potential bulk material and a source of nutrients, biochars have possibly no added value for plant growth and disease suppression in optimal nutrient conditions.
We conclude that it is perfectly possible to use biochars produced from SGM in new growing media blends. No adverse effects of SGM biochar application on EC and strawberry plants compared to other biochars were observed. At the used level of fertilizer application, no added value of SGM biochar on plant growth or disease suppression was observed. The largest difference with lignocellulosic biochars was on nutrient release, which can be accounted for by adopting fertigation levels in order to profit.

Supplementary Materials

Supplementary material is available online https://www.mdpi.com/article/10.3390/agronomy11040629/s1. More details on Materials and Methods of the greenhouse strawberry trial. Table S1: Biochars tested in different experiments (codes of the biochars: See Table 1. Ref biochar: Reference biochar based on stone oak wood). Table S2. Available elements extracted in water (H2O) or ammonium acetate (aa) in mg (L biochar)−1, of spent growing media (SGM) feedstocks (below the line) and biochars,(above the line) including the ref biochar (reference biochar based on stone oak wood). See m&m for full details. Table S3. Characteristics of the white peat (not limed, except for the CEC and pH: These were measured on the limed peat) used in the leaching experiment. Available elements were extracted in water (H2O) or ammonium acetate (aa). DM: Dry matter, EC: Electrical conductivity, CEC: Cation exchange capacity. Table S4. Mean water use (standard deviation in brackets) of the different treatments in the strawberry field trial. Table S5. Initial and final pH, electrical conductivity (EC) and water-extractable nutrients at the start and the end of the strawberry trial, analyzed on a composite sample of the peat blend per treatment. Codes of the biochars: See Table 1. Ref biochar: Reference biochar based on stone oak wood. PGMix: Multi-mix Potting Soil 14+16+18 mineral fertilizer. Table S6. Ammonium acetate extractable nutrients at the start of the strawberry trial, analyzed on a composite sample of the peat blend per treatment. Codes of the biochars: See Table 1. Ref biochar: Reference biochar based on stone oak wood. PGMix: Multi-mix Potting Soil 14+16+18 mineral fertilizer. Figure S1. Overview of the setup of the leaching experiment (adapted from [62]). Figure S2. Average concentration (of 2 replicates) of Na, Mg, Mn, Ca, P, NH4-N, SO4, and Cl in the leachate of the peat and peat blend columns. The solid black line represents the incoming solution concentration (first phase: Fertigation solution, second phase: Water). Codes of biochars: See Table 1. Ref biochar: Reference biochar based on stone oak wood.

Author Contributions

Conceptualization, F.A., J.D., and B.V.; Methodology, F.A., J.D., C.D.T., and B.V.; Software, F.A., J.D., S.O., C.D.T., and B.V.; Validation, F.A., J.D., C.D.T., and B.V.; Formal Analysis, F.A., J.D., S.O., and B.V.; Investigation, F.A., J.D., S.O., and B.V.; Resources, R.V. and B.V.; Data Curation, F.A., J.D., and B.V.; Writing—Original Draft Preparation, F.A., J.D., and B.V.; Writing—Review and Editing, F.A., J.D., S.O., R.V., C.D.T., and B.V.; Visualization, F.A., J.D., S.O., and B.V.; Supervision, B.V.; Project Administration, B.V.; Funding Acquisition, B.V. All authors have read and agreed to the published version of the manuscript.

Funding

This research was funded by the Interreg 2 Seas programme 2014–2020 co-funded by the European Regional Development Fund (Horti-BlueC project, grant number 2S03-046) with co-funding of ILVO by the Province of Antwerp and the Province of East-Flanders and of ECN > TNO in the Netherlands by the province of N-Holland. Caroline De Tender received a grant (grant number 12S9418N) from the Research Foundation Flanders (FWO).

Institutional Review Board Statement

Not applicable.

Informed Consent Statement

Not applicable.

Data Availability Statement

The data presented in this study are available in the Supplementary Material.

Acknowledgments

We are grateful to PROININSO S.A. for providing the reference oak-biochar in addition to the project-biochars.

Conflicts of Interest

The authors declare no conflict of interest.

Abbreviations

-aa: Ammonium acetate extractable nutrient; -H2O: Water extractable nutrient; AEC: Anion exchange capacity; AUDPC: Area under the disease progress curve; CCI: Chlorophyll Concentration Index; CEC: Cation exchange capacity; DM: Dry matter; DW: Dry weight; EC: Electrical conductivity; FW: Fresh weight; IC: Inorganic carbon; NLM: Net leached mass; NRAM: Net relative accumulated mass; OC: Organic carbon; ref: Reference; SGM: Spent growing media; v/v: Volume per volume.

References

  1. Lehmann, J.; Joseph, S. Biochar for Environmental Management: Science and Technology; Earthscan: London, UK, 2009. [Google Scholar]
  2. Jindo, K.; Sanchez-Monedero, M.A.; Mastrolonardo, G.; Audette, Y.; Higashikawa, F.S.; Silva, C.A.; Akashi, K.; Mondini, C. Role of biochar in promoting circular economy in the agriculture sector. Part 2: A review of the biochar roles in growing media, composting and as soil amendment. Chem. Biol. Technol. Agric. 2020, 7, 10. [Google Scholar] [CrossRef]
  3. Sanchez-Monedero, M.A.; Cayuela, M.L.; Roig, A.; Jindo, K.; Mondini, C.; Bolan, N. Role of biochar as an additive in organic waste composting. Bioresour. Technol. 2018, 247, 1155–1164. [Google Scholar] [CrossRef]
  4. Nieto, A.; Gasco, G.; Paz-Ferreiro, J.; Fernandez, J.M.; Plaza, C.; Mendez, A. The effect of pruning waste and biochar addition on brown peat based growing media properties. Sci. Hortic. 2016, 199, 142–148. [Google Scholar] [CrossRef]
  5. Verhagen, J.; van den Akker, J.; Blok, C.; Diemont, H.; Joosten, H.; Schouten, M.; Schrijver, R.; den Uyl, R.; Verweij, P.; Wösten, H. Climate Change. Scientific Assessment and Policy Analysis. Peatlands and Carbon Flows. Outlook and Importance for the Netherlands, Wab 500102 027; Netherlands Environmental Assessment Agency PBL: Bilthoven, The Netherlands, 2009.
  6. Huang, L.; Gu, M.M. Effects of biochar on container substrate properties and growth of plants-A review. Horticulturae 2019, 5, 14. [Google Scholar] [CrossRef] [Green Version]
  7. Blok, C.; van der Salm, C.; Hofland-Zijlstra, J.; Streminska, M.; Eveleens, B.; Regelink, I.; Fryda, L.; Visser, R. Biochar for horticultural rooting media improvement: Evaluation of biochar from gasification and slow pyrolysis. Agronomy 2017, 7, 6. [Google Scholar] [CrossRef] [Green Version]
  8. Chrysargyris, A.; Prasad, M.; Kavanagh, A.; Tzortzakis, N. Biochar type and ratio as a peat additive/partial peat replacement in growing media for cabbage seedling production. Agronomy 2019, 9, 693. [Google Scholar] [CrossRef] [Green Version]
  9. Dumroese, R.K.; Pinto, J.R.; Heiskanen, J.; Tervahauta, A.; McBurney, K.G.; Page-Dumroese, D.S.; Englund, K. Biochar can be a suitable replacement for sphagnum peat in nursery production of Pinus ponderosa seedlings. Forests 2018, 9, 232. [Google Scholar] [CrossRef] [Green Version]
  10. De Tender, C.; Haegeman, A.; Vandecasteele, B.; Ciement, L.; Cremelie, P.; Dawyndt, P.; Maes, M.; Debode, J. Dynamics in the strawberry rhizosphere microbiome in response to biochar and Botrytis cinerea leaf infection. Front. Microbiol. 2016, 7, 2062. [Google Scholar] [CrossRef] [PubMed] [Green Version]
  11. De Tender, C.A.; Debode, J.; Vandecasteele, B.; D’Hose, T.; Cremelie, P.; Haegeman, A.; Ruttink, T.; Dawyndt, P.; Maes, M. Biological, physicochemical and plant health responses in lettuce and strawberry in soil or peat amended with biochar. Appl. Soil Ecol. 2016, 107, 1–12. [Google Scholar] [CrossRef] [Green Version]
  12. Altland, J.E.; Locke, J.C. Biochar affects macronutrient leaching from a soilless substrate. Hortscience 2012, 47, 1136–1140. [Google Scholar] [CrossRef]
  13. Bedussi, F.; Zaccheo, P.; Crippa, L. Pattern of pore water nutrients in planted and non-planted soilless substrates as affected by the addition of biochars from wood gasification. Biol. Fertil. Soils 2015, 51, 625–635. [Google Scholar] [CrossRef]
  14. Olmo, M.; Villar, R.; Salazar, P.; Alburquerque, J.A. Changes in soil nutrient availability explain biochar’s impact on wheat root development. Plant Soil 2016, 399, 333–343. [Google Scholar] [CrossRef]
  15. Glaser, B.; Wiedner, K.; Seelig, S.; Schmidt, H.P.; Gerber, H. Biochar organic fertilizers from natural resources as substitute for mineral fertilizers. Agron. Sustain. Dev. 2015, 35, 667–678. [Google Scholar] [CrossRef] [Green Version]
  16. Levesque, V.; Jeanne, T.; Dorais, M.; Ziadi, N.; Hogue, R.; Antoun, H. Biochars improve tomato and sweet pepper performance and shift bacterial composition in a peat-based growing medium. Appl. Soil Ecol. 2020, 153, 12. [Google Scholar] [CrossRef]
  17. Daniele, M.; Alessandra, B.; Sonia, C.; Cecilia, F.; Domenico, P.; Lorenza, T.; Raffaella, P. Soilless tomato grown under nutritional stress increases green biomass but not yield or quality in presence of biochar as growing medium. Hortic. Environ. Biotechnol. 2019, 60, 871–881. [Google Scholar] [CrossRef]
  18. Locke, J.C.; Altland, J.E.; Ford, C.W. Gasified rice full biochar affects nutrition and growth of horticultural crops in container substrates. J. Environ. Hortic. 2013, 31, 195–202. [Google Scholar] [CrossRef]
  19. Lawrinenko, M.; Laird, D.A. Anion exchange capacity of biochar. Green Chem. 2015, 17, 4628–4636. [Google Scholar] [CrossRef] [Green Version]
  20. Marshall, J.A.; Morton, B.J.; Muhlack, R.; Chittleborough, D.; Kwong, C.W. Recovery of phosphate from calcium-containing aqueous solution resulting from biochar-induced calcium phosphate precipitation. J. Clean Prod. 2017, 165, 27–35. [Google Scholar] [CrossRef]
  21. Vandecasteele, B.; Blindeman, L.; Amery, F.; Pieters, C.; Ommeslag, S.; Van Loo, K.; De Tender, C.; Debode, J. Grow–StoreSteamRe-peat: Reuse of spent growing media for circular cultivation of Chrysanthemum. J. Clean Prod. 2020, 276, 124128. [Google Scholar] [CrossRef]
  22. Veijalainen, A.M.; Juntunen, M.L.; Lilja, A.; Heinonen-Tanski, H.; Tervo, L. Forest nursery waste composting in windrows with or without horse manure or urea—The composting process and nutrient leaching. Silva Fenn. 2007, 41, 13–27. [Google Scholar] [CrossRef] [Green Version]
  23. Viaene, J.; Reubens, B.; Willekens, K.; Van Waes, C.; De Neve, S.; Vandecasteele, B. Potential of chopped heath biomass and spent growth media to replace wood chips as bulking agent for composting high N-containing residues. J. Environ. Manag. 2017, 197, 338–350. [Google Scholar] [CrossRef]
  24. Kraska, T.; Kleinschmidt, B.; Weinand, J.; Pude, R. Cascading use of Miscanthus as growing substrate in soilless cultivation of vegetables (tomatoes, cucumbers) and subsequent direct combustion. Sci. Hortic. 2018, 235, 205–213. [Google Scholar] [CrossRef]
  25. Petrasch, S.; Knapp, S.J.; Van Kan, J.A.L.; Blanco-Ulate, B. Grey mould of strawberry, a devastating disease caused by the ubiquitous necrotrophic fungal pathogen Botrytis cinerea. Mol. Plant Pathol. 2019, 20, 877–892. [Google Scholar] [CrossRef] [Green Version]
  26. Harel, Y.M.; Elad, Y.; Rav-David, D.; Borenstein, M.; Shulchani, R.; Lew, B.; Graber, E.R. Biochar mediates systemic response of strawberry to foliar fungal pathogens. Plant Soil 2012, 357, 245–257. [Google Scholar] [CrossRef]
  27. Vandecasteele, B.; Debode, J.; Willekens, K.; Van Delm, T. Recycling of P and K in circular horticulture through compost application in sustainable growing media for fertigated strawberry cultivation. Eur. J. Agron. 2018, 96, 131–145. [Google Scholar] [CrossRef] [Green Version]
  28. Berendsen, R.L.; Pieterse, C.M.J.; Bakker, P. The rhizosphere microbiome and plant health. Trends Plant Sci. 2012, 17, 478–486. [Google Scholar] [CrossRef]
  29. Jaiswal, A.K.; Alkan, N.; Elad, Y.; Sela, N.; Philosoph, A.M.; Graber, E.R.; Frenkel, O. Molecular insights into biochar-mediated plant growth promotion and systemic resistance in tomato againstFusarium crown and root rot disease. Sci. Rep. 2020, 10, 15. [Google Scholar] [CrossRef]
  30. Debode, J.; Ebrahimi, N.; D’Hose, T.; Cremelie, P.; Viaene, N.; Vandecasteele, B. Has compost with biochar added during the process added value over biochar or compost to increase disease suppression? Appl. Soil Ecol. 2020, 153, 8. [Google Scholar] [CrossRef]
  31. D’Hose, T.; Debode, J.; De Tender, C.; Ruysschaert, G.; Vandecasteele, B. Has compost with biochar applied during the process added value over biochar or compost for increasing soil quality in an arable cropping system? Appl. Soil Ecol. 2020, 156, 9. [Google Scholar] [CrossRef]
  32. Huang, W.K.; Ji, H.L.; Gheysen, G.; Debode, J.; Kyndt, T. Biochar-amended potting medium reduces the susceptibility of rice to root-knot nematode infections. BMC Plant Biol. 2015, 15, 15. [Google Scholar] [CrossRef] [Green Version]
  33. Lopez-Cano, I.; Roig, A.; Cayuela, M.L.; Alburquerque, J.A.; Sanchez-Monedero, M.A. Biochar improves N cycling during composting of olive mill wastes and sheep manure. Waste Manag. 2016, 49, 553–559. [Google Scholar] [CrossRef]
  34. Sanchez-Garcia, M.; Sanchez-Monedero, M.A.; Roig, A.; Lopez-Cano, I.; Moreno, B.; Benitez, E.; Cayuela, M.L. Compost vs biochar amendment: A two-year field study evaluating soil C build-up and N dynamics in an organically managed olive crop. Plant Soil 2016, 408, 1–14. [Google Scholar] [CrossRef]
  35. Takaya, C.A.; Fletcher, L.A.; Singh, S.; Anyikude, K.U.; Ross, A.B. Phosphate and ammonium sorption capacity of biochar and hydrochar from different wastes. Chemosphere 2016, 145, 518–527. [Google Scholar] [CrossRef]
  36. Vandecasteele, B.; Sinicco, T.; D’Hose, T.; Vanden Nest, T.; Mondini, C. Biochar amendment before or after composting affects compost quality and N losses, but not P plant uptake. J. Environ. Manag. 2016, 168, 200–209. [Google Scholar] [CrossRef]
  37. Vandecasteele, B.; Amery, F.; Ommeslag, S.; Vanhoutte, K.; Visser, R.; Robbens, J.; De Tender, C.; Debode, J. Chemically versus thermally processed brown shrimp shells or Chinese mitten crab as a source of chitin, nutrients or salts and as microbial stimulant in soilless strawberry cultivation. Sci. Total Environ. 2021, 771, 145263. [Google Scholar] [CrossRef] [PubMed]
  38. Rajkovich, S.; Enders, A.; Hanley, K.; Hyland, C.; Zimmerman, A.R.; Lehmann, J. Corn growth and nitrogen nutrition after additions of biochars with varying properties to a temperate soil. Biol. Fertil. Soils 2012, 48, 271–284. [Google Scholar] [CrossRef]
  39. Amery, F.; Van Loo, K.; Vandecasteele, B. Nutrients in circular horticulture: Blending peat with biochar alters interaction with fertigation solution. In Proceedings of the ISHS Acta Horticulturae: III International Symposium on Growing Media, Composting and Substrate Analysis, Milan, Italy, 24–28 June 2019. in press. [Google Scholar]
  40. Debode, J.; De Tender, C.; Cremelie, P.; Lee, A.S.; Kyndt, T.; Muylle, H.; De Swaef, T.; Vandecasteele, B. Trichoderma-inoculated miscanthus straw can replace peat in strawberry cultivation, with beneficial effects on disease control. Front. Plant Sci. 2018, 9, 213. [Google Scholar] [CrossRef]
  41. De Tender, C.; Vandecasteele, B.; Verstraeten, B.; Ommeslag, S.; De Meyer, T.; De Visscher, J.; Dawyndt, P.; Clement, L.; Kyndt, T.; Debode, J. Chitin in strawberry cultivation: Foliar growth and defense response promotion, but reduced fruit yield and disease resistance by nutrient imbalances. Mol. Plant-Microbe Interact. 2021, in press. [Google Scholar] [CrossRef] [PubMed]
  42. Debode, J.; Van Hemelrijck, W.; Creemers, P.; Maes, M. Effect of fungicides on epiphytic yeasts associated with strawberry. MicrobiologyOpen 2013, 2, 482–491. [Google Scholar] [CrossRef]
  43. Reddy, M.V.B.; Belkacemi, K.; Corcuff, R.; Castaigne, F.; Arul, J. Effect of pre-harvest chitosan sprays on post-harvest infection by Botrytis cinerea and quality of strawberry fruit. Postharvest Biol. Technol. 2000, 20, 39–51. [Google Scholar] [CrossRef]
  44. Campbell, C.L.; Madden, L.V. Introduction to Plant Disease Epidemiology; John Wiley & Sons: New York, NY, USA, 1990; p. 532. [Google Scholar]
  45. Schandry, N. A practical guide to visualization and statistical analysis of R. solanacearum infection data using R. Front. Plant Sci. 2017, 8, 623. [Google Scholar] [CrossRef] [Green Version]
  46. Li, W.W.; Amin, F.R.; Fu, Y.S.; Zhang, H.; He, Y.F.; Huang, Y.; Liu, G.Q.; Chen, C. Effects of temperature, heating rate, residence time, reaction atmosphere, and pressure on biochar properties. J. Biobased Mater. Bioenergy 2019, 13, 1–10. [Google Scholar] [CrossRef]
  47. Prasad, M.; Chrysargyris, A.; McDaniel, N.; Kavanagh, A.; Gruda, N.S.; Tzortzakis, N. Plant nutrient availability and pH of biochars and their fractions, with the possible use as a component in a growing media. Agronomy 2020, 10, 10. [Google Scholar] [CrossRef] [Green Version]
  48. Altland, J.E.; Locke, J.C. Effect of biochar type on macronutrient retention and release from soilless substrate. Hortscience 2013, 48, 1397–1402. [Google Scholar] [CrossRef] [Green Version]
  49. Vanden Nest, T.; Amery, F.; Fryda, L.; Boogaerts, C.; Bilbao, J.; Vandecasteele, B. Renewable P sources: P use efficiency of digestate, processed animal manure, compost, biochar and struvite. Sci. Total Environ. 2021, 750, 141699. [Google Scholar] [CrossRef]
  50. Fan, R.M.; Chen, C.L.; Lin, J.Y.; Tzeng, J.H.; Huang, C.P.; Dong, C.D.; Huang, C.P. Adsorption characteristics of ammonium ion onto hydrous biochars in dilute aqueous solutions. Bioresour. Technol. 2019, 272, 465–472. [Google Scholar] [CrossRef]
  51. Yang, H.I.; Lou, K.; Rajapaksha, A.U.; Ok, Y.S.; Anyia, A.O.; Chang, S.X. Adsorption of ammonium in aqueous solutions by pine sawdust and wheat straw biochars. Environ. Sci. Pollut. Res. 2018, 25, 25638–25647. [Google Scholar] [CrossRef]
  52. Kharel, G.; Sacko, O.; Feng, X.; Morris, J.R.; Phillips, C.L.; Trippe, K.; Kumar, S.; Lee, J.W. Biochar surface oxygenation by ozonization for super high cation exchange capacity. ACS Sustain. Chem. Eng. 2019, 7, 16410–16418. [Google Scholar] [CrossRef]
  53. Nobile, C.; Denier, J.; Houben, D. Linking biochar properties to biomass of basil, lettuce and pansy cultivated in growing media. Sci. Hortic. 2020, 261, 5. [Google Scholar] [CrossRef] [Green Version]
  54. Alvarez, J.M.; Pasian, C.; Lal, R.; Lopez, R.; Fernandez, M. Vermicompost and biochar substrates can reduce nutrients leachates on containerized ornamental plant production. Hortic. Bras. 2019, 37, 47–53. [Google Scholar] [CrossRef]
  55. Prasad, M.; Tzortzakis, N.; McDaniel, N. Chemical characterization of biochar and assessment of the nutrient dynamics by means of preliminary plant growth tests. J. Environ. Manag. 2018, 216, 89–95. [Google Scholar] [CrossRef]
  56. Fidel, R.B.; Laird, D.A.; Spokas, K.A. Sorption of ammonium and nitrate to biochars is electrostatic and pH-dependent. Sci. Rep. 2018, 8, 10. [Google Scholar] [CrossRef] [PubMed]
  57. Lecompte, F.; Abro, M.A.; Nicot, P.C. Contrasted responses of Botrytis cinerea isolates developing on tomato plants grown under different nitrogen nutrition regimes. Plant Pathol. 2010, 59, 891–899. [Google Scholar] [CrossRef]
  58. Nam, M.H.; Jeong, S.K.; Lee, Y.S.; Choi, J.M.; Kim, H.G. Effects of nitrogen, phosphorus, potassium and calcium nutrition on strawberry anthracnose. Plant Pathol. 2006, 55, 246–249. [Google Scholar] [CrossRef]
  59. Xu, X.M.; Robinson, J.; Else, M.A. Effects of nitrogen input and deficit irrigation within the commercial acceptable range on susceptibility of strawberry leaves to powdery mildew. Eur. J. Plant Pathol. 2013, 135, 695–701. [Google Scholar] [CrossRef]
  60. Jaiswal, A.K.; Elad, Y.; Graber, E.R.; Frenkel, O. Rhizoctonia solani suppression and plant growth promotion in cucumber as affected by biochar pyrolysis temperature, feedstock and concentration. Soil Biol. Biochem. 2014, 69, 110–118. [Google Scholar] [CrossRef]
  61. Karasov, T.L.; Chae, E.; Herman, J.J.; Bergelson, J. Mechanisms to mitigate the trade-off between growth and defense. Plant Cell 2017, 29, 666–680. [Google Scholar] [CrossRef] [Green Version]
  62. Vanden Nest, T.; Vandecasteele, B.; Ruysschaert, G.; Cougnon, M.; Merckx, R. Effect of organic and mineral fertilizers on soil P and C levels, crop yield and P leaching in a long term trial on a silt loam soil. Agric. Ecosyst. Environ. 2014, 197, 309–317. [Google Scholar] [CrossRef] [Green Version]
Figure 1. Average concentration (of 2 replicates) of K (above) and NO3-N (below) in the leachate of the peat and peat blend columns. The solid black line represents the incoming solution concentration (first phase: Fertigation solution, second phase: Water). Codes of biochars: See Table 1. Ref biochar: Reference biochar based on stone oak wood. Graphs for Na, Mg, Mn, Ca, P, NH4-N, SO4, and Cl are presented in Figure S2.
Agronomy 11 00629 g001
Figure 2. Botrytis cinerea infection score on strawberry plant leaves for 4 treatments with increasing fertilizer doses and 4 biochar treatments. The infection was scored with a value of 0 (no infection) to 4 (100% infected leaf) 7 days after infection. 0.70 g = 0.70 g PGMix L−1, 1.05 g: 1.05 g PGMix L−1 (reference fertilizer dose), 1.40 g = 1.40 g PGMix L−1, 1.75 g = 1.75 g PGMix L−1. Codes for biochar: See Table 1. Ref biochar: Reference biochar based on stone oak wood.
Agronomy 11 00629 g002
Table 1. pH, electrical conductivity (EC), total content of C (inorganic, IC and organic, OC), N, ash and total nutrients, dry bulk density, pore volume and cation exchange capacity (CEC) of spent growing media (SGM) feedstocks (below the line) and biochars (above the line) including the ref biochar (reference biochar based on stone oak wood). See material and method section for full details.
CodeMatrixFeedstockpH-H2OECC/NICOCNAshDry Bulk DensityPore
Volume
CECPKMgCaNaAlMn
-µS cm−1-%/DMg DM L−1vol%cmolc (kg DM)−1g (kg DM)−1
Ref biocharbiocharHolm oak9.1384801.38630.82029083 41.91.98.74.3850.31.60.9
Flax650biochar, 650 °CFlax shives9.8392136<0.08940.7125797 36.43.613.83.3170.91.80.1
Flax400biochar, 400 °CFlax shives9.516091<0.08690.287196 95.02.29.22.1110.50.80.1
Misc650biochar, 650 °CMiscanthus straw9.1191418<0.08840.686596 44.12.17.91.250.20.10.5
Misc400biochar, 400 °CMiscanthus straw8.742157<0.08710.365497 50.51.27.31.260.10.11.0
For650biochar, 650 °CWood forestry management9.2170249<0.08850.878195 45.91.89.32.2150.60.60.2
For400biochar, 400 °CWood forestry management8.71681500.22860.559694 56.41.25.91.5100.40.10.1
Speat650biochar, 650 °CSpent peat, batch18.771866<0.08781.2279095 17.82.48.39.4602.13.40.4
Speat400biochar, 400 °CSpent peat, batch19.81231430.50561.22318989 57.92.26.67.6491.73.00.3
Scoir650biochar, 650 °CSpent coir, batch29.755673<0.08851.3226496 36.73.513.11.4372.11.90.1
Speat3-650biochar, 650 °CSpent peat, batch39.6747600.72711.22317190 14.32.19.77.2531.43.70.4
Scoir4-650biochar, 650 °CSpent coir, batch49.3479680.53681.0269894 19.72.67.35.5533.62.70.7
SGMSpent peat, batch16.3599370.06461.2117196 112.00.83.03.5230.81.00.1
SGMSpent peat, batch35.791235<0.08431.22318593 83.80.83.23.2220.60.90.1
SGMSpent coir, batch24.243139<0.01461.284197 109.31.73.70.4130.50.30.0
SGMSpent coir, batch45.788231<0.08451.42012695 101.01.12.52.3221.40.70.2
Table 2. Composition of the fertigation solution and the leachates during the fertigation phase (weighed mean), average of two replicates with standard deviation in parentheses. The composition of the leachates between treatments is compared by ANOVA. The average composition of the leachate of the treatments with biochar are compared with the control treatment of pure limed peat by Dunnett (*: p < 0.05; **: p < 0.01; ***: p < 0.001). Codes of the biochars: See Table 1. Ref biochar: Reference biochar based on stone oak wood.
FeAlMnMgCaKNaPNO3-NNH4-NSO4ClpHEC
mg L−1-µS cm−1
Fertigation solution0.50.000.49150961.224.1751233042.15.01593
100% peat1.2 (0.0)0.13 (0.03)0.06 (0)25 (1)67 (2)52 (3)5.1 (0.7)21.5 (0.2)66 (1)75 (0)274 (9)3.7 (0.5)4.4 (0)1383 (22)
Ref biochar0.7 (0.0) ***0.08 (0.01)0.23 (0.00) ***25 (0)83 (0) **137 (1) ***9.9 (1.1)25.3 (0.3) ***59 (1)41 (6) **267 (4)5.7 (0.9)6.4 (0.0) ***1340 (44)
Flax6501.2 (0.0)0.11 (0.01)0.06 (0.00)21 (2)53 (2) *83 (0) ***6.9 (0.9)25.5 (0.4) ***55 (7) *68 (6)271 (8)4.2 (0.1)4.6 (0.0)1330 (48)
Misc6501.2 (0.0)0.17 (0.07)0.14 (0.02) *26 (3)65 (6)66 (4) **7.5 (1.7)21.1 (1.2)60 (4)59 (11)273 (1)6.0 (1.4)4.4 (0.0)1283 (74)
For4001.2 (0.0)0.13 (0.02)0.08 (0.02)23 (1)61 (3)70 (2) ***6.8 (0.5)22.0 (0.0)68 (3)71 (2)278 (7)4.5 (0.1)4.4 (0.0)1371 (8)
For6501.2 (0.0)0.10 (0.01)0.07 (0.01)22 (1)56 (4)72 (2) ***5.7 (1.0)21.6 (0.4)63 (0)73 (6)272 (0)4.5 (0.8)4.6 (0.1)1373 (42)
Speat6501.1 (0.0) *0.12 (0.02)0.11 (0.01)22 (0)61 (4)79 (4) ***11.7 (2.7)22.0 (0.4)52 (2) *70 (5)317 (27) *9.5 (2.2) **5.0 (0.0) ***1374 (7)
Scoir6501.2 (0.0)0.11 (0.01)0.07 (0.04)20 (0) *52 (1) **86 (0) ***11.2 (2.0) *24.1 (0.4) **58 (0)73 (3)300 (3)9.0 (1.6) **4.7 (0.1) **1380 (41)
p (ANOVA)<0.00010.290.00020.0310.0002<0.00010.0135<0.00010.01180.050.010.0065<0.00010.33
Table 3. Net leached mass (in mg) of the elements in the leaching experiment as calculated by Equation (1) (average of two replicates with standard deviation in parentheses). Numbers are compared by ANOVA, and for the treatments with biochar compared with control treatment of pure limed peat by Dunnett (*: p < 0.05; **: p < 0.01; ***: p < 0.001). Codes of the biochars: See Table 1. Ref biochar: Reference biochar based on stone oak wood.
FeAlMnMgCaKNaPNO3-NNH4-NSO4Cl
100% peat2.1 (0.3)0.33 (0.02)−0.84 (0.19)26 (1)149 (22)−46 (11)8.7 (0.2)6.1 (0.7)13 (5)−45 (19)67 (30)5.2 (0.2)
Ref biochar0.7 (0.0) **0.27 (0.07)−0.26 (0.08) *26 (4)162 (27)134 (11) ***14.1 (0.9) **19.8 (1.7) ***19 (7)−57 (11)100 (16)7.4 (0.0)
Flax6502.3 (0.3)0.37 (0.00)−0.94 (0.14)21 (3)136 (9)25 (5) ***14.0 (0.3) **16.6 (0.9)−1 (22)−56 (3)70 (28)6.9 (0.2)
Misc6501.8 (0.2)0.38 (0.09)−0.50 (0.21)26 (2)123 (17)−3 (5) ***10.9 (0.2)8.3 (0.4)13 (0)−43 (7)94 (14)7.6 (0.4) *
For4002.0 (0.2)0.34 (0.01)−0.79 (0.00)23 (3)141 (14)−11 (0) **12.8 (1.3)7.6 (1.6)20 (12)−52 (0)82 (29)6.1 (0.8)
For6502.2 (0.4)0.29 (0.05)−0.89 (0.26)22 (1)138 (22)−5 (4) **10.9 (0.1)6.7 (0.2)9 (4)−47 (11)68 (14)6.6 (0.4)
Speat6502.2 (0.2)0.40 (0.02)−0.84 (0.17)24 (1)161 (15)17 (6) ***25.7 (1.9) ***9.7 (1.1) ***−3 (4)−52 (1)173 (48) *18.1 (1.3) ***
Scoir6502.3 (0.4)0.36 (0.09)−0.96 (0.07)18 (2)141 (16)35 (3) ***24.8 (1.0) ***14.1 (1.7) ***10 (2)−48 (5)142 (13)17.1 (1.2) ***
p (ANOVA)0.0060.340.0240.560.50<0.001<0.001<0.0010.270.750.03<0.001
Table 4. Net relative accumulated mass of the elements in the leaching experiment as calculated by Equation (2) (average of two replicates with standard deviation in parentheses). Numbers are compared by ANOVA, and for the treatments with biochar compared with control treatment of pure limed peat by Dunnett (*: p < 0.05; **: p < 0.01; ***: p < 0.001). Codes of the biochars: See Table 1. Ref biochar: Reference biochar based on stone oak wood.
Fe (%)Mn (%)K (%)NO3-N (%)NH4-N (%)
100% peat−201 (15)86 (1)24 (0)−10 (5)18 (4)
Ref biochar−100 (20) **39 (2) ***−104 (18) ***−20 (12)34 (2) ***
Flax650−194 (2)85 (2)−12 (4) **0 (13)20 (2)
Misc650−229 (48)64 (8) **1 (3) *−12 (3)23 (3)
For400−186 (5)81 (5)6 (0)−13 (7)21 (1)
For650−193 (13)84 (3)2 (1)−6 (4)18 (0)
Speat650−178 (14)74 (1)−8 (4) **2 (3)19 (4)
Scoir650−183 (2)83 (7)−16 (1) **−6 (0)17 (1)
p (ANOVA)0.0077<0.0001<0.00010.18480.0018
Table 5. Plant data of the strawberry pot trial (DW = dry weight, FW = fresh weight, TLA = total leaf area, CCI = Chlorophyll Concentration Index (average) and the AUDPC (Area Under the Disease Progress Curve) of 6 replicates with standard error in parentheses (values in bold are statistically different from the reference fertilizer dose (in grey: 1.05g PGMix L−1) with *: p < 0.05; **: p < 0.01). Codes for biochar: See Table 1, ref biochar: Reference biochar based on stone oak wood, PGMix: Multi-mix Potting Soil 14+16+18 mineral fertilizer.
TreatmentAbove Green PartsStrawberry YieldTotal Fresh BiomassRoot Score(0–3)TLACCI× 1000 = Total Plant CCIAUDPC
FWDWNumber of Fruits/PlantFruit Weight/Plant
gg-gg FW-cm2---
0.70 g PGMix L−149.3 (4.3)11.1 (0.6)16.7 (1.6)77.0 (11.6)126.3 (14.0)2.0 (0.0)675.3 (63.1)35.9 (3.8)23.6 (2.5) **2.4 (0.2)
1.05 g PGMix L−155.5 (8.8)13.0 (0.5)15.2 (2.1)96.8 (13.7)152.3 (15.7)1.8 (0.2)912.4 (66.2)39.6 (2.9)34.0 (4.1)2.3 (0.3)
1.40 g PGMix L−166.5 (10.4)14.7 (1.0)15.2 (1.0)90.0 (5.3)156.5 (12.8)2.3 (0.3)1003.1 (82.4)39.3 (4.1)40.2 (5.0)2.4 (0.3)
1.75 g PGMix L−155.2 (5.0)14.8 (0.8)14.5 (1.4)83.8 (9.7)139.1 (13.6)1.8 (0.3)1001.8 (103.7)41.0 (6.8)46.5 (1.2)2.5 (0.2)
1.05 g PGMix L−1 + Ref biochar (2 g L−1)51.5(9.6)12.9 (1.0)11.2 (2.2)58.3 (2.2)109.9 (24.2)2.0 (0.4)699.5 (101.7)56.5 (5.2) *38.4 (3.0)2.2 (0.3)
1.05 g PGMix L−1 + For650 (2 g L−1)50.8 (12.6)10.4 (1.2) *11.5 (3.0)67.2 (3.0)118.0 (27.3)1.5 (0.2)679.5 (94.4)34.6 (3.9)23.1 (3.0)2.4 (0.2)
1.05 g PGMix L−1 + Speat650 (2 g L−1)43.6 (2.4)10.9 (0.8)11.0 (2.9)64.2 (2.9)107.8 (21.8)1.5 (0.2)681.6 (93.2) *53.5 (7.8)36.9 (1.8)2.5 (0.2)
1.05 g PGMix L−1 + Scoir650 (2 g L−1)53.9 (6.8)12.1 (0.8)17.6 (1.1)96.2 (1.1)150.0 (10.2)1.7 (0.2)862.8 (43.4)38.6 (4.0)33.7 (4.5)2.0 (0.2)
Table 6. Total N, P, K, Mg, Ca, and Na uptake (mg per pot) in the aboveground vegetative biomass in the strawberry pot trial of 6 replicates with standard deviations in parentheses. For the treatment with For650 and Scoir650, 5 replicates were used. Bold values indicate significant differences compared with reference treatment (limed peat + 1.05 g PGMix L−1) by Dunnett (*: p < 0.05; **: p < 0.01; ***: p < 0.001). Biochar codes: See Table 1. Ref biochar: Reference biochar based on stone oak wood. PGMix: Multi-mix Potting Soil 14+16+18 mineral fertilizer.
Treatment: Limed Peat +NPKMgCaNa
0.70 g PGMix L−1108 (13)21 (2)74 (16)43 (5)109 (9)0.33 (0.09)
1.05 g PGMix L−1135 (10)28 (5)99 (16)47 (5)118 (14)0.35 (0.08)
1.40 g PGMix L−1141 (11)28 (3)130 (10)47 (8)122 (21)0.36 (0.1)
1.75 g PGMix L−1157 (23)36 (6)147 (20) *48 (8)116 (20)0.43 (0.11)
1.05 g PGMix L−1 + Ref biochar (2 g L−1)159 (23)39 (8) *153 (31) **53 (8)156 (22) ***0.39 (0.1)
1.05 g PGMix L−1 + For650 (2 g L−1)127 (32)31 (8)97 (42)40 (9)109 (27)0.33 (0.09)
1.05 g PGMix L−1 + Speat650 (2 g L−1)132 (27)32 (7)122 (38)43 (7)121 (17)0.38 (0.07)
1.05 g PGMix L−1 + Scoir650 (2 g L−1)119 (21)26 (5)98 (21)44 (6)125 (19)0.36 (0.07)
Publisher’s Note: MDPI stays neutral with regard to jurisdictional claims in published maps and institutional affiliations.

