Article

Polarity-Based Sequential Extraction as a Simple Tool to Reveal the Structural Complexity of Humic Acids

1
Institute of Physical and Applied Chemistry, Faculty of Chemistry, Brno University of Technology, Purkynova 118, 612 00 Brno, Czech Republic
2
Materials Research Centre, Faculty of Chemistry, Brno University of Technology, Purkynova 118, 612 00 Brno, Czech Republic
*
Author to whom correspondence should be addressed.
These authors contributed equally to this work.
Agronomy 2021, 11(3), 587; https://doi.org/10.3390/agronomy11030587
Submission received: 11 February 2021 / Revised: 16 March 2021 / Accepted: 17 March 2021 / Published: 19 March 2021
(This article belongs to the Special Issue Humic Substances: A Novel Eco-Friendly Fertilizer)

Abstract

:
A sequential chemical extraction with a defined series of eluotropic organic solvents with an increasing polarity (trichloromethane < ethyl acetate < acetone < acetonitrile < n-propanol < methanol) was performed on peat-bog humic acid. Six organic fractions were obtained and subjected to a physicochemical characterization utilizing methods of structural and compositional analysis. Advanced spectroscopic techniques such as Attenuated Total Reflectance (ATR-FTIR), total luminescence, and liquid-state 13C NMR spectrometry were combined with elemental analysis of the organic fractions. In total, the procedure extracted about 57% (wt.) of the initial material; the individual fractions amounted from 1.1% to 19.7%. As expected, the apolar solvents preferentially released lipid-like components, while polar solvents provided organic fractions rich in oxygen-containing polar groups with structural parameters closer to the original humic material. The fraction extracted with acetonitrile shows distinct structural features with its lower aromaticity and high content of protein-like structural motifs. The last two—alcohol extracted—fractions show the higher content of carbohydrate residues and their specific (V-type) fluorescence suggests the presence of plant pigment residues. The extraction procedure is suggested for further studies as a simple but effective way to decrease the structural complexity of a humic material enabling its detail and more conclusive compositional characterization.

Graphical Abstract

1. Introduction

Natural organic matter (by which only the non-living part should be understood here) is an extremely complex pool of organic substances. Traditionally, its non-aqueous part was and is studied after extraction by an alkaline agent from solid natural matrix-like soil, peat, or coal. The alkaline extraction is criticized by some for its potential change in the structure and composition of isolated matter [1] but this view is refuted by others [2] and this debate remains still open [3]. Although there are attempts, increasing in number, to study the natural organic matter directly in its natural environment, i.e., without extraction [4], isolation of organics from natural matrix remains an important part of natural organic matter research, which is motivated mainly by efforts to reduce the inevitable structural complexity of the natural organic matter before subjecting it to the intended analyzes.
Besides alkaline extractants, various alternatives have been proposed and tested which were believed to be gentler or more specific to a certain class of organic matter constituents [5]. Hayes [5] overviewed solvent systems used for the isolation of organic components from soils. He states that, in contrast to the traditional mixture of aqueous base and pyrophosphate, organic solvents are much less used, usually because of problems with recovering solutes. As the important parameters of organic solvents, Hayes presents the relative permittivity, the dipole moment, and the ability to make and break hydrogen bonds. Parameters like the boiling point, density, or viscosity are said to be of minor importance for the isolation but may be relevant in the recovery of the extracted solutes. A useful concept for predicting solubility is the solubility parameter concept developed mainly by Hildebrand et al. [6] and Hansen [7].
The aforementioned review [5] reports mainly on experience with the dissolution of classically isolated humic acids (HAs) in various organic solvents. Nevertheless, there is also a long history of work focused on the extraction or fractionation of organic matter directly from its raw natural sources. Senesi et al. [8] were the first researchers to use sequential extraction using organic solvents of increasing polarity to separate directly from soil organic matter fractions and characterize them chemically and spectroscopically. Independently on the source soil, chemical and structural properties of the extracted organic fractions varied according to the progression of the solvent series, with some similarities between the two successive extracts. Later on, Piccolo [9] extracted humic substances from three soils with several dipolar aprotic solvents (dimethylsulfoxide, dimethylformamide, acetone) applied in mixtures with dilute HCl. These mixtures were selected based on a preceding study that found their highest extracting capacity among various organic solvents. It is believed that the high dipole moment of the selected solvents permits disruption of the intermolecular hydrogen bonding in a natural matrix and to separate humic substances by the formation of strong hydrogen bonds with the solvent. The presence of HCl should help to break the polyvalent salt bridges with the soil mineral constituents and to keep humic substances in the protonated form which supports their solubilization by hydrogen bonding. The used solvent mixtures revealed lower extracting efficiency in comparison to the traditional alkaline extractants, but their extracts were of higher purity. The extracts were less contaminated with silicate compounds, contained a higher amount of organic carbon and oxygen-containing functional groups, and were richer in aliphatic components [10].
Aside from the extraction studies using organic solvents, numerous efforts were made also with fractionation procedures based on the traditional alkaline extraction process. Li et al. [11] used the traditional alkaline extraction but in a repetitive way and obtained eight humic fractions from the peat sample. The authors observed large variations in molecular, chemical, and functional properties among these fractions. For example, the O/C atomic decreased from the first to the last fraction as well as the contents of oxygen-containing and aromatic functional groups. On contrary, the contents of aliphatic groups increased in the same direction. The authors suggested the existence of two major subunits in the extracted HAs. An aliphatic subunit is derived biogeochemically from lipid-rich plant cell constituents and an aromatic subunit originating from lignin or plant tissue materials. The aliphatic subunit is less soluble in alkaline solution whereas the aromatic subunit is easily extracted due to its very good solubility in bases. The aliphatic subunit should have a major impact on the binding of less or nonpolar pollutants because of its relatively hydrophobic character. Each of the isolated fractions is then a specific mixture of these two subunits. Furthermore, Olk [12] reported on basic fractionation of soil organic matter into an unbound (mobile) fraction and a fraction bound to polyvalent cations. The fractionation was performed during the standard alkali extraction by a specific ordering of the extraction and acid-wash steps. The unbound fraction was found to cycle faster under land use than the cation-bound fraction. Shirshova et al. [13] isolated five fractions of humic substances from soil using three protocols. The protocols differed in the soil pre-treatment with the benzene-methanol mixture and in the use of sulfonate or carboxylate resins as an additional soil-pretreatment agent or as extractants. Resin-extracted materials were richer in carboxylic and phenolic groups and exhibited a higher fluorescence emission maximum.
Recently, an elaborate sequential extraction technique based also on organic liquids was designed and called the humeomics approach [14]. Humeomics is based on the supramolecular conception of humic substances [15] and designed as a sequential extraction procedure that releases constituents of humic supramolecular aggregate bound by weak intermolecular forces and ester or ether linkages. During each fractionation step, aqueous and organic fractions are obtained which are characterized for their structure by advanced analytical techniques. The humeomics extraction was applied to humic substances previously isolated from soil by the standard alkaline extraction [14] as well as directly on soil [16]. The authors report that the humeomics approach extracted about 2.35% higher yields of extracted soil organic carbon than the traditional alkaline extraction.
In this work, we applied an original sequential fractionation approach using organic solvents of increasing polarity on peat HA and subjected the obtained organic fractions to a complex physicochemical characterization utilizing methods of structural and compositional analysis. Peat HA was selected as a representative of the commonly studied isolates from natural organic matter. Fractionation according to the polarity of its constituents is put forward as a logical, easy to implement but yet still underestimated tool for reducing the structural complexity of an organic matter from various sources and of various origins.

2. Materials and Methods

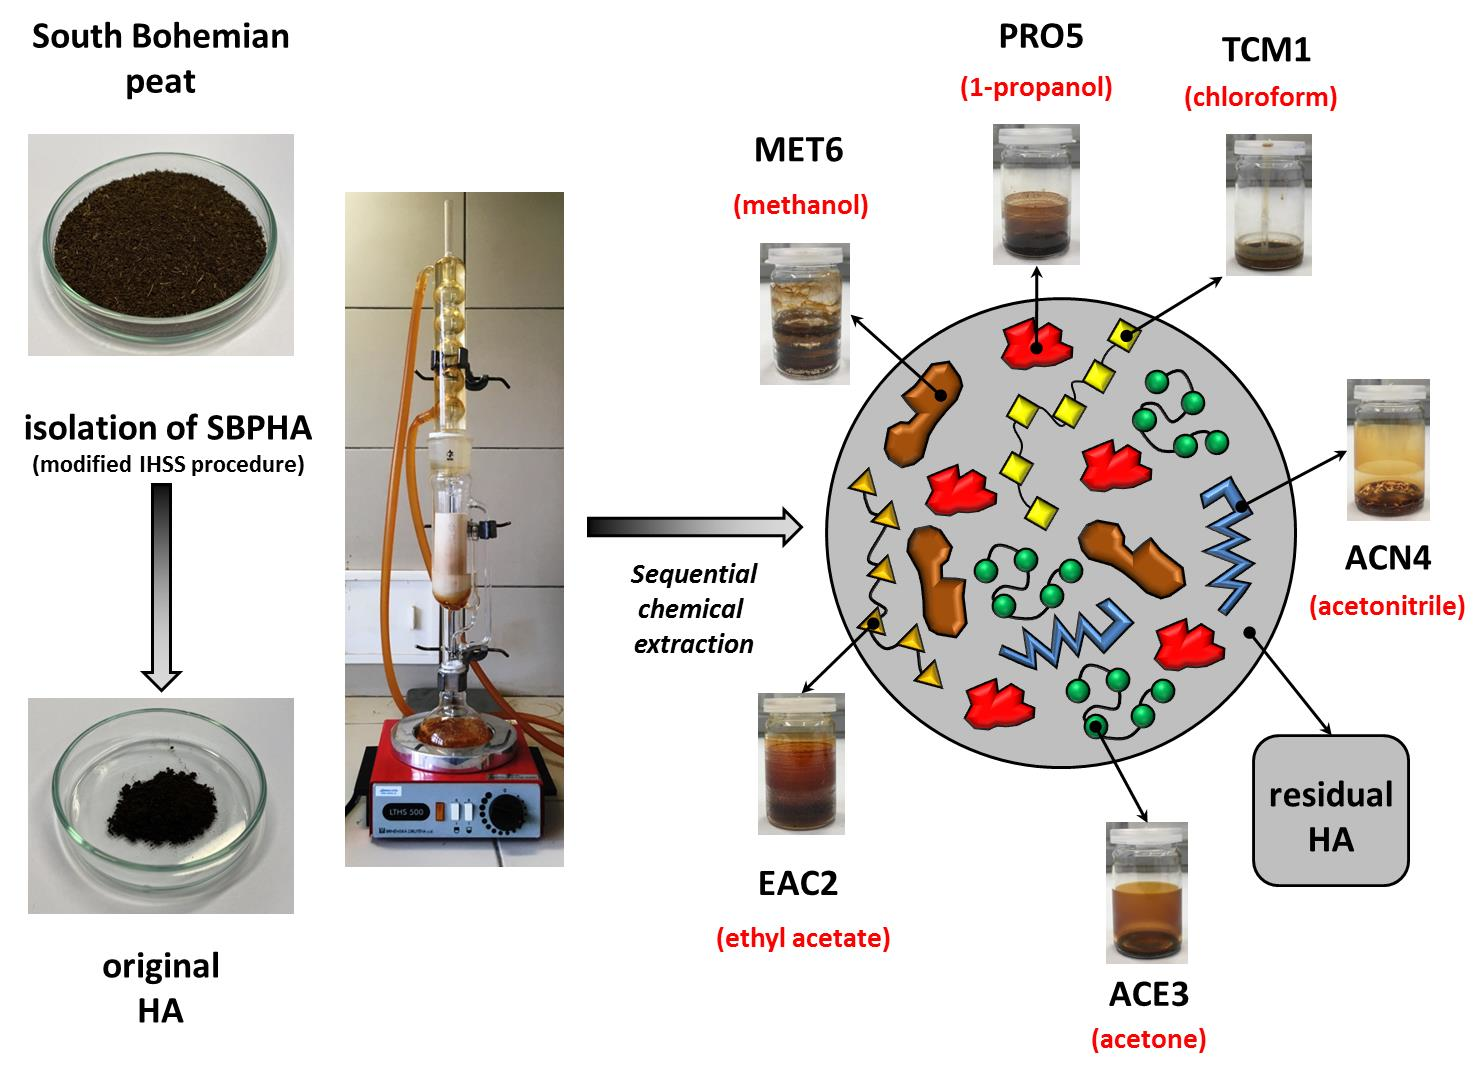
2.1. Origin and Isolation of Humic Acids

The sample of peat used in this study was obtained from the peat-bog Branná (48°57′10.953″ N; 14°48′20.587″ E) located in the Trebon basin, South Bohemia, Czech Republic. The transitional peat was classified to the FAO soil classification system as a Eutric Histosol which corresponds to the Czech classification equivalent of an Organozem. The peat soil was characterized by dark brown to black color, advanced decomposition of original plant materials (i.e., sapric type of peatland), and bulk density of the homogenized sample was determined to be approximately 0.47 g mL−1. A representative sample was collected from the surface layer 0–30 cm. The peat was used after drying at 105 °C for 24 h then let to equilibrate with ambient laboratory atmosphere at about 25 °C which resulted in the final equilibrium moisture content of about 8.2% by weight. The ash content was determined using a Q50 TG analyzer (TA Instruments, New Castel, DE, USA). The residual weight at 1000 °C (i.e., ash content) was determined of 54.1% by weight.
The detailed information on the isolation procedure of humic acid (SBPHA) from the peat sample is described in the Supplementary Materials (see Page S1).

2.2. Sequential Chemical Extraction

The as-extracted peat HA was subjected to the sequential chemical fractionation using organic solvents of increasing polarities [17] in the following order: trichloromethane (TCM), ethyl acetate (EAC), acetone (ACE), acetonitrile (ACN), 1-propanol (PRO), and methanol (MET). The physicochemical properties of used organic solvents are shown in the Supplementary Materials (see Table S1).
Briefly, HA was homogenized and 3500 mg was then inserted in a thimble, and Soxhlet sequential extracted for 48–120 h. The organic fractions extracted from the peat HA were concentrated using a rotary evaporator, and the yellow to dark brown extracts were dried in a vacuum desiccator using anhydrous sodium sulfate as a drying medium. The solid organic fractions will be referred to in the following text using the abbreviations of solvents and a number indicating the order of the extraction step (i.e., from TCM1 to MET6).

2.3. Organic Fractions Analysis

2.3.1. Elemental Composition

Thermogravimetry of the extracted organic fractions was performed using a Q5000 TG analyzer (TA Instruments, New Castel, DE, USA). Approximately 5 mg of sample was weighed into a platinum pan. During the analysis, the residual sample weight was recorded continuously (with ±0.1% mass accuracy) as the sample was heated at a heating rate of 10 °C min−1 from ambient temperature to 1000 °C under air atmosphere. Moisture content was determined from the relative weight loss at 105 °C, while the residual weight at 1000 °C, was assigned to the ash content.
The relative content of organic elements in the solid organic fractions was determined using an EA 3000 CHNS/O analyzer (Euro Vector, Pavia, Italy). Approximately 0.5–1.0 mg of the sample was weighed in a tin capsule, the capsule was packed and combusted at 980 °C in the analyzer using oxygen as the combustion gas and helium as the carrier gas. Calibration of the determination of relative contents of carbon (C), hydrogen (H), nitrogen (N), and sulfur (S) from the obtained gas chromatograms were provided using sulfanilamide as a reference standard sample. The relative oxygen content was calculated from the residual combustible mass, and the data obtained were corrected for moisture and ash content. The analysis was triplicated for each extracted fraction. The sulfur content was under the limit of detection (0.5 wt.%) in all tested samples (SBPHA and organic fractions).

2.3.2. UV/Vis Spectrometry

The UV/Vis absorption spectra of alkaline aqueous solutions of the individual organic fractions at a concentration of 10 mg L−1 were recorded on Hitachi U-3900H double beam UV/Vis spectrometer (Hitachi, Tokyo, Japan) in the spectral range between 200 and 800 nm. Standard phosphate buffer (0.1 M NaH2PO4, Na2HPO4) was used as a solvent of the fractions as well as a blank solution.

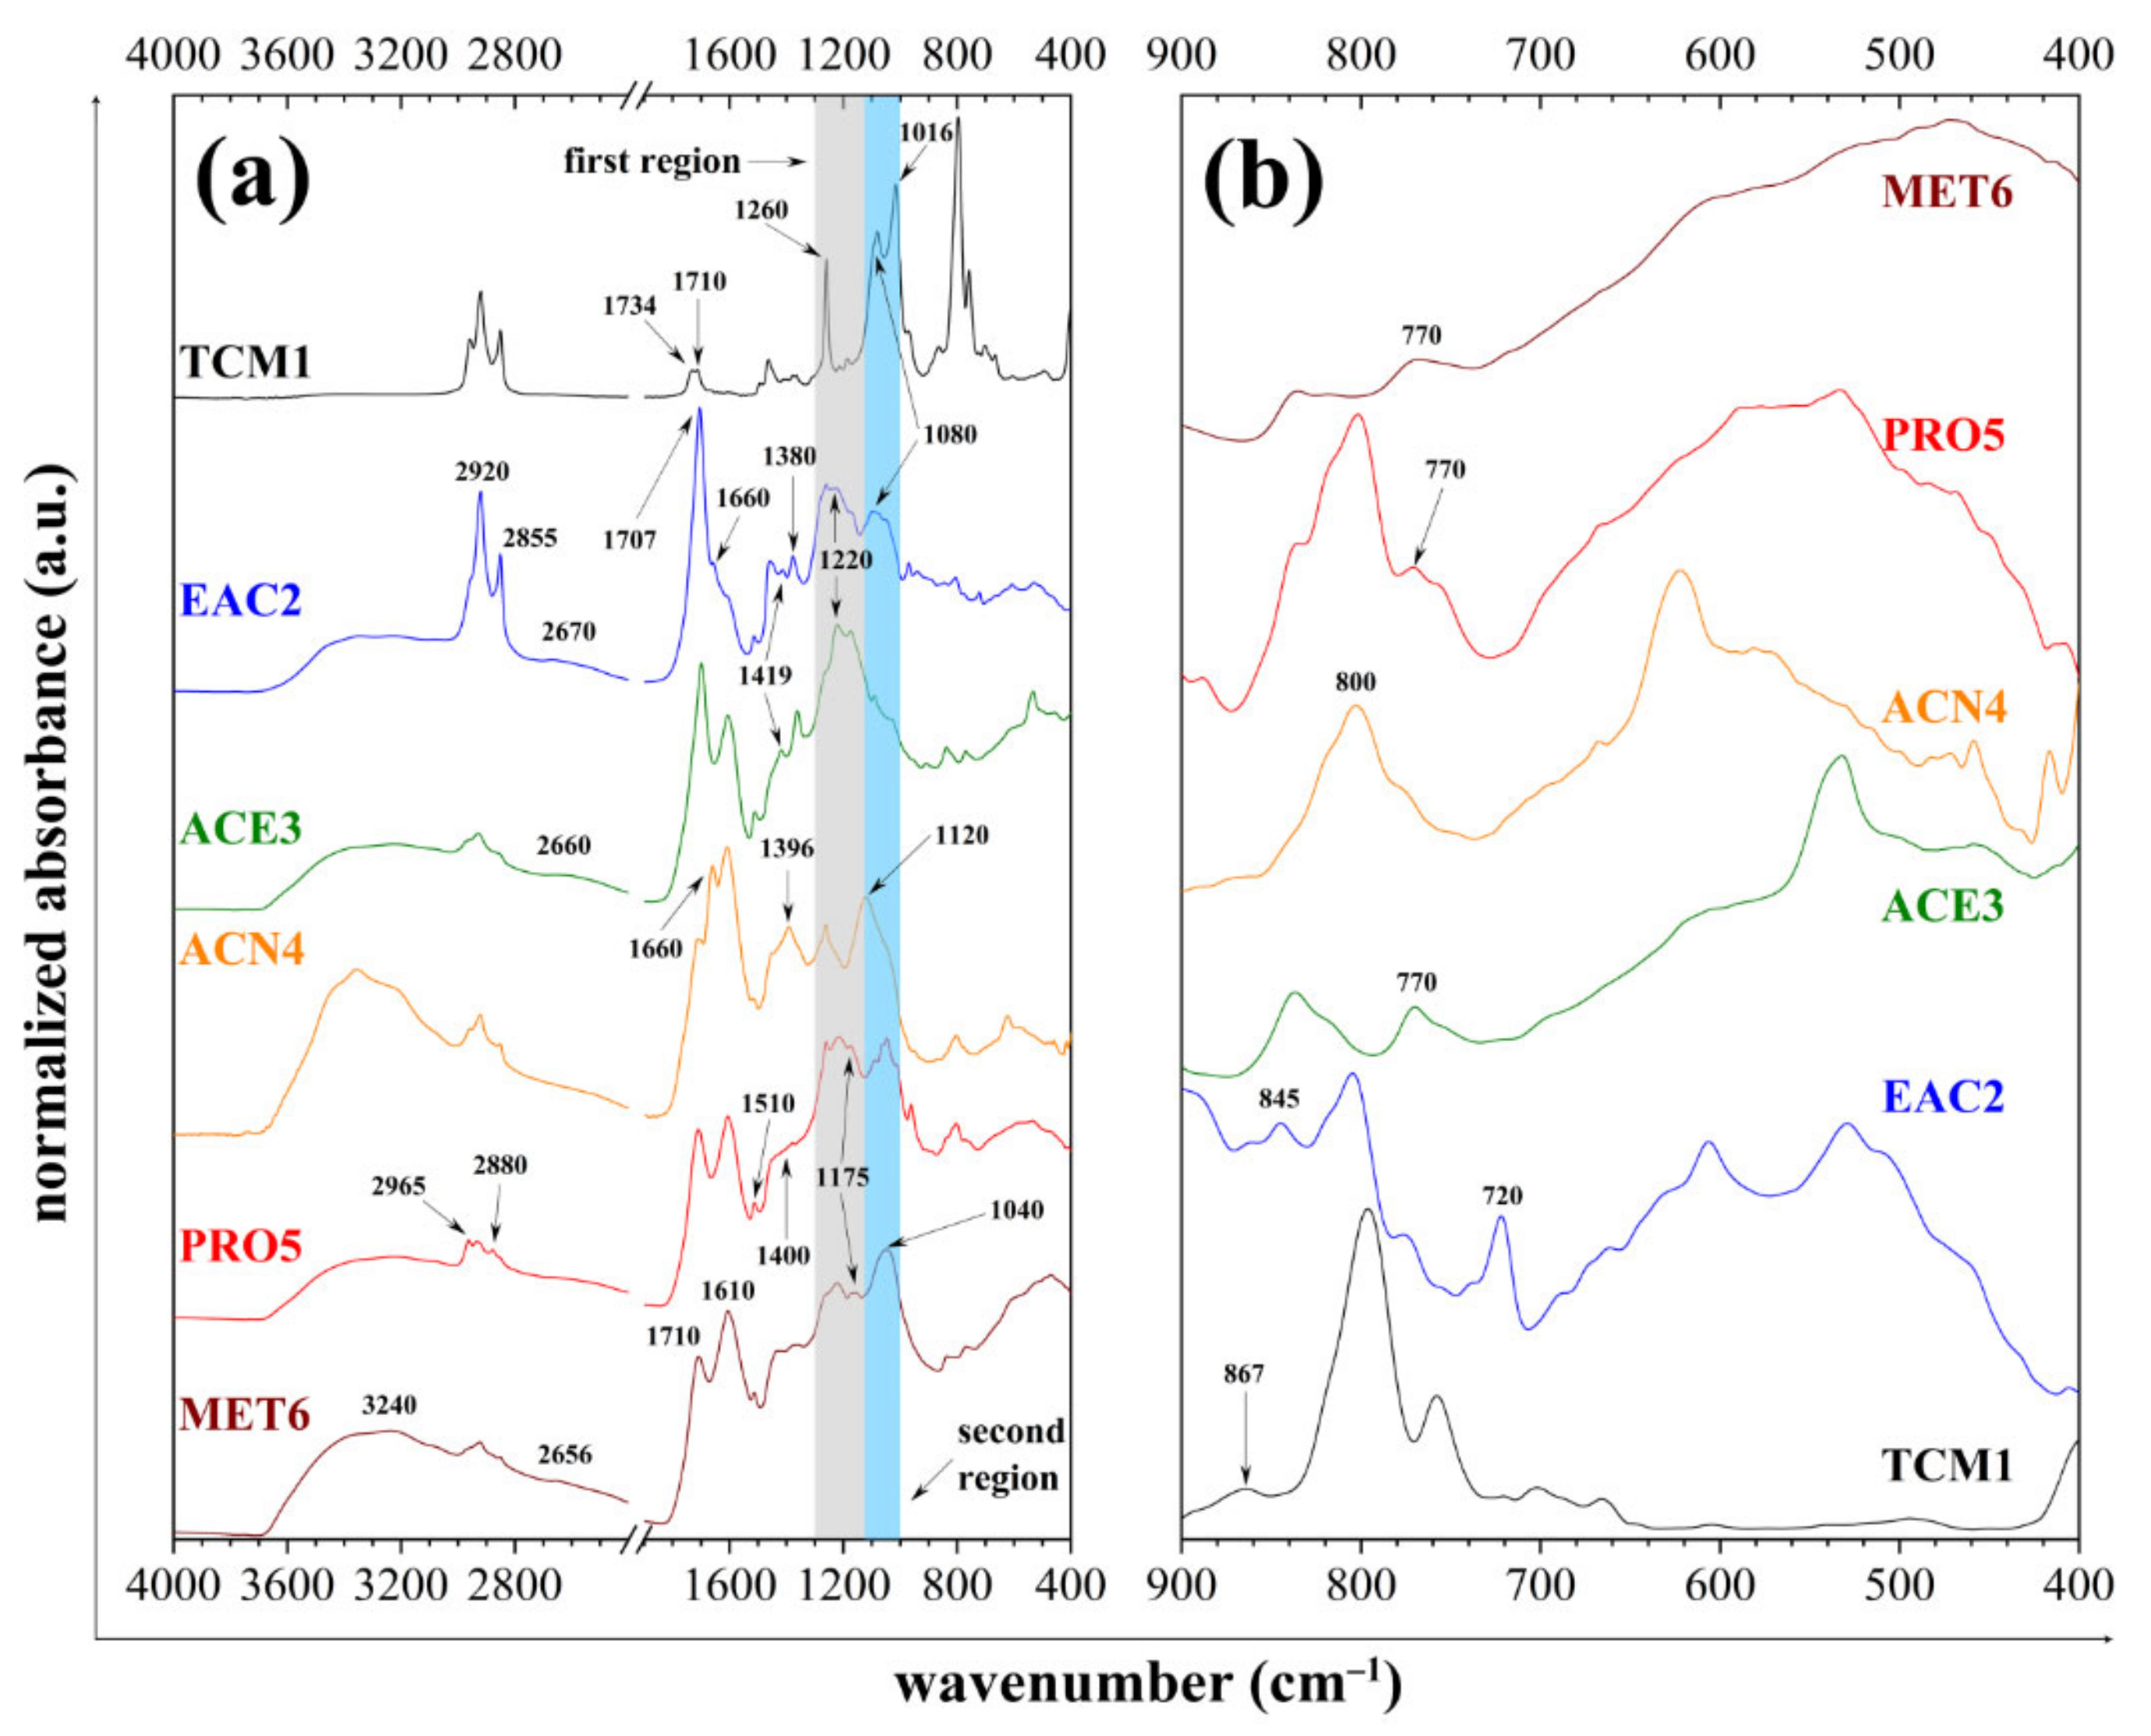
2.3.3. ATR-FTIR Spectrometry

The Attenuated Total Reflectance (ATR-FTIR) technique was used for a deeper structural characterization of organic fractions. Fourier transform infrared (FTIR) spectra of the fractions were recorded on Nicolet iS50 spectrometer (Thermo Fisher Scientific, Waltham, MA, USA) using the Attenuated Total Reflectance (ATR) measuring technique (single-reflection built-in diamond ATR crystal). All measurements were taken at 25 °C in the spectral range 4000–400 cm−1 at 4 cm−1 resolutions as an average of 256 scans. A background spectrum was collected from the clean dry surface of the ATR crystal in an ambient atmosphere. Raw absorption infrared spectra with no artificial processing (such as baseline or ATR corrections, atmospheric suppression) are presented and evaluated.

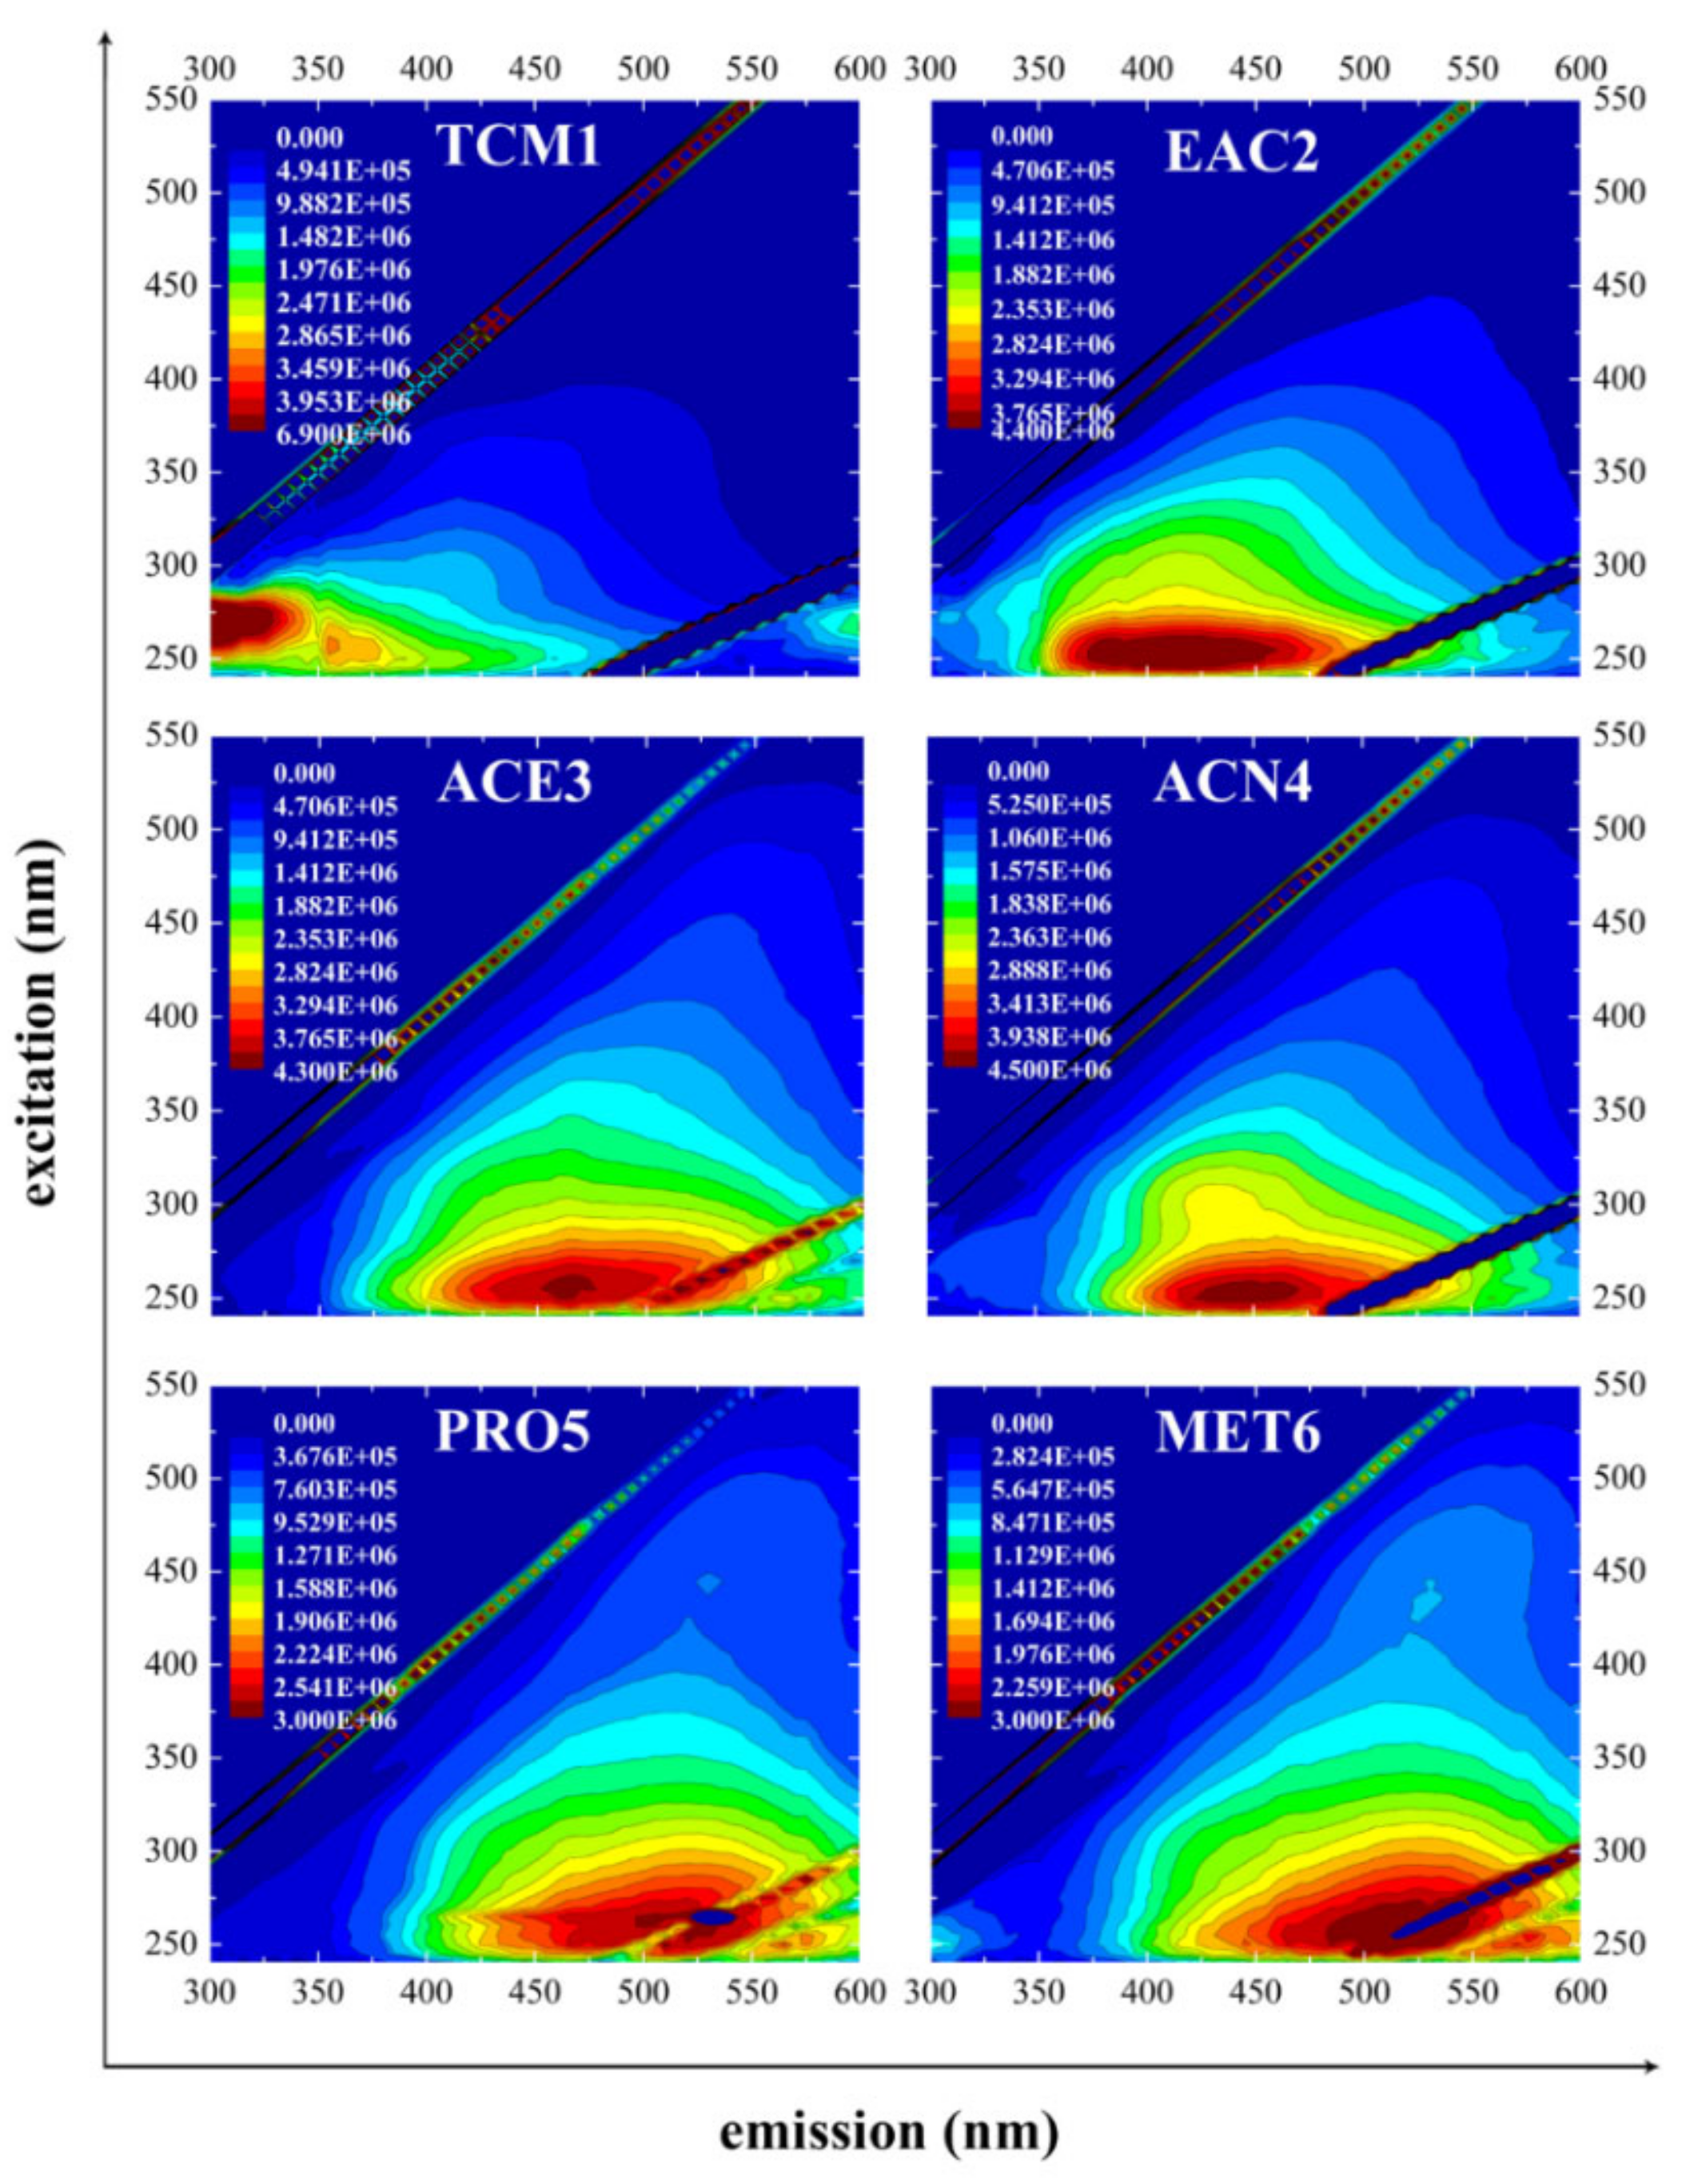
2.3.4. Fluorescence Spectrometry

For fluorescence analysis, organic fractions were dissolved at a concentration of 10 mg L−1 of organic carbon in standard phosphate buffer (pH = 7). All spectra were obtained by FluoroLog fluorescence spectrometer (Horiba Scientific, New Jersey, USA) with a scan speed of 600 nm min−1, using excitation and emission slit bandwidths of 5 nm. Excitation emission matrix (EEM) spectra were obtained by scanning the emission and excitation wavelengths over the range 300–600 nm and 240–550 nm, respectively, with the wavelength increment of 5 nm. The temperature of the sample cell was kept at 20 °C during the measurement. The background EEM spectrum of ultra-pure water (Milli-Q) was recorded and subtracted from the EEM spectra of the analyzed samples to eliminate the spectral signs of 1st- and 2nd- order Raman scattering. Primary and secondary inner filter effects were corrected according to the method proposed by Lakowicz [18]. For this purpose, absorbance spectra of the analyzed samples were recorded on Hitachi U-3900H UV/Vis spectrometer.

2.3.5. Liquid-state 13C NMR Spectroscopy

13C NMR spectra of the fractions were obtained using a liquid-state NMR technique using a Bruker Avance 500 DRX NMR spectrometer (Bruker, Karlsruhe, Germany) with the working frequency of 125.77 MHz. Organic fractions were dissolved at a concentration of 20 mg mL−1 of organic carbon in 0.5 M NaOD. All liquid-state spectra were obtained with the following settings of 13C NMR spectrometer: temperature 25 °C, number of scans 25 000, excitation pulse 10.5 μs, acquisition time 0.52 s, spectral width 31 250 Hz pulse repetition delay 2.0 s and NMR-cell diameter 5 mm. The aromaticity fa of the organic fraction was calculated from the 13C NMR spectra as a ratio of the areas of two chemical-shift regions I(106–165 ppm)/I(0–165 ppm) [19] by integrating their relevant intensities.

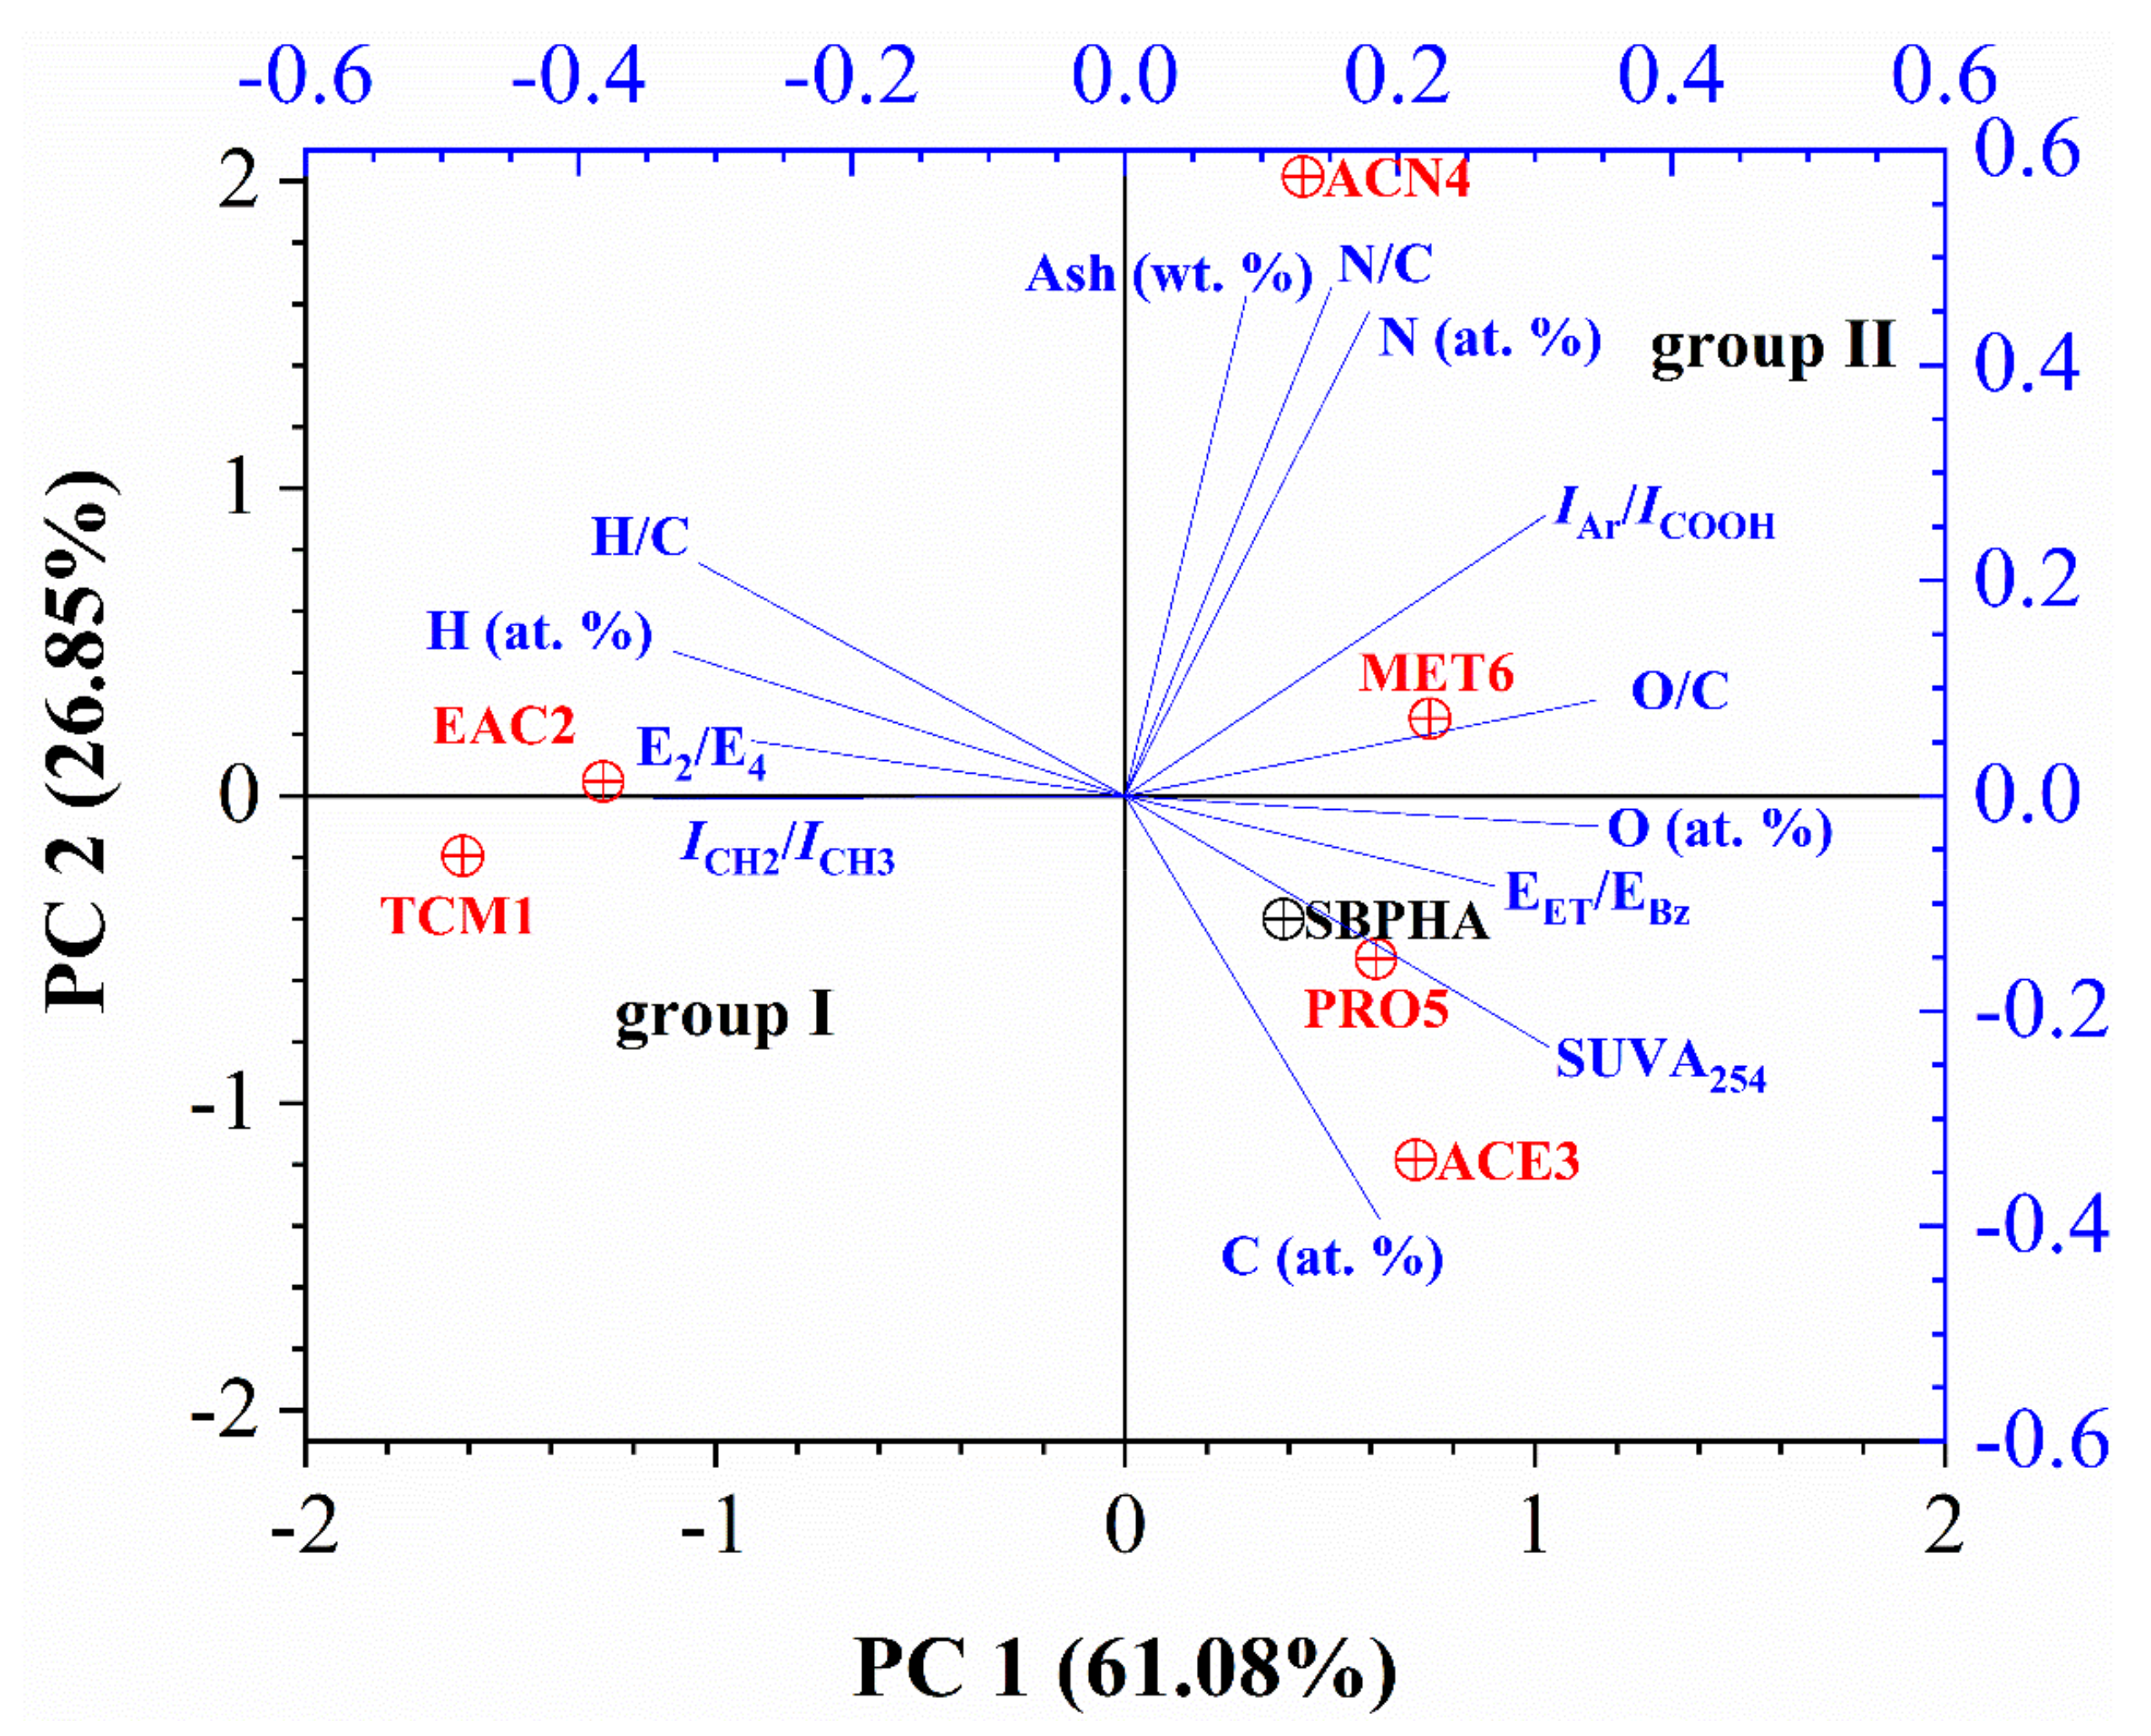
2.3.6. Statistical Analysis

The relationships between the spectroscopic properties and other physicochemical indicators of organic fractions and peat HA were examined by principal component analysis (PCA). The main goal of statistical data processing was to find similarities and dissimilarities between the organic fractions and the original unfractionated peat HA. Origin 2019b (OriginLab, Northampton, MA, USA) was used to process data for PCA and create a bi-plot graph i.e., two-dimensional projection.

3. Results and Discussion

3.1. Yields, Ash Contents, and Elemental Analysis

The extraction yields, elemental composition, ash content, and atomic ratios (H/C, O/C, and C/N) of individual organic fractions, sequentially extracted from peat HA, are presented in Table 1, together with the relevant properties of the unfractionated HA.
The extraction yield of organic fractions ranged from 1.1% to 19.7% (relative to the initial weight of the unfractionated HA) varying with the polarity of the organic agent used. The highest extraction yields (13.0% and 19.7%, respectively) were obtained for organic fractions extracted with acetone (ACE3) and 1-propanol (PRO5). In contrast, the lowest yield of organic compounds (1.1%) was obtained in the case of the organic fraction EAC2 extracted using ethyl acetate, which may be caused by the similar values of polarity indices of the first two applied solvents (TCM and EAC). The enhanced release of organic constituents from HA to more polar extractants is not surprising with respect to HAs’ high relative content of polar structural constituents rich in the oxygen-containing functional groups (such as carboxylic, phenolic, and carbonyl groups). It should be noted that the applied extraction procedure most likely releases only free organic compounds and/or weakly bound molecules from the complex organic matrix as indicated by the significant amount of an insoluble residuum in Soxhlet thimble after completion of the last extraction step. The content of residual, not-extracted organic compounds in peat HA was 43% (relative to the initial weight of unfractionated HA).
The organic elemental compositions of all obtained fractions are summarized in Table 1 in the form of an atomic percentage (calculated from the determined weight content based on dry-ash free organic content). Generally, the carbon content increased unevenly with increasing the polarity of the organic agent, while the hydrogen content decreased. The highest atomic content of carbon (43.78%) was found for organic fraction extracted using acetone (ACE3). Nitrogen represents a minor component of all obtained fractions and its content ranged from 0.15% to 3.30%, deviating on both sides from the nitrogen content of the original HA (1.12%). As expected, non-polar organic fractions (i.e., TCM1 and EAC2) were relatively poor in oxygen. In general, the elemental composition of these two fractions was similar to that of lipid compounds extracted from various lignite and peat materials in other studies [20,21].
Atomic ratios are often used as basic markers of the main structural character of the analyzed material. For instance, H/C atomic ratio is considered an indicator of aliphaticity. For the isolated peat HA fractions, the value of the H/C ratio varied within a range from 0.79 to 2.18. The highest values of this parameter were obtained for the first two fractions (TCM1 and EAC2), which could be attributed to their prevailing aliphatic character and content of compounds with long carbon chains such as fatty acids and their esters. In contrast, the lower values of the H/C atomic ratio determined for the other samples indicate the presence of organic compounds with a higher degree of aromaticity.
As another fundamental compositional marker, O/C atomic ratio reflects the amount of oxygen-containing functional groups (e.g., carboxylic, phenolic, and carbonyl) in an organic matter. For our organic fractions, the determined values of the O/C ratio covered a broader range (0.06 to 0.53) than those reported in the literature [13]. In general, higher values of the O/C atomic ratio in humic substances indicate a high relative content of oxygenated compounds such as aromatic carboxylic acids, phenols, and/or polar substituted carboxylic compounds (e.g., amides). For the samples extracted using acetonitrile and methanol (ACN4 and MET6), a combination of the highest determined O/C ratios with relatively high H/C can be attributed to a presence of oxygen bonded alkyl groups, such as alkyl ethers and esters originated from lignin and/or polysaccharides residues. The O/C values of the most polar fractions are also in good agreement with the O/C ratio of the unfractionated HA material (0.40).
Finally, N/C atomic ratio reflects the amount of nitrogen in organic fractions and is commonly used as a proxy for the maturity of the organic material. Increasing N/C is usually attributed to a decrease in C rates in the decomposition process and higher values of the ratio are hence related to higher humified materials and vice-versa [22]. The N/C ratio values vary significantly among the analyzed HA fractions, ranging from 0.005 to 0.108, while the original HA show an N/C ratio of 0.032. While the lowest content of nitrogenous constituents was found for the fraction isolated with the most apolar solvent (TCM1), the highest content of nitrogen was detected in the fractions ACN4 and MET6. As far as these fractions were relatively rich also in oxygen, the nitrogen is likely introduced in these fractions mainly in form of amide groups of the protein-like compounds. This result is in good agreement with the FTIR spectrum (ACN4) listed in Figure 1. The van Krevelen diagram of atomic H/C ratio versus atomic O/C ratio for the original HA and organic fractions is provided in Figure S3 (Supplementary Materials).

3.2. UV/Vis Spectrometry

No distinctive spectral features were observed in the measured UV/Vis spectra of all tested samples. In other words, the curves of UV/Vis spectra were characterized without visible local maxima and/or shoulders whereas their absorbance quasi-exponentially increases with decreasing wavelength (not shown). The UV-spectral behavior of organic fractions in this study was rather different from the behavior reported for organic extracts isolated from commercial humic substances where absorption peaks and/or shoulders in the 200–350 nm wavelengths range were reported [23].
All organic fractions obtained and analyzed in this study absorb significantly in the ultraviolet region. Significant absorption in this part of the electromagnetic radiation indicates that the vast majority of the types of chromophores include aromatic rings with various degrees and types of substitution [24]. In the context of basic molecular structure, these are compounds such as monosubstituted and polysubstituted phenolic substances derived from lignin residues, tannins, hydroxyl- or polyhydroxy- coumarins, etc. and various monoaromatic and/or polyaromatic acids [25]. Although UV/Vis spectra of humic substances, because of their characteristic featureless nature, might be considered of limited usefulness for a detailed interpretation of the molecular structure, the number of scientific studies have already illustrated that advanced analysis of these spectra, such as determination and interpretation of specific absorption parameters, may contribute significantly to understanding chemical structure and properties of complex organic compounds (e.g., humic substances, dissolved organic matter) and that they may suitably complement the information obtained using other analytical techniques such as potentiometric titration, light scattering methods, NMR, etc. [5,26,27]. Therefore, selected absorption ratios (E2/E4 and EET/EBz) and SUVA254 parameters were used to characterize organic fractions obtained in this study.
Well known and traditionally used E4/E6 ratio (the ratio of absorbance at 465 nm to that 665 nm), which is also referred to as color coefficient Q4/6 [28], reflects the degree of aromaticity and the average molecular weight of humic substances of different origins [29,30,31]. Unfortunately, the absorption in the 550–700 nm wavelength region of the fractions studied was too low to allow calculation of the E4/E6 ratio, thus the E2/E4 ratio (the ratio of absorbance at 265 nm to that 465 nm) was used in analyzing the fractions, as it is consistent with the E4/E6 [32]. As can be seen in Table 2, the E2/E4 ratio values ranged from 7.18 to 12.00 and followed a downward trend with increasing polarity of the organic solvent. Furthermore, E2/E4 ratios likely indicate that high-molecular fractions (i.e., humic-like compounds) were extracted only with the most polar solvents (from ACN4 to MET6). Concerning the lowest E2/E4 ratio determined for the unfractionated HA (5.53), it could be deduced that all the organic solvents preferentially extract less aromatic organic constituents with a lower molecular weight. Nevertheless, as far as the value of E2/E4 ratio is increased also by the specific absorption of –C=O groups [33], it cannot be used as a reasonable marker of aromaticity and molecular weight among organic materials with widely differing content of oxygen-containing groups.
Therefore, we calculated also the SUVA254 parameter (the ratio of absorbance at 254 nm to total organic carbon) which was found to positively correlate with the aromaticity and molecular weight of humic substances without the interference of the carbonyl content [32]. In our study, the values of the SUVA254 ranged from 0.24 to 6.40 (see Table 2) and followed an upward trend with increasing polarity of the organic solvent, except for the fraction ACN4. These results agree with E2/E4 in that significantly lower aromaticity is indicated for the organic fractions which were isolated in the first two steps of the extraction procedure. On the other hand, the organic fractions extracted with the acetone and alcohol solvents (ACE3, PRO5, and MET6) show SUVA254 values close to that of the SBPHA (5.68) indicated a similar degree of aromaticity and molecular weight as the source HA. Interestingly, a significantly lower SUVA254 value of ACN4 fraction indicates lower aromaticity of this fraction, not revealed by E2/E4. In this perspective, SUVA254 seems to be a more suitable proxy for the determination of aromaticity of the obtained organic fractions.
The EET/EBz ratio (the ratio of absorbance at 253 nm to that 220 nm) is higher for compounds in which the aromatic structural units are predominantly substituted with oxygen-containing functional groups (e.g., hydroxyl, carbonyl, ester, and especially carboxyl groups), whereas lower values are associated with aliphatic substituents [24,34]. For the studied organic fractions, the EET/EBz ratio values ranged from 0.51 to 0.83 (see Table 2). Fractions isolated between the second and the fifth extraction step show EET/EBz values close to that of the unfractionated HA (0.74) indicating a similar type of substituents on the aromatic structures as distributed in the original peat HA. On the other hand, the organic fractions extracted with the least polar (TCM1) and the most polar (MET6) solvent, show EET/EBz values indicating considerably higher content of aliphatic (TCM1) and oxygen-containing (MET6) substituents, respectively, as compared to the original HA.
The optical parameters used in this work or numerous others proposed in the literature [32,33,34,35] do not represent the only way of extracting structural information from UV/Vis spectra of humic substances and their constituents. For instance, second-order derivative UV/Vis spectra provide enhanced spectral resolution [36] and may hence be useful in the evaluation of weak and broad absorption bands such as the perylenequinone-type bands appearing in Vis spectra of humic acids as a result of fungal activity contributing to the humification process [37].

3.3. ATR-FTIR Spectrometry

The ATR-FTIR technique was chosen as it requires no mechanical pressing treatment of the sample which is necessary for the KBr transmission technique and, therefore, less opportunity is given for experimental artifacts such as pressure-induced deprotonation and/or decarboxylation of acidic functional groups [38]. The ATR-FTIR spectra of organic fractions are presented in Figure 1a,b. Interpretation of their absorption bands has been carried out according to the literature data [8,39,40].
The spectra of all fractions show several common features but also relevant differences. The first set of spectral attributes includes bands assigned to O-containing functional groups: (a) The broad absorption band centered at about 3240 cm−1 corresponds to O–H stretching of various functional groups (including the carboxylic), which are connected with an intermolecular hydrogen-bond. This band is well pronounced in FTIR spectra of all extracts except for the one extracted with the least polar solvent (TCM1) where the absorption is markedly suppressed. (b) A sharp band with variable intensity located at around 1710 cm−1 is attributed to symmetric C=O stretching in carboxylic groups. This band is common for all extracted fractions, whereby in the spectrum of TCM1 it is accompanied also by the band at 1734 cm−1 assigned carbonyl stretching in esters. The presence of the protonated carboxylic groups is often manifested also by a broad shoulder centered at about 2660 cm−1 resulting from the O–H stretching vibrations of the hydrogen-bonded dimers of COOH [41]. This weak band/shoulder is recognizable in fractions EAC2, ACE3, PRO5, and MET6, while it is reduced in the TCM1 and ACN4 fractions, where the formation of hydrogen-bonded dimers of carboxylic acids is reduced by their partial conversion to esters and carboxylates (see part (d) of this paragraph), respectively. (c) A characteristic band at 1660 cm−1 can be assigned to stretching C=O groups in secondary amides (amide I) of the protein-like structures. This band is apparent only in the spectra of EAC2 and ACN4 samples. The assignment of this absorption band to amide groups is supported by the presence of accompanying amide II bands (1570–1540 cm−1) in deconvoluted spectra in the overlapping region 1750–1500 cm−1 (see Figure S4 in Supplementary Materials) (d) The deformation vibrations of carboxylate groups occur in the spectra as a weak band and/or shoulder at around 1395 ± 5 cm−1 [42]. This absorption band is well-identified only in the spectra of ACN4 and, considering the high relative ash content of this sample, it probably represents the presence of metal chelates in this fraction. (e) A weak band or shoulder at 1420 cm−1 can be ascribed to C–O–H in-plane bending in carboxylic groups. This band is easily recognized in the less polar fractions (TCM1, EAC2, and ACE3) while it is overlapped with other oxygen-containing functional groups in the more polar ones (ACN4, PRO5, and MET6). (f) Further differences among the isolated fractions concerning O-containing groups can be deduced from the deeper evaluation of fingerprint regions 1300–1125 cm−1 and 1120–1050 cm−1. The first region (marked grey in Figure 1a) is characterized by a sharp and intensive C–O stretching band at 1260 cm−1 (aryl ethers) and relatively intensive bands and/or shoulders at 1220 cm−1 (C–O stretching and O–H bending of carboxylic groups, C–O stretching in phenoxy structures and ethers) and 1175 cm−1 (C–O stretching of phenols and ethers). Unlike other samples, ACN4 did not contain the vibration at 1220 cm−1, as a result of the lower content of protonated carboxyls. The latter fingerprint zone (marked blue in Figure 1a) is characterized by two bands at 1120 cm−1 and 1080 cm−1 corresponding to the C–O–C vibration in alkyl ethers, and to the C–O stretching of secondary alcohols. The first of these bands was found only in the ACN4 sample. The band at 1040 cm−1 is the most intensive in the spectra of organic fractions extracted by alcohols (PRO5, MET6) due to the higher extracted amount of polysaccharide-like substances. The prominent band at 1016 cm−1 which can be attributed to asymmetric C–C–O stretching in alkyl ethers [43] is visible only in the spectrum of TCM1 and is accompanied by symmetric stretching absorption at 867 cm−1.
The second set of spectral features that are in common for all the fractions refer to their content of aliphatic molecular moieties. (a) The relative content of aliphatic chains is evaluated primarily in the 3000–2800 cm−1 spectral range. The presence of aliphatic groups is revealed by the bands at 2920 cm−1 and 2855 cm−1 which are attributed to asymmetric and symmetric C–H stretching in methylene groups, respectively. These bands are the most dominant in TCM1 and EAC2 but are also relatively intense in ACN4 samples. Additional bands at 2965 cm−1 and 2880 cm−1 were ascribed to asymmetric and symmetric C–H stretching in methyl groups. These bands are well recognizable mainly in the spectrum of the PRO5 sample, occurring as a weak band and/or shoulder in the rest of the samples. (b) The deformation vibrations of the –CH2– and –CH3 groups at 1465 cm−1 and 1380 cm−1, respectively, only occur in the TCM1 and EAC2 spectra. (c) The presence of long carbon chains with more than four atoms (e.g., in fatty acids) was revealed by the band at 720 cm−1 which is ascribed to C–H in-plane bending of methylene groups. This band was found only for TCM1 and EAC2 samples, which supports the expectations that the least polar solvents would be the most efficient in the extraction of long-chain lipidic structures from the complex matrix of HA.
The third set of spectral absorptions that can be attributed to aromatic structures comprises: (a) the relatively intense symmetric ring stretching band occurring at 1610 cm−1, which was observed only as a very weak shoulder in the spectrum of TCM1 sample, indicating low aromaticity of this fraction; (b) Another characteristic aromatic band is located at 1511 cm−1, due to the aromatic C=C stretching of lignin residues. While this band is again apparently absent in the spectrum of TCM1, its relative intensity is comparable for all other fractions; (c) Out-of-plane C–H deformation bands were found in the 870–750 cm−1 region. The position of these peaks is used as a specific marker of the type of substitution of the aromatics, as far as it can distinguish aromatic structures with isolated hydrogens with aromatic carbon (870 cm−1), two and/or three adjacent hydrogens per ring (845 cm−1 and 800 cm−1), and four adjacent hydrogens (770 cm−1 and 750 cm−1) [41,44]. Spectral bands that can be assigned to two and more adjacent aromatic hydrogens are apparent in the spectra of all fractions except for TCM1 (see Figure 1b), di-substituted aromatic rings being prevailing in fractions ACE3 and MET6 while tri- and/or tetra-substituted aromatic rings in EAC2, PRO5, and MET6. It should be noted that significant absorption in the spectral region of 800 cm−1 to 750 cm−1 can be found also for TCM1 fraction. Nevertheless, the above discussed spectral evidence of low content of aromatics in the sample indicates that this vibration should be assigned to some other structural motifs (out-of-plane C–H bending in lactones, C–Cl stretching in residual solvent).
Aside from the qualitative information on the structure of the extracted fractions, results of FTIR spectroscopy can also be used for semiquantitative analysis of the content of the main structural groups. The degree of carboxylic content in humic substances is usually represented by the IAr/ICOOH ratio (the ratio of the intensity at 1610 cm−1 to the intensity at 1710 cm−1) [44]. The value of this ratio (Table 2) is the lowest for the organic fraction extracted by chloroform (TCM1). Nevertheless, the usability of this value for evaluating the carboxylic content quantitatively is questionable for fractions with significantly reduced aromaticity like it can be seen for TCM1 (note very weak absorption band at 1610 cm−1 for this fraction) and also for ACN4, where a significant portion of carboxyl groups occurs in the form of carboxylates. Among the other fractions which all show significant absorption bands both at 1710 cm−1 and 1610 cm−1, the IAr/ICOOH ratio shows that the relative content of COOH groups (normalized on the content of aromatics) decreases in the following order of samples: EAC2 > ACE3 > PRO5 > MET6. Similarly, aliphatic structural moieties can be evaluated in a semiquantitative way by the ICH2/ICH3 ratio (the ratio of the intensity at 2920 cm−1 to the intensity at 2965 cm−1), which is used to estimate the length and degree of branching of aliphatic chains. The intensity ratio (Table 2) shows that longer (which agrees with the presence of 720 cm−1 band) and less branched aliphatic chains are obtained in TCM1 and EAC2 samples compared with the other organic fractions.

3.4. Fluorescence Spectrometry

The EEM spectra and contour maps of the studied fractions are shown in Figure 2 (Rayleigh scattering peaks appear in the form of diagonal lines). In general, the shorter emission wavelengths and greater fluorescence intensity measured in EEM spectra belong to the fluorescence of simple aromatic structures and lower molecular weight organic components, while a shift of the fluorescence maximum to higher wavelengths indicates the presence of condensed aromatic structural units and electron-withdrawing substituents [45]. The emission maximum of organic compounds ranging from 340 to about 430 nm could be associated with three- and/or four-ring aromatic structures, four or more aromatic rings per structural unit of a fluorophore result in the light emission at longer wavelengths (i.e., from 400–500 nm). Furthermore, several authors observed in the EEM spectra of terrestrial HAs unique fluorescence domains located at even longer excitation and emission wavelengths in the visible spectral region [46,47,48], which are interpreted as fluorophores derived from phytochlorin (chlorophyll degradation by-product). Contemporary classification of the types of fluorophore domains in humic substances [49,50] is summarized in Table S2 (Supplementary Materials).
Organic fractions, isolated and analyzed in this study, contain fluorophores typical for fluorescence of caustobioliths (e.g., lignite, leonardite, and peat) and soil humic substances [51,52,53]. The excitation-emission wavelength pairs (EEWP) of the main peaks in the EEM spectra, their fluorescence intensity values, and assignments to the specific fluorophore classes are provided in Table 3. It can be seen that, except for the TCM1 fraction, excitation-emission characteristics of the primary fluorescence maxima of all other fractions (250–265/415–505 nm) corresponds to the “A”—domain fluorophores typical for fulvic acids and dissolved organic matter (DOM). It means that isolated fluorophores excited in the UVC region are the main contributors to the fluorescence of all these fractions (from EAC2 to MET6). On the other hand, the fluorescence maximum of the fraction isolated with the least polar solvent (TCM1) lie within the “B” region which is most often assigned to the fluorescence of tyrosine in protein-like structures contained in the organic matter [54,55]. However, because no significant content of protein residues was revealed in the TCM1 fraction by the elemental and FTIR analyses, it is more likely that the blue shift of the emission maximum is caused rather by lower molecular weight and electron detaining ester substituents [56].
Furthermore, from a detailed evaluation of the EEM spectra, secondary fluorescence maxima representing other types of fluorophores contained in the structure of isolated fractions can also be revealed (see the spectral cut-outs presented in Figure S5 in Supplementary Materials). As can be seen in Table 3, B-type fluorophores were determined in the EEM spectra of EAC2 and ACN4 fractions. One of the possible assignments of this fluorescence peak is represented by tyrosine-like fluorophores, which is also to some extent supported by results of elemental analysis (higher relative content of N) and FTIR (presence of characteristic amide I band) indicating a presence of protein residues. Tyrosine-like fluorophores were also recently found in DOM fractions isolated from the tropical peatlands [57]. Nevertheless, direct identification of these particular structural moieties in these fractions is beyond the resolving power of the methods used in this study and should be resolved in future work.
For the first (TCM1) and the last (MET6) extracted fractions, an additional fluorescence maximum was found with the EEWP in the range 250–255/300–355 nm. This emission is often assigned to the soluble microbial by-product-like compounds [58,59]. Doskočil et al. [21] in their work, focused on EEM spectra of lipids isolated from various coal basins, has introduced the term “peak H” attributed to fluorescence band if its maximum is situated in the UVA region with an excitation wavelength at about 250 nm. No structural model of fluorophore H has yet been proposed. Nevertheless, this signal can in general be attributed to simple aromatic structures (without condensed rings) with electron-donating substituents, such as the alkyl or methoxyl groups identified in TCM1 and MET6, respectively, by the other techniques.
Humic-like fluorophores referred to as the C-domain fluorophores (300–380/400–500 nm) are also typical for humic substances and DOM originating from peats, soils, and natural waters [60]. Fluorescence in this spectral domain reveals as a well-distinguished peak for ACN4, while it forms a less pronounced shoulder on the primary fluorescence peak in the spectrum of EAC2. Cao and Jiang observed this type of fluorescence in EEM spectra of low molecular weight fractions of humic acids from bulk Leonardite HA [61]. Some authors [52,62] have suggested that the humic-like fluorophore can be attributed to the presence of phenolic acid derivatives and other substituted phenolic units originating from lignin, hydroxycoumarin-like, and/or quinone-like structures which originated from degraded terrestrial biomaterials such as plant tissue. Furthermore, McKnight et al. [63] reported in a study on spectrofluorometric characterization of DOM that the C may be interpreted such as domains from the autochthonous microbial process. We hence conclude that the C-domain fluorescence in the analyzed organic fractions is probably related to autonomous low-molecular fluorophores formed by aromatic systems highly substituted with reactive functional groups, especially –COOH substituents.
In the EEM spectra of the two fractions extracted with alcohols (PRO5 and MET6), fluorescence maxima having excitation wavelengths greater than 400 nm were also found. Fluorescence peaks in this spectral region are referred to as V and/or α [53,62] and usually occur in lignite, peat, and humus-rich soils. In general, for the fluorescence maxima with an emission wavelength greater than 470 nm it is suggested that the fluorescence originates from a transition of electronic charge from one region of a molecular species to another and/or from one molecular species to another rather than from independent fluorophores [64]. For PRO5 and MET6 fraction, the fluorescence peaks located in the V region thus probably reflect a presence of high-molecular fluorophores (e.g., linearly condensed networks of aromatic rings) substituted with electron-withdrawing functional groups. This is in good agreement with the results of UV/Vis (see the high values of SUVA254 and EET/EBZ and their discussion in Section 3.2) and with the high content of carboxylic groups confirmed by FTIR and NMR. The V-region fluorescence was not apparent in the EEM matrix of original HA used in this study (see Figure S2), nevertheless, as it was previously observed for another HAs isolated from a similar natural source [65], it may be suggested that the structural moieties responsible for fluorescence of peat HAs in the V region are preferentially extracted into the polar alcoholic fractions.

3.5. Liquid-State 13C NMR Spectrometry

As the last part of the spectrometric study, the 13C NMR spectra of the isolated organic fractions (see Figure S6 in the Supplementary Materials) were measured in the liquid state. EAC2 and ACN4 fractions were not analyzed by this technique because of their too low extraction yields. Relative distribution of individual carbon types typical for the natural organic matter was obtained from the integration of the raw spectra in the corresponding regions of resonance: alkyl carbon (0–45 ppm), carbohydrates and/or peptides (45–106 ppm); aromatic carbon (106–145 ppm), phenolic carbon (145–165 ppm), carboxylic carbon (165–190 ppm) and carbonyl carbon (190–220 ppm) [19,66]. The results of the integration are provided in Table 4.
As expected, the relative content of alkyl carbon, manifested in the spectra as methyl groups (20–22 ppm) and/or methylene groups (27, 31, and 40 ppm), varies within a broad range among the analyzed fractions, being the highest (78%) for the fraction extracted by the least polar solvent (TCM1). The opposite was found for the relative content of hydrophilic components such as polysaccharide residues and protein-like compounds (relative area in 45–106 ppm) which was lowest for the TCM1 fraction while the highest for the most polar solvent used (MET6). Detailed analysis of the region of O-alkyl and peptide carbon resonances reveals the presence of quaternary carbons, methine groups (lignin, cellulose, and/or hemicellulose residues), and α-carbons (amino acids and/or polysaccharides). A common feature for all analyzed fractions is the signal at 56 ppm which may be attributed to methoxyl or amide groups [11]. Bearing in mind quite low overall N content, it can be expected that the signal most likely originates from the methoxyl groups in lignin and suberin residues. Another signal at about 63 ppm, preferentially ascribed to oxygen bonded methylene groups, was found only in the spectra of the alcoholic extract (PRO5 and MET6).
The region of chemical shifts between 106 and 165 ppm reflects the content and structural composition of aromatic components. The relative integrated area in this region is, again, the lowest (10%) for the least polar fraction TMC1 while its value is comparable (39–47%) for other analyzed fractions. The aromaticity index fa (i.e., the ratio of the integrated areas in 106–165 ppm and 0–165 ppm, respectively) is usually used as a more accurate quantitative parameter expressing sample aromaticity. As can be seen in Table 4, also this parameter confirms comparable aromaticity of all but the first extracted fraction. From the qualitative point of view, spectra of all these fractions with higher aromaticity (ACE3, PRO5, and MET6) include signals typical for lignin residues [67]: (a) A sharp and intensive signal at 115 ppm corresponds to coniferyl alcohol and the intensive signal at about 130 ppm to 4-hydroxycinnamyl alcohol. (b) The presence of sinapyl and coniferyl units is further revealed by the signals at 145 and 148 ppm, which are attributed to Ar–O–R and Ar–O–CH3 structural moieties [68]. (c) Phenolic groups are manifested by a distinctive signal at 150 ppm [69].
The presence of carboxylic groups in the structure of the fraction is manifested in the 13C NMR spectra by two bands in the range of chemical shifts 172–175 ppm. The relative signal of carbon in carboxylic groups increased gradually with increasing polarity of the extraction agent (in the range of 3–13%). Finally, the relative integrated area in the range of chemical shifts characteristic for carbonyl carbon (190–220 ppm) was comparably low for all the analyzed fractions.

3.6. Statistical Analysis

The specific structural and compositional parameters provided by the individual physicochemical and spectroscopic assays were further subjected to statistical analysis using the principal component analysis (PCA) method. The dimension of the 13 input variables was reduced by PCA into two principal components with eigenvalues higher than one. These two principal components composed 88.0% of the variability of the original data set, of which 61.1% falls on the first (PC1) and 26.9% on the second principal component (PC2), respectively. Visual representation of the results of PCA is provided in form of a two-dimensional factor plane of principal components PC1 and PC2 in Figure 3.
It is observed from the bi-plot that O/C atomic ratio had the highest positive loading on PC1 while the opposite trend was observed for relative hydrogen content and ICH2/ICH3 ratio. In the left-side quadrants of the loading bi-plot, there are projected parameters that indicate the presence of aliphatic structures with long carbon chains poor in O- and/or N-containing functional groups. On the other hand, on the right side of the loading bi-plot can be found projections of parameters that reflect the presence of heteroatom elements as well as the aromaticity of the sample.
The PCA bi-plot in Figure 3 shows that the PC1 component provides the clear separation of the non-polar organic fractions (samples TCM1 and EAC2, designed as Group I in Figure 3) from the other organic fractions and also from the original peat HA (samples ACE3 to MET6, and SBPHA, designed as Group II). Evidently, the group I fractions can be characterized by structural markers of aliphatic substances, whereas group II gathers structural and compositional parameters of the typical building-blocks for the humic substances.
The second principal component (PC2) provides further separation of the polar organic fractions mainly according to their elemental composition. It can be seen that polar organic fractions PRO5 and MET6 are projected near to zero value of PC2 forming a cluster with the original humic material (SBPHA). On the other hand, the fraction extracted with acetonitrile (ACN4) is separated from the others due to its higher ash (wt. %) and nitrogen (at. %) content. This is in good agreement with the conclusion that this fraction is distinctive with its high content of polypeptide-like structures such as tyrosine-like structures and/or microbial activity by-products.

4. Conclusions

The results of our work support the current view that humic acids still represent a complex mixture of separable fractions with specific structural and physicochemical properties. For the analyzed peat-bog humic acid, it was confirmed that the individual fractions, isolated by the proposed polarity-resolved fractionation technique, are mutually different concerning their origin, molecular weight, aromaticity, and the content and composition of heteroatomic functional groups. In particular, the fractions extracted with the most apolar solvents (trichloromethane and ethyl acetate), as expected, show the structural features characteristic for basically lipidic compounds (low aromaticity, low oxygen, and nitrogen content, high CH2/CH3 ratio), while the other fractions are in general more aromatic and richer in polar (mainly oxygen-containing) groups. Interestingly, among these more polar fractions, the fraction extracted with acetonitrile stands at a unique position with its surprisingly lower aromaticity and higher content of protein-like structural motifs. Furthermore, the last two-alcohol extracted-fractions (PRO5 and MET6) also show some mutual structural features, mainly the higher content of carbohydrate residues (as confirmed by FTIR and NMR) and content of specific (V-type) fluorophores which are often associated with plant pigments residues in humic acids.
The experimental study presented in this paper hence represents a pilot demonstration of a simple but useful approach to a structural analysis of complex heterogeneous organic matrices such as humic substances. Nevertheless, a systematic follow-up study is still needed to evaluate the general usability and overall benefit of this experimental approach. In this pilot study, we used only one HA sample, which represents the single type of organic material that originated from a particular soil system with specific humification conditions. Therefore, to be able to critically evaluate experimental limitations of the approach and to obtain structural information that could be generalized to a wider range of humics, it is essential to focus the follow-up work on a comparative study performed with humic substances differing in their types (fulvic and humic acids, humins) and origins (terrestrial soil, aquatic).
Moreover, also the methodology proposed here is still open to further modifications and improvements. Above all, solid residues remaining after the last extraction step should also be subjected to detail structural and compositional analysis to provide a conclusive description of the structural impacts of the extraction process. Furthermore, one of the general aims of the study was to contribute to refining the current notion of the supramolecular structure of humic substances. In this work, we focused on how this could be managed by reducing the level of the structural complexity of humic substances followed by a separate analysis of individual groups of molecular constituents. Nevertheless, for a more complex understanding of how these constituents are bound in the HA matrix, this analytic step should be supplemented with the “synthetic” perspective where the compositional and structural parameters of the obtained fractions were synthesized with respect to their relative contents and these reassembled characteristics were compared with those of the parental humic material.

Supplementary Materials

The following are available online at https://www.mdpi.com/2073-4395/11/3/587/s1, Figure S1: ATR-FTIR and DRIFT spectrum of SBPHA, Figure S2: EEM spectrum of HA isolated from South Bohemian peat (SBPHA), Figure S3: Van Krevelen diagram of organic fractions and original SBPHA, Figure S4: Deconvolution of the overlapping region of ATR-FTIR spectra at 1800–1500 cm−1, Figure S5: EEM spectral cut-outs showing secondary fluorescence maxima, Figure S6: Liquid-state 13C NMR spectra of the studied organic fractions extracted from peat HA, Table S1: List of fundamental physicochemical properties of organic solvents used for extraction of organic fractions, Table S2: Summary of fluorescence domains characteristic of humic substances and/or dissolved organic matter.

Author Contributions

Investigation, methodology, writing—original draft, conceptualization, V.E. and P.S.; investigation, formal analysis, L.K., Š.S., L.D., and M.K.; writing—review and editing, supervision, M.P. All authors have read and agreed to the published version of the manuscript.

Funding

The authors received no financial support for the research, authorship, and/or publication of this article.

Institutional Review Board Statement

Not applicable.

Informed Consent Statement

Not applicable.

Data Availability Statement

All discussed and analyzed data is contained within the article or Supplementary Materials.

Acknowledgments

This work was supported by the Materials Research Centre is supported by the Ministry of Education, Czech Republic (project No. LO1211).

Conflicts of Interest

The authors declare that they have no known competing financial interests or personal relationships that could have appeared to influence the work reported in this paper.

References

  1. Kleber, M.; Lehmann, J. Humic substances extracted by alkali are invalid proxies for the dynamics and functions of organic matter in terrestrial and aquatic ecosystems. J. Environ. Qual. 2019, 48, 207–216. [Google Scholar] [CrossRef] [PubMed]
  2. Olk, D.C.; Bloom, P.R.; Perdue, E.M.; McKnight, D.M.; Chen, Y.; Farenhorst, A.; Senesi, N.; Chin, Y.P.; Schmitt-Kopplin, P.; Hertkorn, N.; et al. Environmental and agricultural relevance of humic fractions extracted by alkali from soils and natural waters. J. Environ. Qual. 2019, 48, 217–232. [Google Scholar] [CrossRef] [PubMed]
  3. Myneni, S.C.B. Chemistry of Natural Organic Matter—The Next Step: Commentary on a humic substances debate. J. Environ. Qual. 2019, 48, 233–235. [Google Scholar] [CrossRef] [PubMed] [Green Version]
  4. Hu, Y.; Zheng, Q.; Noll, L.; Zhang, S.; Wanek, W. Direct measurement of the in situ decomposition of microbial-derived soil organic matter. Soil Biol. Biochem. 2020, 141, 107660. [Google Scholar] [CrossRef]
  5. Hayes, M.H.B. Solvent systems for the isolation of organic components from soils. Soil Sci. Soc. Am. J. 2006, 70, 986–994. [Google Scholar] [CrossRef] [Green Version]
  6. Hildebrand, J.H.; Scott, R.L. Regular Solutions, 1st ed.; Prentice-Hall, Inc.: Englewood Cliffe, NJ, USA, 1962; p. 180. [Google Scholar]
  7. Hansen, C.M. Hansen Solubility Parameters: A User’s Handbook, 2nd ed.; CRC Press: Boca Raton, FL, USA, 2007; p. 544. [Google Scholar]
  8. Senesi, N.; Testini, C.; Polemio, M. Chemical and spectroscopic characterization of soil organic matter fractions isolated by sequential extraction procedure. J. Soil Sci. 1983, 34, 801–813. [Google Scholar] [CrossRef]
  9. Piccolo, A. Characteristic of soil humic extracts obtained by some organic and inorganic solvents and purified by HCl-HF treatment. Soil Sci. 1988, 146, 418–426. [Google Scholar] [CrossRef]
  10. Fujitake, N.; Kusumato, A.; Tsukamato, M.; Kawahigashi, M.; Suzuki, T.; Otsuka, H. Properties of soil humic substances in fractions obtained by sequential extraction with pyrophosphate solutions at different pHs. I. Yield and particle size distribution. Soil Sci. Plant Nutr. 1998, 44, 253–260. [Google Scholar] [CrossRef]
  11. Li, L.; Huang, W.; Peng, P.; Sheng, G.; Fu, J. Chemical and molecular heterogeneity of humic acids repetitively extracted from a peat. Soil Sci. Soc. Am. J. 2003, 67, 740–746. [Google Scholar] [CrossRef]
  12. Olk, D.C. A Chemical fractionation for structure-function relations of soil organic matter in nutrient cycling. Soil Sci. Soc. Am. J. 2006, 70, 1013–1022. [Google Scholar] [CrossRef] [Green Version]
  13. Shirshova, L.T.; Ghabbour, E.A.; Davies, G. Spectroscopic characterization of humic acid fractions isolated from soil using different extraction procedures. Geoderma 2006, 133, 204–216. [Google Scholar] [CrossRef]
  14. Nebbioso, A.; Piccolo, A. Basis of a humeomics science: Chemical fractionation and molecular characterization of humic biosuprastructures. Biomacromolecules 2011, 12, 1187–1199. [Google Scholar] [CrossRef]
  15. Vinci, G.; Mazzei, P.; Drosos, M.; Zaccone, C.; Piccolo, A. Molecular characterization of ombrotrophic peats by humeomics. Chem. Biol. Technol. Agric. 2020, 7, 18. [Google Scholar] [CrossRef]
  16. Drosos, M.; Nebbioso, A.; Mazzei, P.; Vinci, G.; Spaccini, R.; Piccolo, A. A molecular zoom into soil Humeome by a direct sequential chemical fractionation of soil. Sci. Total Environ. 2017, 586, 807–816. [Google Scholar] [CrossRef]
  17. Reichardt, C.; Welton, T. Solvents and Solvent Effects in Organic Chemistry, 4th ed.; WILEY-VCH: Weinheim, Germany, 2010; p. 718. [Google Scholar]
  18. Lakowicz, J.R. Principles of Fluorescence Spectroscopy, 3rd ed.; Springer: Baltimore, MD, USA, 2006; p. 954. [Google Scholar]
  19. Novák, F.; Šestauberová, M.; Hrabal, R. Structural features of lignohumic acids. J. Mol. Struct. 2015, 1093, 179–185. [Google Scholar] [CrossRef]
  20. Thomas, J.D.R. Chemistry of peat bitumen: Fractionation and infra-red studies. J. Appl. Chem. 2007, 12, 289–294. [Google Scholar] [CrossRef]
  21. Doskočil, L.; Enev, V.; Pekař, M.; Wasserbauer, J. The spectrometric characterization of lipids extracted from lignite samples from various coal basins. Org. Geochem. 2016, 95, 34–40. [Google Scholar] [CrossRef]
  22. Martins, T.; Saab, S.D.C.; Milori, D.M.B.P.; Brinatti, A.M.; Rosa, J.A.; Cassaro, F.A.M.; Pires, L.F. Soil organic matter humification under different tillage managements evaluated by Laser Induced Fluorescence (LIF) and C/N ratio. Soil Tillage Res. 2011, 111, 231–235. [Google Scholar] [CrossRef] [Green Version]
  23. Ma, X.; Green, S.A. Fractionation and spectroscopic properties of fulvic acid and its extract. Chemosphere 2008, 72, 1425–1434. [Google Scholar] [CrossRef] [PubMed]
  24. Korshin, G.V.; Li, C.-W.; Benjamin, M.M. Monitoring the properties of natural organic matter through UV spectroscopy: A consistent theory. Water Res. 1997, 31, 1787–1795. [Google Scholar] [CrossRef]
  25. del Vecchio, R.; Blough, N.V. On the origin of the optical properties of humic substances. Environ. Sci. Technol. 2004, 38, 3885–3891. [Google Scholar] [CrossRef] [PubMed]
  26. Baigorri, R.; Fuentes, M.; González-Gaitano, G.; García-Mina, J.M. Analysis of molecular aggregation in humic substances in solution. Colloids Surf. A Physicochem. Eng. Asp. 2007, 302, 301–306. [Google Scholar] [CrossRef]
  27. Song, J.; Jin, X.; Wang, X.C.; Jin, P. Preferential binding properties of carboxyl and hydroxyl groups with aluminium salts for humic acid removal. Chemosphere 2019, 234, 478–487. [Google Scholar] [CrossRef]
  28. Boguta, P.; Sokołowska, Z. Zinc binding to fulvic acids: Assessing the impact of pH, metal concentrations and chemical properties of fulvic acids on the mechanism and stability of formed soluble complexes. Molecules 2020, 25, 1297. [Google Scholar] [CrossRef] [Green Version]
  29. Chen, Y.; Senesi, N.; Schnitzer, M. Information provided on humic substances by E4/E6 ratios. Soil Sci. Soc. Am. J. 1977, 41, 352–358. [Google Scholar] [CrossRef]
  30. Li, P.; Hur, J. Utilization of UV-Vis spectroscopy and related data analyses for dissolved organic matter (DOM) studies: A review. Crit. Rev. Environ. Sci. Technol. 2017, 47, 131–154. [Google Scholar] [CrossRef]
  31. Zykova, M.V.; Schepetkin, I.A.; Belousov, M.V.; Krivoshchekov, S.V.; Logvinova, L.A.; Bratishko, K.A.; Yusubov, M.S.; Romanenko, S.V.; Quinn, M.T. Physicochemical characterization and antioxidant activity of humic acids isolated from peat of various origins. Molecules 2018, 23, 753. [Google Scholar] [CrossRef] [Green Version]
  32. Rodríguez, F.J.; Schlenger, P.; García-Valverde, M. Monitoring changes in the structure and properties of humic substances following ozonation using UV-Vis, FTIR and 1H NMR techniques. Sci. Total Environ. 2016, 541, 623–637. [Google Scholar] [CrossRef]
  33. Chen, J.; Gu, B.; LeBooeuf, E.; Pan, H.; Dai, S. Spectroscopic characterization of the structural and functional properties of natural organic matter fractions. Chemosphere 2002, 48, 59–68. [Google Scholar] [CrossRef]
  34. Maeng, S.K.; Timmes, T.C.; Kim, H.-C. Characterization of EfOM fraction responsible for short-term fouling in ultrafiltration. Sep. Sci. Technol. 2015, 50, 2697–2707. [Google Scholar] [CrossRef]
  35. Tinoco, P.; Almendros, G.; González-Vila, F.J.; Sanz, J.; González-Pérez, J.A. Revisiting molecular characteristics responsive for the aromaticity of soil humic acids. J. Soils Sediments 2015, 15, 781–791. [Google Scholar] [CrossRef] [Green Version]
  36. Yakimenko, O.; Khundzhua, D.; Izosimov, A.; Yuzhakov, V.; Patsaeva, S. Source indicator of commercial humic products: UV-Vis and fluorescence proxies. J. Soils Sediments 2018, 18, 1279–1291. [Google Scholar] [CrossRef]
  37. Kumada, K.; Sato, O. Characteristics of the green fraction of P type humic acid. J. Soil Sci. Plant Nutr. 1980, 26, 309–316. [Google Scholar] [CrossRef] [Green Version]
  38. Davis, W.M.; Erickson, C.L.; Johnston, C.T.; Delfino, J.J.; Porter, J.E. Quantitative fourier transform infrared spectroscopic investigation humic substance functional group composition. Chemosphere 1999, 38, 2913–2928. [Google Scholar] [CrossRef]
  39. Senesi, N.; Sipos, S. Molecular weight distribution, analytical and spectroscopic characterization of humic fractions sequentially isolated by organic solvents from a brown coal humic acid. Org. Geochem. 1985, 8, 157–162. [Google Scholar] [CrossRef]
  40. Stuart, B.H. Infrared Spectroscopy: Fundamentals and Applications, 1st ed.; John Wiley & Sons: Hoboken, NJ, USA, 2004; p. 244. [Google Scholar]
  41. Baes, A.U.; Bloom, P.R. Diffuse reflectance and transmission fourier transform infrared (DRIFT) spectroscopy of humic and fulvic acids. Soil Sci. Soc. Am. J. 1989, 53, 695–700. [Google Scholar] [CrossRef]
  42. Terkhi, M.C.; Taleb, F.; Gossart, P.; Semmoud, A.; Addou, A. Fourier transform infrared study of mercury interaction with carboxyl groups in humic acids. J. Photochem. Photobiol. A 2008, 198, 205–214. [Google Scholar] [CrossRef]
  43. Tatzber, M.; Stemmer, M.; Spiegel, H.; Katzlberger, C.; Haberhauer, G.; Mentler, A.; Gerzabek, M.H. FTIR-spectroscopic characterization of humic acids and humin fractions obtained by advanced NaOH, Na4P2O7, and Na2CO3 extraction procedures. J. Plant Nutr. Soil Sci. 2007, 170, 522–529. [Google Scholar] [CrossRef]
  44. Hanc, A.; Enev, V.; Hrebeckova, T.; Klucakova, M.; Pekar, M. Characterization of humic acids in a continuous-feeding vermicomposting system with horse manure. Waste Manag. 2019, 99. [Google Scholar] [CrossRef] [PubMed]
  45. Senesi, N.; Miano, T.M.; Provenzano, M.R.; Brunetti, G. Characterization, differentiation, and classification of humic substances by fluorescence spectroscopy. Soil Sci. 1991, 152, 259–271. [Google Scholar] [CrossRef]
  46. Enev, V.; Pospíšilová, Ľ.; Klučáková, M.; Liptaj, T.; Doskočil, L. Spectral characterization of selected humic substances. Soil Water Res. 2014, 9, 9–17. [Google Scholar] [CrossRef] [Green Version]
  47. Stylianou, S.K.; Katsoyiannis, I.A.; Ernst, M.; Zouboulis, A.I. Impact of O3 or O3/H2O2 treatment via a membrane contacting system on the composition and characteristics of the natural organic matter of surface waters. Environ. Sci. Pollut. Res. 2018, 25, 12246–12255. [Google Scholar] [CrossRef] [PubMed]
  48. Gao, J.-F.; Dou, S.; Wang, Z.-G. Structural analysis of humic acid in soil at different corn straw returning modes through fluorescence spectroscopy and infrared spectroscopy. Int. J. Anal. Chem. 2019, 2019. [Google Scholar] [CrossRef] [Green Version]
  49. Sierra, M.M.D.; Giovanela, M.; Parlanti, E.; Soriano-Sierra, E.J. Fluorescence fingerprint of fulvic and humic acids from varied origins as viewed by single-scan and excitation/emission matrix techniques. Chemosphere 2005, 58, 715–733. [Google Scholar] [CrossRef] [PubMed]
  50. Liu, S.; Benedetti, M.F.; Han, W.; Korshin, G.V. Comparison of the properties of standard soil and aquatic fulvic and humic acids based on the data of differential absorbance and fluorescence spectroscopy. Chemosphere 2020, 261, 128189. [Google Scholar] [CrossRef]
  51. Alberts, J.J.; Takács, M. Total luminescence spectra of IHSS standard and reference fulvic acids, humic acids and natural organic matter: Comparison of aquatic and terrestrial source terms. Org. Geochem. 2004, 35, 243–256. [Google Scholar] [CrossRef]
  52. Rodríguez, F.J.; Schlenger, P.; García-Valverde, M. A comprehensive structural evaluation of humic substances using several fluorescence techniques before and after ozonation. Part I: Structural characterization of humic substances. Sci. Total Environ. 2014, 476–477, 718–730. [Google Scholar] [CrossRef]
  53. Doskočil, L.; Burdíková-Szewieczková, J.; Enev, V.; Kalina, L.; Wasserbauer, J. Spectral characterization and comparison of humic acids isolated from some European lignites. Fuel 2018, 213, 123–132. [Google Scholar] [CrossRef]
  54. Fellman, J.B.; Hood, E.; Spencer, R.G.M. Fluorescence spectroscopy opens new windows into dissolved organic matter dynamics in freshwater ecosystems: A review. Limnol. Oceanogr. 2010, 55, 2452–2462. [Google Scholar] [CrossRef]
  55. Yang, L.; Hur, J.; Zhuang, W. Occurrence and behaviors of fluorescence EEM-PARAFAC components in drinking water and wastewater treatment systems and their applications: A review. Environ. Sci. Pollut. Res. 2015, 22, 6500–6510. [Google Scholar] [CrossRef]
  56. Yu, M.-D.; Xi, B.-D.; Zhu, Z.-Q.; Zhang, L.; Yang, C.; Geng, C.-M.; He, X.-S. Fate and removal of aromatic organic matter upon a combined leachate treatment process. Chem. Eng. J. 2020, 401, 126157. [Google Scholar] [CrossRef]
  57. Zhou, Y.; Martin, P.; Müller, M. Composition and cycling of dissolved organic matter from tropical peatlands of coastal Sarawak, Borneo, revealed by fluorescence spectroscopy and parallel factor analysis. Biogeosciences 2019, 16, 2733–2749. [Google Scholar] [CrossRef] [Green Version]
  58. Chen, W.; Westerhoff, P.; Leenheer, J.A.; Booksh, K. Fluorescence excitation-emission matrix regional integration to quantify spectra for dissolved organic matter. Environ. Sci. Technol. 2003, 37, 5701–5710. [Google Scholar] [CrossRef]
  59. Sun, J.; Guo, L.; Li, Q.; Zhao, Y.; Gao, M.; She, Z.; Jin, C. Three-dimensional fluorescence excitation-emission matrix (EEM) spectroscopy with regional integration analysis for assessing waste sludge hydrolysis at different pretreated temperatures. Environ. Sci. Pollut. Res. 2016, 23, 24061–24067. [Google Scholar] [CrossRef] [PubMed]
  60. Birdwell, J.E.; Engel, A.S. Characterization of dissolved organic matter in cave and spring waters using UV-Vis absorbance and fluorescence spectroscopy. Org. Geochem. 2010, 41, 270–280. [Google Scholar] [CrossRef]
  61. Cao, J.; Jiang, J. Reducing capacities in continuously released low molecular weight fractions from bulk humic acids. J. Environ. Manag. 2019, 244, 172–179. [Google Scholar] [CrossRef]
  62. Coble, P.G.; Lead, J.; Baker, A.; Reynolds, D.M.; Spencer, R.G.M. Aquatic Organic Matter Fluorescence, 1st ed.; Cambridge University Press: New York, NY, USA, 2014; p. 418. [Google Scholar]
  63. McKnight, D.M.; Boyer, E.W.; Westerhoff, P.K.; Doran, P.T.; Kulbe, T.; Andersen, D.T. Spectrofluorometric characterization of dissolved organic matter for indication of precursor organic material and aromaticity. Limnol. Oceanogr. 2001, 46, 38–48. [Google Scholar] [CrossRef]
  64. Boyle, E.S.; Guerriero, N.; Thiallet, A.; del Vecchio, R.; Blough, N.V. Optical properties of humic substances and CDOM: Relation to structure. Environ. Sci. Technol. 2009, 43, 2262–2268. [Google Scholar] [CrossRef] [PubMed]
  65. Boguta, P.; D’Orazio, V.; Sokołowska, Z.; Senesi, N. Effects of selected chemical and physicochemical properties of humic acids from peat soils on their interaction mechanisms with copper ions at various pHs. J. Geochem. Explor. 2016, 168, 119–126. [Google Scholar] [CrossRef]
  66. Conte, P.; Piccolo, A.; van Lagen, B.; Buurman, P.; de Jager, P.A. Quantitative differences in evaluating soil humic substances by liquid- and solid-state 13C-NMR spectroscopy. Geoderma 1997, 80, 339–352. [Google Scholar] [CrossRef]
  67. Khatami, S.; Deng, Y.; Tien, M.; Hatcher, P.G. Formation of water-soluble organic matter through fungal degradation of lignin. Org. Geochem. 2019, 135, 64–70. [Google Scholar] [CrossRef]
  68. Hatcher, P.G.; Waggoner, D.; Chen, H. Evidence for the existence of humic acids in peat soils based on solid-state 13C NMR. J. Environ. Qual. 2019, 48, 1571–1577. [Google Scholar] [CrossRef] [Green Version]
  69. Schnitzer, M. Soil organic matter—The next 75 years. Soil Sci. 1991, 151, 41–58. [Google Scholar] [CrossRef]
Figure 1. Attenuated Total Reflectance (ATR-FTIR) spectra of organic fractions extracted from peat HA, (a) spectral range of 4000–400 cm−1 and (b) spectral range of 900–400 cm−1 for the visualization of less intense absorption bands.
Agronomy 11 00587 g001
Figure 2. Excitation–emission matrix (EEM) spectra of organic fractions extracted from peat HA.
Agronomy 11 00587 g002
Figure 3. Projection of characterized organic fractions and original peat HA using PCA.
Agronomy 11 00587 g003
Table 1. Extraction yields, ash contents, elemental compositions, and atomic ratios of organic fractions extracted from peat humic acid (HA). Relevant parameters of compositional analysis for original HA (SBPHA) are included for comparison.
YieldAshCHNOH/CO/CN/C
(wt.%) 1(wt.%) 1(at.%) 2
SBPHA-0.735.00 ± 0.2449.84 ± 0.161.12 ± 0.0914.031.420.400.032
TCM13.760.07 ± 0.0230.83 ± 0.1167.10 ± 0.320.15 ± 0.021.922.180.060.005
EAC21.101.81 ± 0.0933.30 ± 0.1665.65 ± 0.280.63 ± 0.050.421.970.010.019
ACE313.000.34 ± 0.0443.78 ± 0.2034.62 ± 0.130.82 ± 0.0520.770.790.470.019
ACN47.834.10 ± 0.0830.52 ± 0.3449.87 ± 0.193.30 ± 0.1016.311.630.530.108
PRO519.740.83 ± 0.1737.22 ± 0.2144.23 ± 0.360.94 ± 0.0717.611.190.470.025
MET611.912.99 ± 0.1234.62 ± 0.3746.18 ± 0.221.43 ± 0.1217.771.330.510.041
1 weight content calculated on a moisture-free basis. 2 atomic percentages calculated on a moisture-free and ash-free basis. Values of ash content and elemental compositions are means ± SD (n = 3).
Table 2. Parameters calculated from UV/Vis and FTIR spectra.
UV/Vis RatiosUV ParameterFTIR Intensity Ratios
EET/EBzE2/E4SUVA254 1IAr/ICOOH2ICH2/ICH33
SBPHA0.74 ± 0.065.53 ± 0.125.681.261.06
TCM10.51 ± 0.0211.87 ± 0.150.240.221.81
EAC20.70 ± 0.0212.00 ± 0.060.660.341.87
ACE30.74 ± 0.019.77 ± 0.115.890.801.11
ACN40.66 ± 0.009.53 ± 0.102.031.441.11
PRO50.74 ± 0.047.64 ± 0.146.401.060.98
MET60.83 ± 0.027.18 ± 0.225.791.211.04
Values of UV/Vis ratios are means ± SD (n = 3). 1 calculated as absorbance at 254 nm divided by the concentration of total dissolved organic carbon in the solution (in mg L−1). 2 FTIR ratio calculated as the ratio of intensity at 1610 cm−1 to an intensity at 1710 cm−1. 3 FTIR ratio calculated as the ratio of intensity at 2920 cm−1 to an intensity at 2965 cm−1.
Table 3. Positions of excitation-emission wavelength pairs for fluorescence domains and values of fluorescence intensities for organic fractions and original peat HA.
Fluorescence Peak Region
ACVBH
Ex/Em (nm)IF (CPS) 1Ex/Em (nm)IF (CPS) 1Ex/Em (nm)IF (CPS) 1Ex/Em (nm)IF (CPS) 1Ex/Em (nm)IF (CPS) 1
SBPHA255/4951.77
TCM1 270/3056.86255/3553.23
EAC2 2250/4154.36 270/3050.99
ACE3255/4654.22
ACN4255/4454.49300/4352.74 270/3150.98
PRO5265/5002.76 445/5300.80
MET6260/5052.57 435/5250.72 250/3000.99
1IF × 106 CPS (counts per second) of fluorescence peaks. 2 The C domain (humic-like) was observed in the EEM spectrum of the EAC2 sample as less pronounce shoulder.
Table 4. Average distribution of individual carbon types and calculated aromaticity index (fa) for the studied organic fractions from the liquid-state 13C NMR spectra.
Organic FractionsAverage Distribution of Individual Carbon Types (%)(fa) 1
0–45 ppm45–106 ppm106–145 ppm145–165 ppm165–190 ppm190–220 ppm
TCM178882310.10
ACE323193611920.53
PRO524223391020.48
MET616303181320.46
1 Aromaticity index calculated as the ratio of the intensity at 106–165 ppm to the intensity at 0–165 ppm.
Publisher’s Note: MDPI stays neutral with regard to jurisdictional claims in published maps and institutional affiliations.

