Article

Long-Term Analysis of the Variability of Agronomic Characters in the VIR Oat Germplasm Collection in Central Black Soil Region of Russia

by
Igor G. Loskutov
*,
Liubov Yu. Novikova
,
Galina V. Belskaya
and
Elena V. Blinova
N.I. Vavilov All-Russian Institute of Plant Genetic Resources (VIR), St. Petersburg, Russia 42, 44, Bolshaya Morskaya Street, 190000 St. Petersburg, Russia
*
Author to whom correspondence should be addressed.
Agronomy 2021, 11(3), 423; https://doi.org/10.3390/agronomy11030423
Submission received: 22 January 2021 / Revised: 9 February 2021 / Accepted: 22 February 2021 / Published: 26 February 2021
(This article belongs to the Section Agricultural Biosystem and Biological Engineering)

Abstract

:
Climate change has become a significant factor in crop production in the 21st century for many countries. To turn losses into profit, adaptation measures are needed, which are based on the analysis and forecast of economically valuable characteristics of crops. The field trial data were analyzed for 764 oat accessions from the global germplasm collection by the N.I. Vavilov All-Russian Institute of Plant Genetic Resources (VIR) in 2001–2019 and the cultivar ‘Gorizont’ in 1990–2019 in Yekaterinino Experiment Station of VIR (Tambov Province, Russia, 52°59′ N, 40°50′ E). A progressive shortening of the growing season and a yield increase were observed during the study both in the mean values for the tested accessions and in the cv. ‘Gorizont’. Grain yield variability of cv. ‘Gorizont’ across the years was also associated with 1000 grain weight variations. The models predict a further reduction in the growing season by 2.4 days/10 years, mainly caused by an increase in temperatures above 15 °C, and an increase in yield by 47.6 g/m2/10 years, mainly caused by an increase in the temperature in May. ANOVA demonstrated that the highest yields in Tambov Province were produced by accessions from Ulyanovsk Province, Ukraine, Moscow Province, Norway, Germany, and Poland.

1. Introduction

The global warming rate in the 21st century has reached 1 °C against the pre-industrial period and is still growing at a speed of 0.2 °C per decade [1]. The warming of the atmosphere is more expressed above the land than above the ocean, over northern latitude areas, and in the cold seasons of the year. It leads to changes in precipitation patterns and their instability. The ensemble of models shows high uncertainty in water supply forecasts, as a rise in temperatures may provoke increased climate aridity [2].
The phenology of plants, including cultivated ones, appeared to be very sensitive to climate change, which revived the interest in mathematical modeling in the context of plant phenology [3,4]. A shortening of the active growing season is currently observed for both cultivated and wild plants [5]. Changes in crop phenology characteristics and their interactions with the changing environment were seen as a platform for the development of reliable crop adaptation policies [6]. In temperate climate zones, temperatures are the main limiting factor for plant development [5,7]. However, the accuracy of phenological models still remains insufficient [8].
Grain yield depends on weather and climate to a lesser extent: different levels of agricultural practices contribute a significant share to its variability [9]. The yield of cereal crops adversely depends on the temperature and directly on the humidity [10,11,12,13]. The temperature increase in most of the world’s grain-producing regions is excessive: a 1 °C rise in temperatures heralds a 6% decline in the worldwide wheat production [14,15]. In addition to the negative effect produced by higher temperatures, undesirable tendencies in grain yield are associated with the growth of the precipitation deficit [16]. Yield forecasts are mostly based on regression models [16,17,18,19].
In the era of global climate change, cultivar phenotyping based on many years of observations as well as the development and maintenance of phenotypic data bases are crucial for the analysis of genotype–phenotype–environment interactions and for solving the problems of marker-assisted selection [20]. Maintaining heterogeneous collections of plant genetic resources under changing climate conditions makes their comparative assessment a difficult task, which is also true for checking the authenticity of accessions [21]. To compare accessions studied in different years, VIR approved the technique of comparisons with the reference cultivar of a certain crop. The cultivar chosen as a reference in a field study of the collection is planted each year in several replications, usually after every 20 plots [22].
The study involving massive arrays of accessions of various geographic origin under contrasting environmental conditions, launched by VIR as early as in the 1920s [23,24], opened the way for unbiased selection of promising source material which was recommended to breeders for the development of high-yielding and well-adapted cereal cultivars [25,26]. The global collection of plant genetic resources maintained by VIR is studied using the geographic approach. The network of experiment stations where plant accessions undergo three-year studying is deployed in diverse ecogeographic locations over the country. Identification of genotypes with valuable traits is based on the analysis of the data procured in the course of three-year trials [27].
The oat is a crop of cold northern areas, where fewer alternative competitive crops may be found [28,29]. Main oat producers are Russia, Canada, the northern United States of America, and Nordic countries [30]. In Europe, oat yield is higher in northern regions [31]. Hot and dry weather immediately before heading is especially unfavorable for a good grain yield [30]. In areas with insufficient, sufficient and excessive humidity, the impact of precipitation and temperature has different tendencies and effect sizes [16,17].
The aim of this study was to analyze the variability of agrobiological indicators in oat accessions from the VIR collection across the years of trials and across different cultivars in the environments of Yekaterinino Experiment Station of VIR.

2. Materials and Methods

2.1. Site Description

The Tambov Province is located in the forest-steppe zone of the southern part of the East European Plain. Climate of the Tambov Province temperate, sharply continental, with warm summers and long cold winters, insufficient moisture [32]. The average monthly temperature in January varies from −10.5 to −11.5 °C, in July from 19.0 to 20.7 °C, the annual sum of active temperatures is 2300–2600 °C, the amount of precipitation is 500–550 mm, 70–75% of precipitation falls in the warm season. The region is characterized by extremely fertile black (chernozem) soils rich in humus. In 1990–2019, the sum of temperatures above 10 °C at the research site averaged 2840 °C (2170 to 3480 °C), increasing by 210.0 °C/10 years (p < 0.001). The total precipitation in the period with temperatures above 10 °C was 329 mm (130 to 454 mm), with no significant variations. During the period with temperatures above 15 °C, however, the total precipitation showed a statistically significant increase by 34.4 mm/10 years (p = 0.037); the sum of active temperatures significantly increased by 298.8 °C/10 years (p < 0.001), and the sum of effective temperatures by 132.7 °C/10 years (p < 0.001).

2.2. Material

In 2001–2019, 764 oat accessions from the global collection of VIR were studied at Yekaterinino Experiment Station, Tambov Province, Russia (52°59′ N, 40°50′ E). Each accession underwent three years of testing. During the entire experiment, the cultivars were grown and analyzed using the same technique developed by VIR [22].
By their origin the accessions represented 56 countries of five continents. There were large sets (20 or more accessions) from Australia (24 accessions), Brazil (34), Canada (35), China (26), Finland (20), Germany (45), Japan (30), Norway (23), Poland (21), Ukraine (22), and the USA (119). Among the Russian accessions (171), the most numerous groups were from Leningrad (38), Moscow (22) and Ulyanovsk (31) Provinces.
Seven agronomic indicators were studied in the field: grain yield per 1 m2 (g), 1000 grain weight (g), lengths of the interphase periods from germination to heading (days) and from germination to harvesting (days), plant height (cm), lodging resistance (points), and resistance to Helminthosporium leaf blotch (points).
Cv. ‘Gorizont’ (VIR-12113, Ukraine), approved for cultivation in Tambov Province, Russia, was used as the reference. The trends in the characteristics of this cultivar were studied for the past 30 years (1990–2019).
Weather data were supplied by the meteorological facility at Yekaterinino Experiment Station of VIR.

2.3. Crop Management

The experiment was performed in a randomized block design with three replicates. The plot area was 1 m2. All accessions were sown manually in six 1-m rows with 15-cm spacing between the rows and 30-cm spacing between the plots. Sowing density was 500 grains per m2 for each accession. The accessions were sown on late April-early May, harvesting was performed in late July-August manually and was followed by the manual threshing of panicles [22]. All oat accessions were cultivated under the same field conditions, which were similar to the common agricultural practices of this region. Chemical weed control was not applied during the growing season, with all weeds being eradicated by hand.

2.4. Data Analysis

Statistical data processing was performed using the Statistica 13.3 software package (TIBCO Software Inc., Palo Alto, CA, USA). Correlations of the characters in cv. ‘Gorizont’ with each other, with agroclimatological characteristics, and with the means for the studied set of accessions were analyzed. Spearman’s rank–order correlation was applied. All correlation coefficients in the text are statistically significant (p < 0.05).
Generalized agrometeorological indicators were calculated: the dates of stable temperature transitions across 5, 10, 15 and 20 °C; durations of the periods with temperatures within these thresholds; sums of active and effective temperatures, total precipitation, and hydrothermal coefficients for these periods. Our previous investigations proved that the major factor that reduced the length of the growing season for cereals in the European Russia in the past decades was a rise in the sum of effective temperatures above 15 °C (∑Te15) [33,34]. The effective temperature sum is calculated by summing up mean daily temperatures minus the base temperature (15 °C in this case). Besides, the following factors were significant: the total precipitation during the period with temperatures above 15 °C (P15) and the length of the period with temperatures ranging 10–15 °C (L10–15).
The analysis of the data collected from 1981 through 2009 at Yekaterinino Experiment Station of VIR for the reference cv. ‘Gorizont’ resulted in the following formula:
L = 84.512 0.034 T e 15 + 0.061 P 15 R 2   =   0.66   ( < 0.001 ;   < 0.001 ; < 0.001 )
where R2 denotes the coefficient of determination, and the significance levels for regression coefficients are shown in the parentheses.
The data of 2010–2019, unused in the original construction of the model (1), made it possible to validate it. The mean absolute error (MAE) and mean absolute percentage error (MAPE) were used to assess the model’s quality.
An agrometeorological regression model was built for yield, using a regression method with successive inclusion of variables.
The studied oat accessions were characterized by mean values for the years of observations. The significance of differences between the characteristics of the standard cultivar Gorizont and the average for the year for 764 accessions was studied by the Wilcoxon signed-rank test. A principal component analysis (PCA) of the accessions was done for five characters: both resistances were excluded because their distribution differed from the normal one. ANOVA and the Kruskal–Wallis test by ranks for scored variables were used to study the differences among the cultivar groups of different geographic origin. A significance level of 5% was accepted for this study.

3. Results

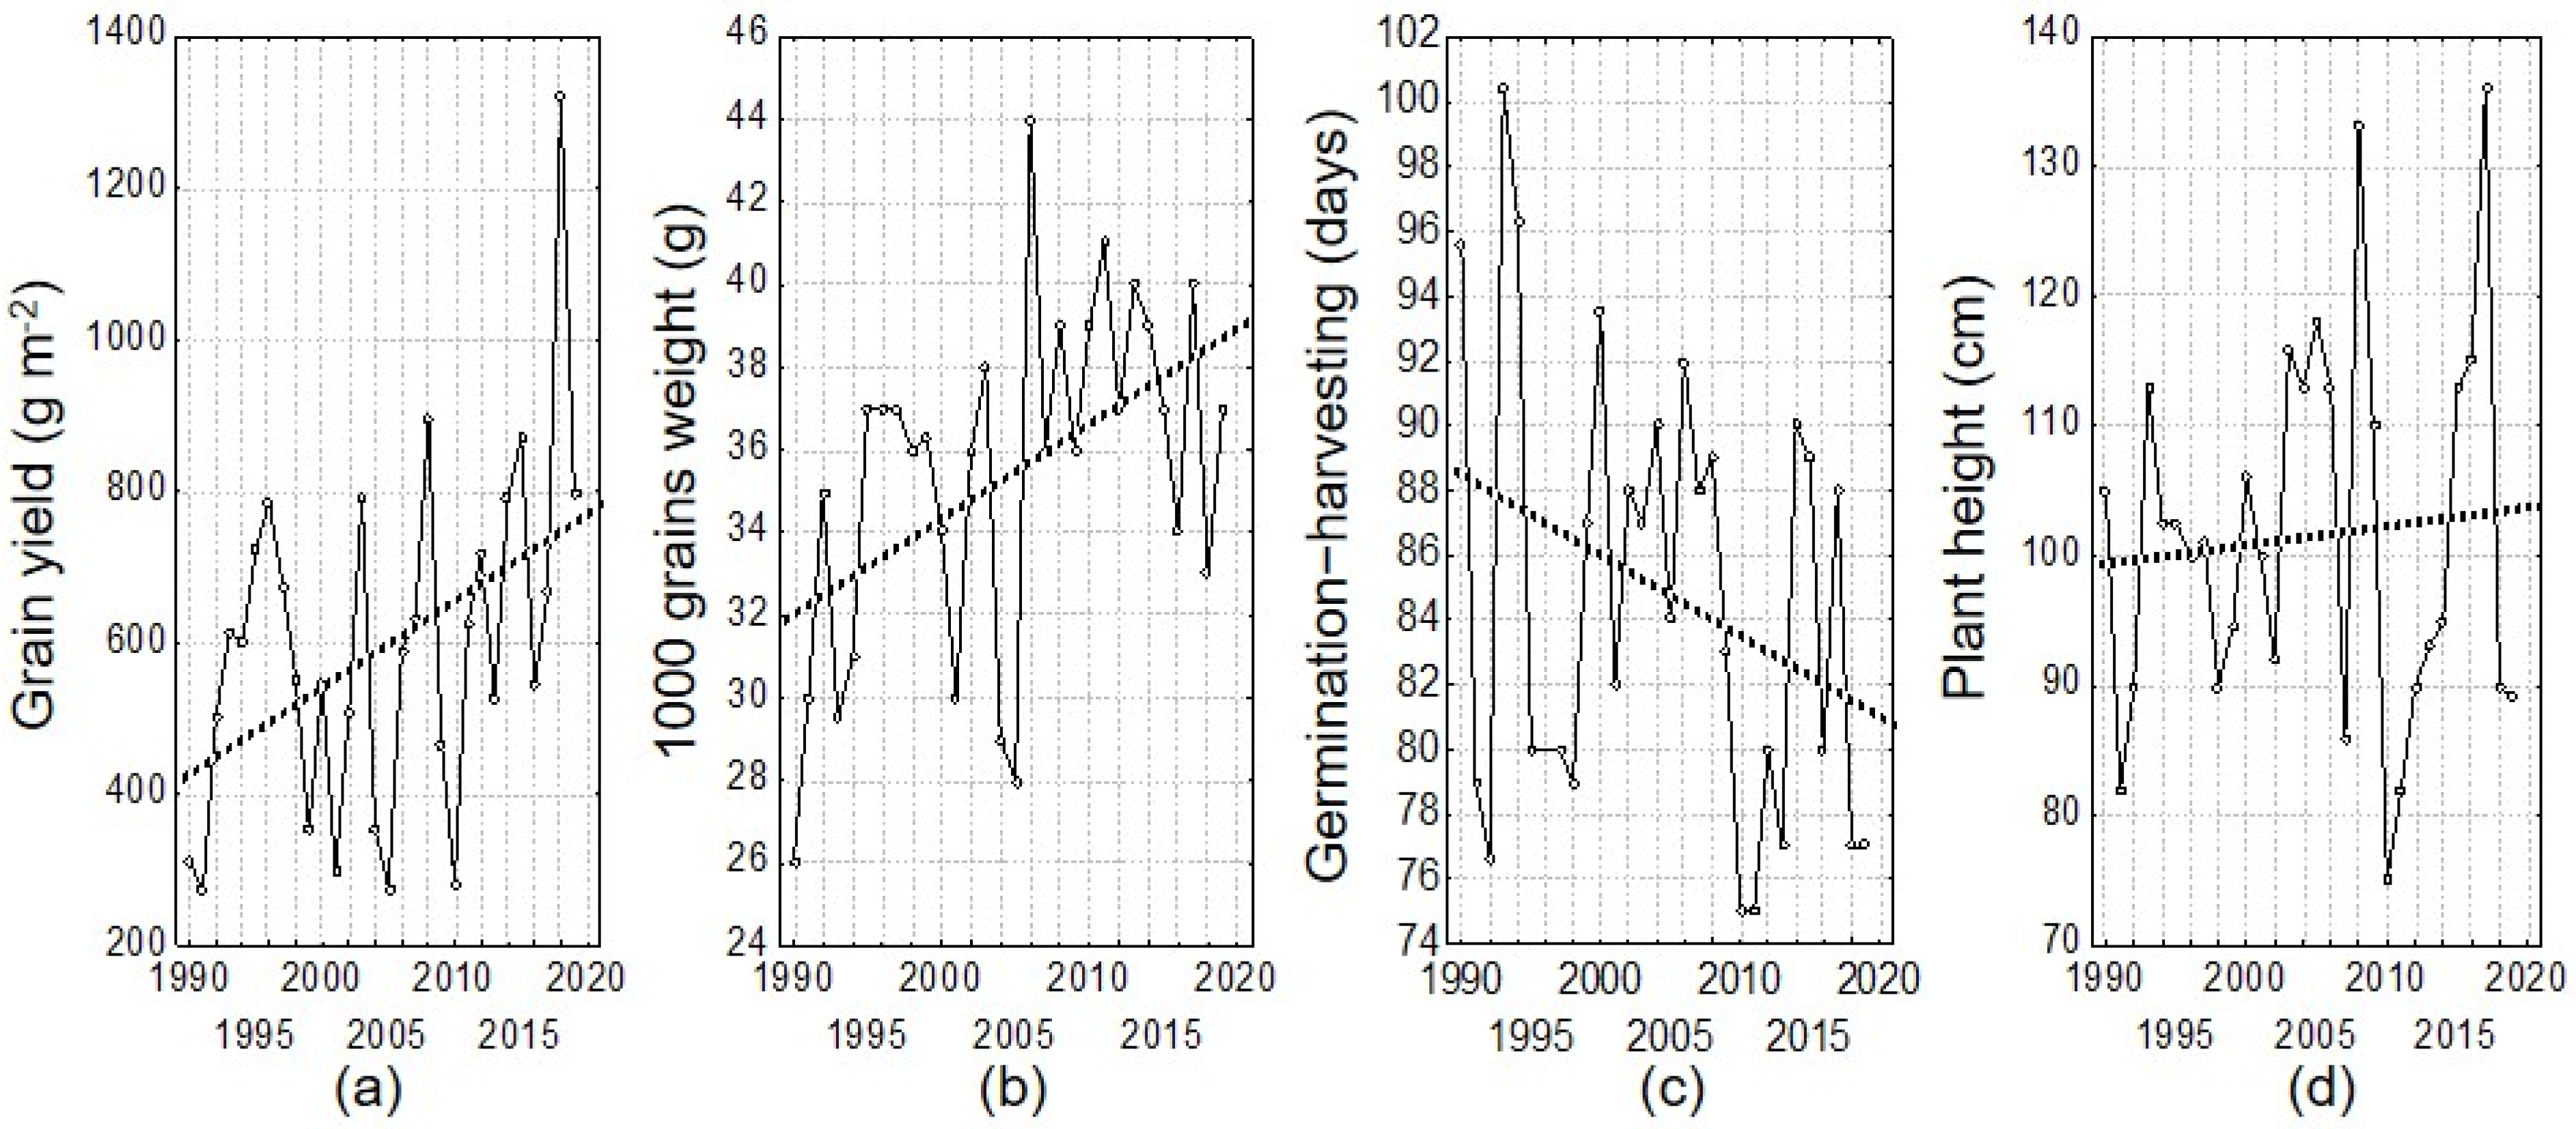
3.1. Dynamics of Characters in the Reference Oat Cultivar ‘Gorizont’ in 1990–2019

The effect of climate change on the crop is most obvious in the data of a single cultivar accumulated for many years. Compared with the data of the state variety trials and large-scale crop plantings, the impact of cultivar replacement procedures is smoothed in these long-term observations. The reference cultivar ‘Gorizont’ demonstrated from 1990 through 2019 statistically significant increases in the grain weight per 1 m2 (by 114.7 g/10 years, p = 0.015) and 1000 grain weight (by 2.3 g/10 years, p = 0.007) (Figure 1). The length of the period from germination to harvesting shortened slightly by 2.5 days/10 years (p = 0.092). Plant height values did not change significantly. Lodging resistance scored 7–8 points in 1990–1998, and 9 points beginning from 1999; resistance to Helminthosporium leaf blotch was assessed at 6–8 points in 1990–2000, 9 points in 2001–2011, and 7–9 points from 2012 through 2019. Grain yield significantly correlated with 1000 grain weight (r = 0.48), while its association with plant height was not statistically significant (r = 0.11).
The length of the period from germination to heading showed the strongest correlation with L10–15 (r = 0.57), and that of the heading to harvesting period with the precipitation in July (r = 0.76). L10-15 insignificantly shortened at a rate of 4.6 days/10 years (p = 0.064), and the precipitation in July reduced by 0.8 mm/10 years (p = 0.933).
The growing season, according to the model (1), becomes shorter with a rise of ∑Te15, partially compensated by the growth of P15. The model (1) was validated for the data of 2010–2019, initially unused in its construction. The model proved its high prognostication ability: MAE = 4.3 days, and MAPE = 5.3%. Values of MAPE < 10% witness to the model’s high fidelity [35]. The highest absolute error of the model (13.5 days) occurred in 2014, when there was practically no rainfall in July. As was mentioned before, the trends of predictor variables in the model (1) were: ∑Te15 132.7 °C/10 years (p < 0.001) and P15 34.40 mm/10 years (p = 0.037); calculations for the model (1) predict, in the event that the observed changes continue, a reduction in the growing season duration by 2.4 days/10 years.
Plant height depended on the period between dates of temperature transition over 10 °C and 20 °C (r = 0.66), which insignificantly shortened by 2.4 days/10 years (p = 0.598).
The weight of 1000 grains was less associated with weather conditions; the strongest positive correlation was with the temperature in June (r = 0.43). June temperatures rose by 1.0 °C/10 years (p = 0.067). The 1000 grain weight negatively correlated with the length of the period from germination to heading and the precipitation in May, and positively with the precipitation in August.
Resistance to lodging was positively correlated with the temperatures in August (r = 0.54). The increase in August temperatures was 1.1 °C/10 years (p < 0.000).
Resistance to Helminthosporium leaf blotch had no statistically significant relationships with agrometeorological indicators.
Grain yield (Y) of cv. ‘Gorizont’ had positive dependence on the temperature in May (TMay) and the precipitation in July (PJul), and was negatively correlated with the temperature in June (TJun).
Y = 233.542 + 51.783 T May + 3.437 P Jul 36.106 T Jun R 2   =   0.54   ( 0.476 ;   0.001 ;   0.001 ;   0.041 )
Predictor variables in the model (2) demonstrated the following trends in 1990–2019: TMay 1.7 °C/10 years (p = 0.004); TJun 1.0 °C/10 years (p = 0.067); PJul ‒0.8 mm/10 years (p = 0.933). If the observed tendencies towards warmer climate continue, the model predicts an increase in Y by 47.6 g/m2/10 years. Thus, a rise in May temperatures promotes earlier planting and germination, quicker heading, higher 1000 grain weight, and an increase in grain yield.

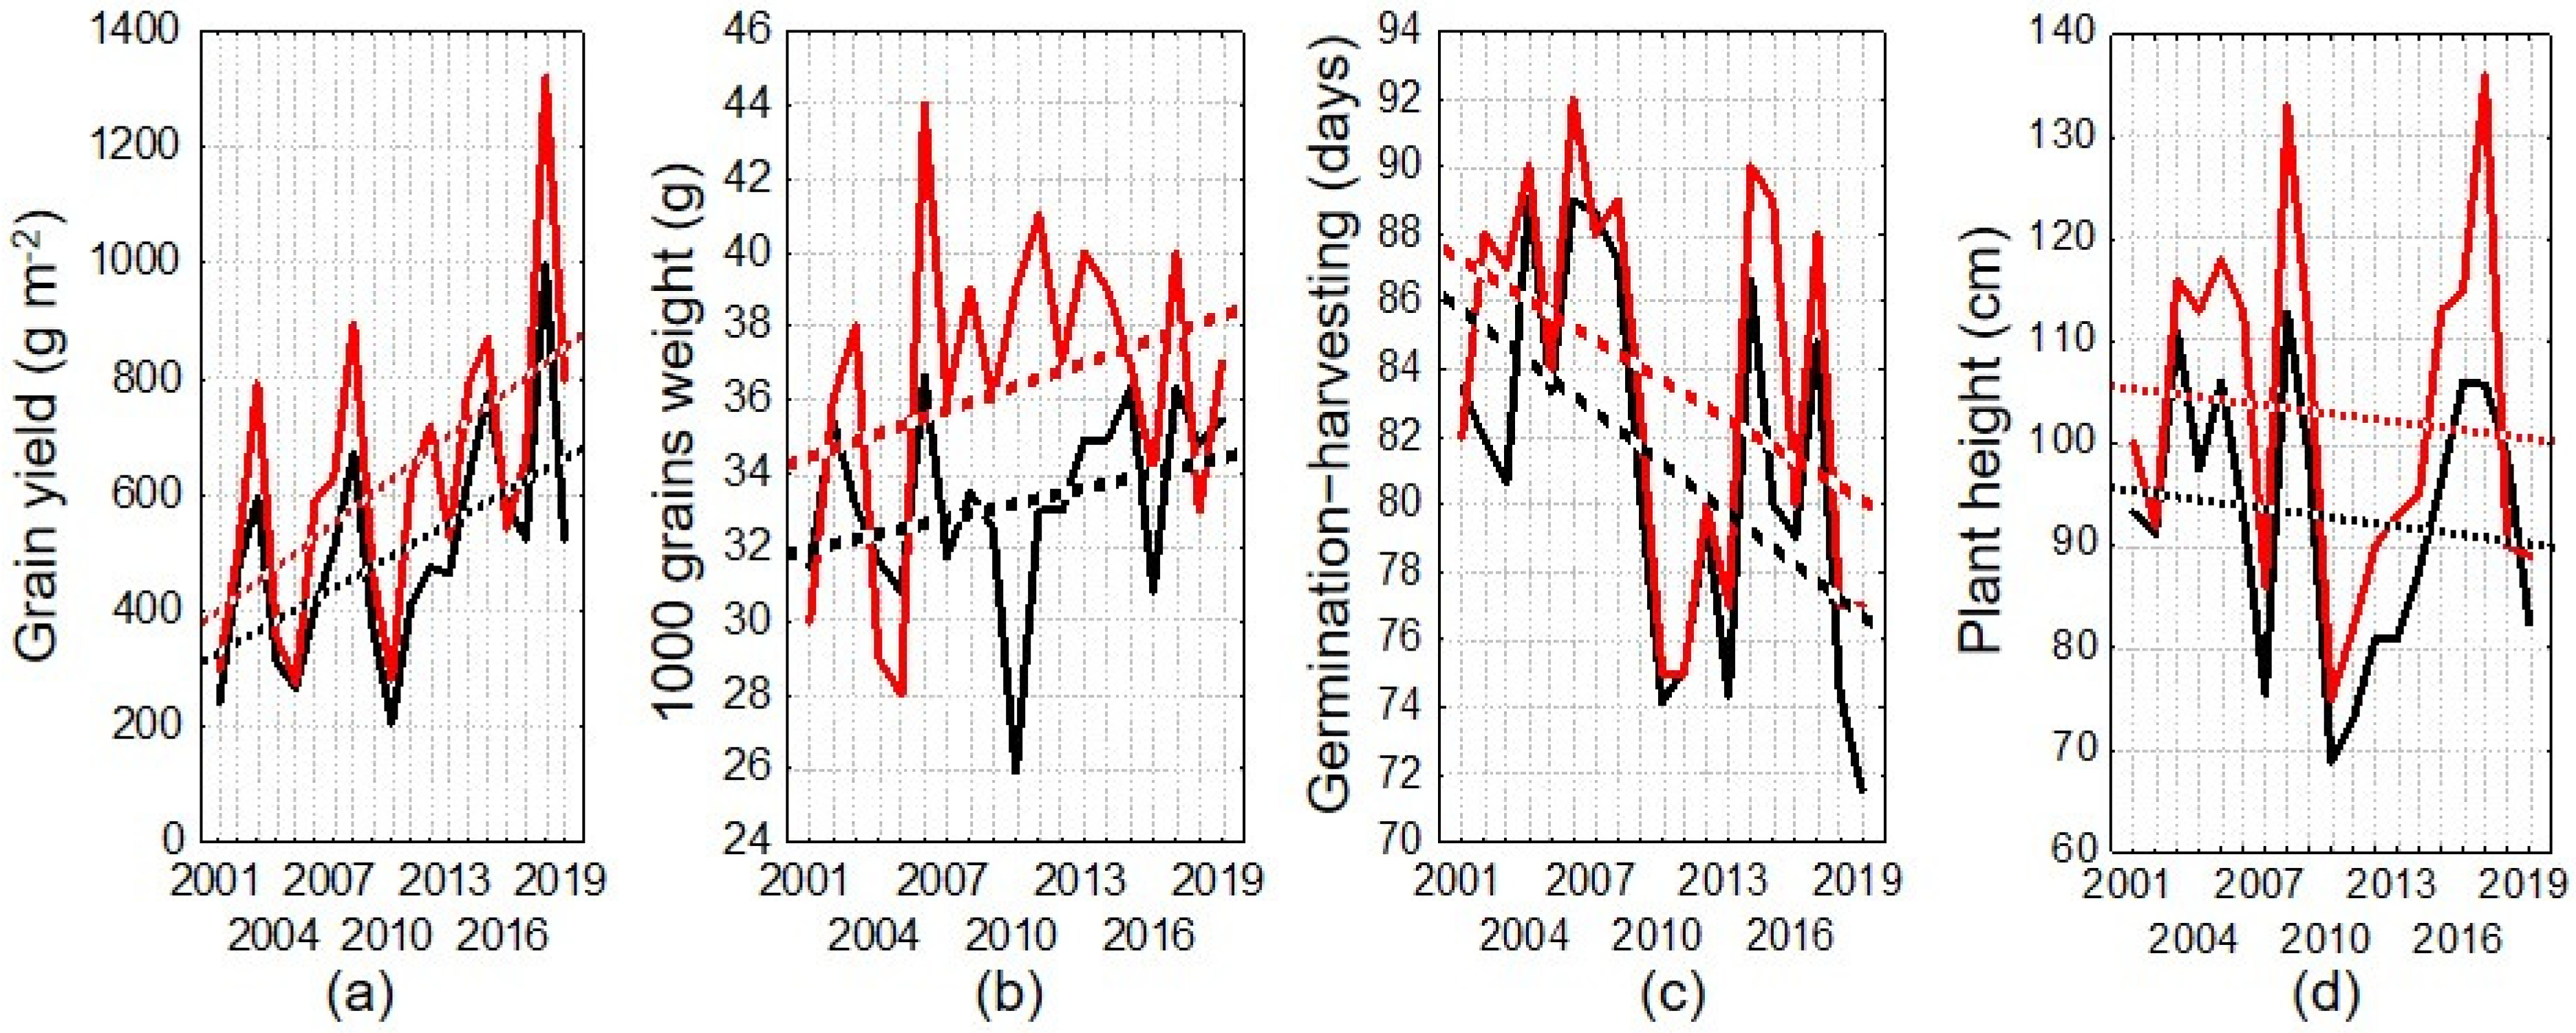
3.2. Dynamics of Mean Values across the Studied Set of Oat Accessions

In 2001–2019, two statistically significant trends were observed in oat accessions for the mean values of the studied characters: shortening of the germination to harvesting period by 5.1 days/10 years (p = 0.024), and a grain yield increase by 189.5 g/m2/10 years (p = 0.013). They may be explained either by the changes in the collection’s composition or by climate change.
The dynamics shown by the characters of the reference cv. ‘Gorizont’ reflects well enough the dynamics of mean values for such characters in the entire oat collection (Figure 2). In 2001–2019, correlations of the means across all accessions from the oat collection and cv. ‘Gorizont’ were statistically significant: r = 0.54 for the germination to heading; r = 0.86 for the heading to harvesting period; r = 0.88 for the germination to harvesting period; r = 0.87 for plant height; r = 0.92 for grain yield; and r = 0.53 for 1000 grain weight. Highly correlated characters in the reference and in their mean values across the oat collection depended to the greatest extent on environmental conditions. Thus, the changes in weather, climate and agricultural practice were the principal factor in the variability of growing season duration, grain yield, and plant height. The length of the period from germination to heading and 1000 grain weight depended on the composition of the collection studied in this or that year. This observation also shows that the oat collection did not undergo any structural changes in its composition, such as its enrichment with accessions of a definite type.
Cultivars Gorizont significantly exceeded the average for the collection in terms of the following indicators: yield (628.9 vs. 496.2 g, Wilcoxon Matched Pairs Test p < 0.001), 1000 grain weight (36.5 vs. 33.3 g, p = 0.003), germination-heading (49.2 vs. 46.0 g, p = 0.005), germination-harvestion (83.7 vs. 81.2 days, p = 0.001), plant height (103.1 vs. 92.6 cm, p <0.001), lodging resistance (9.0 vs. 8.5 points, p < 0.001), resistance to Helminthosporium (8.3 vs. 7.5 points, p = 0.011). Cultivars Gorizon is maximally adapted to the conditions of the study, and the studied accessions is mainly accession from other ecological and geographical conditions. The advantages of the cultivar were clearly manifested in the hot 2010, when the average July temperature was 27.3 ° C, the maximum temperature was 39.8 ° C, which did not allow the accessions of the collection to form a completed grain, the average weight of 1000 grains for 764 accessions was 25.9 g, and the cultivar Gorizon is 39.0 g.

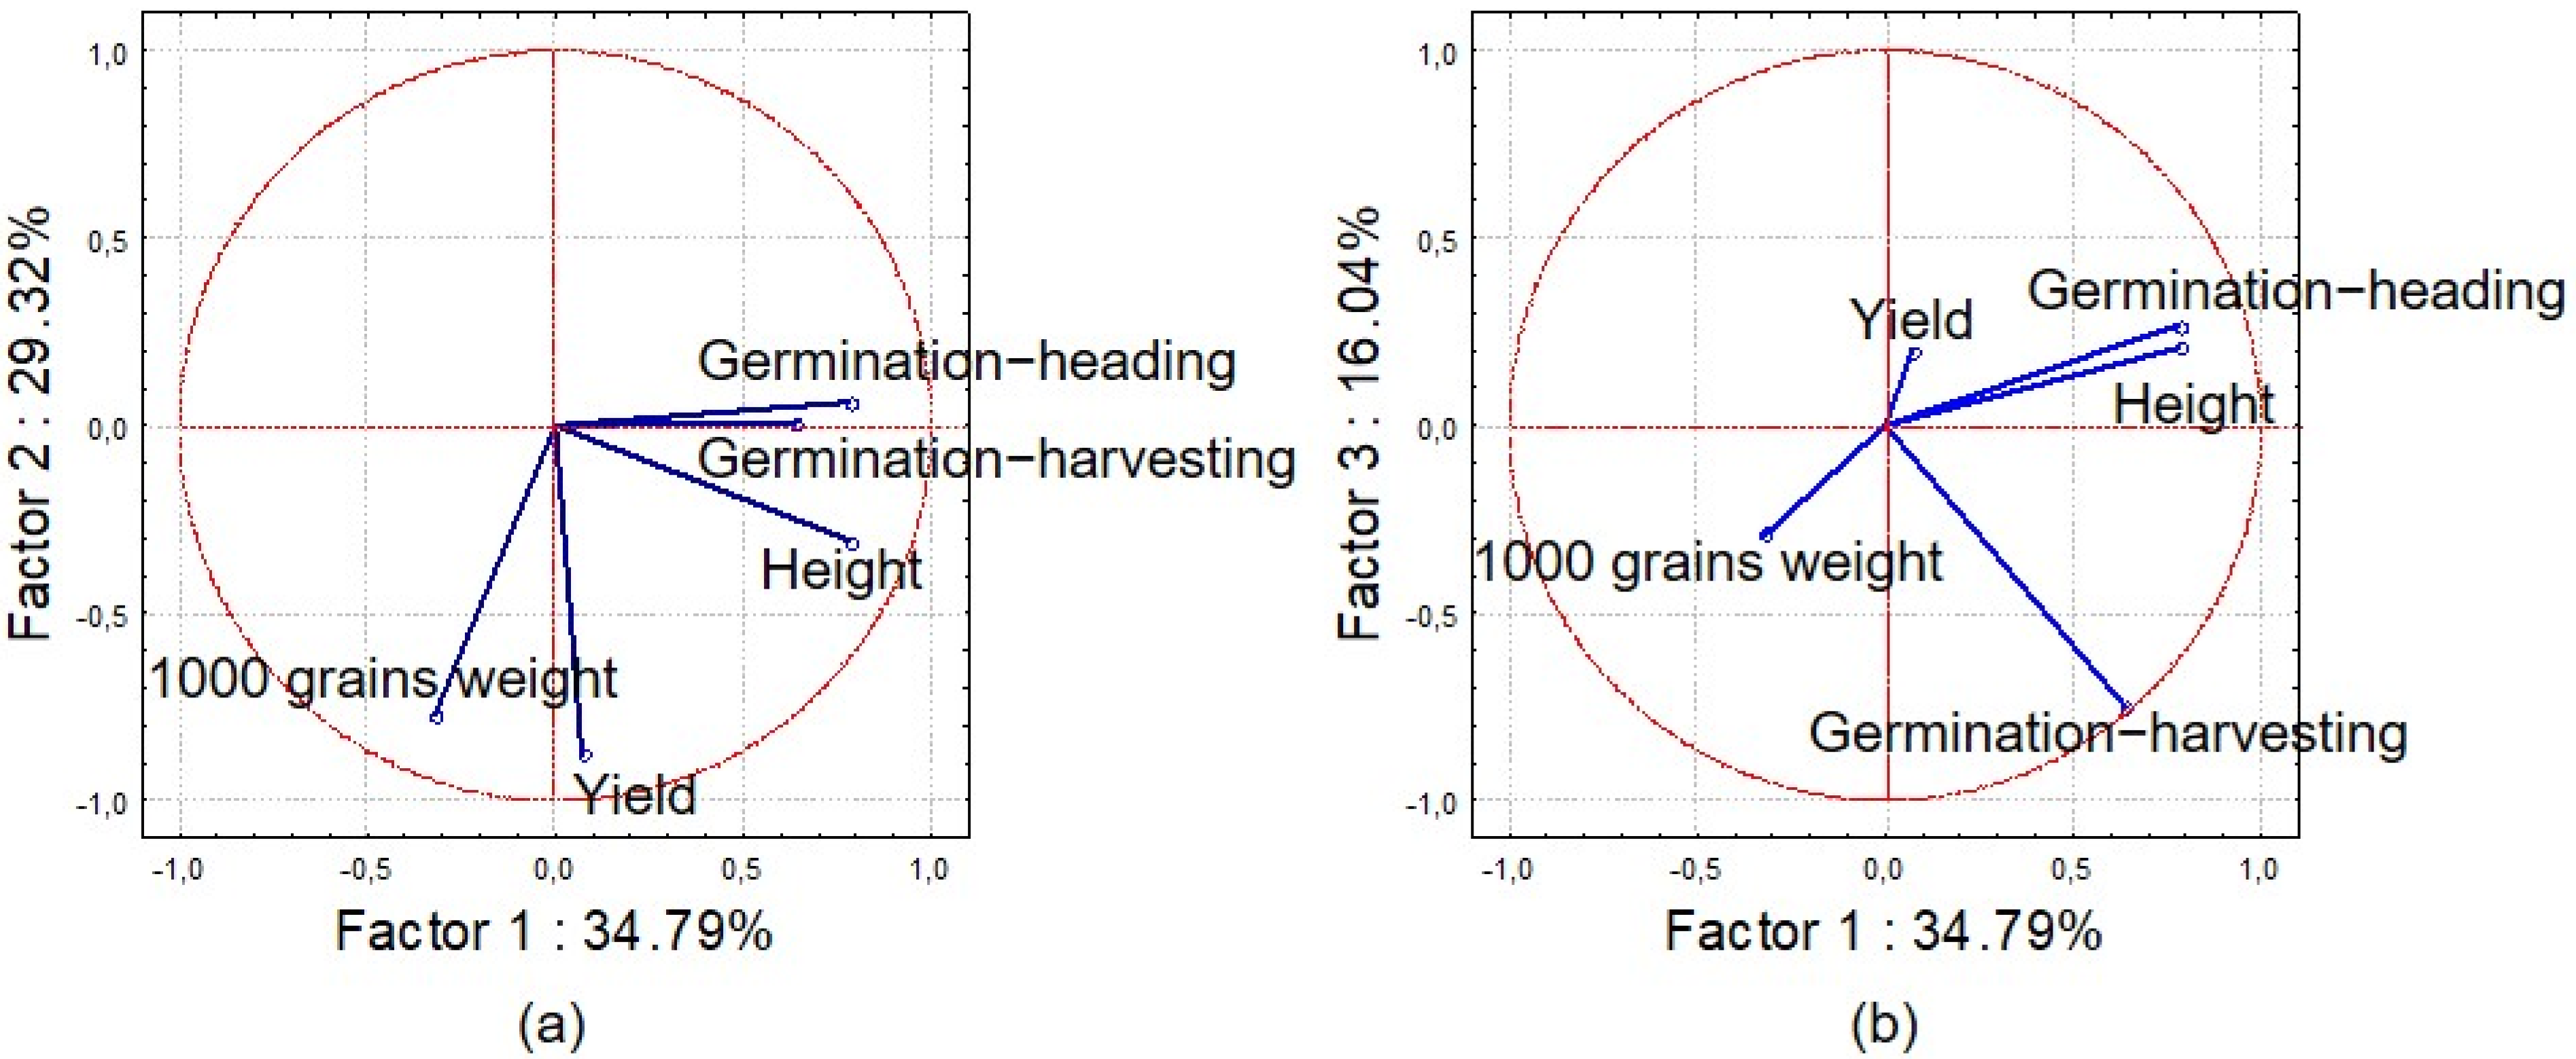
3.3. Variability of Traits in the Set of Oat Accessions

The accessions studied in 2001–2019 demonstrated a significant phenotypic variability (Supplementary Table S1). Their yield varied from 19.3 to 153.3 g/m2, 1000 grain weight from 7.7 to 48.3 g, growing season duration from 68 to 98 days, germination to heading period from 34 to 66 days, plant height from 41.7 to 150.0 cm, lodging resistance from 3.0 to 9.0 points, and leaf blotch resistance from 4.3 to 9.0 points. The selected set showed poor variability in lodging resistance; the upper and lower quartiles were equal to 9.0 points, the interquartile range was zero, and 90% of the accessions scored 7–9 points in their resistance to lodging. The variability was higher in leaf blotch resistance: the quartiles were 7.0 and 8.3.
The PCA of five characters showed that the main factor that differentiated the studied accessions encompassed plant height and length of the germination to heading period: correlations of these characters with the first factor were at r = 0.78 (Figure 3). The second factor was associated with grain yield (r = −0.87) and 1000 grain weight (r = −0.77). The third factor was closely linked (r = −0.75) to the duration of the growing season. Three first factors explain 80.2% of variance, and may be regarded as sufficient according to the scree test.
Thus, the cultivars differed among themselves in plant height, yield, and growing season duration. Besides, the accessions showed different resistance to Helminthosporium leaf blotch.

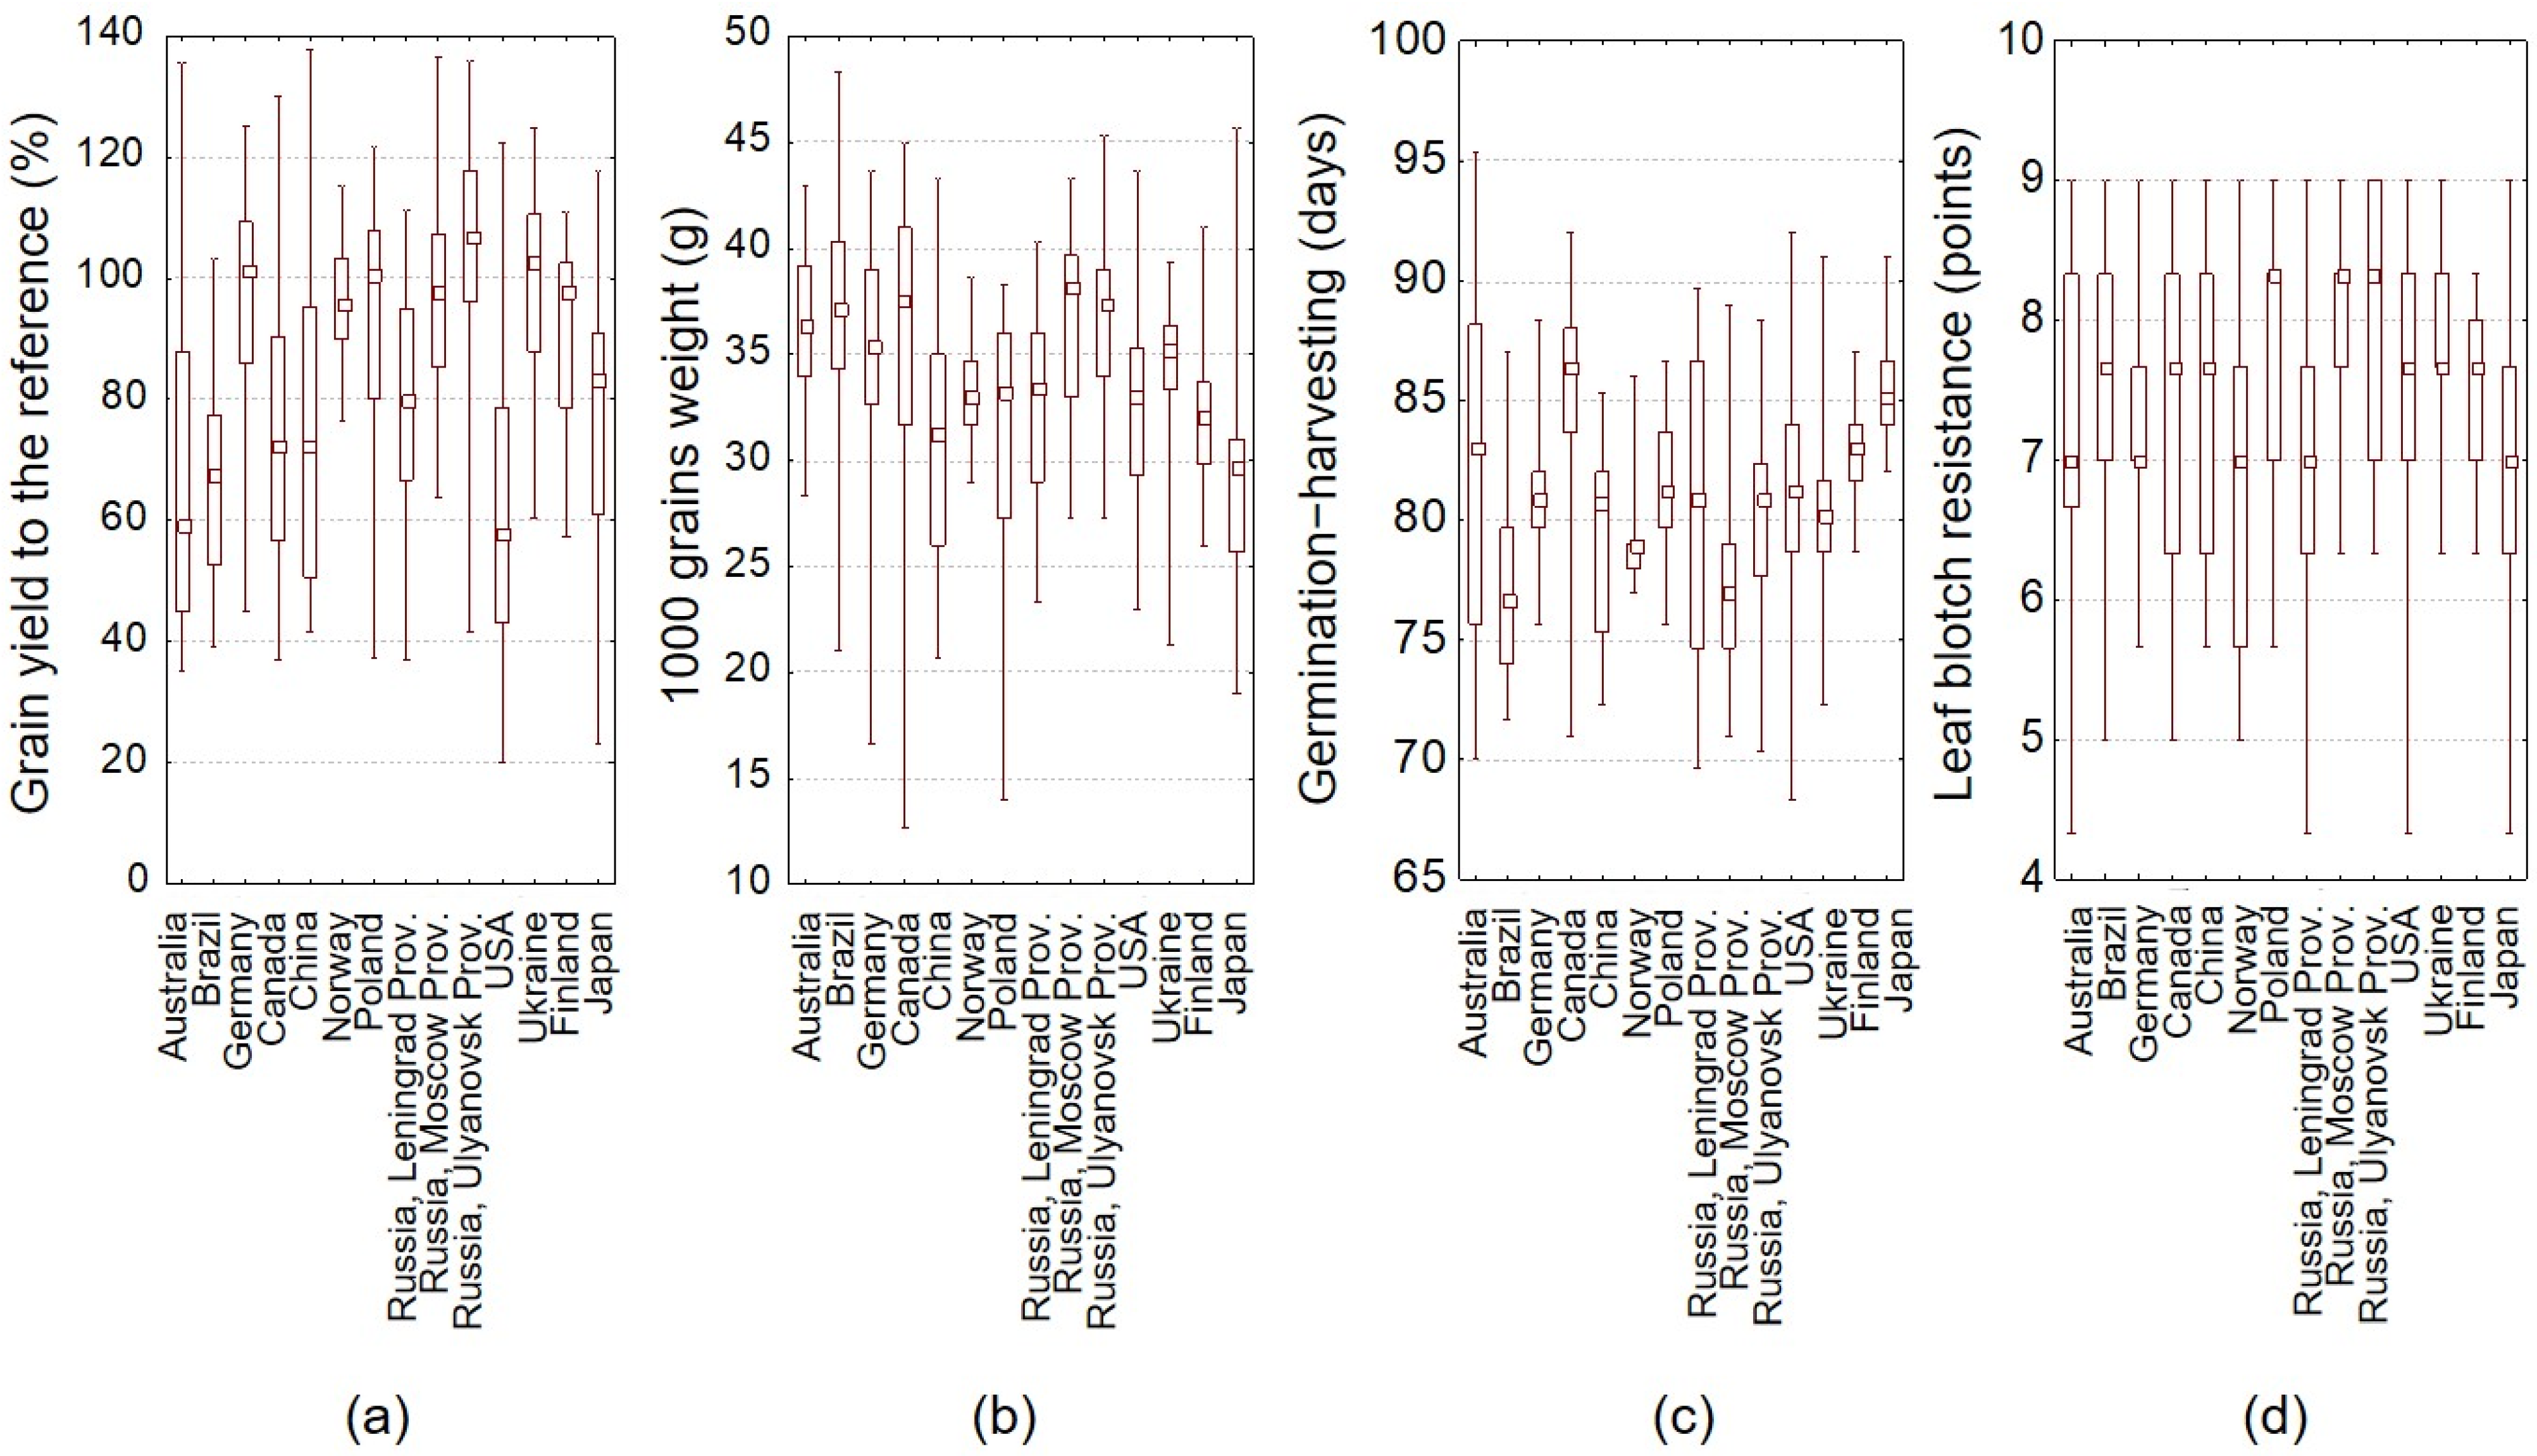
3.4. Comparison of the Cultivar Groups with Different Geographic Origin

Large groups of cultivars from 14 countries were searched for promising sources of new combinations of useful agronomic traits. Grain yield was expressed as the percentage of the reference value. The ANOVA showed that the groups from different countries significantly differed in all studied indicators at the level of p < 0.005; useful agronomic traits of the groups are presented in Figure 4. The Kruskal–Wallis test revealed statistically significant differences in the resistances to lodging (p = 0.018) and leaf blotch (p < 0.001).
It was established that the most high-yielding in the environments of Tambov Province, when compared with the reference, were the accessions from Ulyanovsk Province (102.9%), Ukraine (99.4%), Moscow Province (97.7%), Norway (96.7%), Germany (96.1%), Poland (91.1%), and Finland (90.7%). The contrasting set with the lowest yield included accessions from the USA (61.5%), Brazil (67.2%), Australia (69.5%), and China (75.2 %).
The highest 1000 grain weight was recorded for the accessions from Moscow Province (36.6 g), Ulyanovsk Province (36.4 g), and Australia (36.3 r); the lowest for those from Japan (30.5 g), Poland (30.4 g), and China (34.5 g).
The growing season duration was the shortest in the cultivar groups from Brazil (77.2 days), Moscow Province (77.3 days), Norway (79.6 days), China (79.9 days), Ulyanovsk Province (80.2 days), Leningrad Province (80.3 days), and Ukraine (80.5 days). Contrasting accessions were from Australia (82.4 days), Finland (82.8 days), Canada (85.3 days), and Japan (85.6 days).
The highest resistance to Helminthosporium leaf blotch was observed in the accessions from Moscow Province (8.1 points) and Ulyanovsk Province (8.0 points); the lowest in those from Norway (6.8 points).
Thus, the highest grain yields were characteristic of the accessions that originated from geographically close regions of Russia and foreign countries: Ulyanovsk Province, Ukraine, Moscow Province, Germany, and Poland. The early accessions from Norway, despite their susceptibility to leaf blotch, and Finland also proved themselves as promising.

4. Discussion

The study covering a massive set of oat accessions grown under contrasting weather conditions at Yekaterinino Experiment Station of VIR showed that in 2001–2019 the growing season shortened, while the grain yield increased both in the mean values of the studied accessions and in the reference cultivar ‘Gorizont’.
Our research demonstrates that the length of the growing season for oats is determined to a considerable extent by the meteorological conditions during the period with temperatures above 15 °C: a rise in the sum of temperatures exceeding 15 °C results in a shortened growing season, whereas an increase in precipitation partially compensates this effect. In 1990–2019, a statistically significant increase in heat and moisture supply during the period with temperatures above 15 °C was observed in the environments of Yekaterinino Station of VIR: total precipitation increased by 34.4 mm/10 years (p = 0.037), and the sum of effective temperatures by 132.7 °C/10 years (p < 0.001). Cultivated oat, as a crop of northern countries, is known to be suppressed by high mid-summer temperatures [29,30], and it is very sensitive to water deficit during maturation [36].
The PCA showed that the formation of oat yield in the environments of Yekaterinino Station depended mostly on the weight of 1000 grains. In the northern regions, with better moisture supply, the yield of cultivars is more correlated with plant height than with the weight of 1000 grains [33]. In the conditions of the continental climate of the Yekaterininskaya station, high temperatures and arid conditions in July are not optimal for most oat accessions, which determined the relationship between the yield and the weight of 1000 grains.
A regression analysis of the dynamics among agrobiological indicators in cv. ‘Gorizont’ from 1990 through 2019 revealed that a rise in May air temperature led to earlier planting and germination, preconditioned successful passing through the growing season, and entailed an increase in both 1000 grain weight and grain yield. The yield is positively influenced by the precipitation in July and negatively by the temperature in June. The correlation between the sum of temperatures and total precipitation in summer was recognized as a factor regulating oat yield in Siberia [16], but the prognosis for Siberia is a negative trend in yield. There are also negative prognoses for oat in Europe [18].
The richest diversity in the studied set of oat accessions was observed for plant height, grain yield, growing season duration, and leaf blotch resistance. PCA failed to identify groups of accessions with different geographic origin that would appear visually contrasting in the allocated factors, but ANOVA showed that such origin-specific groups differed statistically in the mean values of the studied characters. It is in line with the data concerning the role of the region-of-origin factor in the polymorphism of oat germplasm collections [37].
The trend of the mean yield across the studied accessions, associated with climate change, proves the need to use a reference cultivar in retrospective comparisons among the accessions and employ the relative yield parameter matched with the reference. The grain yield and the length of the period from germination to harvesting, manifested by the reference, appeared highly correlated with the mean for the collection (r = 0.92 and r = 0.88, respectively).
Comparing the origin-specific groups of cultivars showed that the most high-yielding were the accessions from geographically close Russian regions and European countries: Ulyanovsk Province, Moscow Province, Ukraine, Germany, and Poland; besides, early-maturing oat accessions from Norway and Finland were also recognized as promising.

5. Conclusions

In recent decades, an increase in temperatures and precipitation has been observed in most of European part of Russia. In the Tambov Province—one of the most important agricultural regions—these climate changes were favorable for the production of oats. A rise in May temperatures promotes earlier planting and germination, quicker heading, higher 1000 grain weight, and an increase in grain yield. An increase in temperatures, not accompanied by a decrease in precipitation, is generally positive for agriculture in European part of Russia, contributing to the advancement of crop production to the north. However, in the more southern regions of the European part of Russia, precipitation has negative tendencies; a further rise in temperature may become a limiting factor in the main regions of agricultural production in Russia.

Supplementary Materials

The following are available online at https://www.mdpi.com/2073-4395/11/3/423/s1, Table S1. Variability of traits in a set of 764 oat accessions grouped by country of origin, Tambov Prov., Russia, 2001–2019.

Author Contributions

Conceptualization: L.Y.N., I.G.L.; experiments performance: G.V.B., E.V.B.; database preparation: G.V.B., E.V.B.; data analysis, visualization: L.Y.N.; writing: L.Y.N., I.G.L. All authors have read and agreed to the published version of the manuscript.

Funding

This research received no external funding.

Institutional Review Board Statement

Not applicable.

Acknowledgments

The present work was performed within the framework of the State Assignment No. 0662-2019-0006.

Conflicts of Interest

The authors declare no conflict of interest.

References

  1. IPCC. 2018: Summary for Policymakers. In Global Warming of 1.5 °C; World Meteorological Organization: Geneva, Switzerland; Available online: https://www.ipcc.ch/sr15 (accessed on 26 March 2020).
  2. Gosling, S.N.; Arnell, N.W. A global assessment of the impact of climate change on water scarcity. Clim. Res. 2016, 134, 371–385. [Google Scholar] [CrossRef] [Green Version]
  3. Menzel, A.; von Vopelius, J.; Estrella, N.; Schleip, C.; Dose, V. Farmers’ annual activities are not tracking speed of climate change. Clim. Res. 2006, 32, 201–207. [Google Scholar]
  4. Cleland, E.E.; Chuine, I.; Menzel, A.; Mooney, H.A.; Schwartz, M.D. Shifting plant phenology in response to global change. Trends Ecol. Evol. 2007, 22, 357–365. [Google Scholar] [CrossRef]
  5. Forkel, M.; Carvalhais, N.; Schaphoff, S.; Bloh, W.V.; Migliavacca, M.; Thurner, M.; Thonicke, K. Identifying environmental controls on vegetation greenness phenology through model–data integration. Biogeosciences 2014, 11, 7025–7050. [Google Scholar] [CrossRef] [Green Version]
  6. Moriondo, M.; Bindi, M. Impact of climate change on the phenology of typical Mediterranean crops. Ital. J. Agrometeorol. 2007, 3, 5–12. [Google Scholar]
  7. Kramer, K.; Leinonen, I.; Loustau, D. The importance of phenology for the evaluation of impact of climate change on growth of boreal, temperate and Mediterranean forests ecosystems: An overview. Int. J. Biometeorol. 2000, 44, 67–75. [Google Scholar] [CrossRef] [PubMed]
  8. Richardson, A.D.; Anderson, R.S.; Arain, M.A.; Barr, A.G.; Bohrer, G.; Chen, G.; Chen, J.M.; Ciais, P.; David, K.J.; Desai, A.R.; et al. Terrestrial biosphere models need better representation of vegetation phenology: Results from the North American Carbon Program Site Synthesis. Glob. Change Biol. 2012, 18, 566–584. [Google Scholar] [CrossRef] [Green Version]
  9. Wenjiao, S.; Fulu, T.; Zhao, Z. A review on statistical models for identifying climate contributions to crop yields. J. Geogr. Sci. 2013, 23, 567–576. [Google Scholar]
  10. Pereira, J.S.; Chaves, M.M.; Caldeira, M.C.; Correia, A.V. Water Availability and Productivity. In Plant Growth and Climate Change; Morison, J.I.L., Morecroft, M.D., Eds.; Blackwell Publishing Ltd.: Oxford, UK, 2006; pp. 118–145. [Google Scholar]
  11. Fishman, R. More uneven distributions overturn benefits of higher precipitation for crop yields. Environ. Res. Lett. 2016, 11, 024004. [Google Scholar] [CrossRef]
  12. Dong, T.; Liu, J.; Shang, J.; Qian, B.; Huffman, T.; Zhang, Y.; Champagne, C.; Daneshfar, B. Assessing the Impact of Climate Variability on Cropland Productivity in the Canadian Prairies Using Time Series MODIS FAPAR. Remote Sens. 2016, 8, 281. [Google Scholar] [CrossRef] [Green Version]
  13. Ceglar, A.; Toreti, A.; Lecerf, R.; Van der Velde, M.; Dentener, F. Impact of meteorological drivers on regional inter-annual crop yield variability in France. Agric. For. Meteorol. 2016, 216, 58–67. [Google Scholar] [CrossRef]
  14. Iizumi, T.; Ramankutty, N. Changes in yield variability of major crops for 1981–2010 explained by climate change. Environ. Res. Lett. 2016, 11. [Google Scholar] [CrossRef]
  15. Dreccer, M.F.; Fainges, J.; Whish, J.; Ogbonnaya, F.C.; Sadras, V.O. Comparison of sensitive stages of wheat, barley, canola, chickpea and field pea to temperature and water stress across Australia. Agric. For. Meteorol. 2018, 248, 275–294. [Google Scholar] [CrossRef]
  16. Babushkina, E.A.; Belokopytova, L.V.; Zhirnova, D.F.; Shah, S.K.; Kostyakova, T.V. Climatically driven yield variability of major crops in Khakassia (South Siberia). Int. J. Biometeorol. 2017. [Google Scholar] [CrossRef] [Green Version]
  17. Zheltaya, N.N. On the Relationship of the Mean Regional Oat Yield with Basic Meteorological Indicatiors in Different Areas of the European Part of the USSE. Improvement of Agrometeorological Forecasting Methods. In Proceedings of the Hydrometeorological Center; Gidrometeiozdat: Leningrad, Russia, 1974; pp. 104–113. [Google Scholar]
  18. Elsgaard, L.; Børgesen, C.D.; Olesen, J.E.; Skjelvåg, A.O. Shifts in comparative advantages for maize, oat and wheat cropping under climate change in Europe. Food Addit. Contam. Part A 2012, 29, 1514–1526. [Google Scholar] [CrossRef] [PubMed]
  19. García-León, D.; López-Lozano, R.; Toreti, A.; Zampieri, M. Local-Scale Cereal Yield Forecasting in Italy: Lessons from Different Statistical Models and Spatial Aggregations. Agronomy 2020, 10, 809. [Google Scholar] [CrossRef]
  20. Alexandersson, E.; Keinänen, M.; Chawade, A.; Himanen, K. Nordic research infrastructures for plant phenotyping. Agric. Food Sci. 2018, 27, 7–16. [Google Scholar] [CrossRef] [Green Version]
  21. Keilwagen, J.; Kilian, B.; Özkan, H.; Babben, S.; Perovic, D.; Mayer, K.F.X.; Walther, A.; Poskar, C.H.; Ordon, F.; Eversole, K.; et al. Separating the wheat from the chaff—A strategy to utilize plant genetic resources from ex situ genebanks. Sci. Rep. 2014, 4, 5231. [Google Scholar] [CrossRef] [PubMed]
  22. Loskutov, I.G.; Kovaleva, O.N.; Blinova, E.V. Methodological Guidance Directory for Studing and Maintaining VIR’s Collections of Barley and Oat, 4th ed.; N.I. Vavilov All-Russian Institute of Plant Genetic Resources: Saint Petersburg, Russia, 2012; 63p. (In Russian) [Google Scholar]
  23. Vavilov, N.I. Geographical variability of plants. Sci. Word 1928, 1, 23–33. (In Russian) [Google Scholar]
  24. Loskutov, I.G. Vavilov and His Institute. In A History of the World Collection of Plant Genetic Resources in Russia; International Plant Genetic Resources Institute (IPGRI): Rome, Italy, 1999; 190p. [Google Scholar]
  25. Loskutov, I.G. Oat (Avena, L.). Distribution, Taxonomy, Evolution and Breeding Value; N.I. Vavilov All-Russian Institute of Plant Genetic Resources: Saint Petersburg, Russia, 2007; 335p. (In Russian) [Google Scholar]
  26. Loskutov, I.G.; Rines, H.W.; Avena, L. Wild Crop Relatives: Genomic and Breeding Resources. Cereals; Kole, C., Ed.; Springer: Berlin/Heidelberg, Germany; New York, NY, USA, 2011; pp. 84–109. [Google Scholar] [CrossRef]
  27. Loskutov, I.G. History of the World Collection pf Plant Genetic Resources in Russia; N.I. Vavilov All-Russian Institute of plant genetic resources: Saint Petersburg, Russia, 2009; 274p. (In Russian) [Google Scholar]
  28. Stevens, E.J.; Armstrong, K.W.; Bezar, H.J.; Griffin, W.B.; Hampton, J.G. Fodder Oats: An Overview (Chapter II). In Fodder Oats: A World Overview; Suttie, J.M., Reynolds, S.G., Eds.; Plant Production and Protection Series; FAO: Rome, Italy, 2004; Volume 33, Available online: http://www.fao.org/docrep/008/y5765e/y5765e06.htm (accessed on 28 June 2020).
  29. Rines, H.W.; Molnar, S.J.; Tinker, N.A.; Philipps, R.I. Oat. In Genome Mapping and Molecular Breeding in Plants, Volume 1: Cereals and Millets; Kole, C., Ed.; Springer: Berlin/Heidelberg, Germany; New York, NY, USA, 2006. [Google Scholar] [CrossRef]
  30. Heuzé, V.; Tran, G.; Nozière, P.; Renaudeau, D.; Lessire, M.; Lebas, F. Oats. Feedipedia, a Programme by INRA, CIRAD, AFZ and FAO. 2016. Available online: https://www.feedipedia.org/node/231 (accessed on 7 June 2020).
  31. Kirilov, A. Fodder Oats in Europe (Chapter XI). In Fodder Oats: A World Overview; Suttie, J.M., Reynolds, S.G., Eds.; Plant Production and Protection Series No. 33; FAO: Rome, Italy, 2004; Available online: http://www.fao.org/3/y5765e/y5765e0f.htm (accessed on 17 July 2020).
  32. Agroclimatic reSources of the Tambov Province; Gidrometeoizdat: Leningtad, Russia, 1974; 102p. (In Russian)
  33. Novikova, L.Y.; Dyubin, V.N.; Seferova, I.V.; Loskutov, I.G.; Zuev, E.V. Prediction of vegetation period duration in spring cereal crops varieties in the conditions of climate changes. Agric. Biol. 2012, 5, 78–87. [Google Scholar] [CrossRef]
  34. Loskutov, I.G.; Novikova, L.Y.; Kovaleva, O.N.; Ivanova, N.N.; Blinova, E.V.; Belskaya, G.V. Ecological-geographic approaches to the study of genetic diversity of barley and oat from the VIR collection. Ecol. Genet. 2020, 18, 89–102. [Google Scholar] [CrossRef] [Green Version]
  35. Eliseeva, I.I. (Ed.) Statistics; KNORUS: Moscow, Russia, 2006; 552p. (In Russian) [Google Scholar]
  36. Boczkowska, M.; Podyma, W.; Łapiński, B. 4—Oat. In Genetic and Genomic Resources for Grain Cereals Improvement; Academic Press: San Diego, CA, USA, 2016; pp. 159–225. [Google Scholar] [CrossRef]
  37. Winkler, L.R.; Bonman, J.M.; Chao, S.; Yimer, B.A.; Bockelman, H.; Klos, K.E. Population Structure and Genotype-Phenotype Associations in a Collection of Oat Landraces and Historic Cultivars. Front. Plant Sci. 2016, 7, 1077. [Google Scholar] [CrossRef] [PubMed] [Green Version]
Figure 1. Dynamics of main agronomic characters in the oat cultivar ‘Gorizont’ in 1990–2019: (a) grain yield per 1 m2; (b) 1000 grain weight; (c) length of the germination to harvesting period; (d) plant height.
Agronomy 11 00423 g001
Figure 2. Dynamics of mean values across the studied set of oat accessions: (a) grain yield; (b) 1000 grain weight; (c) length of the germination to harvesting period; (d) plant height. Designations: black graphs are for the collection’s mean values; red graphs are for cv. ‘Gorizont’.
Agronomy 11 00423 g002
Figure 3. Factor coordinates of the variables: (a) Factors 1–2; (b) Factors 1–3.
Agronomy 11 00423 g003
Figure 4. Useful agronomic traits in the large groups of accessions classified according to their geographic origin: (a) grain yield, percentage of the reference level; (b) 1000 grain weight; (c) germination to harvesting period; (d) leaf blotch resistance. Means, quartiles, and minimum/maximum values are shown.
Agronomy 11 00423 g004
Publisher’s Note: MDPI stays neutral with regard to jurisdictional claims in published maps and institutional affiliations.

