Abstract
The interaction of genotype by the environment is very common in multi-environment trials of maize hybrids. This study evaluates the quantity and the quality of grain production and the stability of four maize genotypes in a field experiment that was conducted in five different locations for two years. In order to make a reliable evaluation of the performance of genotypes in the environments, principal components analysis (PCA) was used to investigate the correlation of the yield, soil properties and quality characteristics, while the additive main effects and multiplicative interaction (AMMI) analysis detected the narrow adaptations of genotypes at specific mega-environments. For the yield, AMMI analysis indicated that a group of five environments (ENV1, ENV8, ENV6 ENV10 and ENV9) gave higher yields than the mean value and at the same time had low first interaction principal components axis (IPC1) scores, indicating small interactions. Regarding protein and fiber contents, ENV1 and ENV2, gave the highest values and this could be attributed to the high concentration rates of nutrients like Mg, Ca and the soil texture (C). Specifically for the protein, the results of the analysis indicated that certain environment would provide more protein content, so in order to obtain higher grain protein, growers should grow in certain locations in order to improve the content of this quality characteristic, certain genotypes should be used in certain environments.
1. Introduction
Maize (Zea mays L.) is a crop of major importance for the nutrition of the Earth’s population. Thus, there has been an urgent need to increase its yield and its quality. There are two main factors that have approximately the same influence on yield increase; improved management practices along with plant breeding have made an impact on this cause. It is notable that their interaction is the one that made such a huge progress to this matter that neither could do alone to this extent [1]. Maize yields have been increasing over the years globally and according to recent data have been doubled from 1961 to 2002 [1,2,3]. Even before the use of hybrids, farmers used to breed plants that seemed to fit their needs, with good adaptation at their specific environmental conditions, while maintaining their quality and morphological traits. Wherever hybrids have been adopted there has been an increase in the maize yield. Even though there was a tendency to select the high yield hybrids, the need for overall stability and dependability favors the selection of hybrids with stress tolerance. The main focus of the new hybrids now is to aim for a high and stable yield in both favorable and unfavorable growing conditions [1]. Indeed, as Rosegrant et al. [4] mention maize production may suffer a huge input reduction since the available water resources will be limited especially in regions where irrigation is essential. So, it is implied that for the future of crop production it is a mandatory need, to include the environment as an important factor in the selection of better adaptive genotypes.
Climatic conditions along with soil characteristics are the main environmental factors that affect plant growth [5]. Atmosphere and soil water availability, soil temperature and composition can make an impact to the growth of the plants along with other factors such as soil pH and its nutrient status that can influence their development [6]. Soil plays a major role in the plant’s life with emphasis on soil carbon, water quality and content. It is often related to problems that occur in plants such as nutrient deficiencies, water stress and toxicities. Its structure not only affects plant growth but also influences their ability to absorb nutrients and water [7]. Each environment has its own soil characteristics and climatic conditions that can affect the productivity of crop production. Thus, it is mandatory to take into consideration the effect of the environment while investigating the most suitable cultivation.
The genotype by environment (GE) interaction is a phenomenon recognized globally by everyone involved to the goal of crop improvement and maintenance. It refers to the various responses of genotypes across a wide range of environments [8,9]. Quantitative characteristics that are economically and agronomically important such as grain yield can be significantly affected by the GE interaction and can provide relief to the breeding actions that can be avoided, by reducing futile subsequent analyses, restricting the significance of questionable deductions and limiting the selection of superior genotypes [8,10,11,12,13]. In general, genotypes adapt differently to different environments and the evaluation of each one of them differs according to each purpose [14]. These evaluations in order to be valid are submitted to a series of multiple-environment trials (MET) in an advanced selection stage [11,15]. According to Lu’quez et al. [16], cultivars with high yield and better stability can be identified when growing cultivars in various environments. Every newly registered cultivar needs to be evaluated for adaptation for several years in many locations in order to be recommended to a specific area. To accomplish this procedure METs are conducted in many countries through varietal testing programs for more reliable results. The GE is the main interaction that needs to be evaluated. By submitting genotypes to a variety of environments, differential genotypic responses are recorded and can provide better identification of a superior and stable hybrid [17].
The environment, the genotype and the GE interaction are also responsible for variations in the quality properties of grains, including the color, the texture, the protein and the fiber content. Among the quality parameters, the protein content of the grains is highly affected by the environment [18]. The evaluation of different genotypes on quality traits associating with the improvement of the yield can also contribute to future breeding strategies.
The additive main effects and multiplicative interaction (AMMI) analysis is extensively used among agricultural researchers who want to evaluate the yield performance of different genotypes under multienvironment trials. This analysis is widely used because it contributes to better understanding of the complicated interactions between genotypes and environment, and it has high accuracy [19]. The AMMI analysis is a combination of ANOVA and PCA (principal component analysis) and a major output of the results is a biplot that presents the means of the genotypes used and their relation to the first PC [20]. This biplot is an effective tool to evaluate the GE interactions graphically [21]. The results of AMMI analysis are considered useful for the evaluation of yield stability of crops across different environmental conditions and for the determination of suitable environments for all examined genotypes [22,23,24,25].
The aim of this study was to evaluate four maize hybrids at five locations, for two years (the combination of year-location created the 10 environments), in order to investigate how maize yield and quality characteristics of the grain are affected by the GE interaction. Furthermore, principal components analysis (PCA) was used to investigate the correlation of the yield, soil properties and quality characteristics, while the AMMI analysis contributed to detect the narrow adaptations of genotypes at specific mega-environments.
2. Materials and Methods
2.1. Experimental Site and Design
The effect of GE interaction in relation to the final grain yield and the various quality characteristics were assessed. The field trials were conducted at 2019 and 2020 and a randomized complete block design was used with three replications. The experimental design had two main factors (genotypes and environments). The four maize genotypes used in the experimental fields were GEN1 (P0937, Pioneer Hi-Bred Hellas S.A.), GEN2 (DKC6050, K. and N. Efthymiadis S.A.), GEN3 (DKC6980, K. and N. Efthymiadis S.A.) and GEN4 (P2105, Pioneer Hi-Bred Hellas S.A.). P0937 hybrid belongs to the 500 FAO group with 120–125 days until maturity, it provides well-balanced plants, resistant to the northern leaf blight of maize, suitable especially for environments that traditionally produce good yield results. DKC6050 belongs to the 600 FAO group with 116–123 days until maturity. It produces average height plants with a very strong stem and root system and provides well-balanced plants. It has solid, filled until the top ears with 16-18 rows of kernels. It is considered to have great agronomic characteristics with high yield and good adaptation in many environments and with great quality grains suitable for human consumption. DKC6980 belongs to the 700 FAO group with 130–136 days until maturity. It produces high plants with a very strong stem and root system. It has big ears with 18-20 rows of kernels. It has stable yield even in high temperatures. P2105 is a hybrid that belongs to the 700 FAO group with 135–140 days until maturity, it provides well-balanced plants with a strong root system. It has a fast, lively growth and high dynamic production especially in early cultivated and well-drained fields. These four hybrids were selected because they are considered to have great characteristics in Greece’s environmental variability.
The five locations were Giannouli, in the Prefecture of Larissa, Thessaly; Nea Tyroloi and Kamila, in the Prefecture of Serres, Central Macedonia; Kalamonas, in the Prefecture of Drama, Eastern Macedonia and Thrace and Koutso, in the Prefecture of Xanthi, Eastern Macedonia and Thrace, Greece. Each location–year combination created a different environment; thus 10 environments were used to evaluate the four genotypes.
The environments had different soil texture and variable microclimate conditions (Tables S1 and S2). Planting dates were between 22 and 25 March for the first year and 18 and 26 April for the second year and harvesting dates between 9 and 11 September for the first year and 19 and 21 September for the second year (Table S1). The plant density for all cultivars was 85,000 plants per hectare and the planting depth was 3.5 cm. The field plots (60 m2) consisted of 4 rows with spacing between rows 0.75 m. The measurement of yield was made at a length of 12 m in the 2 middle rows of each plot to avoid the border effect. All five locations are traditionally used for maize production in Greece since they appear to be suitable for this crop.
All field management procedures were standard to ensure the avoidance of deficiencies and the balancing of soil nutrients in all environments. After grain harvesting, the measurement of moisture content was conducted with a portable humidity meter in order to calculate the production per hectare adjusted to 15% humidity. Afterward, grain samples were directed for the determination and measurement of the quality characteristics.
2.2. Soil Sample Analyses
At the soil samples, the elements Ca, Mg, K and Na were determined by atomic absorption spectrometry after extraction using BaCl2 [26]. The measurements of Zn, Mn, Cu and Fe were conducted by atomic absorption spectrometry after extraction using DTPA [27]. The available B was determined using a spectrophotometer, using azomethine-H as the color (yellow) development reagent [28]. Total nitrogen was determined by the Kjeldahl method [29]. Organic carbon was determined with oxidization by K2Cr2O7 [30]. Available phosphorus was determined after extraction with NaHCO3 [31]. Cation exchange capacity was determined according to ISO 11260 [26]. Soil texture was determined using the method of Bouyoucos [32] and the soil taxonomy of USDA (1999). The moisture content was determined in a furnace at 105 °C for 24 h. The value of pH was measured with a pH-meter equipped with a glass electrode in the saturated paste extract.
2.3. Quality Characteristics of Harvested Corn Grains
After their harvest, the corn grains were dried in the shade following the farming practices. The moisture content across all cultivars varied from 10.85 to 16.04% with an average of 12.74%.
The color of the corn grains was measured using Minolta Colorimeter (CR-300, Minolta Company, Chuo-Ku, Osaka, Japan). The lightness or brightness of the samples was indicated by the L value where 0–100 represents darkness to lightness color. The index a indicates the redness or greenness of the corn grains, with a positive a value representing more red color. The index b value represents the degree of the yellow-blue color, with a positive b value illustrating more yellow color.
The texture analysis was carried out by HD-Plus texture analyzer (Stable Micro Systems Ltd., Godalming, UK) and the Texture Expert Exceed Software for the data analysis. The determination of the textural characteristics of corn grains was performed by a puncture probe of 5 mm diameter. Probe speeds of 1 mm/s during the test, 2 mm/s for the pretest and 10 mm/s for the post-test were used throughout the study. All the measurements were performed at 25 ± 1 °C and the hardness of the corn seeds was determined and expressed at N.
The corn grains were grinded by using a grinding mill for the determination of the moisture, the ash, the total protein and the total crude fiber content. Ash and crude fiber content of corn flours were determined according to AOAC Official Method 923.03 and 984.04 (Weende Method), respectively and recorded manually. Total protein content analysis of corn flours was conducted by applying the Kjeldahl method (IDF 2008), using a Kjeldahl rapid distillation unit (Protein Nitrogen Distiller DNP-1500-MP, Raypa Spain).
2.4. Statistical Analysis
A two-way analysis of variance (ANOVA) was used to evaluate the effect of genotype, environments and their GE interaction on the cultivation and quality characteristics of maize hybrids. The experimental data were analyzed using IBM SPSS software ver. 24 (IBM Corp., Armonk, N.Y., USA). The comparisons of means were calculated using the Duncan test at the 5% level of significance (p < 0.05). Multivariate analysis was conducted by means of principal component analysis (PCA) by using STATISTICA 7 (Statsoft Inc., Tulsa, OK, USA). Additive main effects and multiplicative interaction (AMMI) analysis was conducted by using AMMISOFT version 1.0 (Soil and Crop Sciences, Cornell University, Ithaca, NY, USA).
3. Results and Discussion
3.1. Grain Yield
Yield (kg/ha) of maize was statistically significantly influenced by genotype, environment and their interaction (Table S3). Genotype and environment effects on maize yield are presented in Table 1. GEN1 had mean yield that was significantly different in all the tested environments. Its highest yield value was recorded in ENV10 and ENV9 (19,288 ± 289 and 19,087 ± 471 kg/ha respectively) and the lowest in ENV2 (12,805 ± 1361 kg/ha). GEN2 presented similar results; the highest mean yield was recorded in ENV10 and ENV9 (18,244 ± 182 and 18,113 ± 86 kg/ha respectively) but the lowest mean yield in this case was recorded in ENV4 and ENV5 (13,617 ± 370 and 13,657 ± 51 kg/ha respectively). On the other hand, GEN3 presented its highest mean yield in ENV10 where it recorded 20,032 ± 179 kg/ha, and significantly lower results in ENV4 (13,220 ± 569 kg/ha). GEN4 had high yields in ENV6 (20,070 ± 346 kg/ha) and the significant lower value was presented in ENV4 (12,077 ± 166 kg/ha). As for the environments, in ENV4, ENV8 and ENV9, GEN1 presented significant higher mean yields. ENV4 had also a statistically significant performance in GEN2 along with ENV2 and ENV3. Environments ENV1, ENV6 and ENV7 showed significant high performance with GEN4. All the environments presented great results when GEN3 was used except ENV6 and ENV7, which had their lowest performance with this genotype.

Table 1.
Effect of genotype and environments on yield and quality characteristics (protein, fiber, color parameters, texture and ash content) of corn grains.
3.2. Quality Characteristics of Harvested Corn Grains
The performance of genotypes on environments for quality characteristics (color parameters, texture, ash, protein and fiber content) of the harvested corn grains is presented in Table 1. The performance (color parameters) for corn grains varied across different environments. The lightness (L) across all cultivars ranged from 34.28 to 78.23, the yellow index b ranged from 34.47 to 58.90 and the red index a ranged from 3.61 to 8.80. For L, a and b color parameters, there was a significant difference between genotype (p < 0.001), environments (p < 0.001) and for their GE interaction, except for the interaction on the red index. The highest values of L color parameter of corn grains were obtained from the environments ENV2, ENV4, ENV6, ENV8 and ENV10 and the lowest from the environments ENV1, ENV3, ENV5 ENV7 and ENV9. According to the average of the tested environments, the highest values of L, a and b color parameters were achieved from genotype GEN2, and the lowest corresponding values were obtained from the genotypes GEN1 and GEN4 (Table 1).
The texture of the harvested corn grains was influenced by the environmental and genotype effects (p < 0.001) (Table 1). Texture (hardness) of corn grains varied between 12.53 and 26.28 N across the cultivars and environments. The hardness of corn grains at ENV1 (21.38 N), ENV4 (18.75 N), ENV2 (18.64 N), ENV6 (18.63 N), ENV5 (18.33 N) and ENV10 (18.10 N) was relatively higher than the one at ENV3 (13.47 N) and ENV8 (13.38 N). According to the average of the tested environments, the highest values of hardness were achieved from genotypes GEN2 (20.72 N) and GEN1 (20.23 N), and the lowest corresponding values were obtained from the genotypes GEN3 (18.50 N) and GEN4 (17.20 N) (Table 1).
The ash content of corn grains was significantly affected by genotype (p < 0.001), environments (p < 0.001) and their GE interaction (p < 0.001) (Table 1). The ash content across all cultivars ranged from 0.73 to 2.40%. The highest ash content was found in corn grains obtained at the environments of ENV1 (1.51%) and ENV4 (1.50%) and the lowest at ENV8 (1.07%). The ash content of corn grains from GEN2 (1.39%) and GEN4 (1.38%) was significantly higher than the one from GEN1 (1.30%) and GEN3 (1.23%).
The genotype (p < 0.001), the environments (p < 0.001) and their GE interaction (p < 0.001) highly influenced the protein content of corn grains (Table 1). The protein content across all genotypes varied from 6.13 to 8.96%. The highest protein content was found in corn grains obtained at the ENV1 (8.63%). The protein content of corn grains from GEN3 (7.59%) and GEN4 (7.45%) was significantly higher than the ones from the other genotypes. Protein content is a primary quality indicator for corn grains. Mut et al. [33] and Peterson et al. [34] reported that the grain protein content changed from 3 to 4% and 10.0 to 18.0%, respectively within different oat genotypes cultivated in different environments. The protein content was mainly affected by the environment rather than the genotype. This finding is in accordance with other scientific studies [18,35,36]. The protein content of corn grain is illustrated the quality of corn flour and is a desirable trait for the food industry.
The fiber content of corn grains was significantly influenced by genotype (p < 0.01), environments (p < 0.001) and their GE interaction (p < 0.001) (Table 1). The fiber content across all cultivars ranged from 1.37 to 4.08%. The highest fiber content was found in corn grains obtained at the environments of ENV2 (3.65%) and ENV1 (3.54%) while the lowest at ENV7 (2.01%). The fiber content of corn grains from GEN2 (2.97%) and GEN1 (2.85%) was significantly higher than others. It was observed that the effect of environment on the fiber content of corn grains was stronger as compared to the genotype. This finding is in accordance with other scientific studies [18,37].
3.3. Correlation and Evaluation of the Yield, Soil Properties and Quality Characteristics vs. the Genotype and Environment on Maize Cultivation
To investigate the correlation of the yield, soil properties and quality characteristics by using four different genotypes of maize hybrids at ten different environmental conditions, principal components analysis (PCA) was used (Figure 1). Each point on the loading plot represented the contribution of a variable (yield, soil properties: clay, silt, sand, pH, organic matter, total nitrogen, CaCO3, K, Ca, Mg, P, Fe, Cu, Zn, Mn, B and quality characteristics: color, texture, moisture, ash, protein and fiber content) to the score, while each point on the score plot represented a tested sample. The first principal component (PC1) described 41.38% of the variation of extraction experiments, whereas the second principal component (PC2) 25.63% respectively, so that they contributed 67.01% of the total variation of extraction experiments.
Figure 1.
Biplot of principal component analysis of the four different genotypes of maize hybrids at five different environmental conditions. Code of different environments of maize hybrids on different genotypes used on principal components analysis (PCA) is listed as follows: Environments: (1) ENV1, (2) ENV2, (3) ENV3, (4) ENV4, (5) ENV5, (6) ENV6, (7) ENV7 (8) ENV8, (9) ENV9 and (10) ENV10 and Genotypes: (a) GEN1, (b) GEN2, (c) GEN3 and (d) GEN4.
According to the PCA plot, the texture, fiber, protein, clay, Mg, Ca, pH and OM had a negative effect on PC1 and the total nitrogen, silt, CaCO3, Fe and K had a negative effect on PC2, while the sand, P and Zn had a positive effect on PC1 and the Mn, silt and yield had a positive effect on PC2. Furthermore, there are correlations between the Mg and fiber, clay and protein, pH and texture, and between L, B, K, Cu and CaCO3. Based on PCA score plot of the tested samples, four main groups of samples were noted. The groups are (a) 1a, 1b, 1c, 1d, 2a, 2b, 2c, 2d (b) 5a, 5b, 5c, 5d, 6a, 6b, 6c, 6d (c) 10a, 10b, 10c, 10d (d) 3a, 3b, 3c, 3d, 8a, 8b, 8c, 8d and (e) 7a, 7b, 7c, 7d, 9a, 9b, 9c, 9d.
All five testing locations are suitable for maize production in Greece. However, they have different soil conditions and rainfall, influencing the yield and the quality characteristics of corn grains. The samples of group (a) confirmed that ENV1 and ENV2 were the most effective environments for all the tested hybrids, giving corn grains with the highest protein and fiber content. These findings could be attributed to the enhanced soil fertility of ENV1 and ENV2 having the highest concentration of nutrients including Mg, Ca, clay and silt. Many studies demonstrated that the protein content was mostly affected by the environment, indicating its sensitivity to the environment [18,35,36,38] and that the soil nutrient supply affected positively the yield and the quality characteristics of the crop products [39].
The samples of group (b) indicated that ENV5 and ENV6 showed good soil conditions in terms of nutrients resulting in high yields. This finding is in accordance with other studies indicating that any higher nutrient uptake by the plant can result in higher yields [18,40]. The samples of group (c) showed that ENV10 resulted in grains with the maximum hardness concerning their texture essential soil indices such as pH and OM compared with the other environments. Moreover, the samples of group (d) showed that ENV3 and ENV8 had similar characteristics in terms of protein and fiber content growing on a Fe-, P- and N- and sand-rich environment. The samples of group (e) indicated that ENV7 and ENV9 had similar characteristics in terms of yield and quality properties growing on a Zn-rich environment. Concluding, the results depicted by principal components analysis are in agreement with those discussed above.
3.4. GE Interaction for Yield, Protein and Fiber Content
According to the ANOVA, genotypes (GEN), environments (ENV) and their interaction (G×E) gave statistically significant differences (p < 0.001) concerning the yield measurement. Moreover, the highest percentage of variation explained by ENV (68.89%), followed by the G×E (27.15%) effect, while GEN explained (3.95%) of the variation (Table S3).
Figure 2 shows that GEN3 had the highest mean yield, followed by GEN1, GEN4 and GEN2. Among these, GEN4 was the hybrid with the lowest score of the first interaction principal components axis (IPC1). The great score values of IPC1 mean that these genotypes are adapted to certain environments [24]. As for the environments, ENV10 presented the highest mean yield (18,862 kg/ha) with an IPC1 score close to zero, indicating small interactions and ENV4 the lowest yield (13,227 kg/ha). ENV1, ENV6, ENV8 and ENV9 had IPC1 values close to zero and yield higher than the mean value (17,941, 18,839, 17,691 and 18,446 kg/ha respectively).
Figure 2.
Additive main effects and multiplicative interaction (AMMI) biplot presenting mean grain yield (kg/ha) and the first interaction principal components axis (IPC1) of 4 genotypes (red) evaluated in 10 environments (blue).
Based on AMMI1 model, GEN3 and GEN1 resulted in the highest narrow adaptations and these were the best adapted genotypes of the two mega-environments delineated (Table 2). The first one consisted of ENV5, ENV2, ENV6, ENV1, ENV10 and ENV3 in which GEN3 was the best adapted genotype. The other one consisted of ENV8, ENV9, ENV4 and ENV7 with GEN1 presenting better results. Genotypes and environments had been listed according to their IPC1 order (Table 3), resulting that top and bottom performances have the opposite GE pattern [33]. For instance, GEN3 had positive GE with the environments such as ENV5 and ENV2 and a negative GE with environments like ENV7 and ENV4.
Table 2.
AMMI family models for the grain yield, protein content and fiber content dataset, winning genotypes and the numbers of mega-environments.
Table 3.
Ranking of the genotypes and the environments based on their IPC1 scores for grain yield, protein content and fiber content.
The first two principal components in AMMI analysis were significant (p < 0.001), explaining 82.13% of GE (44.49% IPC1 and 37.64% IPC2) of interaction variation (Table S3). According to the biplot of the first (IPC1) and the second (IPC2) interaction principal components (Figure 3), GEN2 had a positive interaction with five out of ten environments (ENV3, ENV4, ENV8, ENV9 and ENV10). Generally, all genotypes were located far from the biplot origin and contribute to the G×E interaction for yield. AMMI analysis is widely used for the evaluation of maize hybrids yield in multienvironment field trials [20,24,25,41,42,43], and grain yield of wheat varieties [22,36,44,45,46], seed yield of oilseed rape [23], nutritional composition of sweet potato [38], yield of sugarcane [47] and yield of chickpea [48].
Figure 3.
AMMI biplot presenting the second interaction principal components axis (IPC2) against the first interaction principal components axis (IPC1) scores for grain yield (kg/ha) of 4 genotypes (red) evaluated in 10 environments (blue).
As for the protein content, according to the ANOVA, genotypes (G), environments (E) and their interaction (GxE) gave statistically significant values (p < 0.001). Moreover, the highest percentage of variation explained by ENV (66.90%) and G×E (29.32%) effects, while G explained the rest of variation (3.79%) (Table S3). Figure 4 shows that all genotypes had protein content percentages close to the mean value, with IPC1 values far from zero. ENV1 was the environment that presented the best results for the protein content (8.63%) of corn grains, while ENV9 presented the lowest one (6.54%). ENV10, ENV8 and ENV9 were the environments that presented the most stable results in terms of protein content.
Figure 4.
AMMI biplot presenting mean protein content and the first interaction principal components axis (IPC1) of 4 genotypes (red) evaluated in 10 environments (blue).
According to AMMI1 model, GEN3 and GEN2 resulted in the highest narrow adaptations delineating two mega-environments (Table 2). The first one consisted of ENV7, ENV3, ENV9, ENV8 and ENV1, in which GEN3 was the best adapted genotype and the other one consisted of ENV10, ENV5, ENV4, ENV2 and ENV6, where GEN2 was the better suited genotype.
The first two principal components in AMMI analysis were significant (p < 0.001), explaining 83.93% of GE (48.61% IPC1 and 35.32% IPC2) of interaction variation (Table S3). According to the biplot of the first (IPC1) and the second (IPC2) interaction principal components (Figure 5), GEN1 had a large positive interaction with ENV4 and ENV2, GEN2 had a large positive interaction with ENV6, while GEN4 and GEN3 had a positive interaction with ENV8 and ENV9 and ENV3 respectively. Likewise the yield, all genotypes are located far from the biplot origin and contribute to the G×E interaction for yield.
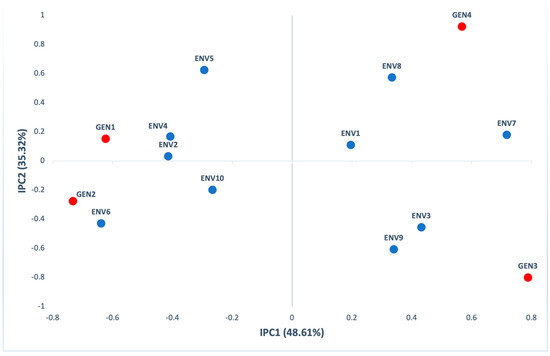
Figure 5.
AMMI biplot presenting the second interaction principal components axis (IPC2) against the first interaction principal components axis (IPC1) scores for protein content of 4 genotypes (red) evaluated in 10 environments (blue).
Regarding fiber content, according to the ANOVA, genotypes (G), environments (E) and their interaction (GxE) gave statistically significant values (p < 0.001). Moreover, the highest percentage of variation explained by ENV (56.43%) and G×E (39.15%) effects, while G explained the rest of variation (4.42%) (Table S3). Figure 6 presents that GEN2 had the highest value, followed by GEN1, GEN3 and GEN4. GEN1 had an IPC1 score close to zero, indicating small interactions. ENV6 scored an IPC1 value near 0, and at the same time had fiber content slightly higher than the mean value. ENV2 was the environment that presented the best results for the fiber content (3.65%) of corn grains, while ENV7 presented the lowest one (2.01%).
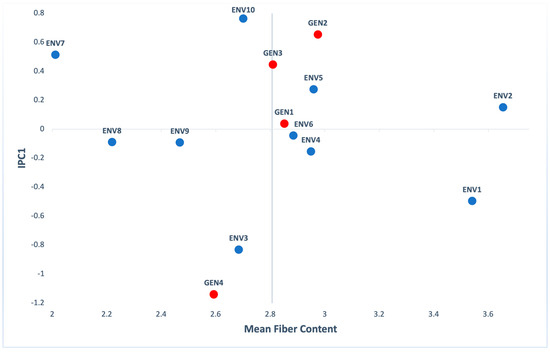
Figure 6.
AMMI biplot presenting mean fiber content and the first interaction principal components axis (IPC1) of 4 genotypes (red) evaluated in 10 environments (blue).
According to AMMI1 model, GEN2 and GEN4 resulted in the highest narrow adaptations defining two mega-environments (Table 2). The first one consisted of ENV10, ENV7, ENV5, ENV2, ENV6, ENV8, ENV9 and ENV4 in which GEN2 was the genotype that presented better results and the other one consisted of ENV1 and ENV3 that had GEN4 as the better suited genotype. The AMMI statistical model has been used to evaluate the effects of genotypes, environments and their interaction for quality characteristics, like iron and zinc concentrations in the grain of maize [49], protein and tryptophan in maize [50], nutritional composition (protein, β-carotene, iron, zinc, starch and sucrose) in sweet potato [38] and vitreousness, SDS sedimentation test, yellow pigment index, protein content and test weight in durum wheat [46].
The first two principal components in AMMI analysis were significant (p < 0.001), explaining 90.79% of GxE (55.20% IPC1 and 35.59% IPC2) of interaction variation (Table S3). According to the biplot of the first (IPC1) and the second (IPC2) interaction principal components (Figure 7), GEN2 had a large positive interaction with ENV7, GEN4 had a large positive interaction with ENV3, while GEN3 had a positive interaction with ENV10.
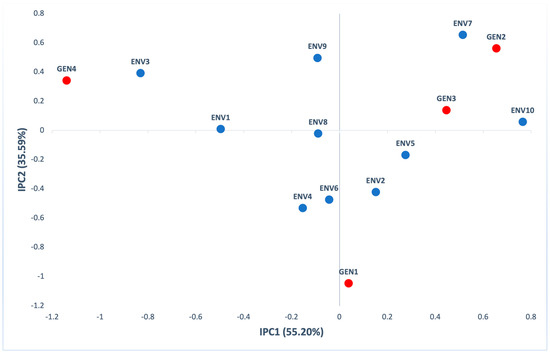
Figure 7.
AMMI biplot presenting the second interaction principal components axis (IPC2) against the first interaction principal components axis (IPC1) scores for fiber content of 4 genotypes (red) evaluated in 10 environments (blue).
4. Conclusions
The evaluation of yield results of different genotypes, under different environmental conditions is a complicated issue, as a lot of parameters have to be considered, in order to lead to reliable results. In such experiments, often the AMMI analysis was used, which provides valuable information that contributes to the understanding of the G×E interaction. In this study, the GEN effect explained a low percentage of the variation and could not lead to the selection of a stable genotype for all environments. However, the results of the AMMI analysis contributed to dividing the region into mega-environments and introduce the most suitable genotype for every environment.
Concerning the yield, based on the AMMI1 model, GEN3 and GEN1 resulted in the highest narrow adaptations and these were the best adapted genotypes of the two mega-environments delineated (the first consisted of ENV5, ENV2, ENV6, ENV1, ENV10 and ENV3 and the second consisted of ENV8, ENV9, ENV4 and ENV7, respectively). A group of five environments (ENV1, ENV8, ENV6 ENV10 and ENV9) gave higher yields than the mean value and at the same time had low IPC1 scores, which indicated that they gave high yield with all the genotypes used. Regarding the grain quality, GEN3 and GEN2 for the protein content and GEN2 and GEN4 for the fiber content resulted in the highest narrow adaptations delineating two mega-environments. Specifically for the protein, the results of the analysis indicated that in order to obtain higher protein content, certain genotypes should be used in certain environments. It is important to note that ENV1 and ENV2 (location Giannouli for years 2019 and 2020 respectively, gave the highest values concerning protein and fiber content. These findings could be attributed to the high concentration rates of nutrients like Mg, Ca and the soil texture (C).
The results of this study suggest that the target to increase the quantity and quality of grain yield of maize hybrids is a very challenging issue, due to the high G×E interaction, which can be implemented by exploiting positive GE interactions, by dividing the environment into mega-environments.
Supplementary Materials
The following are available online at https://www.mdpi.com/2073-4395/11/2/357/s1, Table S1. Coordinates, altitude, soil texture and cultivation information for the ten environments. Table S2. Climatic conditions of the 10 examined environments during the cultivation period (March-September). Table S3. AMMI analysis of variance for grain yield, protein content and fiber content of 4 genotypes evaluated in 10 environments.
Author Contributions
Conceptualization, N.K. and A.E.; Methodology, N.K., P.S., S.C., M.G., D.L., M.V.C., G.K. and A.E.; Software, N.K., P.S., S.C. and M.G.; Validation, D.L., G.K. and A.E.; Formal Analysis, N.K., P.S. and S.C.; Investigation, N.K., S.C., M.G., D.L. and M.V.C.; Resources, N.K., P.S., S.C., M.G., D.L. and M.V.C.; Writing—Original Draft Preparation, N.K., P.S., S.C. and M.G.; Writing—Review and Editing, N.K., P.S., S.C., M.G., D.L., M.V.C., G.K. and A.E.; Supervision, A.E.; Project Administration, N.K., D.L. and G.K. All authors have read and agreed to the published version of the manuscript.
Funding
This research received no external funding.
Data Availability Statement
The data presented in this study are available on request from the corresponding author.
Conflicts of Interest
The authors declare no conflict of interests.
References
- Duvick, D.N. The Contribution of Breeding to Yield Advances in maize (Zea mays L.). Adv. Agron. 2005, 86, 83–145. [Google Scholar] [CrossRef]
- Bruulsema, T.W.; Tollenaar, M.; Heckman, J.R. Boosting crop yields in the next century. Better Crops 2000, 84, 9–13. [Google Scholar]
- Frei, O.M. Changes in yield physiology of corn as a result of breeding in northern Europe. Maydica 2000, 45, 173–183. [Google Scholar]
- Rosegrant, M.W.; Cai, X.; Cline, S.A. Global Water Outlook to 2025: Averting an Impending Crisis; International Food Policy Research Institute and International Water Management Institute: Washington, DC, USA; Colombo, Sri Lanka, 2002. [Google Scholar]
- Tardieu, F. Plant response to environmental conditions: Assessing potential production, water demand, and negative effects of water deficit. Front. Physiol. 2013, 4, 17. [Google Scholar] [CrossRef] [PubMed]
- McMichael, B.; Quisenberry, J. The impact of the soil environment on the growth of root systems. Environ. Exp. Bot. 1993, 33, 53–61. [Google Scholar] [CrossRef]
- Pardo, A.; Amato, M.; Chiarandà, F.Q. Relationships between soil structure, root distribution and water uptake of chickpea (Cicer arietinum L.). Plant growth and water distribution. Eur. J. Agron. 2000, 13, 39–45. [Google Scholar] [CrossRef]
- Kang, M.S. Using Genotype-by-Environment Interaction for Crop Cultivar Development. Adv. Agron. 1997, 62, 199–252. [Google Scholar] [CrossRef]
- Kang, M.S. Breeding: Genotype-by-environment interaction. In Encyclopedia of Plant and Crop Science; Goodman, R.M., Ed.; Marcel-Dekker: New York, NY, USA, 2004; pp. 218–221. [Google Scholar]
- Kang, M.S. Genotype-environment interaction: Progress and prospects. In Quantitative Genetics, Genomics, and Plant Breeding; Kang, M.S., Ed.; CABI Publ.: Wallingford, DC, USA; Oxon, UK,, 2002; pp. 221–243. [Google Scholar]
- Annicchiarico, P. Genotype × Environment Interaction—Challenges and Opportunities for Plant Breeding and Cultivar Recommendations; FAO Plant Production and Protection Papers: Rome, Italy, 2002. [Google Scholar]
- Fan, X.-M.; Kang, M.S.; Chen, H.; Zhang, Y.; Tan, J.; Xu, C. Yield Stability of Maize Hybrids Evaluated in Multi-Environment Trials in Yunnan, China. Agron. J. 2007, 99, 220–228. [Google Scholar] [CrossRef]
- Flores, F.; Moreno, M.; Cubero, J. A comparison of univariate and multivariate methods to analyze G×E interaction. Field Crop. Res. 1998, 56, 271–286. [Google Scholar] [CrossRef]
- Baker, R.J. Tests for Crossover Genotype-Environmental Interactions. Can. J. Plant Sci. 1988, 68, 405–410. [Google Scholar] [CrossRef]
- Kang, M.S.; Balzarini, M.G.; Guerra, J.L.L. Genotype-by-environment interaction. In Genetic Analysis of Complex Traits Using SAS; Saxton, A.M., Ed.; SAS Publ., SAS Inst.: Cary, NC, USA, 2004; pp. 69–96. [Google Scholar]
- Lu’Quez, J.E.; Aguirrezabal, L.A.N.; Aguero, M.E.; Pereyra, V.R. Stability and Adaptability of Cultivars in Non-balanced Yield Trials. Comparison of Methods for Selecting ’High Oleic’ Sunflower hybrids for Grain Yield and Quality. J. Agron. Crop. Sci. 2002, 188, 225–234. [Google Scholar] [CrossRef]
- Signor, C.-L.; Dousse, S.; Lorgeou, J.; Denis, J.-B.; Bonhomme, R.; Carolo, P.; Charcosset, A. Interpretation of Genotype × Environment Interactions for Early Maize Hybrids over 12 Years. Crop. Sci. 2001, 41, 663–669. [Google Scholar] [CrossRef]
- Nehe, A.; Akin, B.; Sanal, T.; Evlice, A.K.; Ünsal, R.; Dinçer, N.; Demir, L.; Geren, H.; Sevim, I.; Orhan, Ş.; et al. Genotype x environment interaction and genetic gain for grain yield and grain quality traits in Turkish spring wheat released between 1964 and 2010. PLoS ONE 2019, 14, e0219432. [Google Scholar] [CrossRef]
- Gauch, H.G. A Simple Protocol for AMMI Analysis of Yield Trials. Crop. Sci. 2013, 53, 1860–1869. [Google Scholar] [CrossRef]
- Mitrović, B.; Stanisavljevi, D.; Treski, S.; Stojaković, M.; Ivanović, M.; Bekavac, G.; Rajković, M. Evaluation of experimental maize hybrids tested in multi-location trials using ammi and gge biplot analyses. Turk. J. Field Crops 2012, 17, 35–40. [Google Scholar]
- Kaya, Y.; Palta, C.; Taner, S. Additive Main Effects and Multiplicative Interactions Analysis of Yield Performances in Bread Wheat Genotypes across Environments. Turk. J. Agric. For. 2002, 26, 275–279. [Google Scholar]
- Li, W.; Yan, Z.-H.; Wei, Y.-M.; Lan, X.-J.; Zheng, Y.-L. Evaluation of Genotype x Environment Interactions in Chinese Spring Wheat by the AMMI Model, Correlation and Path Analysis. J. Agron. Crop. Sci. 2006, 192, 221–227. [Google Scholar] [CrossRef]
- Agahi, K.; Ahmadi, J.; Oghan, H.A.; Fotokian, M.H.; Orang, S.F. Analysis of genotype × environment interaction for seed yield in spring oilseed rape using the AMMI model. Crop. Breed. Appl. Biotechnol. 2020, 20, 26502012. [Google Scholar] [CrossRef]
- Mafouasson, H.N.A.; Gracen, V.; Yeboah, M.A.; Ntsomboh-Ntsefong, G.; Tandzi, L.N.; Mutengwa, C.S. Genotype-by-Environment Interaction and Yield Stability of Maize Single Cross Hybrids Developed from Tropical Inbred Lines. Agronomy 2018, 8, 62. [Google Scholar] [CrossRef]
- Hongyu, K.; García-Peña, M.; De Araújo, L.B.; Dias, C.T.D.S. Statistical analysis of yield trials by AMMI analysis of genotype × environment interaction. Biom. Lett. 2014, 51, 89–102. [Google Scholar] [CrossRef]
- International Standard Organisation (ISO). ISO 11260:1994. Soil Quality—Determination of Effective Cation Exchange Capacity and Base Saturation Level Using Barium Chloride Solution; ISO: Geneva, Switzerland, 1994. [Google Scholar]
- International Standard Organisation (ISO). ISO 14870:2001. Soil Quality—Extraction of Trace Elements by Buffered DTPA Solution; ISO: Geneva, Switzerland, 2001. [Google Scholar]
- Bingham, F.T. Boron. In Methods of Soil Analysis, Part 2. Chemical and Microbiological Properties, 2nd ed.; Agronomy Monograph No. 9; Page, A.L., Miller, R.H., Keeney, D.R., Eds.; SSSA: Madison, WI, USA, 1982; pp. 431–447. [Google Scholar]
- International Standard Organisation (ISO). ISO 11261:1995. Soil Quality—Determination of Total Nitrogen—Modified Kjeldahl Method; ISO: Geneva, Switzerland, 1995. [Google Scholar]
- International Standard Organisation (ISO). ISO 14235:1998. Soil Quality—Determination of Organic Carbon by sulfochromic Oxidation; ISO: Geneva, Switzerland, 1998. [Google Scholar]
- International Standard Organisation (ISO). ISO 11263:1994. Soil Quality—Determination of Phosphorus—Spectrometric Determination of Phosphorus Soluble in Sodium Hydrogen Carbonate Solution; ISO: Geneva, Switzerland, 1994. [Google Scholar]
- Bouyoucos, G.J. Hydrometer method improved for making particle and size analysis of soils. Agron. J. 1962, 54, 464–465. [Google Scholar] [CrossRef]
- Mult, Z.; Akay, H.; Köse Özge, D.E. Grain yield, quality traits and grain yield stability of local oat cultivars. J. Soil Sci. Plant Nutr. 2018, 18, 269–281. [Google Scholar] [CrossRef]
- Peterson, D.M.; Wesenberg, D.M.; Burrup, D.E.; Erickson, C.A. Relationships among Agronomic Traits and Grain Composition in Oat Genotypes Grown in Different Environments. Crop. Sci. 2005, 45, 1249–1255. [Google Scholar] [CrossRef]
- Williams, R.M.; O’Brien, L.; Eagles, H.A.; Solah, V.; Jayasena, V. The influences of genotype, environment, and genotype × environment interaction on wheat quality. Aust. J. Agric. Res. 2008, 59, 95–111. [Google Scholar] [CrossRef]
- Kaya, Y.; Ii, I.; Akcura, M. Effects of genotype and environment on grain yield and quality traits in bread wheat (T. aestivum L.). Food Sci. Technol. 2014, 34, 386–393. [Google Scholar] [CrossRef]
- Doehlert, D.C.; McMullen, M.S.; Hammond, J.J. Genotypic and Environmental Effects on Grain Yield and Quality of Oat Grown in North Dakota. Crop. Sci. 2001, 41, 1066–1072. [Google Scholar] [CrossRef]
- Gurmu, F.; Shimelis, H.; Laing, M.; Mashilo, J. Genotype-by-environment interaction analysis of nutritional composition in newly-developed sweetpotato clones. J. Food Compos. Anal. 2020, 88, 103426. [Google Scholar] [CrossRef]
- Juhos, K.; Szabó, S.; Ladányi, M. Explore the influence of soil quality on crop yield using statistically-derived pedological indicators. Ecol. Indic. 2016, 63, 366–373. [Google Scholar] [CrossRef]
- Nehe, A.; Misra, S.; Murchie, E.; Chinnathambi, K.; Foulkes, M. Genetic variation in N-use efficiency and associated traits in Indian wheat cultivars. Field Crop. Res. 2018, 225, 152–162. [Google Scholar] [CrossRef]
- Mohammed, A. Genotype by environment interaction and yield stability analysis of open pollinated maize varieties using AMMI model in Afar Regional State, Ethiopia. J. Plant Breed. Crop. Sci. 2020, 12, 8–15. [Google Scholar] [CrossRef]
- Júnior, L.A.Y.B.; Da Silva, C.P.; De Oliveira, L.A.; Nuvunga, J.J.; Pires, L.P.M.; Von Pinho, R.G.; Balestre, M. AMMI Bayesian Models to Study Stability and Adaptability in Maize. Agron. J. 2018, 110, 1765–1776. [Google Scholar] [CrossRef]
- De Oliveira, R.L.; Von Pinho, R.G.; Ferreira, D.F.; Pires, L.P.M.; Melo, W.M.C. Selection Index in the Study of Adaptability and Stability in Maize. Sci. World J. 2014, 2014, 1–6. [Google Scholar] [CrossRef] [PubMed]
- Tarakanovas, P.; Ruzgas, V. Additive main effect and multiplicative interaction analysis of grain yield of wheat varieties in Lithuania. Agron. Res. 2006, 4, 91–98. [Google Scholar]
- Brancourt-Hulmel, M.; Lecomte, C. Effect of Environmental Variates on Genotype × Environment Interaction of Winter Wheat. Crop. Sci. 2003, 43, 608–617. [Google Scholar] [CrossRef]
- Taghouti, M.; Gaboun, F.; Nsarellah, N.; Rhrib, R.; El-Haila, M.; Kamar, M.; Abbad-Andaloussi, F.; Udupa, S.M. Genotype x environment interaction for quality traits in durum wheat cultivars adapted to different environments. Afr. J. Biotechnol. 2010, 9, 3054–3062. [Google Scholar] [CrossRef]
- Ramburan, S.; Zhou, M.; Labuschagne, M. Interpretation of genotype × environment interactions of sugarcane: Identifying significant environmental factors. Field Crops Res. 2011, 124, 392–399. [Google Scholar] [CrossRef]
- Farshadfar, E.; Sabaghpour, S.H.; Zali, H. Comparison of parametric and non-parametric stability statistics for selecting stable chickpea (Cicer arietinum L.) genotypes under diverse environments. AJCS 2012, 6, 514–524. [Google Scholar]
- Oikeh, S.O.; Menkir, A.; Maziya-Dixon, B.; Welch, R.M.; Glahn, R.P.; Gauch, G. Environmental stability of iron and zinc concentrations in grain of elite early-maturing tropical maize genotypes grown under field conditions. J. Agric. Sci. 2004, 142, 543–551. [Google Scholar] [CrossRef]
- Pixley, K.V.; Bjarnason, M.S. Stability of Grain Yield, Endosperm Modification, and Protein Quality of Hybrid and Open-Pollinated Quality Protein Maize (QPM) Cultivars. Crop. Sci. 2002, 42, 1882–1890. [Google Scholar] [CrossRef]
Publisher’s Note: MDPI stays neutral with regard to jurisdictional claims in published maps and institutional affiliations. |
© 2021 by the authors. Licensee MDPI, Basel, Switzerland. This article is an open access article distributed under the terms and conditions of the Creative Commons Attribution (CC BY) license (http://creativecommons.org/licenses/by/4.0/).