Article

Influence of Physicochemical Characteristics of Bean Crop Soil in Trichoderma spp. Development

by
Sara Mayo-Prieto
1,*,
Alejandra J. Porteous-Álvarez
1,
Sergio Mezquita-García
2,
Álvaro Rodríguez-González
1,
Guzmán Carro-Huerga
1,
Sara del Ser-Herrero
1,
Santiago Gutiérrez
3 and
Pedro A. Casquero
1
1
Grupo Universitario de Investigación en Ingeniería y Agricultura Sostenible (GUIIAS), Instituto de Medio Ambiente, Recursos Naturales y Biodiversidad, Universidad de León, Avenida Portugal 41, 24071 León, Spain
2
Department of Clinical Microbiology and Infectious Diseases, Hospital General Universitario Gregorio Marañón, Universidad Complutense de Madrid, 28007 Madrid, Spain
3
Grupo Universitario de Investigación en Ingeniería y Agricultura Sostenible (GUIIAS), Área de Microbiología, Escuela de Ingeniería Agraria y Forestal, Universidad de León, Campus de Ponferrada, Avenida Astorga s/n, 24400 Ponferrada, Spain
*
Author to whom correspondence should be addressed.
Agronomy 2021, 11(2), 274; https://doi.org/10.3390/agronomy11020274
Submission received: 26 November 2020 / Revised: 26 January 2021 / Accepted: 28 January 2021 / Published: 1 February 2021
(This article belongs to the Special Issue Using Biological Control Agents in Crop Protection)

Abstract

:
Spain has ranked 6th on the harvested bean area and 8th in bean production in the European Union (EU). The soils of this area have mixed silt loam and sandy loam texture, with moderate clay content, neutral or acidic pH, rich in organic matter and low carbonate levels, providing beans with high water absorption capacity and better organoleptic qualities after cooking. Similar to other crops, it is attacked by some phytopathogens. Hitherto, chemical methods have been used to control these organisms. However, with the Reform of the Community Agrarian Policy in the EU, the number of authorized plant protection products has been reduced to prevail food security, as well as to be sustainable in the long term, giving priority to the non-chemical methods that use biological agents, such as Trichoderma. This study aimed to investigate the relative importance of various crop soil parameters in the adaptation of Trichoderma spp. autoclaved soils (AS) and natural soils (NS) from the Protected Geographical Indication (PGI) “Alubia La Bañeza—León” that were inoculated with Trichoderma velutinum T029 and T. harzianum T059 and incubated in a culture chamber at 25 °C for 15 days. Their development was determined by quantitative PCR. Twelve soil samples were selected and analyzed from the productive zones of Astorga, La Bañeza, La Cabrera, Esla-Campos and Páramo. Their physicochemical characteristics were different by zone, as the texture of soils ranged between sandy loam and silt loam and the pH between strongly acid and slightly alkaline, as well as the organic matter (OM) concentration between low and remarkably high. Total C and N concentrations and their ratio were between medium and high in most of the soils and the rest of the micronutrients had an acceptable concentration except for Paramo’s soil. Both Trichoderma species developed better in AS than in NS, T. velutinum T029 grew better with high levels of OM, total C, ratio C:N, P, K, Fe, and Zn than T. harzianum T059 in clay soils, with the highest values of cation exchange capacity (CEC), pH, Ca, Mg and Mn. These effects were validated by Canonical Correlation Analysis (CCA), texture, particularly clay concentration, OM, electrical conductivity (EC), and pH (physical parameters) and B and Cu (soil elements) are the main factors explaining the influence in the Trichoderma development. OM, EC, C:N ratio and Cu are the main soil characteristics that influence in T. velutinum T029 development and pH in the development of T. harzianum T059.

1. Introduction

The common bean (Phaseolus vulgaris L.) is one of the most important legumes crops worldwide together with the soybean (Glycine max (L.) Merr.) and peanut (Arachis hypogea L.). On a global scale the harvested area of beans was 34,495,662 ha in 2018 with a production of 30,434,280 tonnes, with the biggest producers being India, Brazil and Myanmar. In the European Union (EU), 206,076 ha and 401,609 tonnes were produced in the same year, and Spain ranked 6th on the harvested area (4.5% of the EU) and 8th in production (4.3% of the EU) behind countries such as Lithuania, Latvia or Poland [1]. Focusing on Spain, León, located in the northwest, is the main common bean producer with almost 52% of the harvested area and over 57% of the national production in 2018 [2]. The socioeconomic peculiarities of this production area have made possible the maintenance of the high quality of the common bean, which are the use of traditional varieties (“Canela, Riñón, Pinta, Plancheta”), grown in smallholding (between 1 ha and 10 ha) by the own supplying and sale in local and national markets [3]. It is for these characteristics that there is a Protected Geographical Indication (PGI), called “Alubia La Bañeza-León”, (EC Reg. n. 256/2010 published on 26 March 2010, OJEU L880/17) sheltering the high quality of this product. The productive area of this PGI comprises the zones of the “Astorga”, “El Páramo”, “Esla-Campos”, “La Bañeza”, “La Cabrera”, and “Tierras de León” as well as the region of “Benavente-Los Valles” in the province of Zamora, adjacent to the previous one. The soils of this area have between silt loam and sandy loam texture, with moderate clay content, neutral or acidic pH, rich in organic matter and low carbonate levels. Together, these soils provide beans with high water absorption capacity and better organoleptic qualities after cooking.
P. vulgaris is affected by phytopathogens like other crops. For fungal control, fungicides applied on the seed or directly to the soil can be efficient during germination or in a subsequent short period, but occasionally root rot or yellowing and wilting are not efficiently controlled [4,5,6,7]. With the Reform of the European Community Agrarian Policy (CAP), the number of authorized plant protection products has been cut down to prevail food security, as well as to be sustainable in the long term, giving priority to the non-chemical methods. Soils are physically, chemically, and biologically heterogeneous, and any variation in these characteristics might affect the development of any biocontrol agent (BCA). BCAs have different ability of growth, adaptation, or plant protection, depending on the environmental peculiarities. Nevertheless, some abiotic soil factors, such as pH, mineral fertilizers, organic matter, can modify these processes. There are some studies indicating that the composition of the environment influences microbial community composition [8,9,10,11].
The improvement of the conditions for bean establishment in the field has been investigated to get a better control of phytopathogenic fungi. For example, by developing and evaluating new sowing techniques combined with the use of pesticides for optimizing the emergence of seeds [7,12,13]. Another strategy has been the use of BCAs, reducing the dependence on synthetic chemical products. Some of the BCAs most commonly used are bacteria such as Agrobacterium, Pseudomonas, Streptomyces, or Bacillus and fungi like Gliocladium, Trichoderma, Ampelomyces, Candida, and Coniothyrium. Trichoderma spp. (Teleomorph: Hypocrea) is often used as a BCA for plant disease control. It exhibits a fast growth, and it is an opportunistic and non-virulent symbiont [14]. It is able to colonize the root surface, causing substantial changes in plant metabolism [15]. Furthermore, it attacks fungal phytopathogens by competing for nutrients and establishing a mycoparasitic relationship [16]. Trichoderma also induces the expression of genes involved in plant defence response, and besides, it promotes plant development and nutrient uptake [14,17,18,19,20,21,22,23].
Nevertheless, the development of biocontrol strategies requires the availability of accurate analytical tools for monitoring fungal growth in different substrates or culture soils. Real-time quantitative PCR (qPCR) is a standard method for the detection and quantification of fungal populations such as Trichoderma spp. [24,25] and Gliocladium spp. [26], but also of some soilborne pathogens such as Rhizoctonia spp. [27], Fusarium spp. [28,29], or Pythium spp. [30].
This study aims to investigate the influence of soil physicochemical characteristics in Trichoderma strains development. Thus, a protocol to select Trichoderma strains depending on the soil characteristics is going to be described.

2. Materials and Methods

2.1. Trichoderma Isolates Used in this Study

Trichoderma velutinum T029 and T. harzianum T059 were collected from the production area of the PGI “Alubia La Bañeza—León”, T029 was isolated from a productive area of Astorga (Otero de Escarpizo) and T059 of Páramo (La Milla del Páramo) [31]. They were selected based on their capacity as a BCAs against phytopathogens and their positive effect on bean crops. They were stored in the collection of the Research Group of Engineering and Sustainable Agriculture (GUIIAS) from the University of León (León, Spain). Both isolates were inoculated on Petri dishes with potato-dextrose-agar (PDA, Sigma Aldrich, Germany) medium and grown at 25 °C in the dark for one week.

2.2. Standard Curve of Each Isolated

Fungal genomic DNA isolation was carried out as previously described by Cardoza et al. [32].
A standard curve was obtained with 320, 160, 80, 40, 20, and 10 ng DNA of every Trichoderma isolate, following the described previously procedure [18]. Each measurement was conducted in triplicate. Step One Plus™ (Applied Biosystems, California, USA) and α-actin as the reference gene for all analyses were used for the qPCR reactions according to the procedure described by Mayo-Prieto et al. [24].

2.3. Soil Sampling

Soil samples were collected per plot from horizon A (10cm depth), using an unaligned sampling design within a defined area from PGI area where the bean crop was a part of the crop rotation strategy, according to a previous study [33]. The number of samples collected in each production area was proportional to the area dedicated to the bean production (Table 1).

2.4. Physicochemical Analysis of Soils

The physicochemical analysis was carried out in the Laboratory of Instrumental Techniques of the University of León (León, Spain), according to the official methods of the Spanish Ministry of Agriculture [34].
Previously, a portion of the soils was ground with a ball mill, obtaining a smaller particle size for the determinations of carbon, nitrogen, carbonates, and organic matter.
For the determination of the textural class, it was used the Bouyoucos densimeter method and graphically represented by the triangle of the United States Department of Agriculture (USDA). Regarding pH, it was measured in a soil:water suspension in a 1:2.5 ratio and subsequently read by the potentiometric method, using a pH meter. For electrical conductivity (EC), a soil:water suspension in a 1:5 ratio was read by the conductometric method, using a conductivity meter. In the case of carbonate concentration, it was determined by Bernard’s calcimeter. Organic matter (OM) concentration was determinaed by following the Walkley-Black method. For total nitrogen (N) and total carbon (C) concentrations were obtained by the Dumas method with an elemental analyzer EURO EA 3000. The Olsen method was used for the determination of assimilable phosphorus (P) by extraction with a 0.5 M NaHCO3 pH 8.5 solution and reading by molecular spectrometry using a UV/VIS spectrophotometer.
Regarding the cations, as potassium (K), calcium (Ca), magnesium (Mg), and sodium (Na) were extracted by AcONH4 1N pH 7 solution and read by Inductively Coupled Plasma Optical Emission Spectrometry (ICP-OES). The cation exchange capacity (CEC) was determined using a 0.1M barium chloride solution and read by ICP-OES. As for the trace elements as iron (Fe), manganese (Mn), zinc (Zn), and copper (Cu), they were extracted with a diethylene triamine pentaacetic acid (DTPA) pH 7.3 solution and read by ICP-OES. Finally, boron (B) extraction was carried out using hot water and ICP-OES.

2.5. Soil Inoculation

Soil samples were divided into autoclaved soil (AS) and natural soil (NS). The AS was autoclaved at 121 °C 20 min eliminating any present microorganism. The NS went through no sterilization process.
Soil was weighed (5 g) and placed in a Petri dish of 60 mm in diameter. 5 mL of autoclaved distilled water (121 °C 20 min) were added to each one. 1 mL of a solution of 2 × 10⁷ spores·mL−1 of each Trichoderma isolate to each Petri dish. Plates were left about 2 h in a laminar flow hood to get the tilth humidity. Petri dishes were sealed with Parafilm® and incubated in a culture chamber at 25 °C for 15 days in the dark. Three repetitions of each treatment were performed. After this period, they were stored at −80 °C until processed.

2.6. DNA Extraction of Soil Samples and Real Time-PCR (qPCR) Analysis

DNA extractions and qPCR reactions were carried out following the procedure described by Mayo-Prieto et al. [24]. 250 mg of each soil was used for total DNA extraction. FavorPrep Soil DNA Isolation Kit (Favorgen Biotech Corporation, Ping-Tung, Taiwan) was used following the manufacturer’s instructions. A DNA extraction was performed by repetition.

2.7. Statistical Analysis

Means and error of the recorded data were calculated to evaluate the development of each Trichoderma spp. in different soils. The data were transformed by the formula (x + 0.5)1/2 [35].
The fungal growth in AS and NS was analyzed by Levene’s test and compared by analysis of variance (three-way ANOVA for a completely randomized design including main effects of Trichoderma isolates with two levels, T029 and T059, soil treatment with two levels AS and NS, and localizations from A1 to P5) and post hoc analysis of Tukey’s test was done for each Trichoderma isolates and soil treatment.
The effects of soil parameters on comparison to Trichoderma concentration in both soils were determined by Canonical Correspondence Analyses (CCAs) with the R package CCA software [36]. Dataset of physicochemical components was divided in two dataset (soil parameters and nutrients) and compared to Trichoderma data in two CCAs. All data were normalized and standardized prior CCA in order to ensure the multivariate normal distribution. A low standard deviation was achieved and it is not necessary to use standardized coefficients for correlation matrix. Values of raw canonical coefficients were compared and Wilks’ Lambda, using F-approximation was used for statistical analysis of dimensions. Data of correlation were represented in a biplot.

3. Results

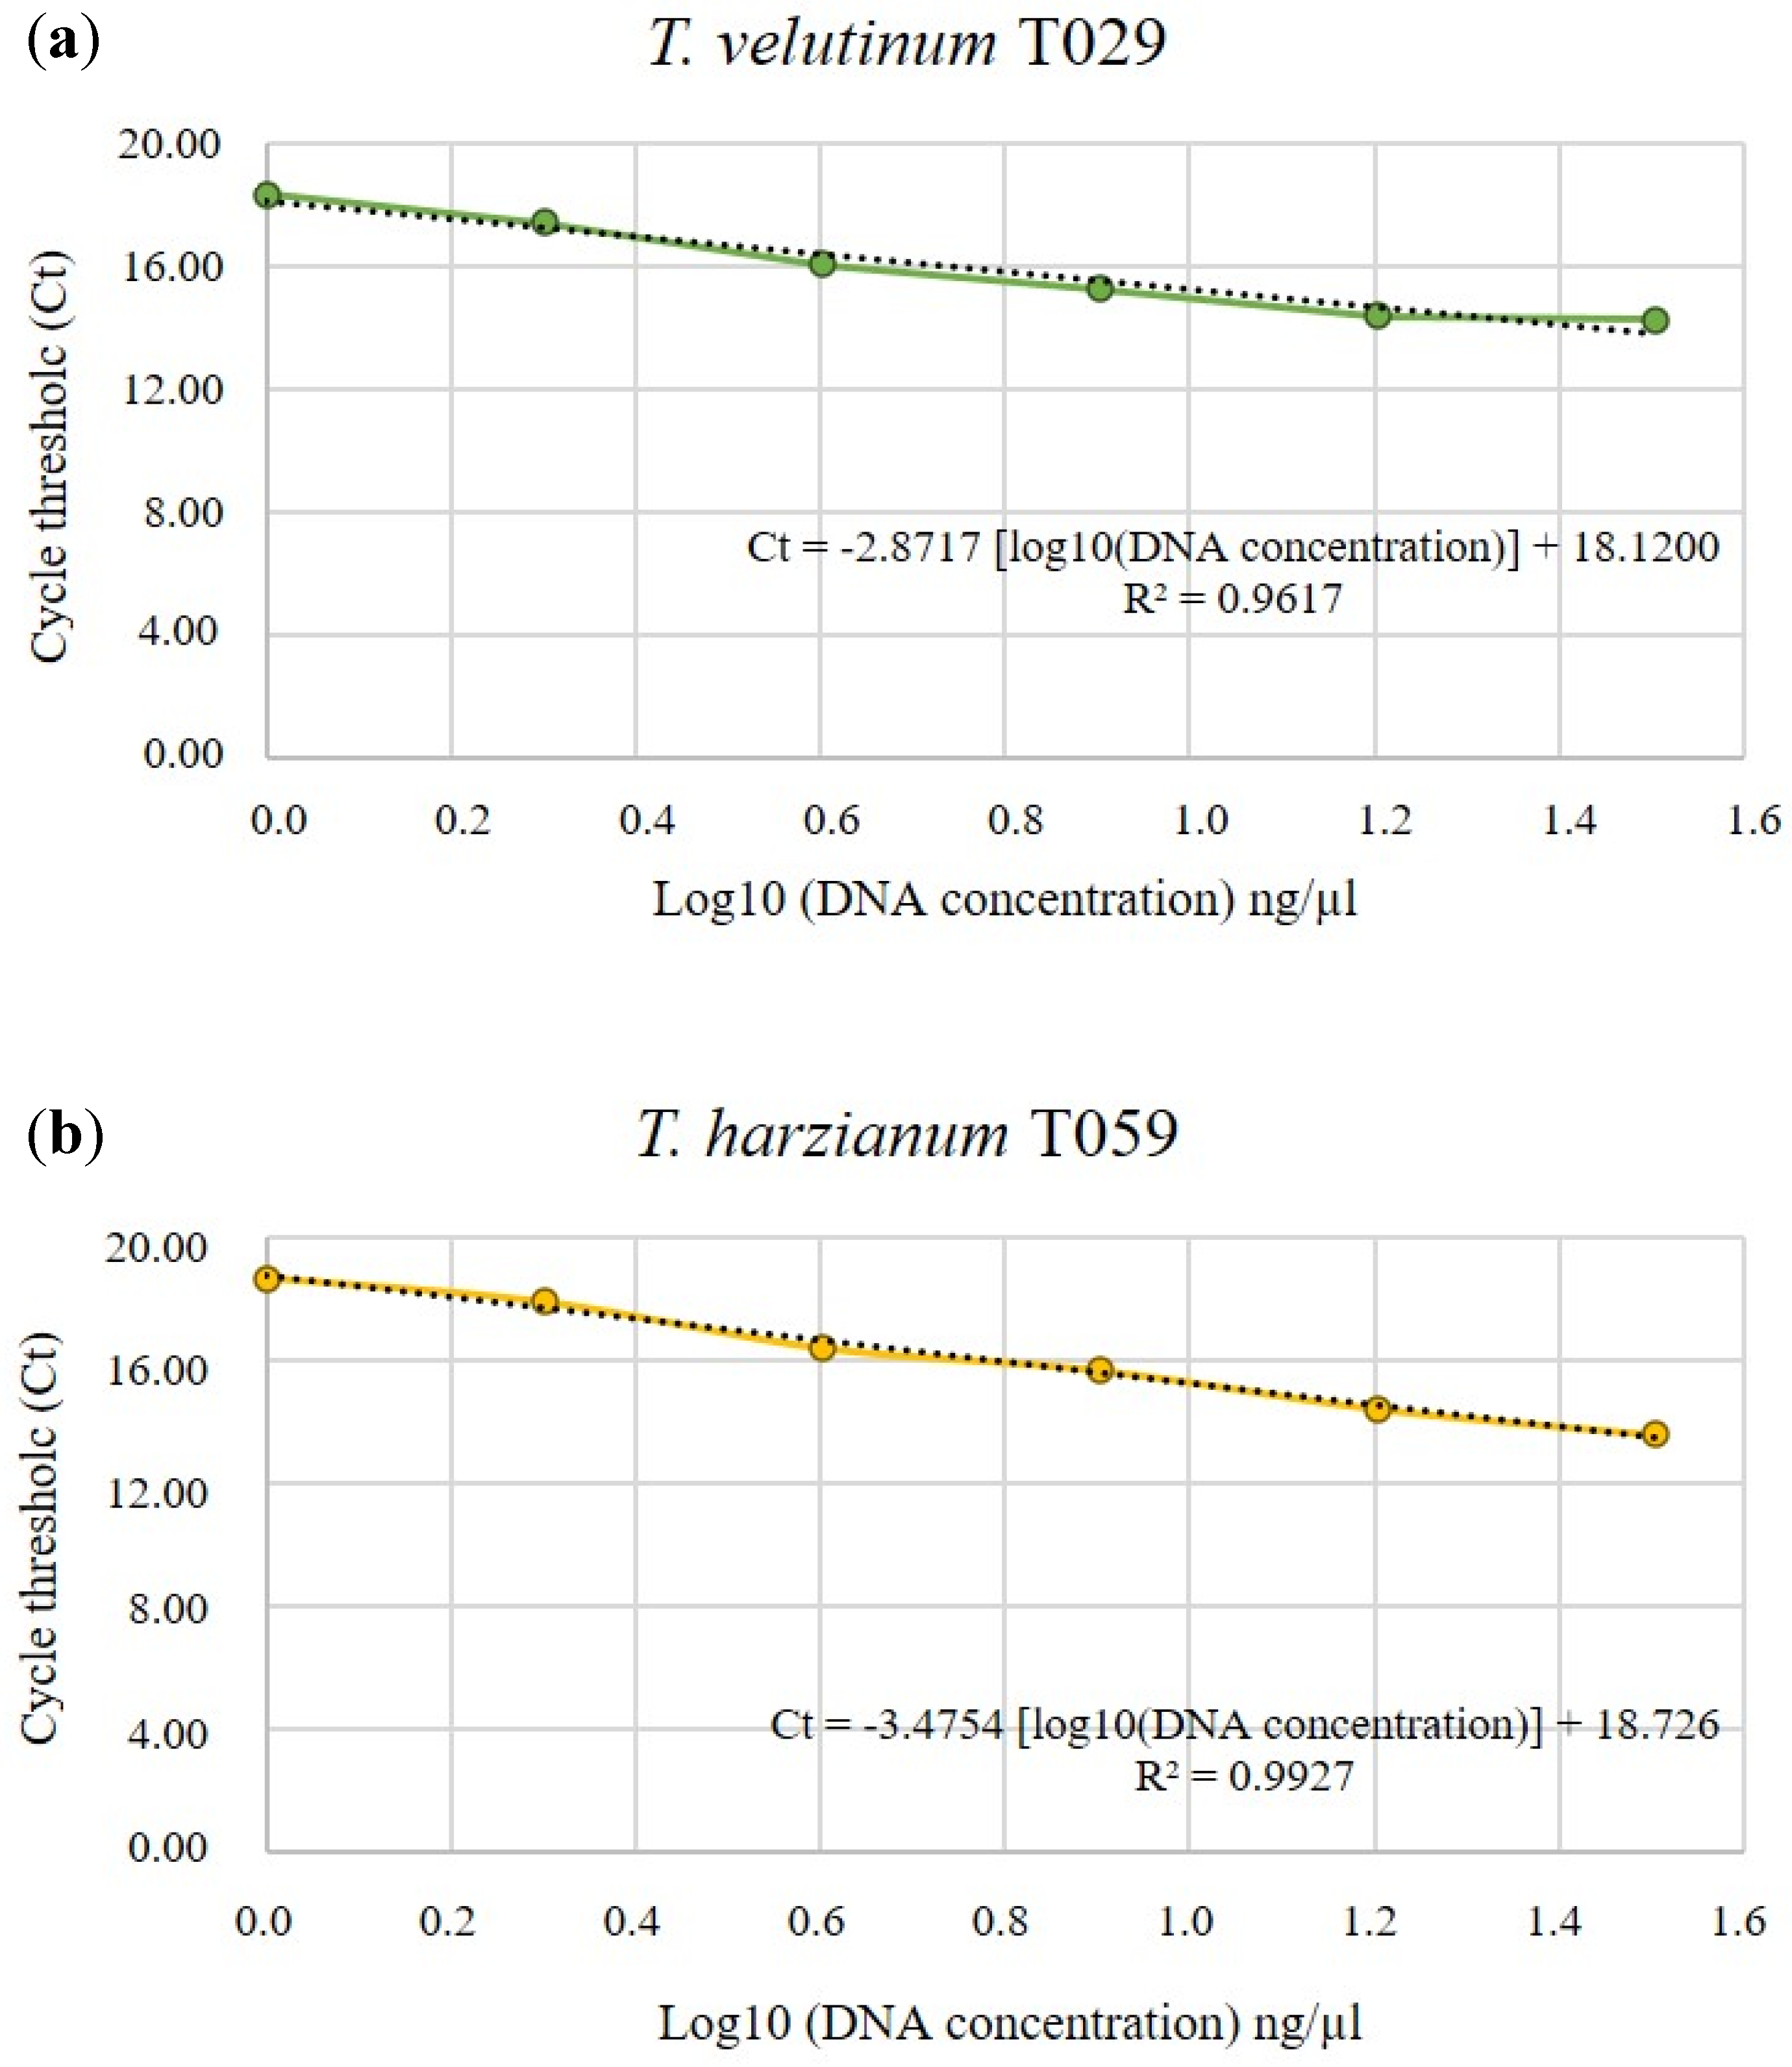
3.1. Standard curve of Trichoderma spp.

The linear regression equation for T. velutinum T029 is y =   2.8717   x + 18.120 and for T. harzianum T059 y =   3.4754   x + 18.726 with a highly significant correlation in both isolates (Figure 1).

3.2. Soil Sampling and Physicochemical Analysis

Twelve plots were selected for sampling in the bean production area of León (Table 1). Therefore, one plot was sampled in La Bañeza, two in La Cabrera and Esla-Campos, respectively, three in Astorga, and five in Páramo.
The physicochemical characteristics were different for each soil. Regarding soil texture, in Paramo and La Bañeza, they were sandy loam, and the rest were between loam and silt loam. pH in Astorga was between strongly acidic and slightly acidic, in La Bañeza neutral, in La Cabrera very strongly acidic, in Esla-Campos between strongly acidic and slightly alkaline, and in Paramo between moderately acidic and slightly alkaline (Table 2).
In the case of CEC, it was low, between 3.32 cmol·kg−1 and 8.46 cmol·kg−1 in Paramo (P3) and Esla-Campos (E1), respectively. As for EC, all soils were non-saline with values between 0.05 dS·m−1 (P2) and 0.32 dS·m−1 (C2). OM concentration in the plot samples was remarkably high in La Cabrera, medium to high in Astorga, medium in La Bañeza, medium to very low in Esla-Campos and low to very low in Páramo, with values between 4.51% (C2) and 0.05% (P2). Regarding to the C/N ratio, it was between medium and high in most of the soils, except for the Paramo soils, in which it was low. P and K concentrations were high in all soils except for the K concentration in Paramo soils, where it was low. Most soils had a low Ca concentration. Mg concentration was high in most soils of Paramo, Astorga, and Esla-Campos, but it was low in the rest of them. All soils presented from low to acceptable concentrations of Na, Mn, Fe, Cu, Zn, and B (Table 2).

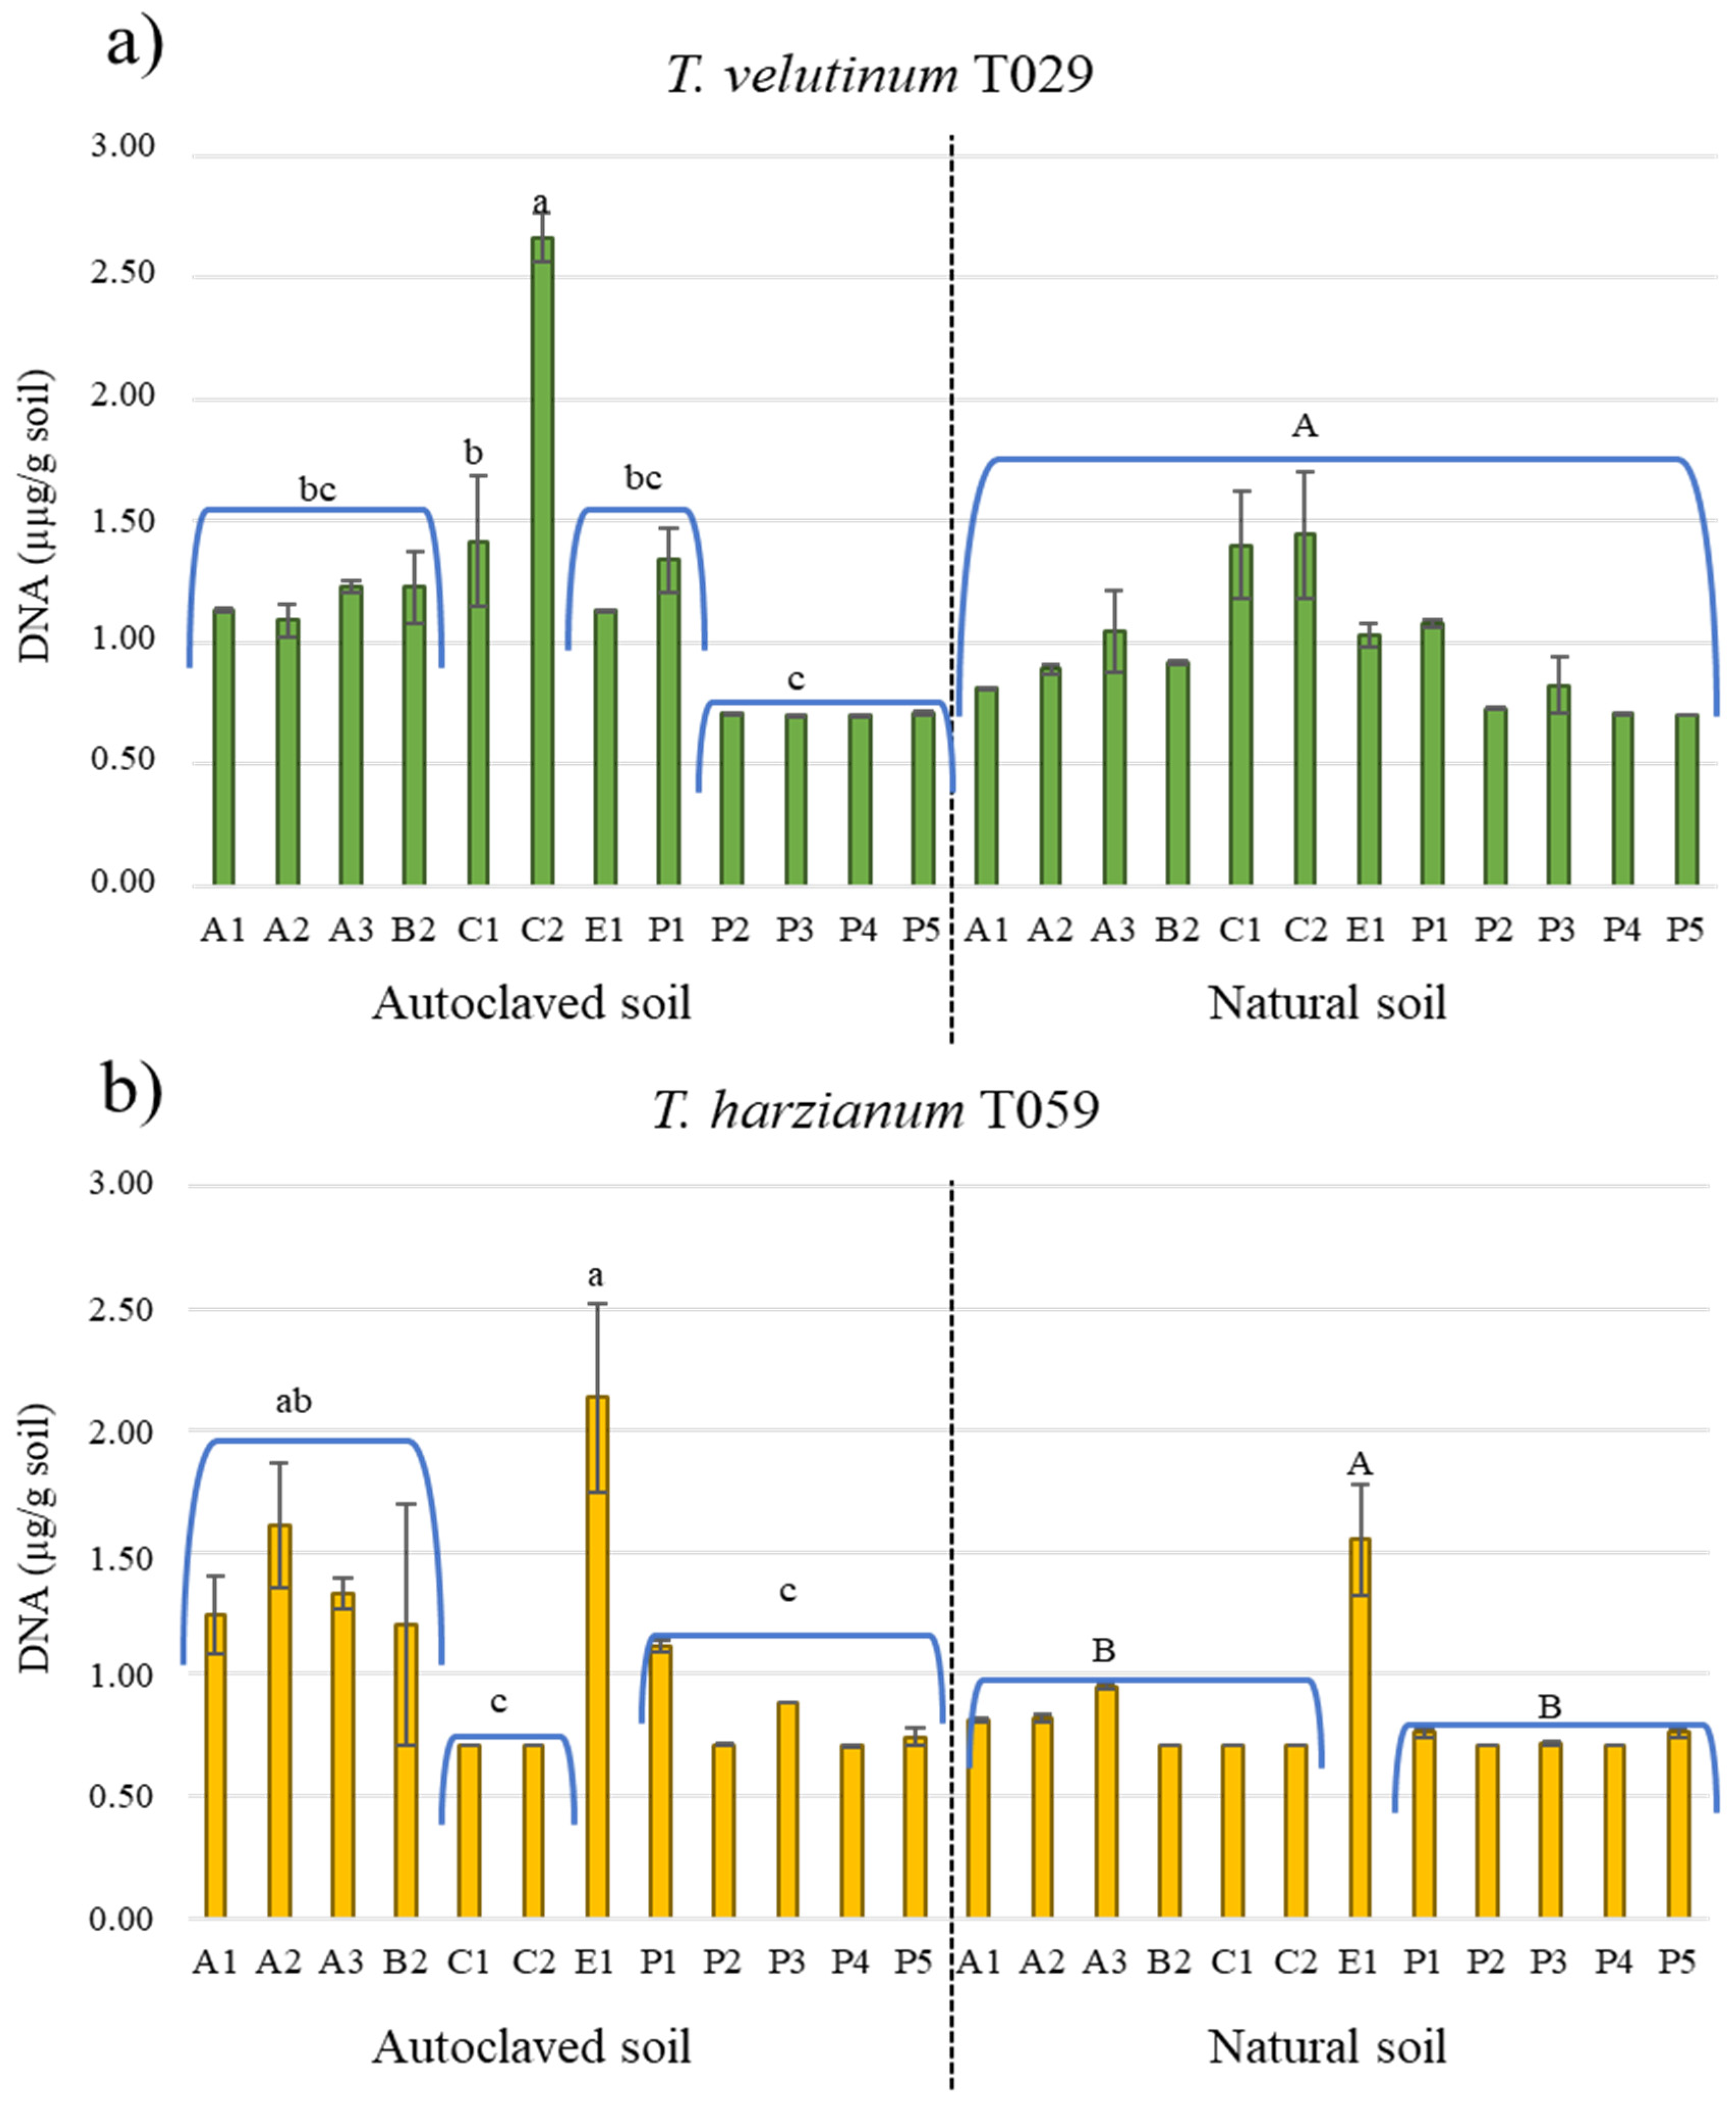
3.3. Development of Trichoderma spp. in Crop Soils

In the Levene’s test, the data did not present significant differences. There were significant differences between Trichoderma isolates (T029 and T059), between soil treatment (AS and NS), between localizations (from A1 to P5, Table 1). The interactions of Trichoderma isolates x localizations, soil treatments x localizations and, soil treatments x Trichoderma isolates x localizations were also significant (Supplementary Material Table S1).
The growth of Trichoderma spp. was different depending on the localization and its treatment (AS and NS) (Figure 2). In general, both isolates developed better in AS than in NS. In the AS of La Cabrera (C2), it was detected the highest amount of T. velutinum T029 (2.67 µg·g soil−1). T. harzianum T059 grew the best in the AS of Esla-Campos (E1) (3.13 µg·g soil−1). The development of the BCA isolates was more deficient in the NS. In the NS of the Cabrera soil (C2), 1.44 µg·g soil−1 of T. velutinum T029 was detected.
The development of both isolates was similarly in Astorga and Paramo soils. Both Trichoderma isolates had positive growth in both AS and NS soils of this last productive zone. The Cabrera soils (C1, C2) had a negative effect on the T. harzianum T059 growth.

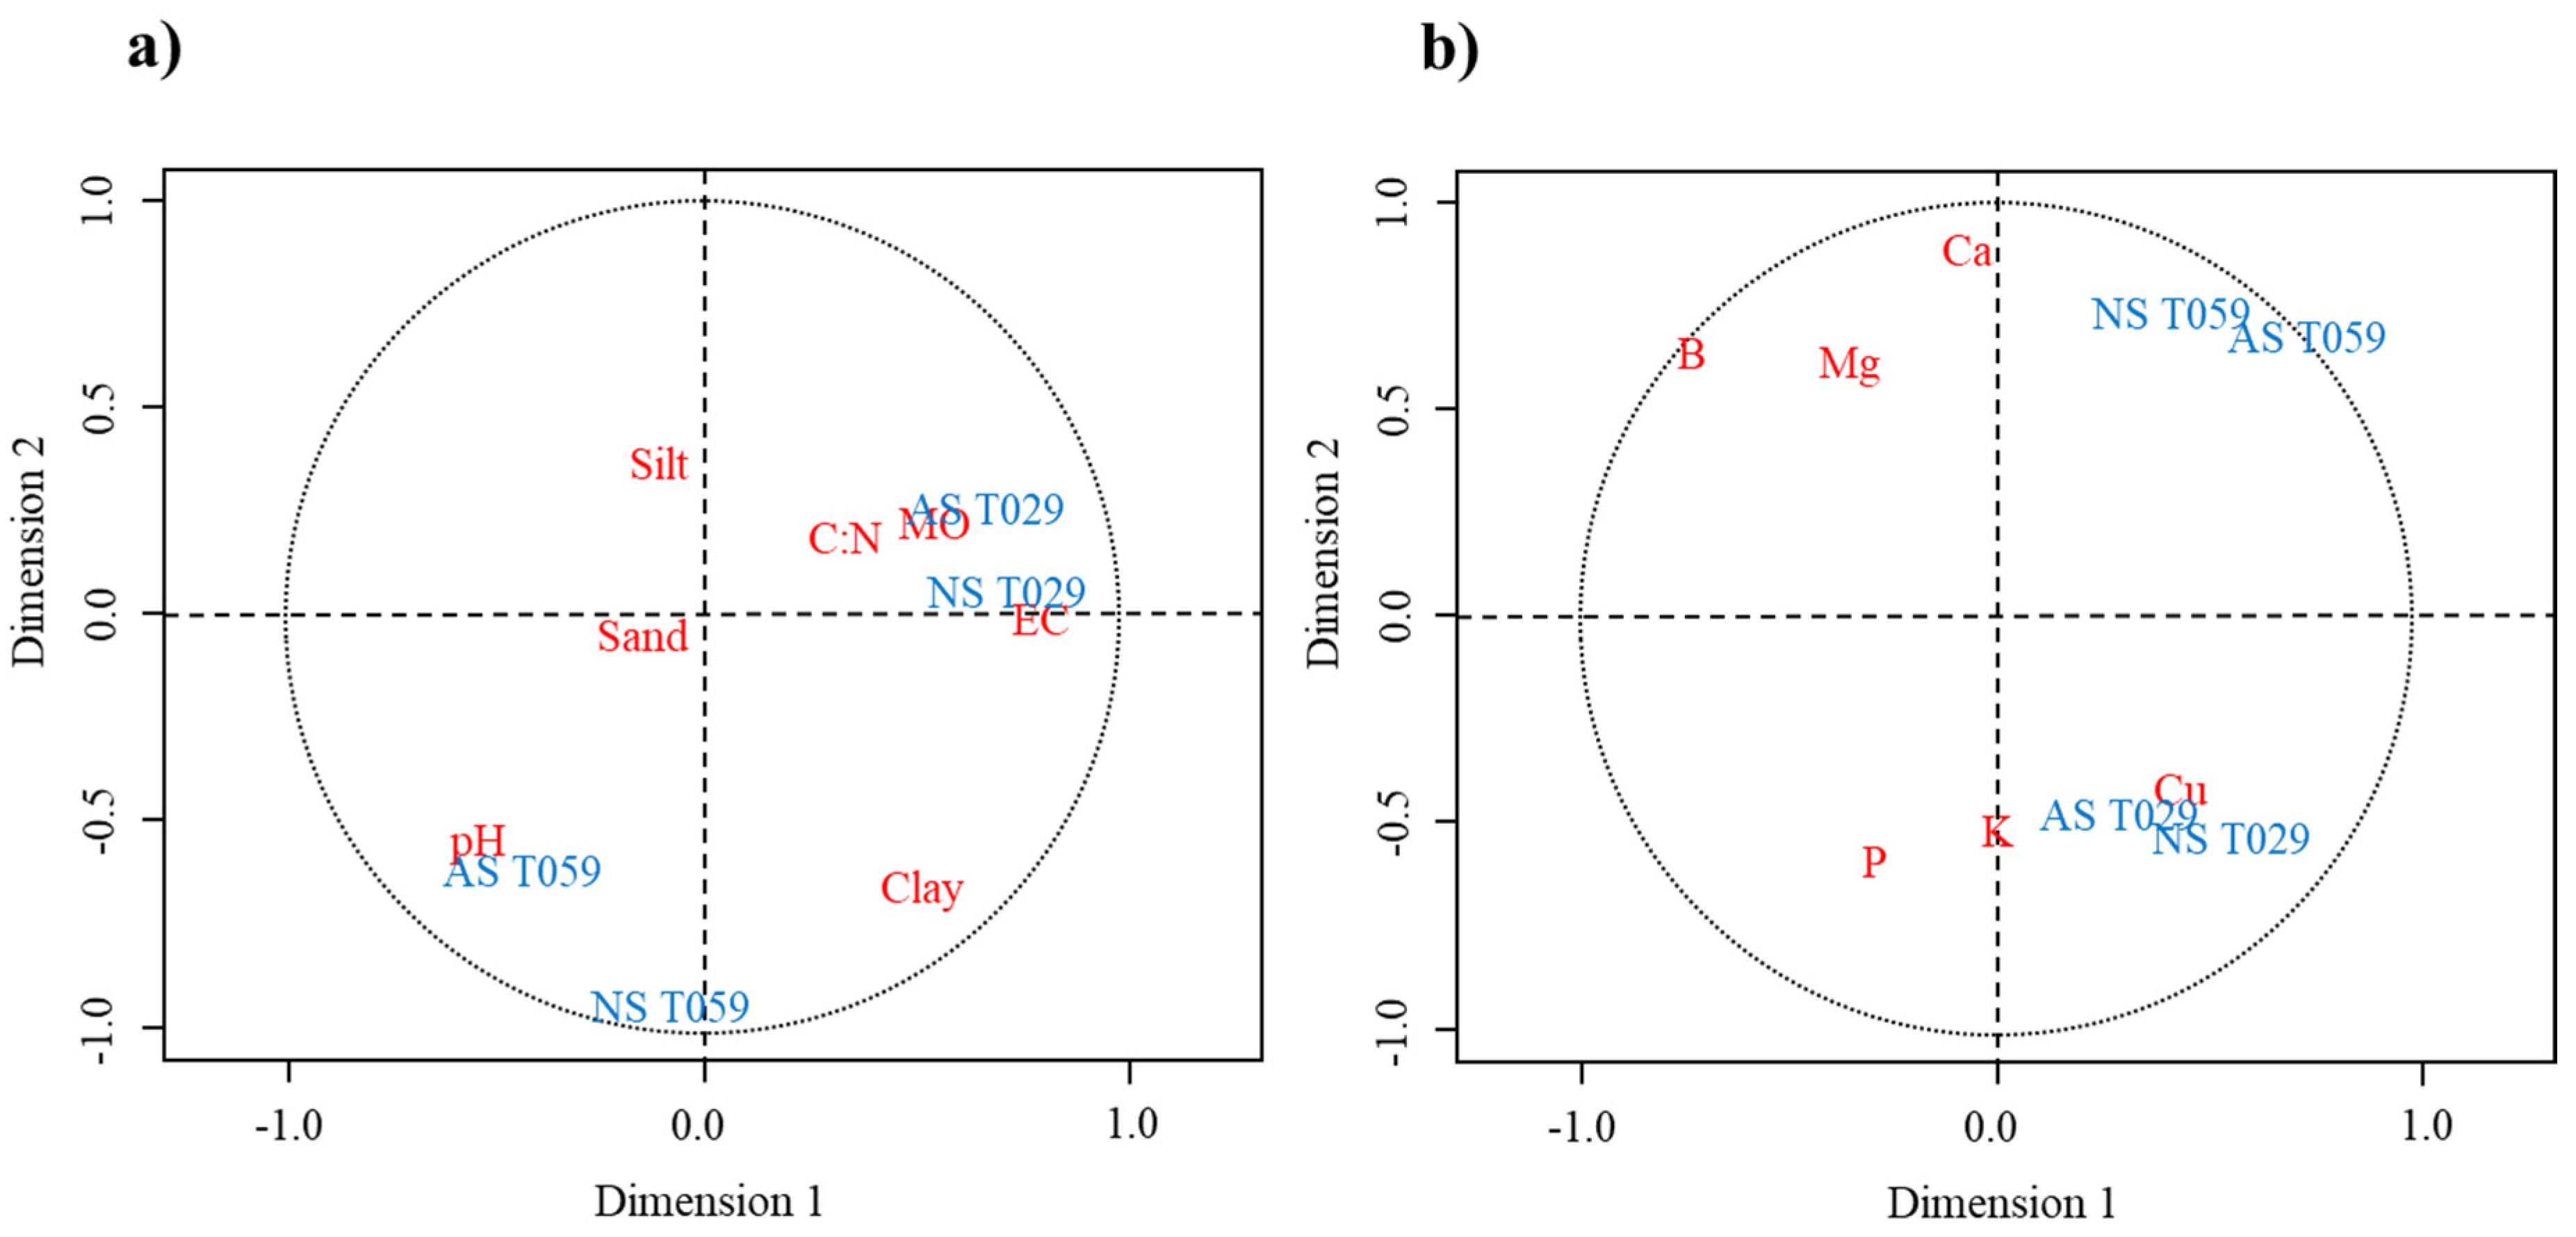
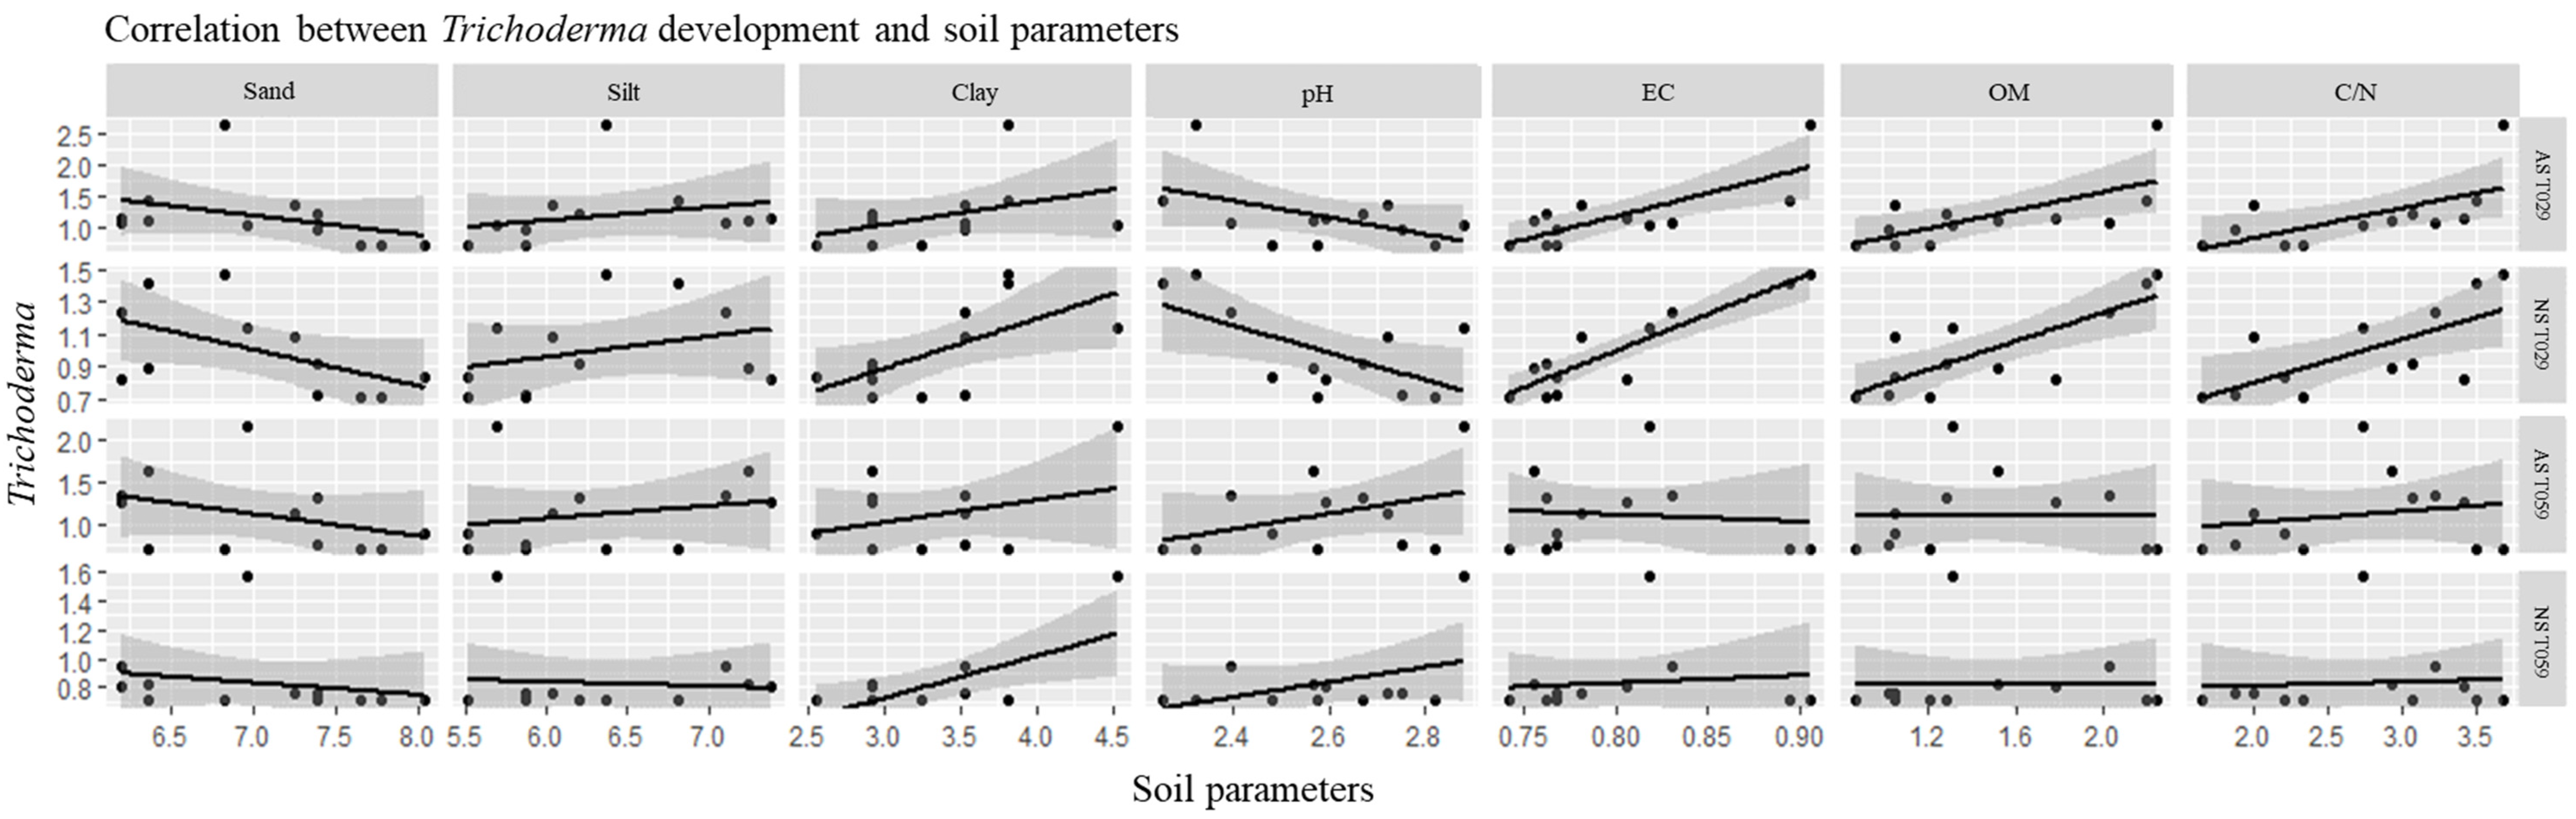
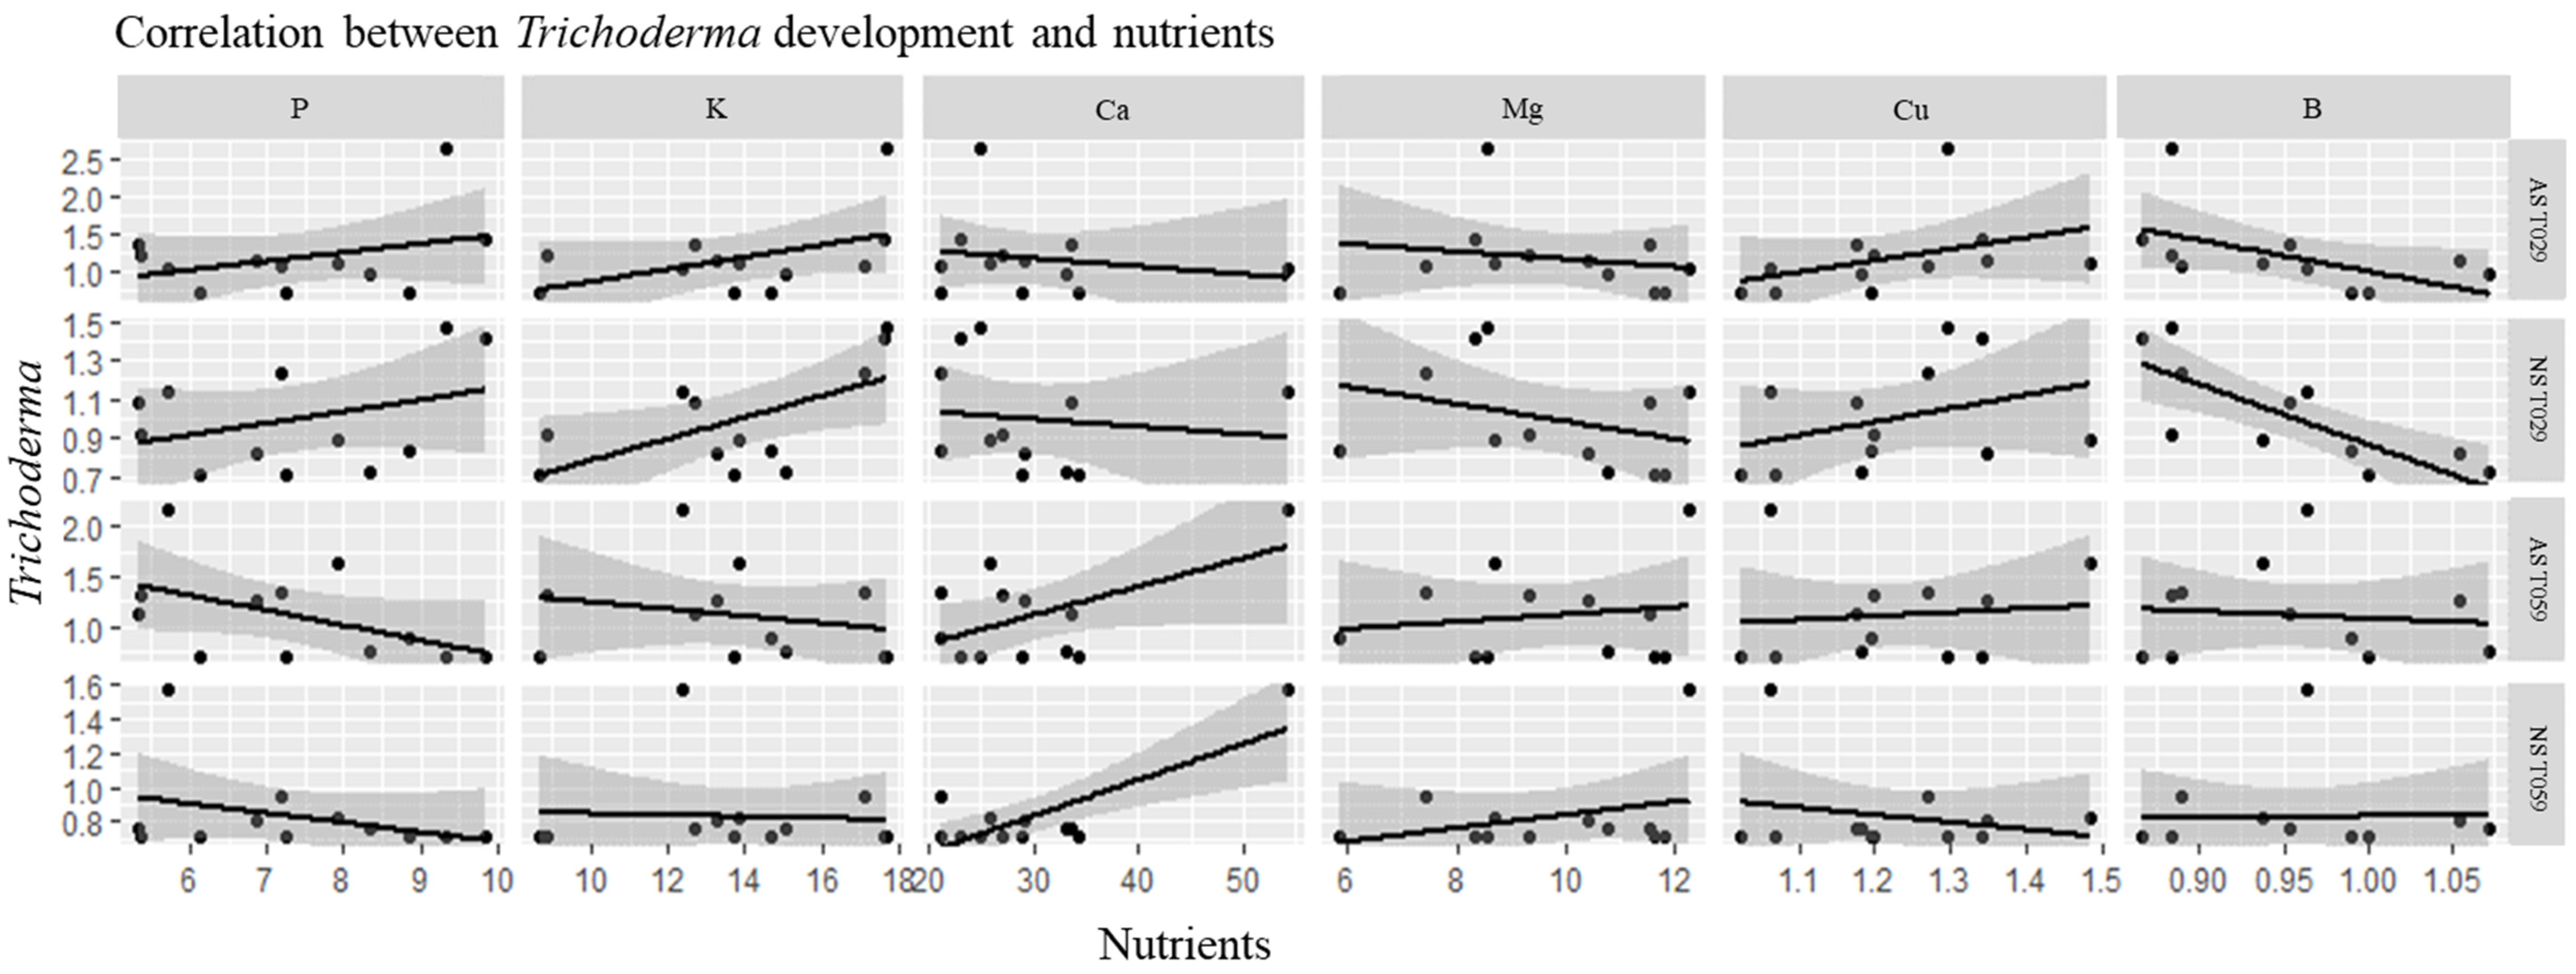
3.4. Correlations of Trichoderma Isolates and Physicochemical Characteristics of Soil Samples and CCA

In the compared texture of soils, pH, EC and C/N were chosen as elements that could affect to Trichoderma growth. Main macronutrients (P, K, Ca and Mg) and micronutrients (Cu and B) were selected as candidates that could induces the survival of these Trichoderma species in soils.
The evaluation of these physicochemical parameters of the different bean cultivated soils were divided in two analysis of CCAs for comparing the Trichoderma species development. A combination of datasets (soil parameters x Trichoderma development) and another combination of datasets (nutrients x Trichoderma development). The dataset of Trichoderma was the same for both of them.
Wilks’ Lambda’s test was used for checking the significance of canonical correlation. For the first combination of datasets (soil parameters x Trichoderma), the first dimension obtained a p value = 0.013 (p < 0.05) in soil parameters respect to Trichoderma. So that, it indicates a correlation between datasets as well as the second combination of datasets (nutrients x Trichoderma development) where a p value = 0.011 (p < 0.05) indicates a correlation. The rest of dimensions of both combination of datasets showed a p value higher than 0.05. So that, it will be evaluated the correlation for both combination of datasets in the first dimension of the correlation matrix in each combination of datasets.
Combination of the datasets (soil parameters x Trichoderma development) are represented in Figure 3a. For the first correlation matrix related to soil parameters, the first dimension was strongly positive related to EC (0.86), clay (0.59) and OM (0.58) and pH (−0.54) a negative correlation was performed. Trichoderma data set had a first canonical dimension strongly influenced by AS T029 and NS T029 (0.70 and 0.77 respectively). Figure 4 represents the combination of all values evaluated.
The other combination of datasets (nutrients x Trichoderma development) are visualized in Figure 3b. According to nutrients, the first canonical dimension was most strongly influenced by AS T059 (0.73). The nutrients in the first dimension was B (−0.64), and Cu (0.55). Figure 5 represents the degree of correlation for all the values represented for the combination Trichoderma x nutrients.
The three datasets represented in these analyses (soil parameters, nutrients and Trichoderma development) were also evaluated separately and a correlation between their own elements was also found. They are described in Supplementary Material Figures S1–S3. Trichoderma dataset, there was a high correlation between AS and NS in each Trichoderma, T. velutinum T029 (0.756) and T. harzianum T059 (0.828) (Supplementary Figure S1). Soil parameter dataset, OM had a very high correlation with EC (0.876) and C:N ratio (0.923), silt with sand (−0.918) (Supplementary Figure S2). Nutrient dataset, P and K had a high correlation (0.797) and Ca and Mg (0.773) (Supplementary Figure S3).

4. Discussion

The number of chemically-synthesized products for the control of phytopathogens has been reduced by the increase in food and environmental safety. Agricultural production is nowadays oriented toward sustainable processes that favor local development, using of local varieties, and being environmentally friendly. One way to carry out this process is by using biological agents to control pests and diseases. We have selected two Trichoderma isolates, T. velutinum T029 and T. harzianum T059, obtained from the PGI area where farmers grow adapted and traditional varieties, such as “Canela”, “Riñón”, “Pinta” and “Plancheta”. The use of autochthonous BCAs can be more accurate as they are better adapted than other isolates from other areas and crops. Thus, these isolates are adapted to the agronomic conditions of the field, and they should be more effective in protecting bean plants against biotic factors such as fungal diseases.
In this work, we used a qPCR strategy for the quantification of Trichoderma spp. development. It allowed us to know the amount of the biocontrol agent grown in each soil by an objective and accurate method to determine fungal growth. This technique has been previously pursued to quantify the bacteria and soil-borne fungal pathogens in strawberry [37] as well as to detect Rhizoctonia solani in tobacco fields, where they quantified the potential inoculum of this pathogen and its disease index [38]. Trichoderma was quantified following this method to determine the best horticultural substrate for its development, favouring phytopathogen displacement [24].
Trichoderma, as a BCA, can efficiently colonize the rhizosphere, helping plant protection in the presence of pathogens. This process is critical for the interaction with plants and the suppression of soil-borne diseases. It depends on a plethora of biotic and abiotic factors. In this research, T. velutinum T029 and T. harzianum T059 developed significantly better in autoclaved soils, compared to natural soils. These differences in growth showed between soils were similar to those observed in other microorganisms. Actually, Bacillus subtilis presented a higher population in an autoclaved substrate with cottonseeds than in a non-autoclaved one, especially 14 days after inoculation [39]. In another work, peanut plants presented more colonization of Glomus spp. in autoclaved soil enriched with soil microbiota than in a non-autoclaved soil [40]. According to several authors, a cause for this favored development could be attributable to the diminished competitive activity of soil microorganisms. During the autoclaving process, competing microorganisms have been removed, some of which may have been autochthonous fungal isolates that were not as effective as the introduced fungus [41]. These indigenous species compete for the nutrients and niche with Trichoderma or inhibit its growth by the production of antimicrobial metabolites [39]. Many fungi, bacteria, insects, nematodes, and other microorganism coexist in the soil, so it is particularly important to understand those interactions to develop a soil management strategy, instead of focusing on individual disease-causing species. In a NS, Trichoderma spp. might be attacked by mycoparasites that can play a role in limiting fungal populations and have possible effects on plant growth [42]. Al-Khaliel [40] suggested that the autoclaving process increases nutrient availability.
Rhizosphere microorganisms influence the dynamics of the soil organic matter and nutrient cycles [43,44]. Likewise, the development of microorganisms, like Trichoderma, is swayed by the characteristics of the soil (Figure 2). Latour et al. [45] investigated the diversity of the populations of Pseudomonas fluorescens associated with tomato and flax in two different soils. They observed that the substrate was the main factor responsible for the heterogenicity of the associated bacterial populations. In our research, the development of Trichoderma varied according to the plot. In Paramo’s soils, none of our Trichoderma isolates developed extensively. Previous reports indicate that pH, C concentration, and EC have a strong influence on soil microbial community composition and function [46,47,48]. In the present work, Paramo‘s soils had low total C concentration (between 0.40% and 0.89%), and the EC was the lowest value of the sampled soils, affecting the development of Trichoderma spp. The pH value also affected the BCA growth, since it showed a different effect in each productive zone and each sample soil. These data are supported by the research of Brockett et al. [49], who observed similar results. However, in another study, pH affected the quantity of inoculum of R. solani, being the range of pH of 4.5–6.5 optimal for its development. Further, if pH increased, the amount of inoculum diminished [38]. T. velutinum T029 developed more in La Cabrera’s soils than in other soil samples. These soils were characterized for having high levels of OM, total C, C:N ratio, P, K, Fe, and Zn. However, T. harzianum T059 grew better on the Esla-Campos’s soils, where clay, CEC, pH, Ca, Mg, and Mn showed the highest values of the sampled soils. Harries et al. [38] observed that the development of R. solani was limited in soils with high clay, OM content, and physical stability. Also, the abundance of Blastocladiosmycota phylum, Nitrospirae or Acidobacteria phylum, was affected by pH, total C, total or available P, and N, being all these parameters negative for their development [50]. In our study, T. harzianum T059 grew better in soils with a high concentration of clays. An explanation could be that small particles size provide small pore sizes and protect microorganisms against other organisms. In addition, silt and clay particles have more water holding capability and exert a greater impact on water and nutrient availability [50]. T. velutinum T029 developed better in soils with high levels of OM, total C and C:N ratio. The addition of organic matter or mineral fertilizers affects microbial activities. Gorissen et al. [51] found that the application of nitrogen to the soil negatively affected the bacterial population associated with the roots of Pseudotsuga menziesii. Similarly, Demoling et al. [52] observed that the total C and N levels influenced microbial communities. A high C:N ratio is characteristic of soil systems with a high amount of organic matter and a slow decomposition rate, which should have a negative impact in bacterial and fungal development [11]. Summarizing, C:N ratio and pH, were the main factors that explain the variation in microorganism communities. Furthermore, these characteristics in combination with texture and EC could have influenced the development of Trichoderma, regardless of the influence of vegetation type and land-use practices.
The biocontrol activity of the Trichoderma koningii strain was also influenced by physical and chemical parameters in the soil, such as iron, copper, texture and boron in a positive correlation and pH and available phosphorus negatively [53]. Some of the nutrients and physical parameters are correlated to some of our strains such as pH with a negative influence and copper and boron positive correlation. This demonstrates the importance of the characteristics of soils that share some of these parameters but that are different from the Trichoderma species, using the method of evaluation and crops that are described [54].
All these variations influence the success of a Trichoderma strain for being established in a novel soil. So, a physical and chemical analysis is compulsory before applying a Trichoderma strain, in order to ensure its positive effects.

5. Conclusions

Twelve plots were selected for sampling in the production area of bean crops in the León province. The physicochemical characteristics indicated that the soil texture was between sandy loam and silt loam. The pH was between strongly acidic and slightly alkaline. The OM concentration was between low and remarkably high. The total C and N concentrations and their ratio were between medium and high in most of the soils. The rest of the micronutrients had an acceptable concentration except for Paramo’s plots. T. velutinum T029 and T. harzianum T059 developed better in AS than in NS. High levels of OM, total C, C:N ratio, P, K, Fe, and Zn in La Cabrera’s soils favored the growth of T. velutinum T029. The high values of clay, CEC, pH, Ca, Mg, and Mn concentration in Esla-Campos’s soils favored the development of T. harzianum T059. Texture, particularly clay concentration, OM, EC, and pH in the soil parameters and B and Cu in the nutrients could be the main factors explaining the influence in the Trichoderma development. The OM, EC, and C:N ratio and Cu are the main soil characteristics that influence in T. velutinum T029 development and pH in the T. harzianum T059 development.

Supplementary Materials

The following are available online at https://www.mdpi.com/2073-4395/11/2/274/s1, Table S1: Three-way ANOVA for Trichoderma DNA concentration (µg·g soil−1), Figure S1: Correlation values of the Canonical Correlation Analysis (CCA) between isolates development, Trichoderma velutinum T029 and T. harzianum T059, in the soil treatment. Natural soil T. harzianum (NS T059), natural soil T. velutinum (NS T029), autoclaved soil T. harzianum (AS T059). autoclaved soil T. velutinum (AS T029), Figure S2: Correlation values of the Canonical Correlation Analysis (CCA) between soil parameters. Electric conductivity (EC), Soil organic matter (OM), C:N ratio (C/N), Figure S3: Correlation values of the Canonical Correlation Analysis (CCA) between nutrients. Assimilable phosphorus (P), the cations potassium (K), calcium (Ca), magnesium (Mg), copper (Cu) and boron (B).

Author Contributions

All authors contributed to the study conception and design. Material preparation, sampling and data collection were performed by S.M.-P., A.J.P.-Á., S.d.S.-H., Á.R.-G., and G.C.-H.; statistical analysis was carried out by S.M.-G., G.C.-H. and S.M.-P.; supervision of all study was performed by S.G. and P.A.C.; the first draft of the manuscript was written by S.M.-P. and all authors commented on previous versions of the manuscript. All authors read and approved the final manuscript.

Funding

This research was funded by Junta de Castilla y León, Consejería de Educación for the project “Application of Trichoderma strains in sustainable quality bean production” (LE251P18).

Conflicts of Interest

The authors declare no conflict of interest. The funders had no role in the design of the study; in the collection, analyses, or interpretation of data; in the writing of the manuscript, or in the decision to publish the results.

References

  1. FAO FAOSTAT. Available online: http://www.fao.org/faostat/en/#data/QC (accessed on 1 October 2020).
  2. Ministerio de Agricultura, Pesca y Alimentación. Anuario de Estadística. Available online: https://www.mapa.gob.es/es/estadistica/temas/publicaciones/anuario-de-estadistica/2019/default.aspx?parte=3&capitulo=07&grupo=2&seccion=2 (accessed on 22 April 2020).
  3. Casquero, P.A.; Reinoso, B.; Valenciano, J.B. Preliminary evaluation of common bean landraces from León (Spain). In Proceedings of the Annual Report of the Bean Improvement Cooperative, Sacramento, CA, USA, 24 October 2004; Volume 47, pp. 93–94. [Google Scholar]
  4. Beebe, S.E.; Corrales, M.P. Breeding for disease resistance. In Common Beans: Research for Crop Improvement; Schoonhoven, A., van Voysest, O., Eds.; CAB International: Wallingford, UK, 1991; ISBN 0-85198-679-X. [Google Scholar]
  5. Gupta, S.; Mathew, K.; Shyam, K.; Sharma, A. Fungicidal management of root rot (Rhizoctonia solani) of French bean. Plant Dis. Res. 1999, 14, 20–24. [Google Scholar]
  6. Bordoloi, D.; Paul, S.; Das, R.; Roy, A. Effect of pre-sowing seed treatment on emergence and seedling mortality of French bean. Ann. Agric. Res. 1998, 19, 348–349. [Google Scholar]
  7. Valenciano, J.B.; Casquero, P.A.; Boto, J.A. Influence of sowing techniques and pesticide application on the emergence and the establishment of bean plants (Phaseolus vulgaris L.). Agronomie 2004, 24, 113–118. [Google Scholar] [CrossRef] [Green Version]
  8. Fierer, N.; Jackson, R.B. The diversity and biogeography of soil bacterial communities. Proc. Natl. Acad. Sci. USA 2006, 103, 626–631. [Google Scholar] [CrossRef] [PubMed] [Green Version]
  9. Lozupone, C.A.; Knight, R. Global patterns in bacterial diversity. Proc. Natl. Acad. Sci. USA 2007, 104, 11436–11440. [Google Scholar] [CrossRef] [Green Version]
  10. Zhong, W.; Gu, T.; Wang, W.; Zhang, B.; Lin, X.; Huang, Q.; Shen, W. The effects of mineral fertilizer and organic manure on soil microbial community and diversity. Plant Soil 2010, 326, 511–522. [Google Scholar] [CrossRef]
  11. Kuramae, E.E.; Yergeau, E.; Wong, L.C.; Pijl, A.S.; Veen, J.A.; Kowalchuk, G.A. Soil characteristics more strongly influence soil bacterial communities than land-use type. FEMS Microbiol. Ecol. 2012, 79, 12–24. [Google Scholar] [CrossRef] [Green Version]
  12. Valenciano, J.B.; Casquero, P.A.; Boto, J.A.; Guerra, M. Effect of sowing techniques and seed pesticide application on dry bean yield and harvest components. Field Crops Res. 2006, 96, 2–12. [Google Scholar] [CrossRef]
  13. Valenciano, J.B.; Casquero, P.A.; Boto, J.A. Evaluation of the occurrence of bean plants (Phaseolus vulgaris L.) affected by bean seed fly, Delia platura (Meigen), grown under different sowing techniques and with different forms of pesticide application. Field Crops Res. 2004, 85, 103–109. [Google Scholar] [CrossRef]
  14. Mayo, S.; Cominelli, E.; Sparvoli, F.; González-López, O.; Rodríguez-González, A.; Gutiérrez, S.; Casquero, P.A. Development of a qPCR strategy to select bean genes involved in plant defense response and regulated by the Trichoderma velutinum—Rhizoctonia solani interaction. Front. Plant Sci. 2016, 7, 1109. [Google Scholar] [CrossRef]
  15. Harman, G.E.; Howell, C.R.; Viterbo, A.; Chet, I.; Lorito, M. Trichoderma species—Opportunistic, avirulent plant symbionts. Nat. Rev. Microbiol. 2004, 2, 43–56. [Google Scholar] [CrossRef] [PubMed]
  16. Papavizas, G.C. Trichoderma and Gliocladium: Biology, ecology, and potential for biocontrol. Annu. Rev. Phytopathol. 1985, 23, 23–54. [Google Scholar] [CrossRef]
  17. Mayo, S.; Gutierrez, S.; Malmierca, M.G.; Lorenzana, A.; Campelo, M.P.; Hermosa, R.; Casquero, P.A. Influence of Rhizoctonia solani and Trichoderma spp. in growth of bean (Phaseolus vulgaris L.) and in the induction of plant defense-related genes. Front. Plant Sci. 2015, 6, 685. [Google Scholar] [CrossRef] [PubMed] [Green Version]
  18. Cardoza, R.E.; McCormick, S.P.; Malmierca, M.G.; Olivera, E.R.; Alexander, N.J.; Monte, E.; Gutiérrez, S. Effects of trichothecene production on the plant defense response and fungal physiology: Overexpression of the Trichoderma arundinaceum tri4 gene in T. harzianum. Appl. Environ. Microbiol. 2015, 81, 6355–6366. [Google Scholar] [CrossRef] [PubMed] [Green Version]
  19. Gomes, E.V.; Ulhoa, C.J.; Cardoza, R.E.; Silva, R.N.; Gutiérrez, S. Involvement of Trichoderma harzianum Epl-1 protein in the regulation of Botrytis virulence- and tomato defense-related genes. Front. Plant Sci. 2017, 8, 880. [Google Scholar] [CrossRef] [PubMed]
  20. Hermosa, R.; Rubio, M.B.; Cardoza, R.E.; Nicolás, C.; Monte, E.; Gutiérrez, S. The contribution of Trichoderma to balancing the costs of plant growth and defense. Int. Microbiol. 2013, 16, 69–80. [Google Scholar]
  21. Hermosa, R.; Cardoza, R.E.; Rubio, M.B.; Gutiérrez, S.; Monte, E. Secondary metabolism and antimicrobial metabolites of Trichoderma. In Biotechnology and Biology of Trichoderma; Gupta, V.K., Schmoll, M., Herrera-Estrella, A., Upadhyay, R.S., Druzhinina, I., Tuohy, M.G., Eds.; Elsevier B.V.: Amsterdam, The Netherlands, 2014; pp. 125–137. ISBN 9780444595768. [Google Scholar]
  22. Vinale, F.; Sivasithamparam, K.; Ghisalberti, E.L.; Marra, R.; Woo, S.L.; Lorito, M. Trichoderma–plant–pathogen interactions. Soil Biol. Biochem. 2008, 40, 1–10. [Google Scholar] [CrossRef]
  23. Contreras-Cornejo, H.A.; Macías-Rodríguez, L.; López-Bucio, J.S.; López-Bucio, J. Enhanced plant immunity using Trichoderma. In Biotechnology and Biology of Trichoderma; Gupta, V.G., Schmoll, M., Herrera-Estrella, A., Upadhyay, R.S., Druzhinina, I., Tuohy, M., Eds.; Elsevier: Oxford, UK, 2014; pp. 495–504. ISBN 9780444595768. [Google Scholar]
  24. Mayo-Prieto, S.; Porteous-Álvarez, A.J.; Rodríguez-González, Á.; Gutiérrez, S.; Casquero, P.A. Evaluation of substrates and additives to Trichoderma harzianum development by qPCR. Agron. J. 2020, 112, 3188–3194. [Google Scholar] [CrossRef]
  25. Beaulieu, R.; López-Mondéjar, R.; Tittarelli, F.; Ros, M.; Pascual, J.A. qRT-PCR quantification of the biological control agent Trichoderma harzianum in peat and compost-based growing media. Bioresour. Technol. 2011, 102, 2793–2798. [Google Scholar] [CrossRef]
  26. Legrand, F.; Picot, A.; Cobo-Díaz, J.F.; Cor, O.; Barbier, G.; Le Floch, G. Development of qPCR assays to monitor the ability of Gliocladium catenulatum J1446 to reduce the cereal pathogen Fusarium graminearum inoculum in soils. Eur. J. Plant Pathol. 2018, 152, 285–295. [Google Scholar] [CrossRef]
  27. Woodhall, J.W.; Adams, I.P.; Peters, J.C.; Harper, G.; Boonham, N. A new quantitative real-time PCR assay for Rhizoctonia solani AG3-PT and the detection of AGs of Rhizoctonia solani associated with potato in soil and tuber samples in Great Britain. Eur. J. Plant Pathol. 2013, 136, 273–280. [Google Scholar] [CrossRef]
  28. Demeke, T.; Gräfenhan, T.; Clear, R.M.; Phan, A.; Ratnayaka, I.; Chapados, J.; Patrick, S.K.; Gaba, D.; Lévesque, C.A.; Seifert, K.A. Development of a specific TaqMan® real-time PCR assay for quantification of Fusarium graminearum clade 7 and comparison of fungal biomass determined by PCR with deoxynivalenol content in wheat and barley. Int. J. Food Microbiol. 2010, 141, 45–50. [Google Scholar] [CrossRef] [PubMed]
  29. Jiménez-Fernández, D.; Montes-Borrego, M.; Navas-Cortés, J.A.; Jiménez-Díaz, R.M.; Landa, B.B. Identification and quantification of Fusarium oxysporum in planta and soil by means of an improved specific and quantitative PCR assay. Appl. Soil Ecol. 2010, 46, 372–382. [Google Scholar] [CrossRef] [Green Version]
  30. Li, M.; Senda, M.; Komatsu, T.; Suga, H.; Kageyama, K. Development of real-time PCR technique for the estimation of population density of Pythium intermedium in forest soils. Microbiol. Res. 2010, 165, 695–705. [Google Scholar] [CrossRef] [PubMed]
  31. Mayo-Prieto, S.; Campelo, M.P.; Lorenzana, A.; Rodríguez-González, A.; Reinoso, B.; Gutiérrez, S.; Casquero, P.A. Antifungal activity and bean growth promotion of Trichoderma strains isolated from seed vs soil. Eur. J. Plant Pathol. 2020, 158, 817–828. [Google Scholar] [CrossRef]
  32. Cardoza, R.E.; Hermosa, M.R.; Vizcaíno, J.A.; González, F.; Llobell, A.; Monte, E.; Gutiérrez, S. Partial silencing of a hydroxy-methylglutaryl-CoA reductase-encoding gene in Trichoderma harzianum CECT 2413 results in a lower level of resistance to lovastatin and lower antifungal activity. Fungal Genet. Biol. 2007, 44, 269–283. [Google Scholar] [CrossRef]
  33. Restovich, S.B.; Andriulo, A.E.; Portela, S.I. Introduction of cover crops in a maize–soybean rotation of the Humid Pampas: Effect on nitrogen and water dynamics. Filed Crop. Res. 2012, 128, 62–70. [Google Scholar] [CrossRef]
  34. MAPA. Métodos Oficales de Análisis. Tomo III. Suelos, Aguas, Fertilizantes y Plantas; Secretaría General de Alimentación. Dirección General de Política Alimentaria, Ed.; Ministerio de Agricultura Pesca Y Alimentacion: Madrid, Spain, 1994.
  35. R Core Team R: A Language and Environment for Statistical Computing 2013. Available online: https://www.scirp.org/(S(351jmbntvnsjt1aadkposzje))/reference/ReferencesPapers.aspx?ReferenceID=1787696 (accessed on 31 March 2020).
  36. Ozyilmaz, U.; Benlioglu, K.; Yildiz, A.; Benlioglu, H.S. Effects of soil amendments combined with solarization on the soil microbial community in strawberry cultivation using quantitative real-time PCR. Phytoparasitica 2016, 44, 661–680. [Google Scholar] [CrossRef]
  37. Harries, E.; Berruezo, L.A.; Galván, M.Z.; Rajal, V.B.; Mercado Cárdenas, G.E. Soil properties related to suppression of Rhizoctonia solani on tobacco fields from northwest Argentina. Plant Pathol. 2020, 69, 77–86. [Google Scholar] [CrossRef]
  38. Dong, L.; Guo, Q.; Wang, P.; Zhang, X.; Su, Z.; Zhao, W.; Lu, X.; Li, S.; Ma, P. Qualitative and quantitative analyses of the colonization characteristics of Bacillus subtilis strain NCD-2 on cotton root. Curr. Microbiol. 2020. [Google Scholar] [CrossRef]
  39. Al-Khaliel, A.S. Effects of arbuscular mycorrhization in sterile and non-sterile soils. Trop. Life Sci. Res. 2010, 21, 55. [Google Scholar] [PubMed]
  40. Linderman, R.G. Vesicular-arbuscular mycorrhizae and soil microbial interactions. In Micorrhizae in Sustainable Agriculture; Bethlenfalvay, G.J., Linderman, R.G., Eds.; John Wiley & Sons, Ltd.: Hoboken, NJ, USA, 1992; Volume 54, pp. 45–70. [Google Scholar]
  41. Panth, M.; Hassler, S.C.; Baysal-Gurel, F. Methods for management of soilborne siseases in crop production. Agriculture 2020, 10, 16. [Google Scholar] [CrossRef] [Green Version]
  42. Bodelier, P.L.E. Toward understanding, managing, and protecting microbial ecosystems. Front. Microbiol. 2011, 2, 80. [Google Scholar] [CrossRef] [PubMed] [Green Version]
  43. Tajik, S.; Ayoubi, S.; Lorenz, N. Soil microbial communities affected by vegetation, topography and soil properties in a forest ecosystem. Appl. Soil Ecol. 2020, 149, 103514. [Google Scholar] [CrossRef]
  44. Latour, X.; Corberand, T.; Laguerre, G.; Allard, F.; Lemanceau, P. The composition of fluorescent pseudomonad populations associated with roots is influenced by plant and soil type. Appl. Environ. Microbiol. 1996, 62, 2449–2456. [Google Scholar] [CrossRef] [Green Version]
  45. Li, D.; Sharp, J.O.; Saikaly, P.E.; Ali, S.; Alidina, M.; Alarawi, M.S.; Keller, S.; Hoppe-Jones, C.; Drewes, J.E. Dissolved organic carbon influences microbial community composition and diversity in managed aquifer recharge systems. Appl. Environ. Microbiol. 2012, 78, 6819–6828. [Google Scholar] [CrossRef] [Green Version]
  46. Van der Bom, F.; Nunes, I.; Raymond, N.S.; Hansen, V.; Bonnichsen, L.; Magid, J.; Nybroe, O.; Jensen, L.S. Long-term fertilisation form, level and duration affect the diversity, structure and functioning of soil microbial communities in the field. Soil Biol. Biochem. 2018, 122, 91–103. [Google Scholar] [CrossRef]
  47. Wakelin, S.A.; Gerard, E.; van Koten, C.; Banabas, M.; O’Callaghan, M.; Nelson, P.N. Soil physicochemical properties impact more strongly on bacteria and fungi than conversion of grassland to oil palm. Pedobiologia (Jena) 2016, 59, 83–91. [Google Scholar] [CrossRef]
  48. Brockett, B.F.T.; Prescott, C.E.; Grayston, S.J. Soil moisture is the major factor influencing microbial community structure and enzyme activities across seven biogeoclimatic zones in Western Canada. Soil Biol. Biochem. 2012, 44, 9–20. [Google Scholar] [CrossRef]
  49. Pan, X.; Zhang, S.; Zhong, Q.; Gong, G.; Wang, G.; Guo, X.; Xu, X. Effects of soil chemical properties and fractions of Pb, Cd, and Zn on bacterial and fungal communities. Sci. Total Environ. 2020, 715, 136904. [Google Scholar] [CrossRef]
  50. Bach, E.M.; Baer, S.G.; Meyer, C.K.; Six, J. Soil texture affects soil microbial and structural recovery during grassland restoration. Soil Biol. Biochem. 2010, 42, 2182–2191. [Google Scholar] [CrossRef]
  51. Gorissen, A.; Jansen, A.E.; Olsthoorn, A.F.M. Effects of a two-year application of ammonium sulphate on growth, nutrient uptake, and rhizosphere microflora of juvenile Douglas-fir. Plant Soil 1993, 157, 41–50. [Google Scholar] [CrossRef]
  52. Demoling, F.; Figueroa, D.; Bååth, E. Comparison of factors limiting bacterial growth in different soils. Soil Biol. Biochem. 2007, 39, 2485–2495. [Google Scholar] [CrossRef]
  53. Simon, A.; Sivasithamparam, K. Microbiological differences between soils suppresive and conductive of the saprophytic growth of Gaeumannomyces graminis var. tritici. Can. J. Microbiol. 1988, 34, 860–864. [Google Scholar] [CrossRef]
  54. Duffy, B.K.; Ownley, H.; Weller, D.M. Soil chemical and physical properties associated with suppression of take-all of wheat by Trichoderma koningii. Phytopathology 1997, 87, 1118–1124. [Google Scholar] [CrossRef] [Green Version]
Figure 1. Standard curves of T. velutinum T029 (a) and T. harzianum T059 (b) DNA concentration standards vs. the cycle threshold (Ct) values from a qPCR. Ct values were plotted against logarithmically transformed DNA amounts ranging from 10 ng to 320 ng of genomic DNA·μL−1. The linear regression equation is written in every graph with its linear regression coefficient (R2).
Agronomy 11 00274 g001
Figure 2. DNA concentration (µg·g soil−1) of T. velutinum T029 (a) and T. harzianum T059 (b) development in different soil samples after 15 days. Left: Autoclaved soil: soil sample autoclaved to 121 °C 20 min. Right: Natural soil, soil sample not autoclaved. Upper and lower error bars are represented and indicated standard error of the mean showing the accuracy of the calculations. Differences statistically significant (Tukey’s test p < 0.05) are indicated with different letters; capital letter are differences in natural soils (NS) and small letter are differences between autoclaved soils (AS). The code of each soil is detailed in Table 1.
Agronomy 11 00274 g002
Figure 3. Canonical correlation analysis (CCA) based on soil parameters. (a) Diagram of soil parameters: sand, silt, clay, pH, electric conductivity (EC), soil organic matter (OM), C:N ratio (C:N). (b) Diagram of soil elements: assimilable phosphorus (P), cation potassium (K), calcium (Ca), magnesium (Mg), copper (Cu) and boron (B). Both diagrams Trichoderma development: natural soil T. harzianum (NS T059), natural soil T. velutinum (NS T029), autoclaved soil T. harzianum (AS T059) and autoclaved soil T. velutinum (AS T029).
Agronomy 11 00274 g003
Figure 4. Correlation values of the Canonical Correlation Analysis (CCA) between Trichoderma spp. and soil parameters. Natural soil T. harzianum (NS T059), natural soil T. velutinum (NS T029), autoclaved soil T. harzianum (AS T059). autoclaved soil T. velutinum (AS T029). Electric conductivity (EC), Soil organic matter (OM), C:N ratio (C/N).
Agronomy 11 00274 g004
Figure 5. Correlation values of the Canonical Correlation Analysis (CCA) between Trichoderma spp. and nutrients. Natural soil T. harzianum (NS T059), natural soil T. velutinum (NS T029), autoclaved soil T. harzianum (AS T059). autoclaved soil T. velutinum (AS T029). Assimilable phosphorus (P), the cations potassium (K), calcium (Ca), magnesium (Mg), copper (Cu) and boron (B).
Agronomy 11 00274 g005
Table 1. Places and code of the soil sampling used for this study.
Productive ZoneCodePlaceCrop
AstorgaA1Otero de EscarpizoPhaseolus vulgaris (Bean)
A2Otero de EscarpizoTriticum aestivum (Wheat)
A3Sueros de CepedaP. vulgaris (Bean)
La BañezaB2San Juan de TorresP. vulgaris (Bean)
La CabreraC1CastrocontrigoP. vulgaris (Bean)
C2CastrocontrigoSolanum tuberosum (Potato)
Esla-CamposE1Jabares de los OterosP. vulgaris (Bean)
PáramoP1Bercianos del PáramoP. vulgaris (Bean)
P2Bercianos del PáramoHelianthus annus (Sunflower)
P3Bustillo del PáramoP. vulgaris (Bean)
P4La Milla del PáramoBeta vulgaris (Beat)
P5La Milla del PáramoP. vulgaris (Bean)
Table 2. Physicochemical characteristics of soil samples.
IdSand
(%)
Silt
(%)
Clay
(%)
TexturepHCEC
(cmol kg−1)
EC
(dS
m−1)
OM
(%)
Ctotal
(%)
Ntotal
(%)
C/NP
(ppm)
K
(ppm)
Ca
(ppm)
Mg
(ppm)
K/MgCa/MgNa
(ppm)
Mn
(ppm)
Fe
(ppm)
Cu
(ppm)
Zn
(ppm)
B
(ppm)
A138548Silt loam6.236.790.152.671.500.1411.2246.53175.94843.64108.161.637.8045.9822.2346.371.322.240.61
A240528Silt loam6.094.920.071.811.070.138.1162.36191.58661.2975.352.548.7813.7918.9855.841.702.560.38
A3385012Silt loam5.253.690.193.582.080.219.9051.18293.24446.8754.695.368.1720.6932.7440.111.111.140.29
B254388Sandy loam6.634.940.081.150.670.078.9428.0578.20733.4386.280.918.5011.4919.1735.130.940.760.28
C1404614Loam4.584.010.304.312.470.2111.8196.67308.88529.0369.274.467.649.2048.5391.691.302.180.25
C2464014Loam4.904.700.324.512.660.2013.0986.27312.79615.2072.924.298.4422.9937.6175.921.182.300.28
E1483220Loam7.798.460.171.220.820.107.0031.93152.482941.73149.481.0219.6818.3918.6314.200.630.660.43
P1523612Sandy loam6.917.050.110.620.810.103.5327.90160.301128.20132.461.218.5213.7932.5233.970.880.670.41
P258348Sandy loam7.455.520.050.270.450.072.2536.9074.29839.63138.540.546.069.2014.7422.110.640.960.50
P364306Sandy loam5.663.320.090.620.540.084.3877.73215.04442.8634.036.3213.022.3041.2964.330.931.200.48
P4603010Sandy loam6.137.710.080.970.890.114.9452.11187.671180.30134.891.398.7513.7925.7350.150.550.920.50
P5543412Sandy loam7.067.440.090.560.770.113.0669.19226.771102.15115.451.969.5513.7923.9831.900.901.280.65
Code of the soil sampling used for this study and described in Table 1 (A: Astorga, B: La Bañeza; C: La Cabrera; E: Esla-Campos; P: El Páramo); The results were obtained following the procedure described in Section 2.4. Physicochemical analysis of soils. Texture soil; Cation exchange capacity (CEC), electric conductivity (EC), soil organic matter (OM), nitrogen (Ntotal) and carbon (Ctotal) content, C:N ratio (C/N), assimilable phosphorus (P), the cations potassium (K), calcium (Ca), magnesium (Mg) and sodium (Na), K:Mg ratio (K/Mg), Ca:Mg ratio (Ca/Mg), and the microelements manganese (Mn), iron (Fe), copper (Cu), zinc (Zn) and boron (B).
Publisher’s Note: MDPI stays neutral with regard to jurisdictional claims in published maps and institutional affiliations.

