Article

Investigation of the Effect of Slurry, Combined with Inorganic N Rate and Timing, on the Yield of Spring Barley Post Cover Crop of Stubble Turnips

1
Agri-Food and Biosciences Institute, Crossnacreevy BT6 9SH, UK
2
Institute for Global Food Security, School of Biological Sciences, Queen’s University Belfast, Belfast BT9 5DL, Northern Ireland, UK
3
Formerly-Agri-Food and Biosciences Institute, Crossnacreevy BT6 9SH, UK
*
Author to whom correspondence should be addressed.
Agronomy 2021, 11(2), 232; https://doi.org/10.3390/agronomy11020232
Submission received: 16 December 2020 / Revised: 8 January 2021 / Accepted: 19 January 2021 / Published: 27 January 2021
(This article belongs to the Special Issue Impacts of Cover Crop Management Strategies on Soil Health)

Abstract

:
Integration of cover crops into arable rotations over winter results in difficulty in determining the nitrogen (N) requirement for the following commercial crop. The region of Northern Ireland (NI) has had no previous field research on cover crops and how they may affect N supply to the following commercial crop. Stubble turnips (Brassica rapa oleifera L.) were sown as a cover crop, after the harvest of winter barley (Hordeum vulgare L.) and retained over winter. Prior to planting the stubble turnips, pig slurry was applied to maximise cover crop growth. The stubble turnips accumulated 111 and 150 kg N/ha in their biomass. This equates to 79 and 107% of the N requirement of a 5 t/ha spring barley crop, if this N is released sufficiently. In this experiment, the cover crop of stubble turnips was over-sown with spring barley and supplemented with different rates of organic manures (either applied at 50 m3/ha of pig slurry or not applied), and inorganic N fertiliser (0, 70 and 140 kg N/ha), at two different timings (early or late). In the two experimental years, additional N supplied in the form of inorganic N or organic manures, did not significantly enhance spring barley yields. No control area of fallow was included in this trial. However, this study demonstrates that in this region there may be a greater rate of N release from the cover crop of stubble turnips than estimated due to agronomic management practices applied and conducive climatic conditions. This means that in this study location, a reduced N rate programme supplemented to the spring barley is possible, which lead to considerable financial savings.

1. Introduction

1.1. Cover Crops

Cover crops are planted following the harvest of arable crops as an alternative to leaving land fallow over winter. They provide a mechanism of greater crop and soil sustainability through beneficial effects which include weed suppression [1], disease and pest suppression [2], reduced nitrogen (N) and phosphorous (P) leaching [3], increasing overall nutrient cycling [4], and can also enhance soil biological activity [5]. Keogh [6] found a 55% drop in dry matter yield of stubble turnips (Brassica rapa oleifera L.) (Variety: Delilah) when planting was delayed from 1 August to 31 August in Ireland. This shows that sowing cover crops early is essential to produce large amounts of biomass. Furthermore, early sowing and species with a fast growth rate potential are required for effective weed suppression [1], organic matter return and N uptake [7]. Therefore, to enhance the benefits from cover crops, management practices should ensure high biomass production to maximise N uptake which is also essential to reduce N leaching [8]. Cottney [9] found, that the brassica, stubble turnips are the most common cover crop species in Northern Ireland (NI), and are typically sown after the commercial crop of winter barley (Hordeum vulgare L.).
The Nutrient Management Guide (RB209) provides fertiliser recommendations for a broad range of crops in the United Kingdom, taking account of not only soil type and rainfall but also historic management such as previous crops grown and nutrient additions made [10]. It indicates that stubble turnips (assuming a soil N index of 1 following winter cereals on a high rainfall site (with over 700 mm annually and 250 mm excess over-winter rainfall) requires an additional 80 kg/ha of N to maximise growth [10]. This demonstrates that stubble turnip growth will be limited by N, if planted early, following the harvest of arable crops such as winter barley. NI produces 10 million tonnes of slurry annually [11]. Consequently, this abundant by-product could be used to supplement the limited soil N to maximise the biomass of the stubble turnips. Autumn applications of manures/slurries have low utilisation efficiency due to leaching, providing 5–35% of N to the subsequent crop compared to a 50–60% efficiency of N following spring applications [10]. Cover crops (stubble turnips) planted in autumn have the potential to accumulate N from the slurry in their biomass and could provide the mechanism to increase biomass growth and N uptake [12]. Parkin [13] found that the N uptake of rye (Secale cereale L.) increased from 2.95 g/m2 to 10.7 g/m2 when 19.5 g/m2 was added through pig slurry, and that this resulted also in decreased leaching in comparison to fallow land. Biomass increases of 50–130% were found in species perennial ryegrass (Lolium perenne L.), oilseed radish (Raphanus sativus L.) and oats (Avena sativa L.) in response to slurry which, again, reduced leaching compared to fallow land [14]. However, it has been reported that the rate at which the incorporated residue of non-leguminous cover crops mineralises is both too low and insufficient to transfer considerable amounts of N to the commercial crop [14,15].
A meta-analysis by Miguez [16] found that corn yield reductions were observed after a cover crop of cereal rye. However, a legume cover crop showed a yield increase in the commercial crop of corn. Abdalla [17] found that non-leguminous cover crops decreased soil mineral N (SMN) content below that of fallow, which reduces the likelihood of N leaching but risks N being immobilised post incorporation of the cover crop residue. This is due to competition between roots for inorganic N and soil microbes which respond to the influx of residue from the incorporated cover crop. [18,19,20]. This can result in immobilisation of N within the microbial biomass [21] which decreases the supply of N to the commercial crop [20,22,23] and can negatively impact yields [24]. Kaye [25] found that cereal rye cover crop reduced maize (Zea mays L.) silage N uptake by 40 kg/ha. In comparison, legume cover crops fix additional N and also their residue can decompose/mineralise faster, resulting in greater N supply to the commercial crop which has been reported to increase yield [26,27].
The rate of mineralisation can be summarised as: Total N accumulated x Speed of breakdown = Total N supplied [28]. It is dependent on a range of factors, such as soil temperature, soil moisture, soil texture, carbon: nitrogen (C:N) ratio of the residue, SMN, particle size of residue, proportion of structural compounds, and amount of soil contact [29]. This causes considerable difficulty in estimating supply to the commercial crop to effectively supplement its nutrient requirement. N mineralisation models of cover crops do concur that C:N ratio is the most indicative measure to estimate breakdown [4,30,31]. However, it only really compares breakdown of N between species and is relatively inconclusive to indicate N fertiliser strategies on-farm. This arises from the inability to predict the weather over the growing season, which affects many parameters that influence mineralisation [32]. This limits knowledge of the N fertiliser regime to implement post cover crops and how to manage the commercial crop for maximal yield without overusing N fertiliser.
Using the equation by White [28], increasing N acquired and integrating low C:N ratio cover crops species will increase the amount of N mineralised. This could facilitate a reduced-rate fertiliser programme for subsequent crops. The reduction of soil mineral nitrogen following the use of cover crop found in many studies [3,4], along with uncertainty of timing when nutrients will be available, warrants investigation of the rate of N fertiliser required, as well as the effect of timing on the subsequent crop.

1.2. Scope of Trial and Hypothesis

This study aims to investigate the most appropriate fertiliser strategy for a spring barley commercial crop after a cover crop of stubble turnips. Fertilisers used incorporate both inorganic and organic N to maximise spring barley yield. Treatments applied include: a plus/minus treatment of slurry; 3 rates of N: 0, 70 (half rate) and 140 kg/ha (full rate); and two different timings of fertiliser; either mid tillering (early) or during stem extension (late) of the spring barley. Stubble turnips (cv. Avalon) were chosen for their fast growth rate, high N acquisition rate [7], inexpensive seed, and because they are the predominant species used as cover crops in NI. Slurry was applied pre-cover crop to supply nutrients and maximise biomass growth, as suggested by the RB209 Nutrient Management Guide [10]. The following hypothesis include:
  • The stubble turnip cover crop will allow for a reduced-rate fertiliser regime.
  • The application of slurry to the spring barley will ensure that crop-available N will not be affected by N immobilisation and will show a yield increase over using no slurry.
  • Early N will lead to a greater grain yield than late N application due to low initial N mineralisation from the stubble turnips.
  • Additional N, supplied through slurry and/or inorganic N, will increase grain yield and N uptake due to N mineralisation of the stubble turnips being insufficient to support maximum spring barley yield.

2. Material and Methods

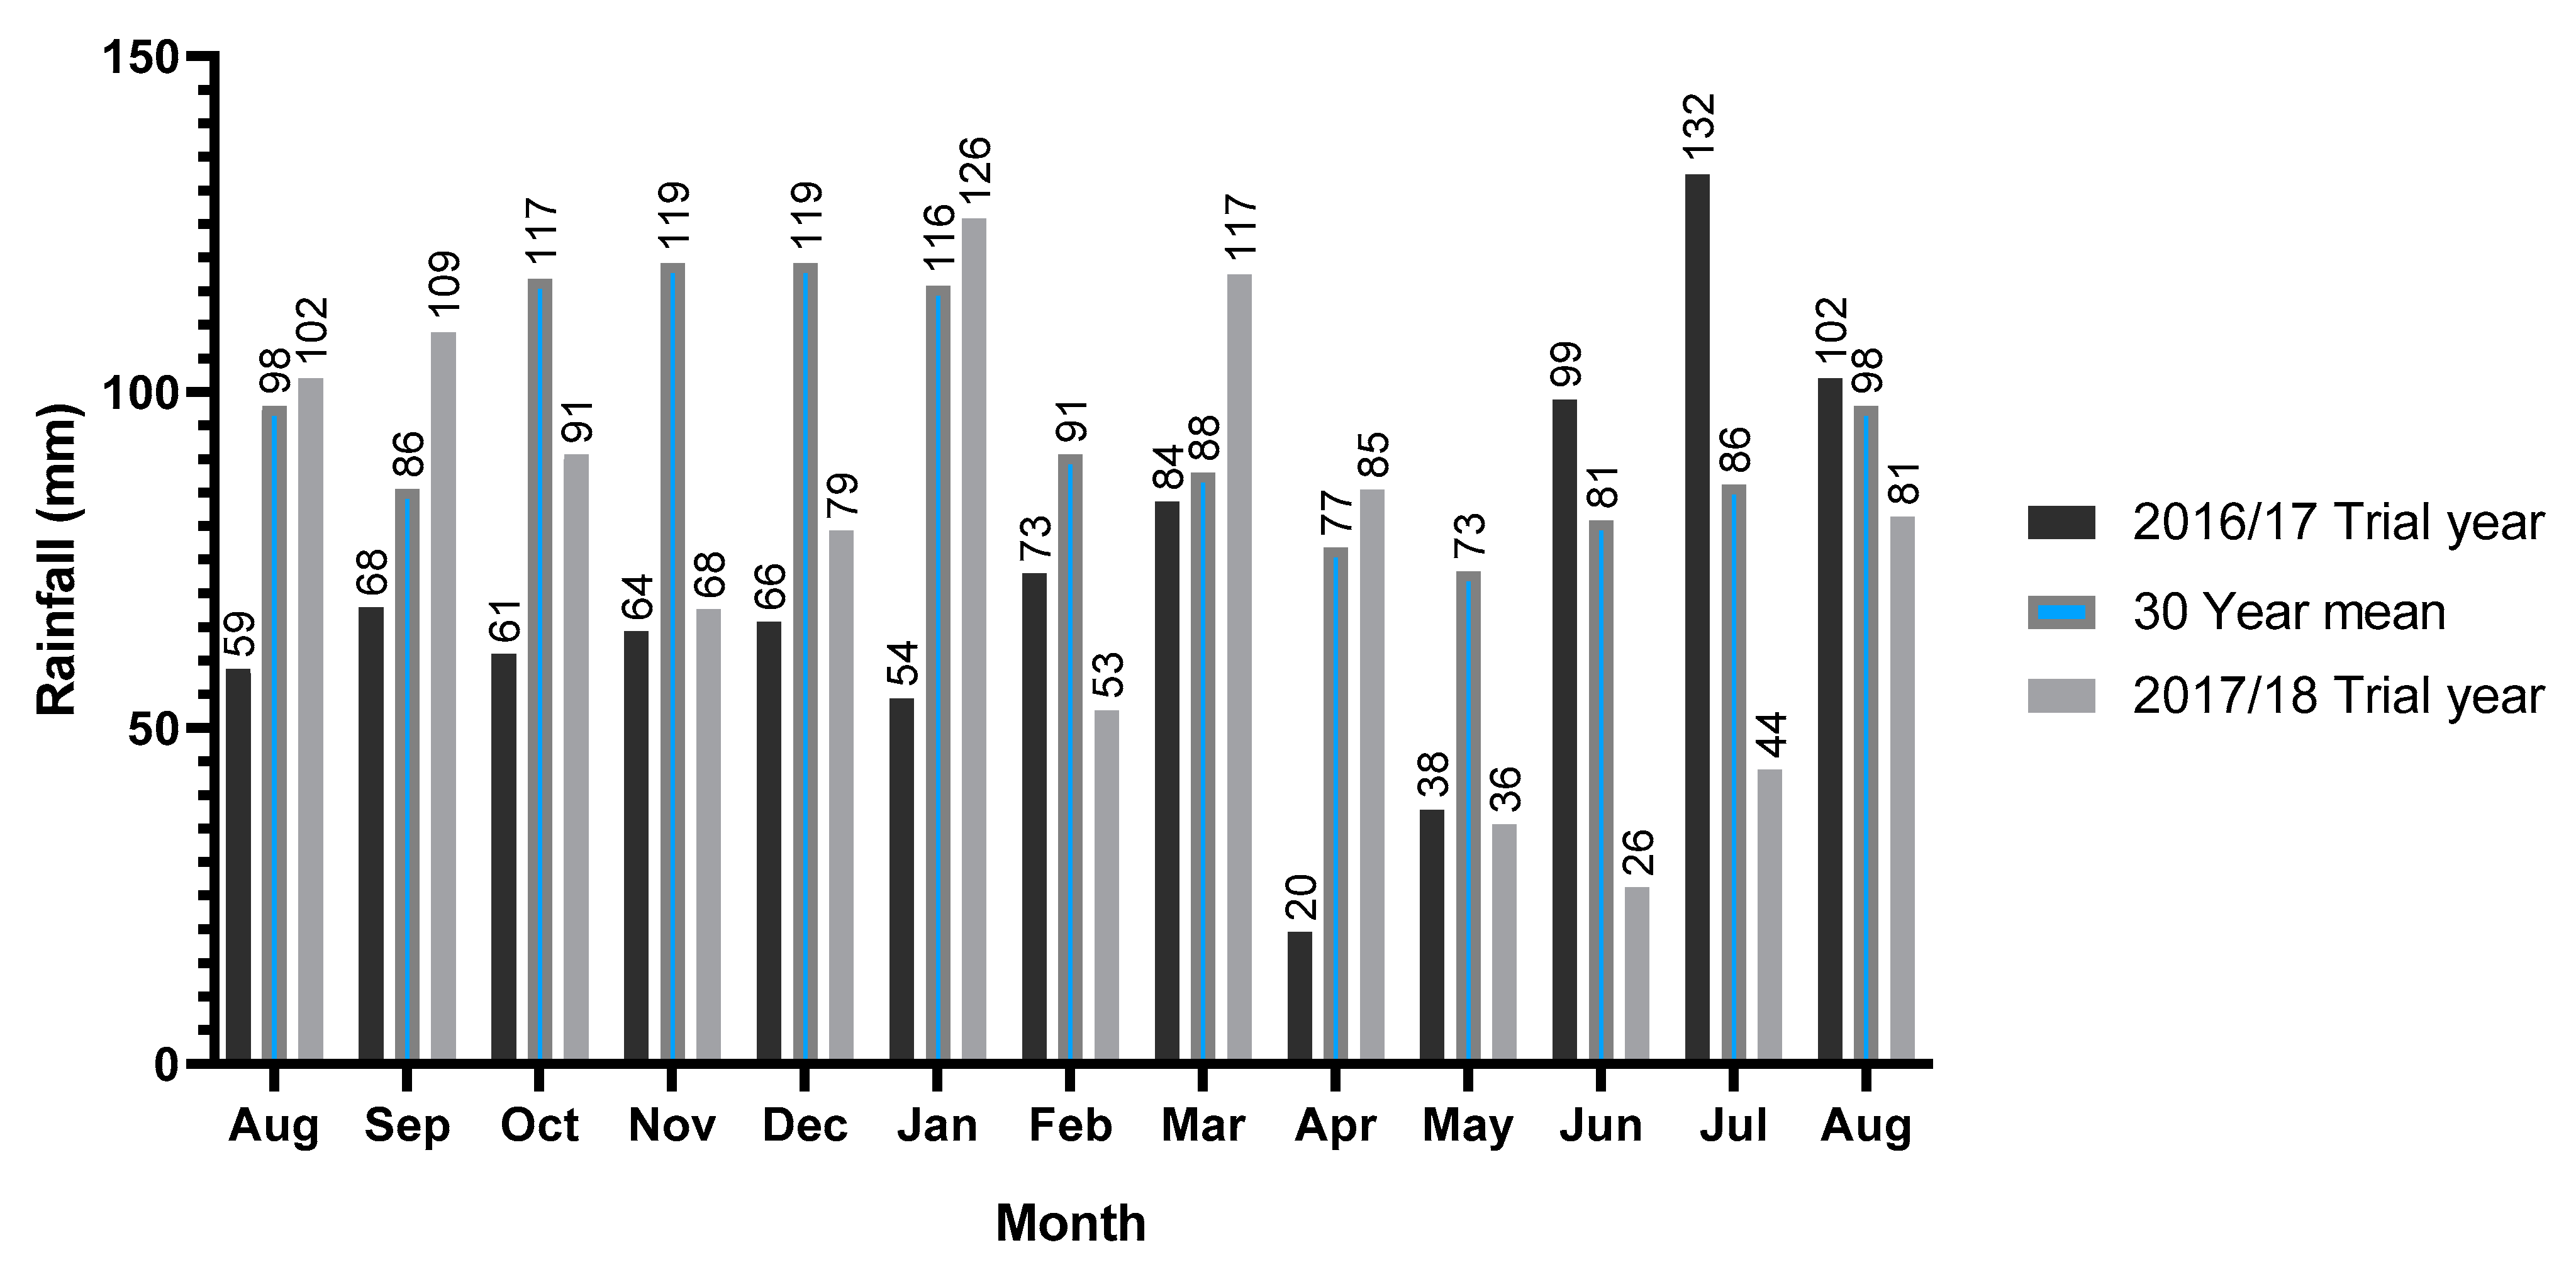
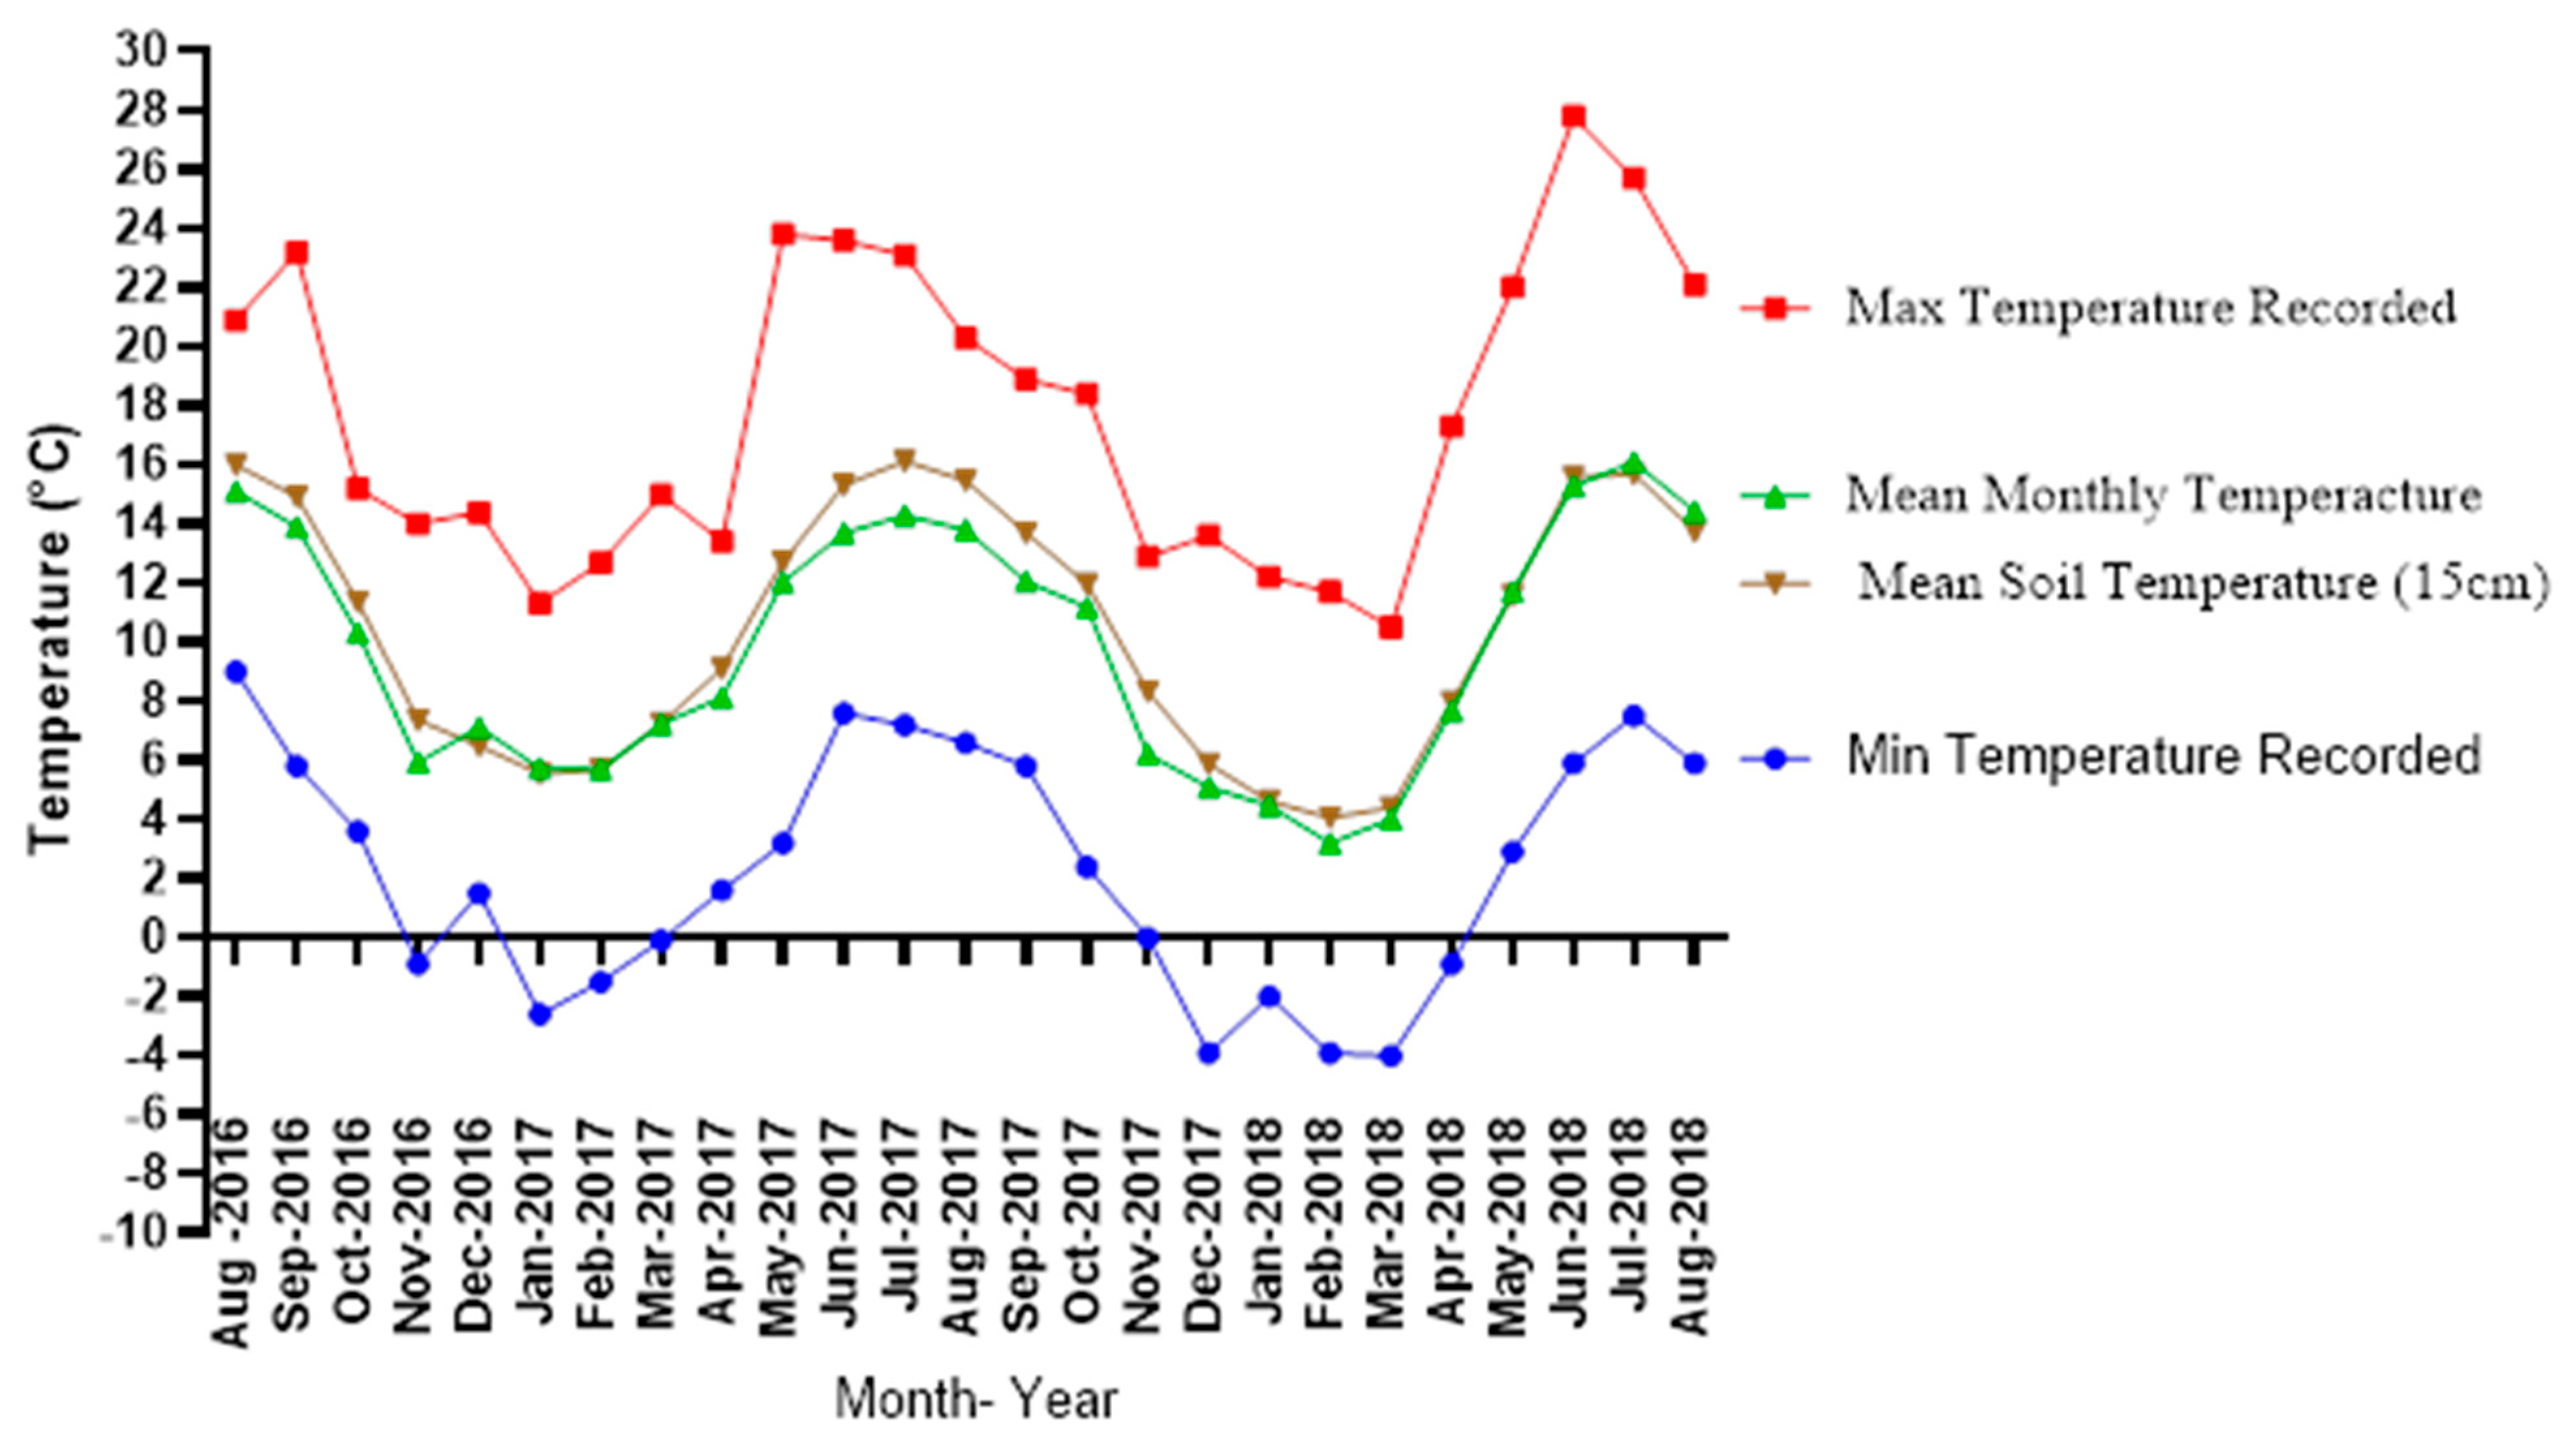
2.1. Site Description and Sowing of Stubble Turnips

Trial sites were located in Hillsborough, Co. Down, NI in two different fields across two different years, autumn 2016/17 (latitude: 54.438902, longitude: −6.087819) and autumn 2017/18 (latitude: 54.446018, longitude: −6.100358). The soil was a silty clay loam at both sites and its analysis before the spring barley was sown is shown in Table 1.
Pig slurry was applied at a rate of 44.3 m3/ha and 37.3 m3/ha on the 13 and 10 August in 2016 and 2017, respectively, using a standard splash-plate tanker (Ruscon, Drogheda, Ireland). Nutrient applications are shown in the Appendix A Table A1. The field was cultivated with a standard pigtail harrow (Massey Ferguson, Coventry, UK) to 15 cm depth and stubble turnip seed (cv. Avalon) was broadcast on top at 9 kg/ha, then consolidated with a ring roller. Previous rotations were 4 years of cereals on each site.

2.2. Cover Crop Measurements

Biomass was measured by harvesting above-ground biomass from ten 0.7 m × 0.7 m quadrats on the 15 February 2017 and 26 February 2018. Roots were dug out of the soil within these quadrats, extracting the stem and main root which was subsequently washed. Dry matter (DM) was determined by drying the samples at 60 °C for 48 h, until constant weight. Plant fractions were milled with a Cyclotec 293 (FOSS, Hilleroed, Denmark) equipped with a 1 mm screen (Table 2). N and C content was analysed by the Dumas dry combustion method using a Trumac CN analyser (Leco Corporation, San Joseph, MI, USA) with a furnace temperature of 1350 °C. Quality controls included an in-house verified reference material run with every 20 samples. Accumulated N uptake was calculated as percentage N (% N) multiplied by biomass.

2.3. Commercial Crop Experimental Design

A randomised factorial design could not be implemented due to the practicalities of applying the slurry before ploughing. Furthermore, a control ‘of no fallow’ could not be implemented due to the whole field being sown to a cover crop of stubble turnips, with the trial designed after sowing as part of a PhD project, which therefore limited the number of years possible for replication. Table 3 shows the randomised experimental design implemented in 2016/17. Slurry was randomised in columns, and the rates of N were randomised across the rows (Table 3). Guard plots between columns were included to reduce any drift of slurry or runoff. These are not shown in Table 3.
Treatments applied included three rates of N 0, 70 and 140 kg/ha, along with a plus/minus slurry application. The fertiliser was applied through adding calcium ammonium nitrate (Yara, 27% N), 70 kg/ha early (70 E), or 70 kg/ha late (70 L), or 140 kg/ha early and late (70 E + 70 L), which also created a 0 kg/ha plot (0). Each treatment had four replicates.
In 2017/18, the experiment was modified to a split-split plot design (Table 4). The difficulty of applying slurry prior to ploughing and over-sowing the trial area with spring barley plots, and supplementing different rates and timings of N, meant that a split-split plot design was used rather than a randomised factorial design. Mead [33] outlined how split-plot designs are most appropriate for trials where treatments applied have practical problems that mean they cannot be fully randomised within a model. The author also outlined how treatment within split-plot designs should also take into account that the whole-plot has the least precision, requiring larger differences to identify them as significantly different. This means the first treatment must be the one that is of least interest and will have the greatest effect on means. For this reason and due to practicalities, slurry was chosen as the whole-plot treatment. Due to space limitations, only two replicates were possible in 2017/18, in comparison to four in 2016/17.
AGHIERARCHICAL GenStat v18 [34] was used to generate a split-split plot design, with two blocks and four treatments. The division of the whole-plot was +/- slurry, with sub plots 70 E and sub-sub plots 70 L giving the timings, along with a 0 N kg/ha N and a 140 kg/ha N (70 E + 70 L) application of fertilizer.

2.4. Cultivation

The stubble turnips were flail mulched to destroy the crop on the 18 February 2017 and 27 February 2018. Glyphosate was applied at 2 l/ha (360 g/l active ingredient) to kill residual growth and weeds on 27 March 2017 and 26 March 2018. Slurry was applied in strips on 11 April 2017 and 30 April 2018 at a rate of 50 m3/ha, using a metered dribble bar system (SlurryKat, Waringstown, NI) (Table A1). N availability from the slurry was estimated using the RB209 Nutrient Management Guide [10] at 50% of total nutrient supply according to its analysis (Table A1). The land was then ploughed, power harrowed parallel with the slurry application and sown with a Wintersteiger plot sower. Guard plots were sown to prevent any cross contamination where soil with slurry applied could affect non-slurried plots. The cultivar KWS Irina spring barley was sown to account for its thousand grain weight to give a target population of 320 seeds/m2 assuming 85% germination, on the 30 April and 5th May in 2017 and 2018, respectively. A standard commercial spray programme was used in both years to control weeds, pests and disease.

2.5. Fertiliser Application

In 2017, fertiliser was applied on 18 May and 30 May at growth stage (GS) 21 and 30, respectively. In 2018, a wet winter delayed planting and the subsequent dry summer meant that the interval between fertiliser applications was longer (Figure A1 and Figure A2). Application dates were 25 May and 21 June, equivalent to GS 23 and 39, respectively.

2.6. Damage Scoring Spring Barley

In 2016/17, adverse weather resulted in damage to the spring barley straw. Prior to harvest, each year, the straw damage was assessed for shedding of ears (1–9), lodging (%), leaning (%), necking (%) and brackling. Total damage (%) was calculated from the sum of lodging (%) and leaning (%).

2.7. Harvest

A Sampo plot combine (Pori, Finland) was used to harvest the plots. Each plot was measured for its final length and was multiplied by the width (1.83 m). This gave an average yieldable area of 1.83 m × 11.5 m (equivalent to 21.05 m2). A grab sample was taken from each plot using Gardena shears (Durham, England) to cut a cross-section row (50 cm) across the plot. Grain and straw were dried at 80 °C for 48 h until no further weight change. Grab samples were threshed to separate the spring barley into its fractions of grain, straw and chaff. Each fraction was dried using the same conditions as the grain and weighed to obtain the harvest index (grain weight/grain + straw + chaff weight * 100). This allowed straw yields to be calculated from plot grain yields by applying the relative percentage obtained by the harvest index.
The spring barley N offtake was calculated by multiplying the biomass of each fraction (grain and straw) by its relative % N. Each fraction was milled and determined for N concentration by the same methods described in Section 2.2.

2.8. Apparent N Recovery

The apparent N recovery (%) of N the applied from slurry was calculated by dividing the N applied by total N recovered in the stubble turnips and spring barley. The calculation does not account for N losses from the applied slurry due to immobilisation, volatilization or leaching.

2.9. Statistical Analysis

Restricted Maximum Likelihood (REML) was used to analyse the 2016/17 data due to the unbalanced design. Fixed terms were the main effects of slurry and their interaction with the treatment of N. In 2017/18, the split-split plot design data was analysed using analysis of variance (ANOVA).
Treatment means were only considered significant if the differences occurring by chance were less than 5% (p < 0.05). Fishers protected post-hoc is applied to discriminate significant differences between means when the overall effect is significant. All analyses was conducted using Genstat [34].

3. Results

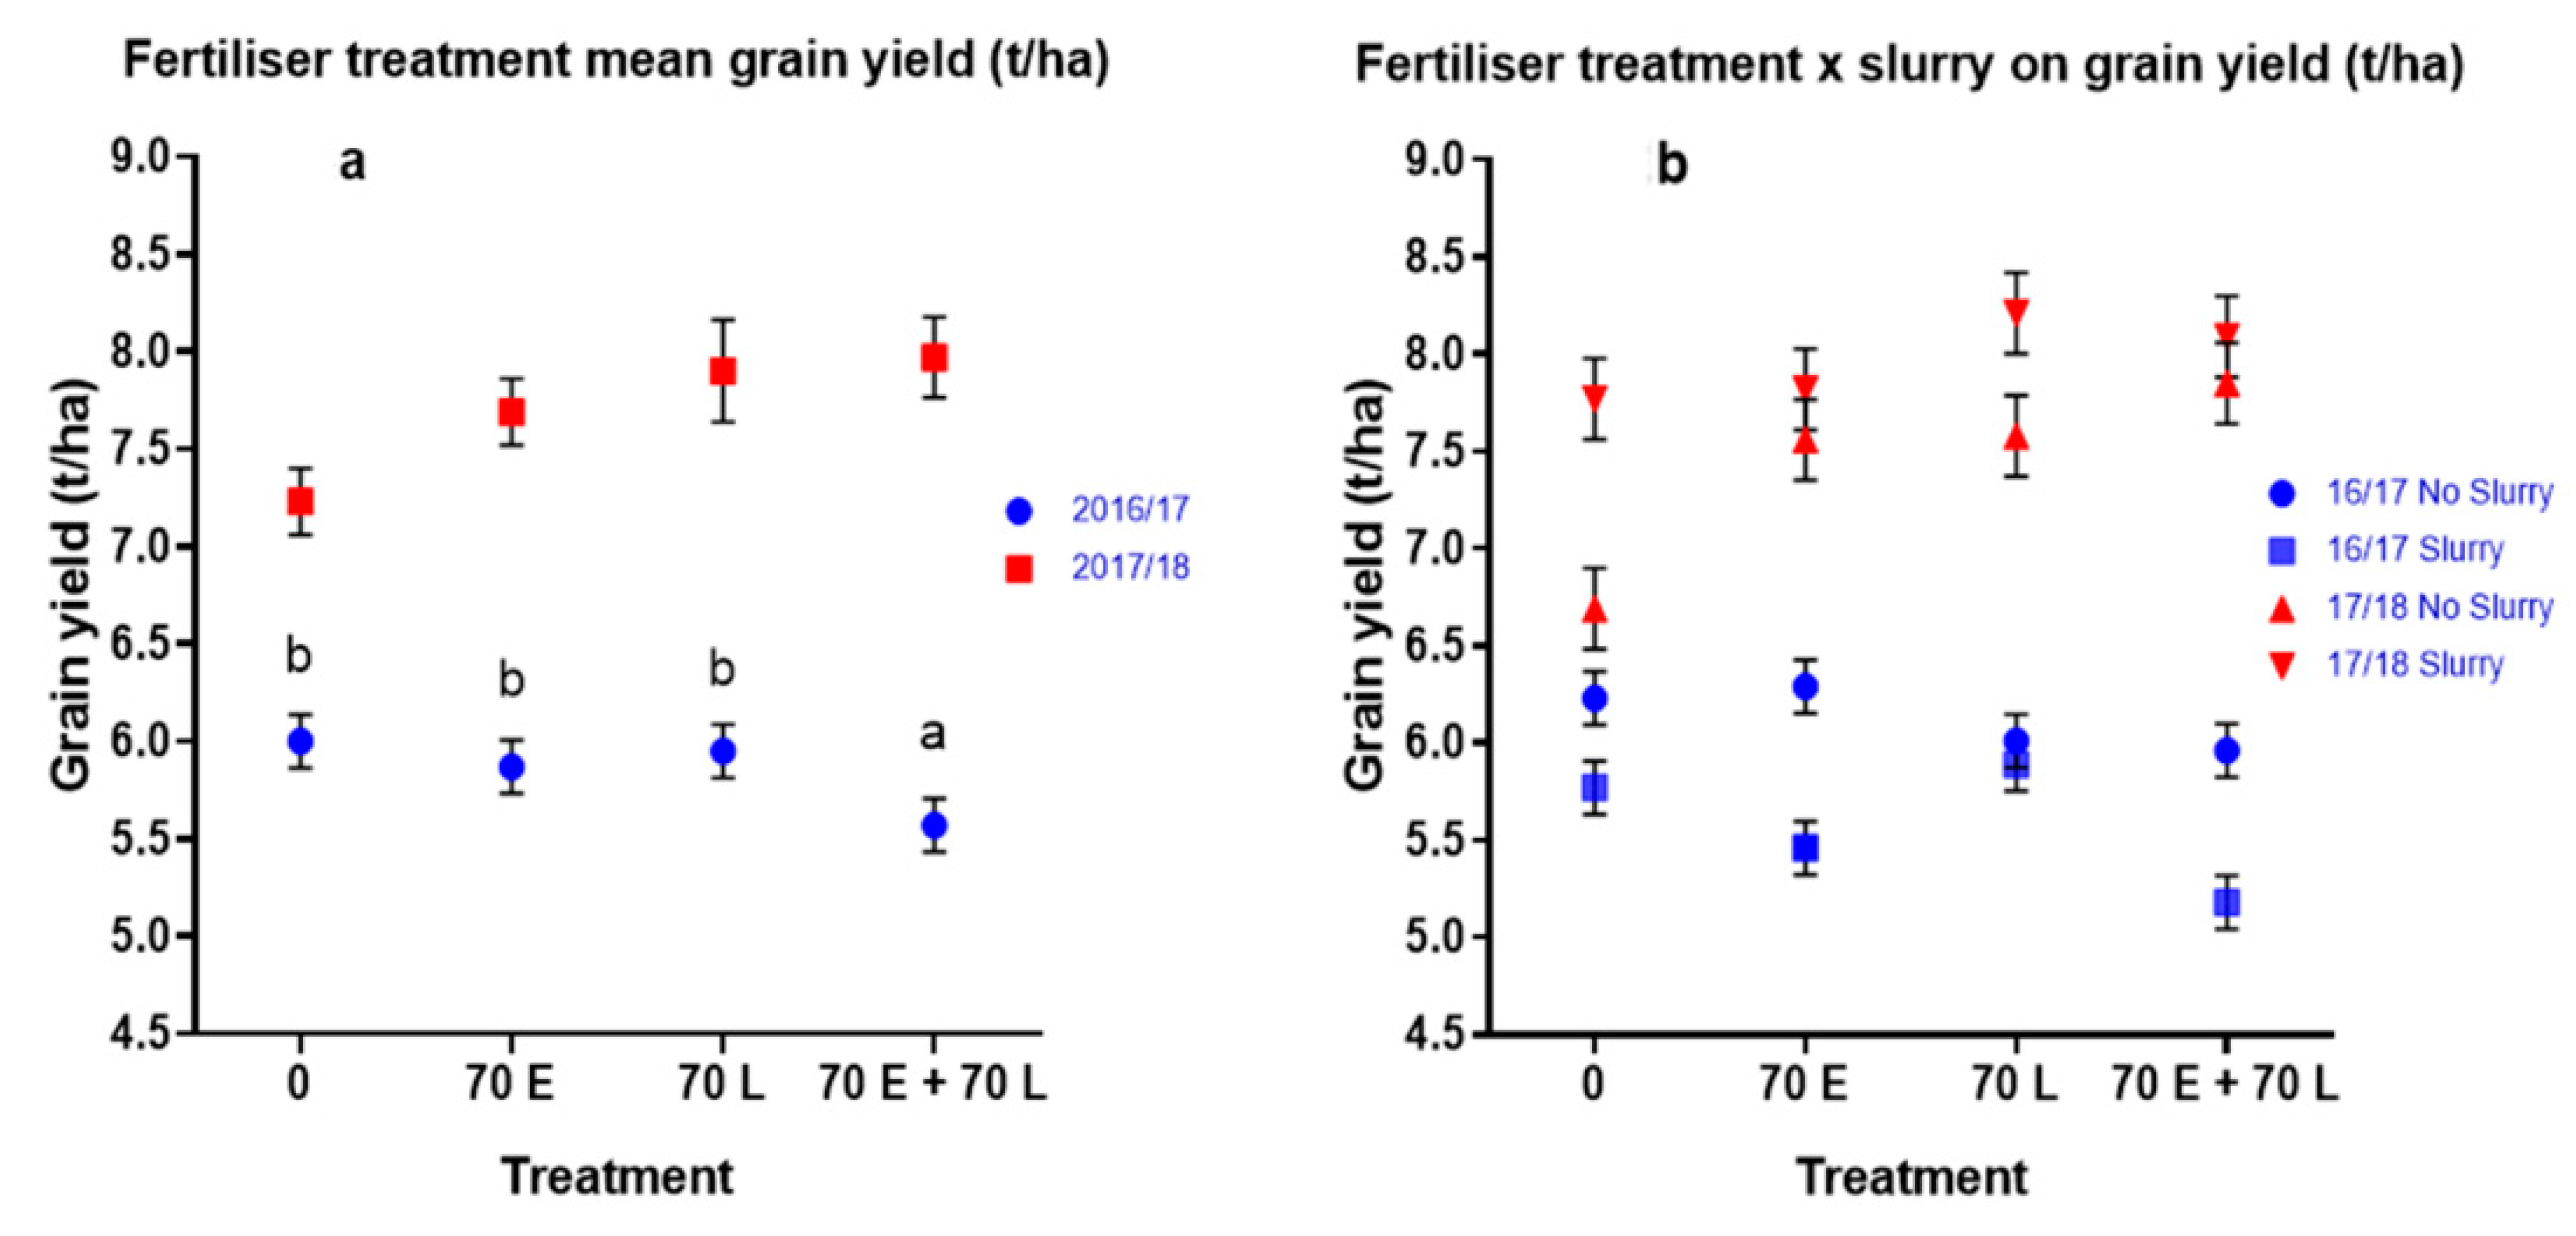
3.1. Grain and Straw Yield (t/ha)
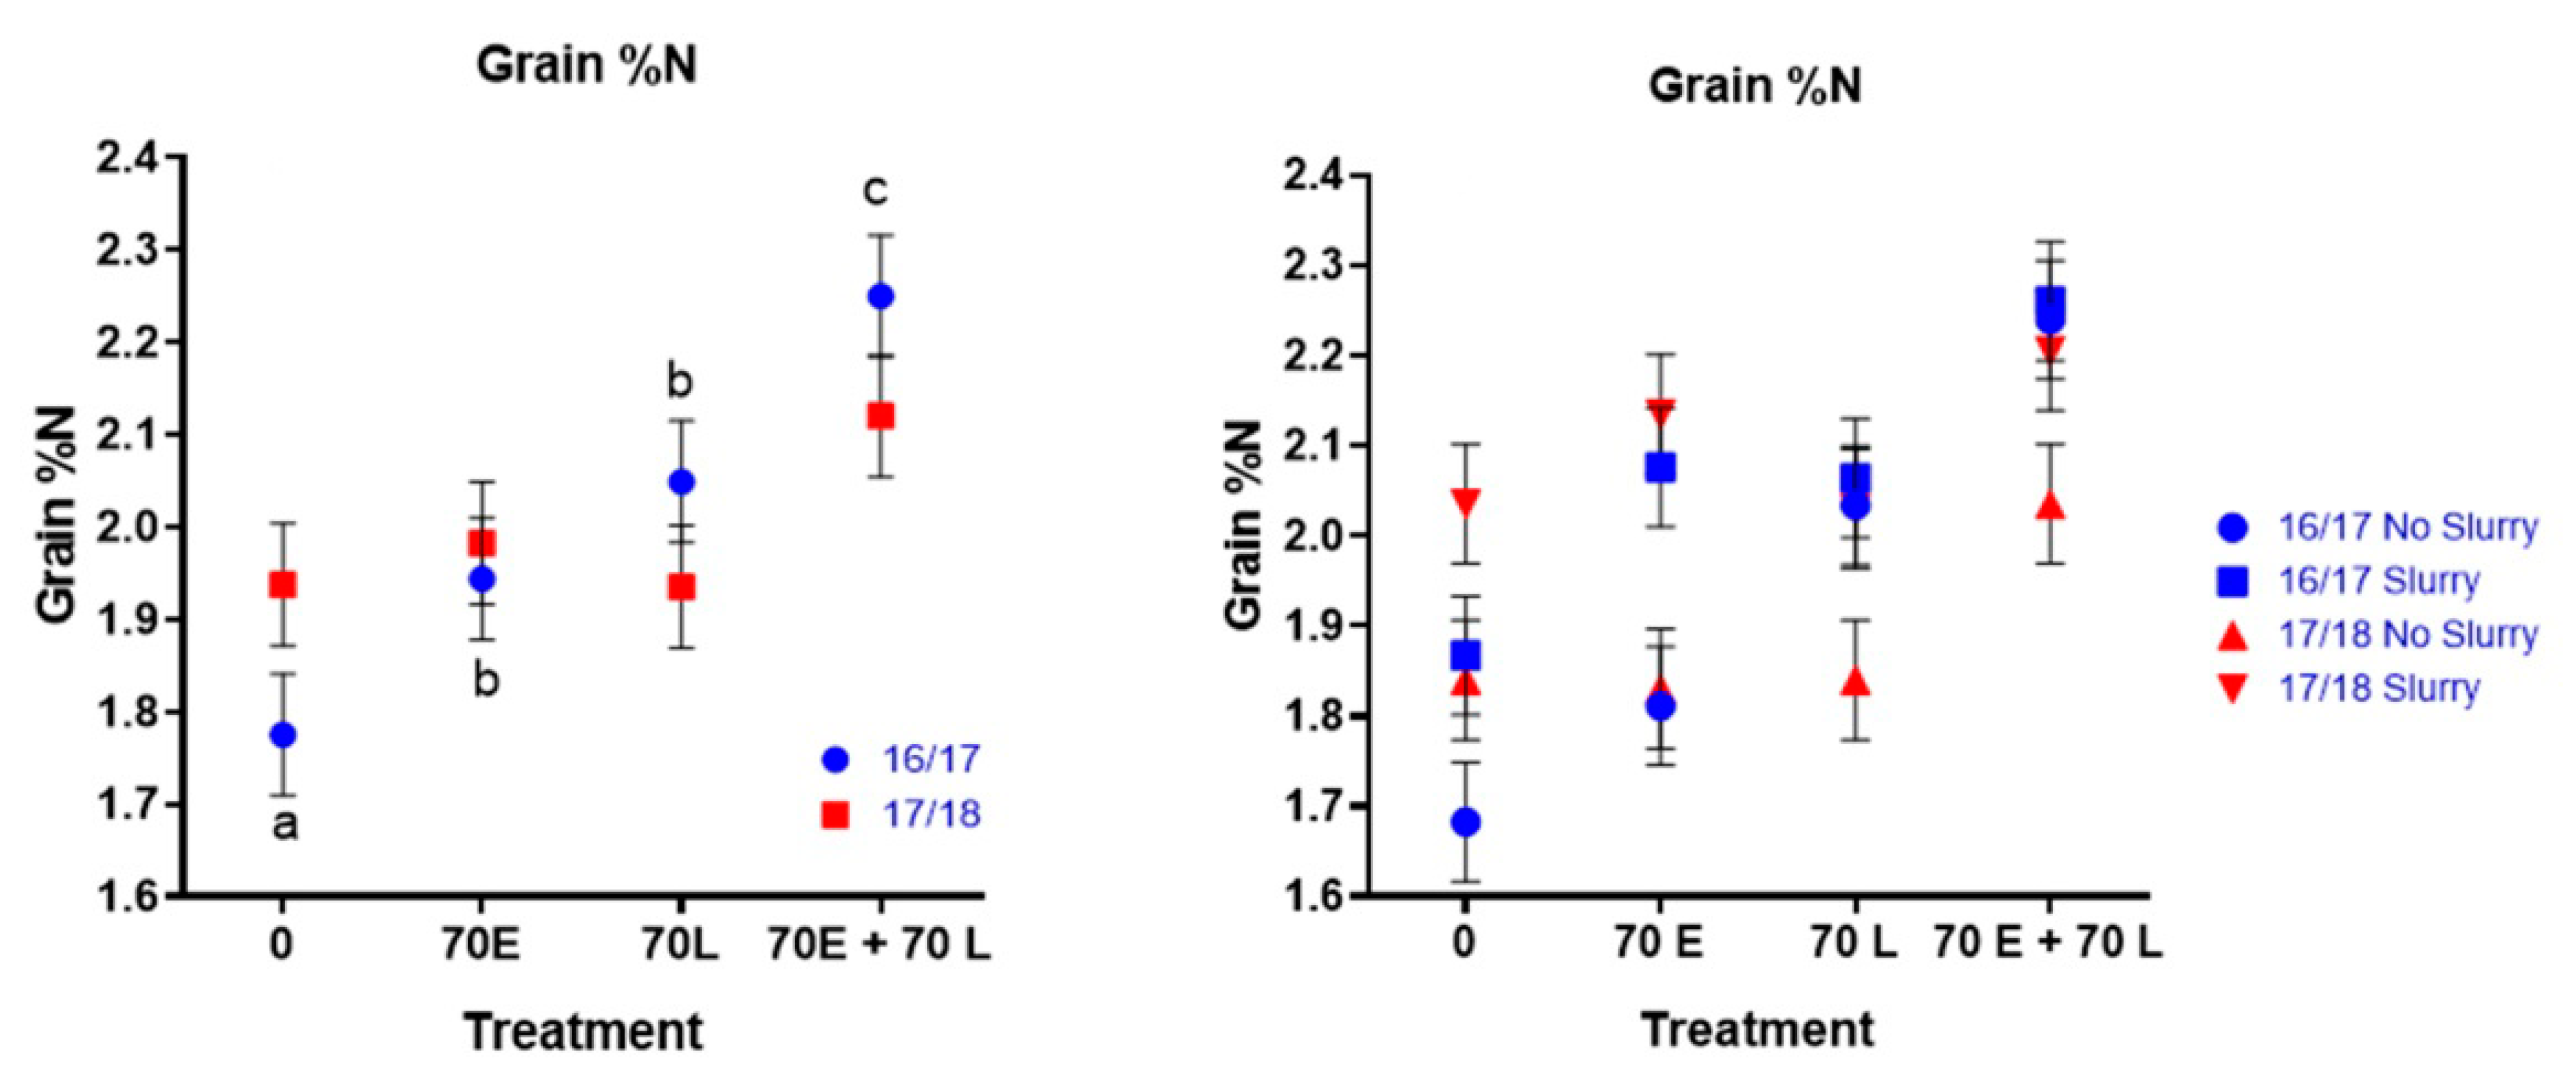
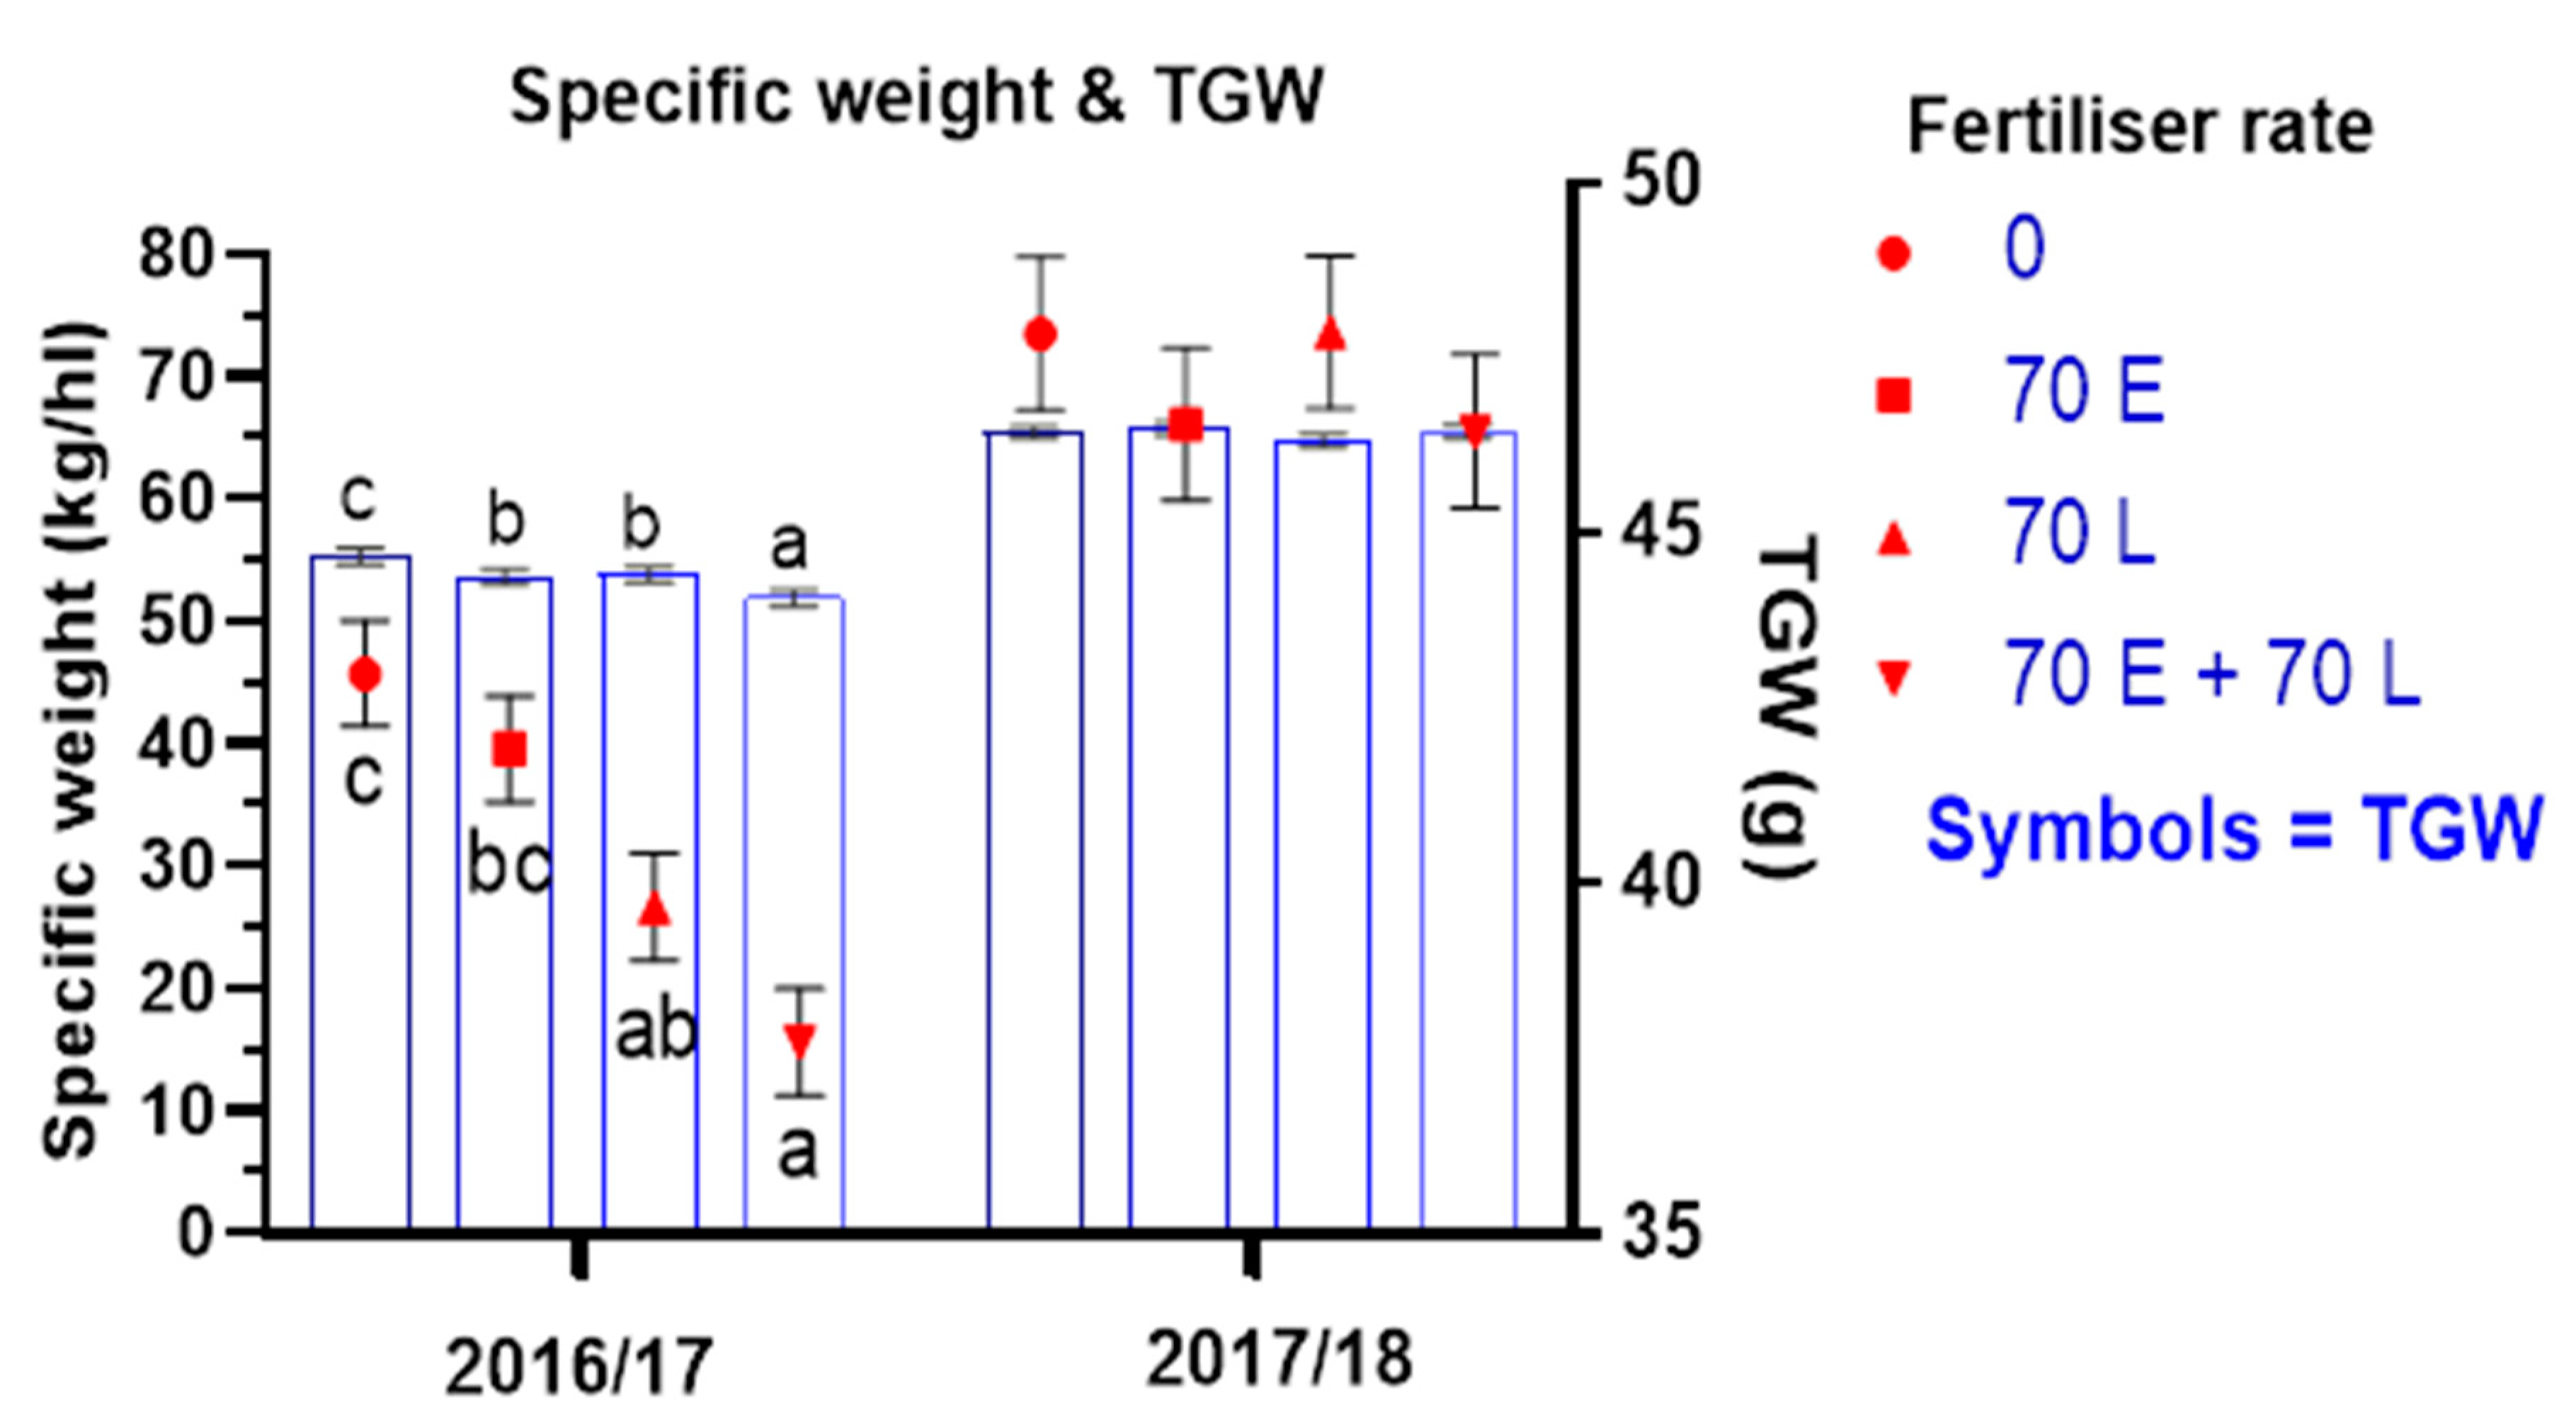
An average grain yield of 5.85 t/ha was recorded in 2016/17 (Figure 1). Slurry exhibited a significant effect in 2016/17 of reducing mean yield from 6.12 to 5.57 t/ha (p < 0.05). Moreover, additional fertiliser numerically reduced yield (in 2016/17 only). The 0 kg/ha rate led to the greatest grain yield, and a 70 E + 70 L significantly (p < 0.05) reduced yield (Figure 1 and Table 5). In 2016/17, wet weather caused high levels of lodging, brackling and necking which were detrimental to grain yields.
The 2017/18, yield for all treatments, and subsequent mean yield (7.7 t/ha), was much higher than in 2016/17 (Figure 1). In 2017/18, yield was significantly (p < 0.05) affected by 70 L application of fertiliser with an average yield of 7.9 t/ha (Table 6). This was a 0.82 t/ha increase in yield over the Nil Slurry + 0 kg/ha N. The application of slurry on a 0 fertiliser rate numerically increased the yield by 1.08 t/ha, although, on average, the overall effect of slurry was not significant. There were no significant effects detected between the different treatments and their interaction. Straw yields in 2016/17 were unaffected by treatment but, in 2017/18, straw yields were significantly (p < 0.05) higher with 70 E, 70 E × Slurry, and 70 L (Table 5 + Table 7).

3.2. Grain Quality

Mean grain % N, overall, was 2.00% in both 2016/17 and 2017/18. In 2016/17, slurry increased average % N (p < 0.01) (Table 8) but, in 2017/18, its overall effect was insignificant (Table 9). In 2016/17, fertiliser treatment effect was highly significant (p < 0.001), whereby increasing the rate of inorganic N increased % N but only 0 and 140 kg/ha N were significantly different (p < 0.05) to each other (Figure 2).
In 2017/18, only 70 E displayed a significant increase (p < 0.001), whereas 70 L, and 70 E + 70 L did not have any significant effect on % N. The 70 L, and 70 E + 70 L exhibited a tendency p = 0.097 and p = 0.089, respectively, for the higher rate increasing % N. The treatment 70 E + Slurry significantly (p < 0.05) increased grain % N in comparison to 70E + Nil Slurry and 0 N + Nil Slurry.
In 2016/17, the specific weight was affected by both slurry (p < 0.05) and N treatment (p < 0.001) (Table 8). The effects observed were that the increased rates of N and application of slurry reduced the specific weight of the grain (Figure 3). The greatest specific weight was recorded when 0 N was applied (p < 0.05). The interaction between slurry and rate of N was insignificant but results in 2017/18 showed no effect of slurry or treatment on specific weight (Table 9).
In 2016/17, significant differences (p < 0.05) in the thousand grain weight (TGW) were recorded, whereby increased inorganic N reduced TGW. In 2017/18, no significant differences were detected in any of the treatments but there was a tendency (p = 0.09) for the (70 E + 70 L) + Slurry treatment which led to a numeric reduction in specific weight. The results of the two years show that, following stubble turnips, crop quality is not reduced by lower levels of N input either from slurry or inorganic N. However, one year’s data shows that crop quality is compromised with higher levels of N.

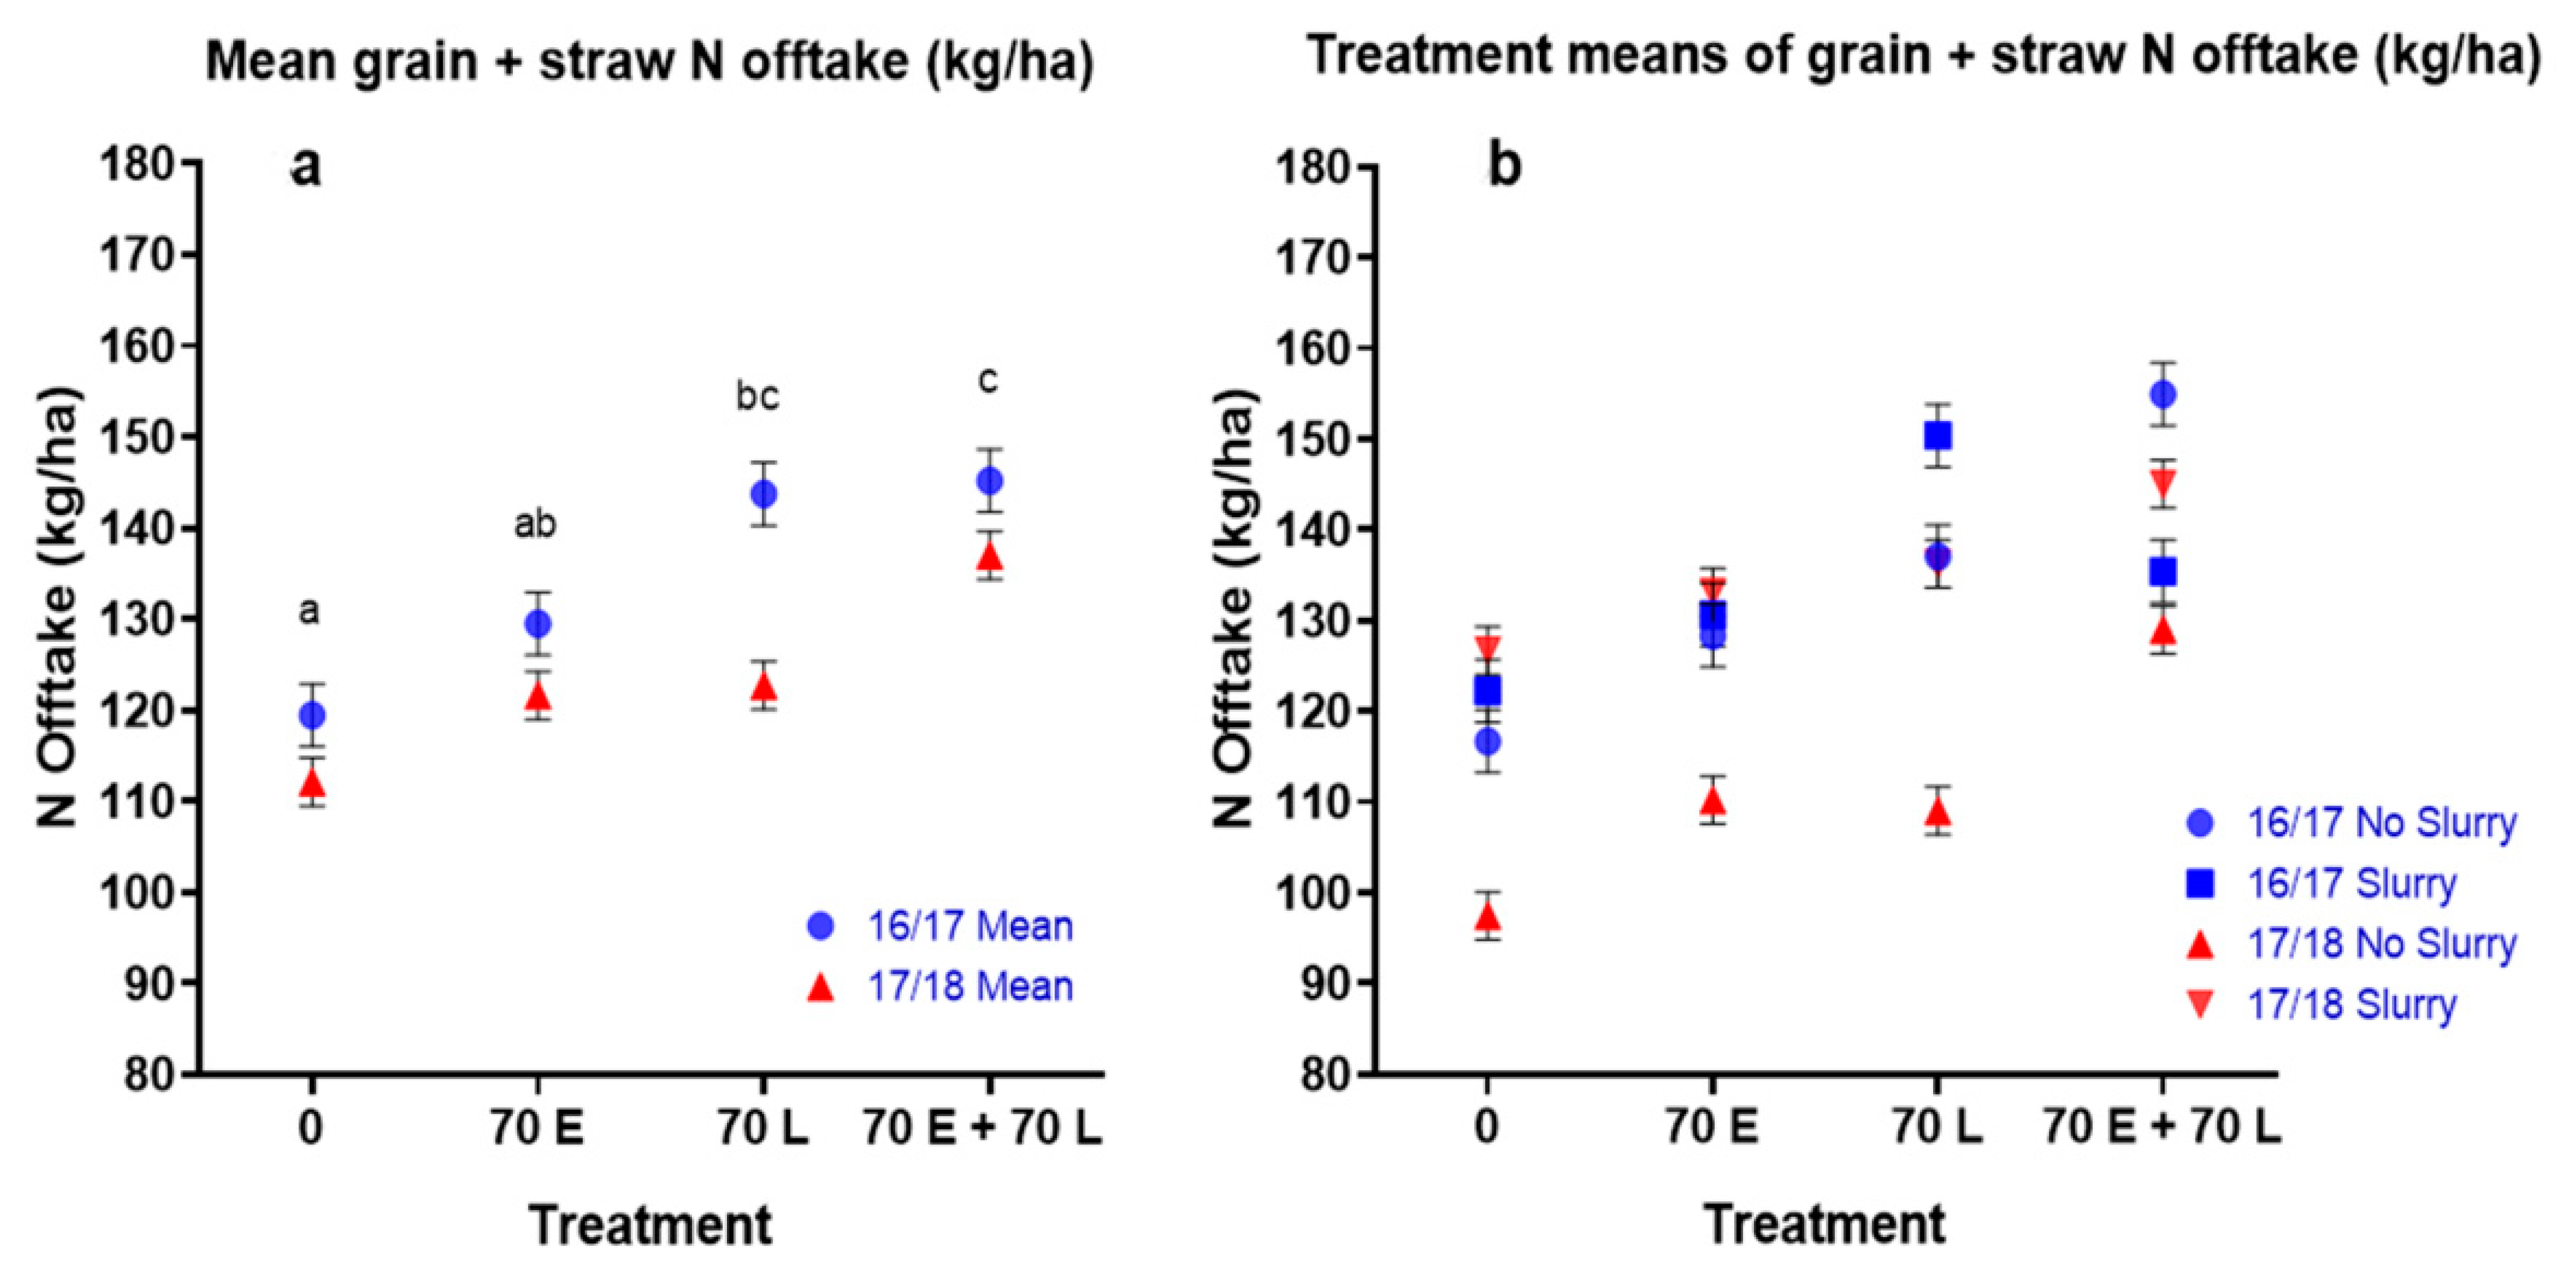
3.3. Total N Offtake
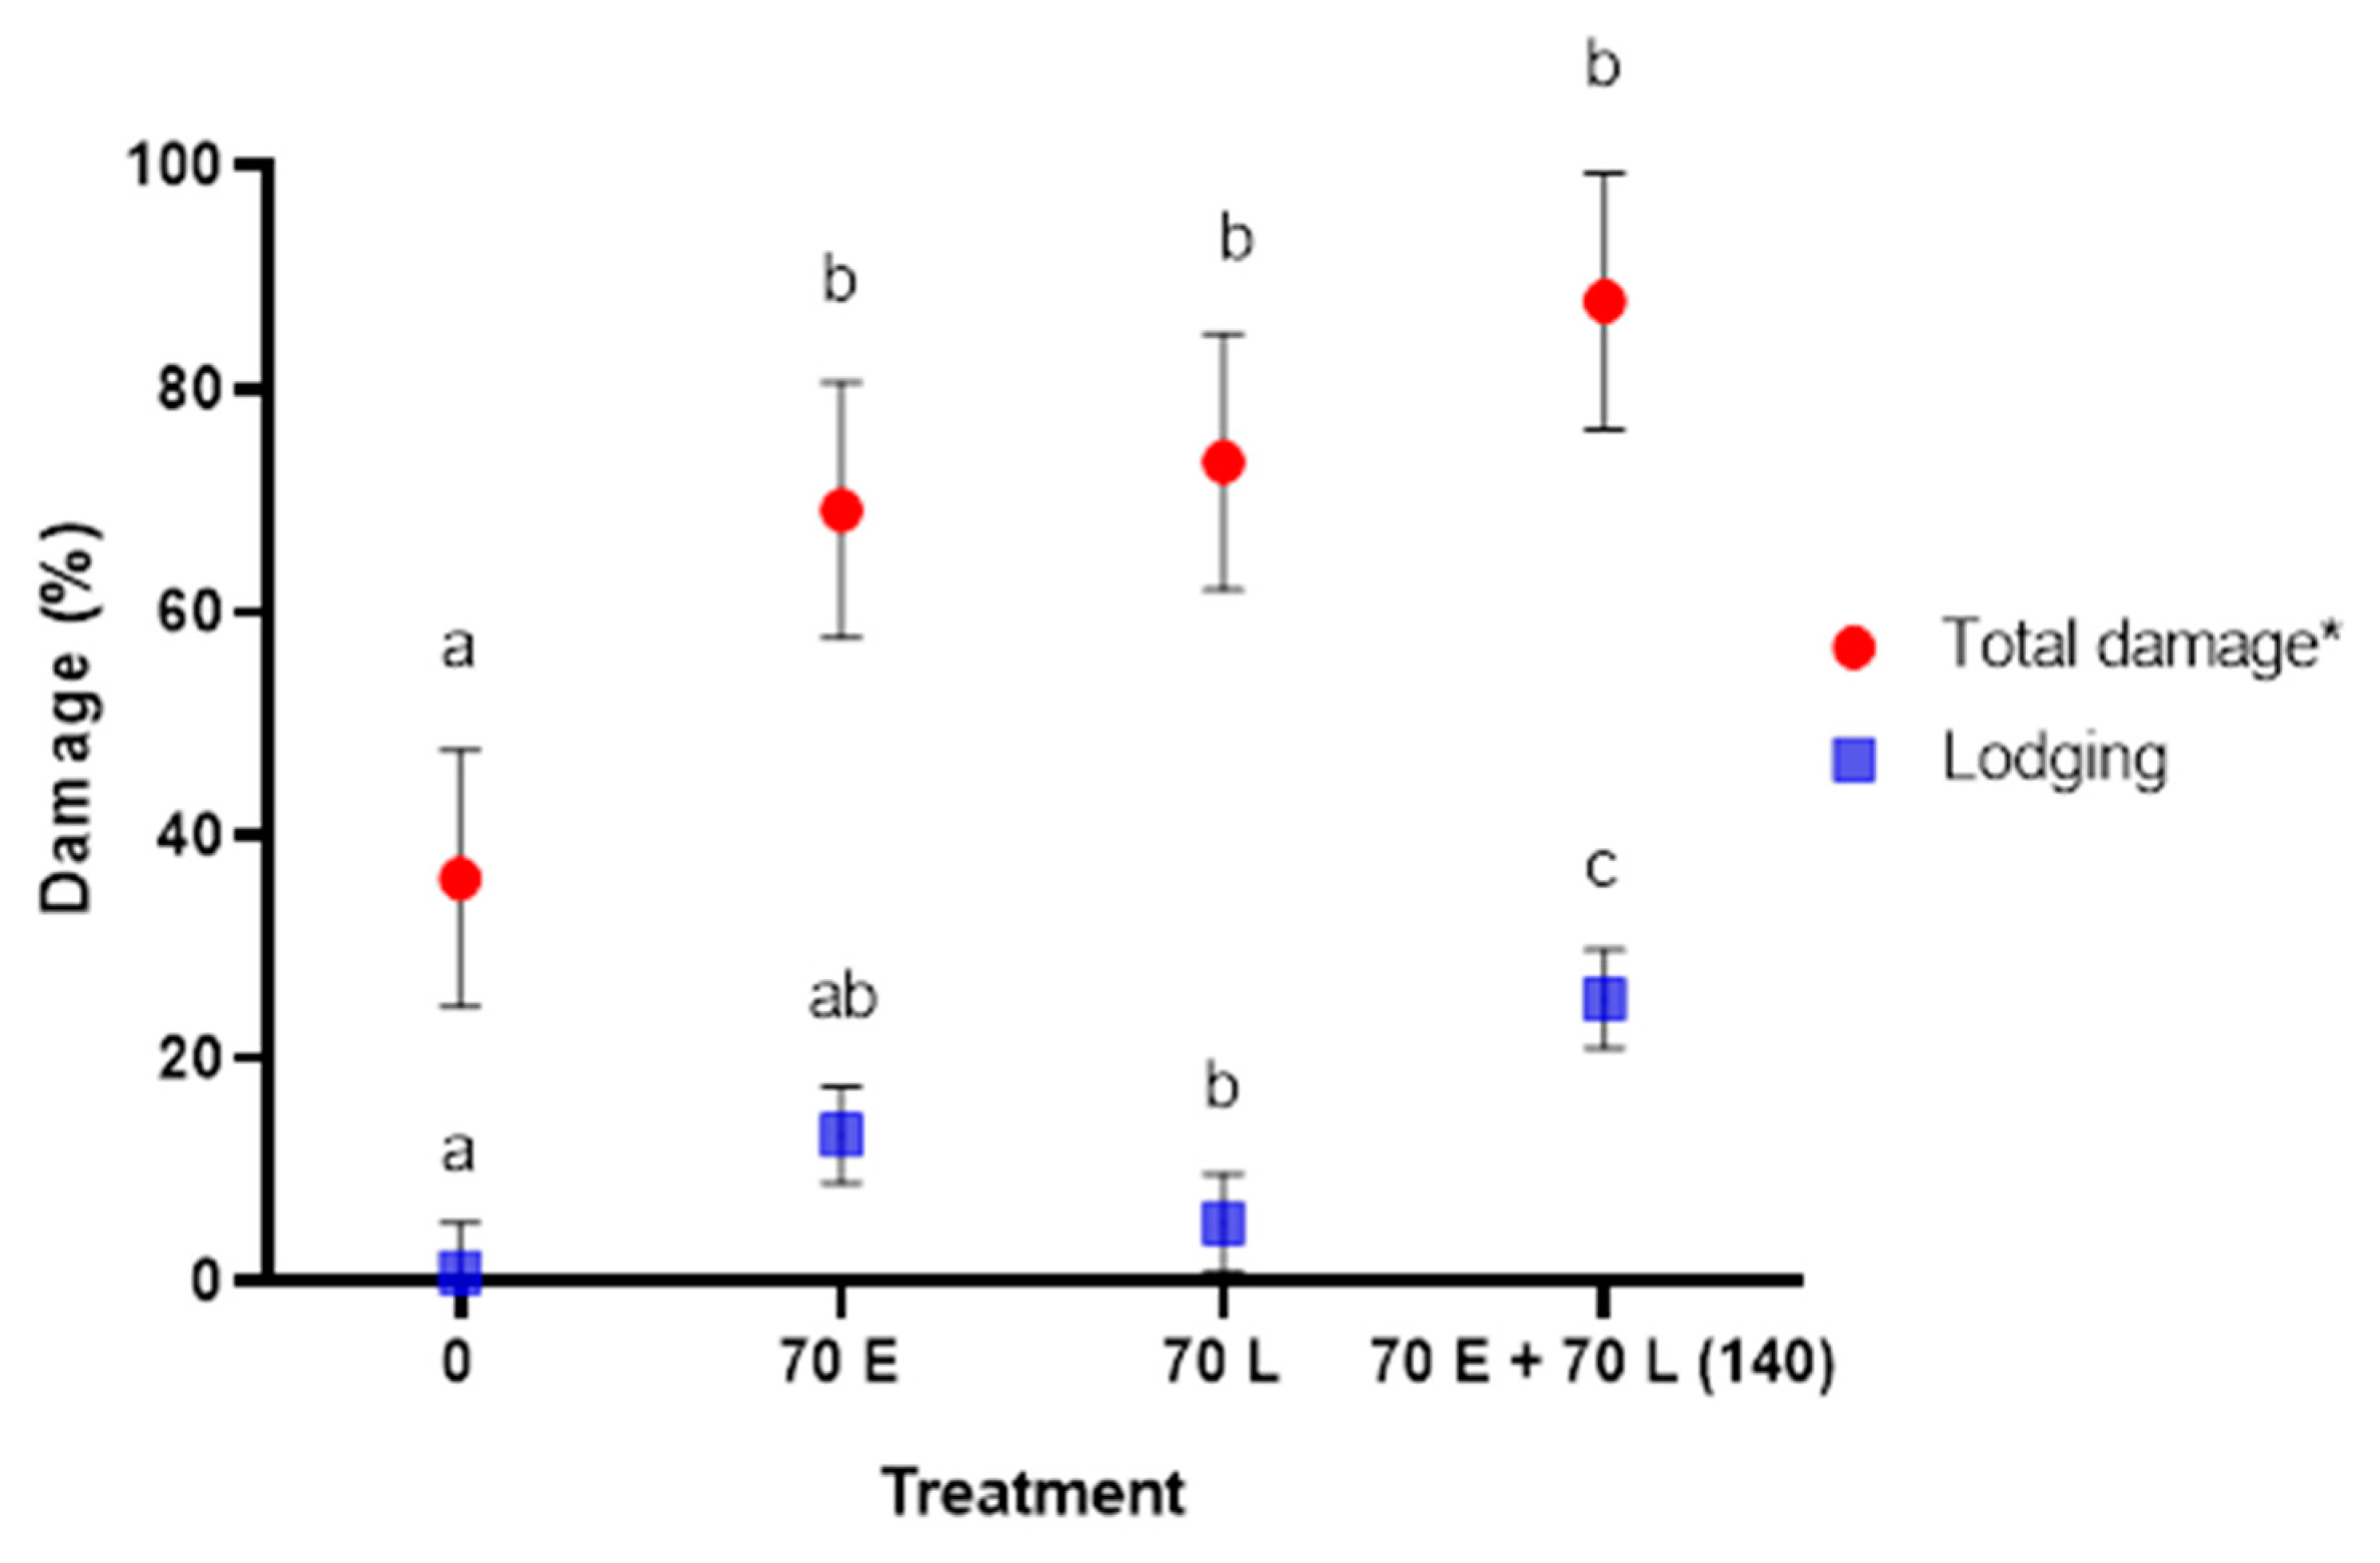
In 2016/17, increasing the rate of inorganic N significantly (p < 0.001) increased the total N offtake (Table 10). A rate of 140 kg N/ha increased N offtake over a zero rate (p < 0.05) by 25.3 kg/ha (Figure 4). The interaction between treatment and slurry was not significant.
In both years, 70 L led to a higher offtake than 70 E but was only statistically significant in 2017/18 (p < 0.05). In 2017/18, slurry significantly (p < 0.05) increased the N offtake as well as 70 L (p < 0.05) but there were no significant interactions with any of the inorganic fertiliser treatments. The treatment of 70 E had a tendency to increase N offtake (p = 0.08) when compared to a 0 rate in 2017/18 (Table 11).
In 2017/18, when slurry was applied to the 0 kg/ha N plots, total N offtake increased by 29.2 kg/ha but, where 70 kg of inorganic N was applied to the 0 kg/ha N + Nil Slurry, N offtake was only increased by 13 kg/ha, showing a low efficiency which is due to low response of grain yield. However, in 2016/17, slurry application led to a numerical decrease across all treatments of inorganic N.

3.4. Straw Damage

In the 2016/17 trial, high rainfall during the growing season from mid-summer (Figure A1.) resulted in a late harvest and caused considerable damage to the spring barley which was recorded on a plot-by-plot basis. Slurry resulted in a significant increase of lodging (p < 0.05) and had a tendency to increase total damage (p = 0.09). Treatment significantly (p < 0.001) affected the total damage, with no fertiliser resulting in the least damage (p < 0.05) compared to other treatments (Table 12) (Figure 5). Straw height in 2018 was considerably shorter and led to lower straw yields than the previous year (Table 7). This was due to a drought that caused an accelerated growing season led to an early harvest (particularly considering that it was sown late). This meant low levels of straw damage, where no significant difference between treatments was detected. Furthermore, straw yields were also reduced due to a lower number of spring barley shoots produced in 2017/18 compared to 2016/17 (Table A4). The shoot counts were unaffected by treatments applied (Table A2 and Table A3).

3.5. Apparent N Recovery

The apparent N recovery applied through slurry to the stubble turnips was 105 and 57% for 2016/17 and 2017/18, respectively (Table 13). In 2017/18 a lower N recovery was observed in the stubble turnips due to a greater amount of N applied from slurry despite a greater amount of N contained in the stubble turnips.
Slurry was applied pre-stubble turnips had an apparent N recovery by the spring barley of 110% in 2016/17 and 38% in 2017/18, when no additional slurry or N was used. Consequently, slurry applied pre-spring barley reduced the apparent nutrient efficiency of N recovered to 50% and 31% in 2016/17 and 2017/18, respectively. The lower N recovery in 2017/18 in the cover crop and spring barley is the result of more N applied from slurry pre-stubble turnips in that year.

4. Discussion

4.1. Slurry Pre-Sowing Spring Barley, N Rates and Timings

Stubble turnips were chosen as a cover crop because they are the most prevalent species used in NI [9]. However, the most predominant reason for planting was for provision of fodder. Therefore, this research addresses the nutrient requirements of spring barley, where stubble turnips are left in-situ as a cover crop. The N concentration of the stubble turnips averaged 3.5% in the tops and 2.2% in the roots along with high yields of 4.28 t/ha DM, across the two years, which led to an average N accumulation of 130 kg/ha. The biomass yield recorded in each year was high, indicating satisfactory growth. This is similar to findings by Keogh [6], where stubble turnips accumulated 4.3 t/ha and 3.2 t/ha of dry matter (DM) when planted on the 1st and 15th August and supplemented with 120 kg/ha N. These authors also found that N supplementation significantly (p < 0.05) increased the biomass yield of the stubble turnips, as well as crude protein (p < 0.05) at one site. Increasing the N acquired in the stubble turnips and a high relative concentration will speculatively facilitate faster N mineralisation by decreasing C:N ratio according to the equation of mineralisation by Couëdel [4].
The aim of the practice of applying slurry prior to sowing stubble turnips was not only to maximise biomass growth but also the efficiency of the nutrients coming from the slurry, in particular, N, compared to the alternative of application of slurry to fallow land. Table 13 demonstrates that when SMN is ignored the apparent N efficiency recovered from slurry in the stubble turnip cover crop was 105% and 57% in 2016/17 and 2017/18, respectively. If applied to bare fallow, the RB209 Nutrient Management Guide [10] estimates that an autumn application would have an N efficiency of 35%, and 25% of N to the subsequent crop following the applications of the slurry used, based on their DM content.
To maximise the spring barley yield, a pre-spring barley treatment of slurry and additional inorganic N was applied to supply additional nutrients to overcome the potential of insufficient N. This was to address the possibility that the cover crop of stubble turnips could have resulted in a low SMN as it sequestered large amounts of N in its biomass. Upon incorporation of the residue, low N mineralisation rates [4] and extra soil N being immobilised by soil biota [30] could have negatively affected N supply [25] to the spring barley and the subsequent grain yield. However, additional N in the form of slurry and/or inorganic N reduced grain yields in 2016/17. This was due to increasing straw damage in response to slurry and additional inorganic N. This was escalated by numerical increases in shoot counts (Table A2 and Table A3) in response to additional forms of N as shown in Table A4. In 2016/17 tiller numbers were much higher than in 2017/18. Furthermore, in 2016/17, TGW was significantly reduced by applications of N, especially 70 L and 70 E + 70 L. This also explains reduced yields as a result of high N applications, as TGW is a major determinant of final yield. In 2017/18, it was found that increasing the rate of N numerically increased yield in all treatments. However, this was only significant in the treatment of 70 L.
In 2016/17, slurry and additional inorganic N did result in increased % N and N offtake. Average N efficiency of supplementing 70 kg N (E or L) over the controls was 15 and 25% in 2016/17 and 2017/18, respectively. Both produced a very low response. However, the yields in 2017/18 responded to 70 L, suggests that, when incorporating the offtake efficiency, this rate was too high and that a much lower rate could be more appropriate. Therefore, hypothesis 1 that stubble turnips can allow for a reduced-rate N regime in spring barley, is accepted. Furthermore, the hypothesis that early N would be more beneficial than late N is rejected, as only the trials in 2017/18 demonstrated a significant difference due to N timing and showed that 70 L was more beneficial.
In 2017/18, slurry applied with 70 L led to the greatest yield but was not significant, despite a 0.63 t/ha difference in grain yield compared to the 0 N + Slurry, and a 1.52 t/ha difference when compared with the 0 N + nil slurry. Slurry significantly increased average N offtake by 24 kg/ha in 2017/18, with no average increase in 2016/17. In 2017/18, using the difference between the total N accumulation of the controls (0 N) No Slurry and Slurry (0 N) divided by total N supplied from the spring application of slurry ((126.7–97.5))/147.5 × 100) gives an N efficiency of 20% to the commercial crop. Therefore, hypothesis 2, that slurry will increase grain yields due to N immobilisation from the stubble turnips, is rejected.
The lack of a substantial increase in N offtake through adding extra fertiliser 70 E, 70 L or 70 E + 70 L combined with lack of significant yield difference further highlights that a reduced-rate fertiliser programme is effective. This means that hypothesis 4, which speculated that additional N would increase grain yield due to low N mineralisation from the stubble turnips, is rejected. This also suggests that the rate of N mineralisation from the cover crop may be higher than what is estimated in the following Equation (1) by Couëdel [4]. The 6-month mineralisation of the stubble turnip stem and root fractions for 2017/18 estimates that only 56 kg/ha N would be available to the spring barley crop Equation (2).
N mineralised = N acquired × N % avail where N% avail = 0.72 − (26.57 × C:N/1000)
Stem = 118 kg/ha N × [0.72 − (26.57 × 12.2/1000)] = 46.7 kg/ha N from the stem
Roots = 31.5 kg/ha N × 0.72 − (26.57 × 16.4/1000) = 9.0 kg/ha from the roots
Total = 46.7 + 9.0 = 55.7 kg/ha N
The RB209 Nutrient Management Guide estimates that, in high rainfall regions with medium/heavy soils, only 25–30% of total N in the slurry is available to the subsequent crop [10]. This equates to 27 kg/ha N and 65 kg/ha N in 2016/17 and 2017/18, respectively, which would not have been enough to support the spring barley yields and N offtake where no slurry or inorganic N were added. Some of this N, from slurry, would have been accumulated in the stubble turnip biomass. However, using the equation, above, suggests that the N mineralisation was insufficient to support the spring barley yields and N offtake. Therefore, this indicates that either residual SMN was high enough to support the crop yield or that the N from the stubble turnip biomass is mineralising at a greater rate than the model suggests. Whilst the trial has no data on initial soil N levels, there is evidence to suggest that the effect of the autumn slurry was not enough to enhance SMN to a level which would have supported crop yields. A three-year trial by White [35] in NI, on comparative soils, found that when 800 kg/ha of N was applied pre-planting winter wheat (autumn), by spring, average SMN was less than 60 kg/ha. Consequently, winter wheat N offtake was <100 kg/ha when no additional N was applied through the growing season and that it responded to additional N fertiliser. Therefore, it is unlikely that high soil N caused the lack of response to additional N. However, SMN prior to the spring barley may have been higher in 2016/17 due to lower rainfall than the subsequent trial year. This is because, from August to March, 529 mm of rain fell in 2016/17 compared to 745 mm in the same period in 2017/18.
In this trial, regional conditions may have provided the potential for high N mineralisation from not only the stubble turnip but also the soil organic N. The trial sites have a history of annual routine slurry usage which may have increased total soil N, as found by [36]. Similarly, Glendining [37] found that long-term applications of inorganic N increased total soil N and resulted in an increased N mineralisation potential. The local climate of mild weather and relatively even monthly rainfall create a warm, moist soil (Figure A1 and Figure A2) conducive to high N mineralisation [38,39]. Furthermore, cultivation of spring barley primarily relies on ploughing [40], which means that cover crops are destroyed and incorporated into the soil, thus increasing mineralisation. This may explain why the stubble turnips, which accumulated a large amount of N over-winter, were conducive to supplying the spring barley with enough N under reduced N regimes. This is contrary to Abdalla [17] who found in a meta-analysis that non-legume cover crops significantly (p < 0.05) decreased both grain N and total N offtake, primarily due to their higher C:N ratios in comparison to legumes. Moreover, Kaye [25] found that cereal rye reduced maize N uptake by 40 kg/ha due to the rye cover crop accumulating high amounts of N over winter but had a high C:N ratio of 35 which negatively affected the maize yield [41].
Couëdel [4] found that when using 7 crucifers (brassicas) as a sole (single species) crop, a net N mineralisation maximum of 20 kg N/ha was recorded and minimum of 6 kg N/ha was immobilised by white mustard. However, when the brassicas were grown in a mix with legumes which fixed additional N, it increased N mineralisation rates of the residue. This was caused by significantly higher quantities of N acquired in the biomass which was also of higher quality due to a lower C:N ratio. In this study, the slurry may have produced a similar effect to the legume, as it provided a comprehensive source of nutrients resulting in a large N uptake and lower C:N ratio. Therefore, the effects of slurry on a broad range of cover crops should be investigated.
Thilakarathna [14] experimented using cover crops of red clover, oilseed radish (brassica), oat and perennial ryegrass with three rates of manure (on an N basis) 0, 100 and 200 kg/ha N applied pre-cover crop. They found that the non-legumes responded to the slurry through extra biomass and N uptake. However, the following commercial crop of corn only recovered greater amounts of N from the legume cover crop, with the non-legumes being similar to that of fallow. The corn yield did not increase with the incremental manure N rates under the no cover crop treatment (fallow) and showed considerable loss of N. Where the corn was not supplemented with additional N, grain yields and N offtake only increased under the red clover (legume) cover crop. This was also found in a study investigating poultry litter applied pre-cover crops of rye and vetch [42]. In this trial, there was no relative control of fallow, but the findings differ from both Thilakarathna [14] and Seman-Varner [42]. This study found no significant yield improvement following the increase of the N supplementation to the spring barley, from using a non-legume. However, Salmerón [43] found in a comparative study (using cover crops of winter rape, vetch and oilseed rape, barley and control of no cover crop), that including cover crops was not only effective to reduce soil N loss but also supplied the next commercial crop (maize) with sufficient N, maintaining yield even under reduced (50 kg less N than control) fertiliser N programmes. However, in the second year, oilseed rape reduced commercial crop yield. This was attributed to low biomass of the cover crop, which was only 24% of the previous year, and the subsequently low N supply to the commercial crop. This shows high seasonal variations and demonstrates the importance of maximising biomass. The same study found that a barley cover crop (due to its high C:N > 26 and large uptake of N) led to a 4 t/ha reduction in grain yield in the first year and a lesser reduction in the second year, and was an unsuitable cover crop due to its high C:N ratio causing low mineralisation rates. In this study, the C:N ratio of the stubble turnips was considerably lower. This highlights the importance of correct species selection to maximise the benefits of the cover crop.
This experiment found that, in 2017/18, when slurry or 70 kg N/ha was applied to plots with Nil Slurry + 0 kg/ha N, grain yield increased by 1.09 t/ha and 0.82 t/ha, respectively. This is a considerable increase in overall output and margins. It suggests that some form of nutrients could be a more economical practice, especially in 2017/18. Therefore, in subsequent trials, it may be beneficial to only use a +/− 70 kg/ha of inorganic N to give assurance that reduced N will not negatively impact the performance of spring barley. Furthermore, grain quality was actually improved when using lower rates of inorganic fertiliser. This is important for overall grain value. Parameters of grain quality e.g., TGW (g) and specific weight (kg/hl) were greatest when using 0 kg/ha N fertiliser rate in 2016/17, but no differences were found in 2017/18. Specific weights recorded in 2016/17 were much lower than 2017/18. Compared to the minimum market specification of 63 kg/hl, tiller counts in 2016/17 were much higher than 2017/18 which could help explain the greater lodging and straw damage exhibited in that year (Table A4). Grain % N is an important measure of grain quality, as various markets require different levels due to its inherent link to protein levels and thus animal feed value. The grain % N across all treatments suggests that this crop rotation would not be suitable for malting or distilling as these require low levels of % N (<1.8% N).

4.2. Recommendations for Future Studies

Limitations

There was no area of fallow to contrast against, as the research started after the field of stubble turnips were sown. No SMN was evaluated prior to the stubble turnips or the spring barley, which would help explain the results and therefore must be applied to future studies. In addition, the replication of this trial across more years and at different site locations, in NI, would enable greater quantification of N mineralisation from the stubble turnips. This would enhance support for the practice of using reduced rates of N supplemented to the spring barley following, a cover crop of, stubble turnips, in the region of NI.
The 2016/17 growing season provided a low rainfall autumn for cover crop growth, but, in 2017, from August onwards there was high rainfall which continued during the winter of 2017/18 (Figure A1). During growth of the 2017/18 spring barley, there was a drought from mid-May. Despite contrasting seasons/growing conditions (Figure A2), the data shows that reduced rates of fertiliser applied to spring barley is possible without being detrimental to yield.

5. Conclusions

A full rate (140 kg/ha), half rate (70 kg/ha) and zero rate (0 kg/ha) of inorganic N fertiliser was applied to spring barley combined with a +/− slurry treatment prior to the planting of the barley following a stubble turnip cover crop. Grain yield was only significantly increased by applying 70 kg N (Late) in 2017/18, but in the previous year, both slurry and additional inorganic N reduced yields. This study suggests that there may be a greater level of mineralisation than estimated due to agronomic management practices applied and conducive climatic conditions. Stubble turnips planted after winter barley are an effective cover crop that exhibit considerable growth, nutrient accumulation and, importantly, N mineralisation, when integrated with slurry. A reduced rate of N following stubble turnips is possible and could lead to considerable financial savings and make the practice profitable.

Author Contributions

Conceptualization, P.C., P.N.W., L.B. and E.W.; investigation, P.C.; writing—original draft, P.C.; writing—review and editing, P.C., P.N.W., E.W. and L.B.; visualization, P.C.; resources, L.B. and E.W. supervision, P.N.W., L.B. and E.W. All authors have read and agreed to the published version of the manuscript.

Funding

This research was supported and funded by AFBI (Agri-Food and Biosciences Institute) in conjunction with DAERA (Department of Agriculture, Environment and Rural Affairs). Thanks to AFBI Crossnacreevy for providing materials and a site to host the trial.

Institutional Review Board Statement

Not applicable.

Informed Consent Statement

Not applicable.

Data Availability Statement

Data sharing not applicable.

Acknowledgments

The authors would like to thank all AFBI staff involved in helping undertake this trial, in particular, Colin Garrett and Ashley Cathcart as well as all the farm staff who helped with setting up the pots, watering and planting. The authors are also grateful to the AFBI statistical analysis branch and acknowledge the guidance and analysis conducted by Michelle Allen (AFBI, Newforge), and likewise, Hugh McKeating and Alan Wright (AFBI, Newforge) of the soils branch for analysing soil and plant residue.

Conflicts of Interest

The authors would like to declare no conflict of interest.

Appendix A

Table A1. Nutrients supplied from slurry prior to sowing the stubble turnips.
Year Slurry TypeDMKPSMgNH4+ Total N
%mg/kg mg/kg mg/kg mg/kg % %
2016Farrowing 0.8814902601601800.190.24
2017Fattener7.88479812185257220.470.73
Application Rate (t/ha)Nutrients supplied (kg/ha)
201644.3 66.011.57.18.084.2106.3
N availability assuming 50%42.153.2
201735.7 171.343.518.725.8168.5261.3
N availability assuming 50%84.3130.7
Post stubble turnip cover crop nutrient supply from slurry
Year Slurry TypeDMKPSMgNH4+ Total N
%mg/kgmg/kgmg/kgmg/kg%%
2017Sow Slurry0.771810109128210.250.27
2018Sow slurry 0.871927147139320.270.30
20175090.55.56.41.1123.5137.0
N availability assuming 50%62.069.0
20185096.47.356.951.6133.5147.5
N availability assuming 50%67.074.0
Nutrient concentrations are presented on a fresh basis.
Table A2. 2016/17 REML analysis of shoot count and grains/ear.
Shoot CountGrains/Ear
Treatment F-ValueSEM *LSD #F-ValueSEMLSD
Slurry0.8316.470.70.0050.220.85
Nitrogen0.1114.5100.00.3670.211.21
Slurry × Nitrogen0.2511.7141.60.2260.171.72
* Standard error of the mean (SEM). # Least significant difference (LSD).
Table A3. 2017/18 ANOVA analysis of shoot count and grains/ear.
Average Shoot Count (m2)Grains Ear
TreatmentF-ValueSEM *LSD #F-ValueSEMLSD
Slurry0.2021.9393.80.540.7212.88
Early N (70 L)0.6828.2171.60.110.221.36
Slurry × Early N (70 E)0.4726.1102.60.720.642.51
Late N (70 L)0.7635.7161.50.140.759.23
Slurry × Late N (70 L)0.9234.1135.30.460.964.52
140 (70 E + 70 L)0.5738.5139.40.400.682.48
Slurry × 140 (70 E + 70 L)0.7651.4172.50.391.184.45
* Standard error of the mean (SEM). # Least significant difference (LSD).
Table A4. 2016/17 and 2017/18 Means for grains/ear and tiller counts.
2016/17 Grains/Ear2016/17 Grains/Ear
Treatment0Early 70Late 70Early + Late (140)Mean0Early 70Late 70Early + Late (140)Mean
Nil Slurry17.818.917.116.717.618.819.619.820.519.7
Slurry16.316.216.416.416.31817.218.721.418.8
Mean1717.516.816.51718.418.419.220.919.2
2016/17 Tiller count (m2)2017/18 Tiller count (m2)
Treatment0Early 70Late 70Early + Late (140)Mean0Early 70Late 70Early + Late (140)Mean
Nil Slurry8648579861040937554598528593568
Slurry922954931970944695643652670665
Mean8939059591005940625621590632617
Figure A1. Monthly rainfall during the trial (mm).
Agronomy 11 00232 g0a1
The trials ran from August–September 2016/17 and August to August 2017/18. Rainfall data gathered from a weather station located in Crossnacreevy, Belfast. The 30-year mean NI rainfall was obtained from the Met Office.
August–August 2016/17 cumulative rainfall total = 920 mm. August–August 2017/18 cumulative rainfall total = 1016 mm.
Figure A2. Temperature data during trial (°C).
Agronomy 11 00232 g0a2
Mean monthly air and soil temperatures including monthly means and max temperatures recorded at Crossnacreevy, Belfast.

References

  1. Brust, J.; Weber, J.; Gerhards, R. Do cover crop mixtures have the same ability to suppress weeds as competitive monoculture cover crops? Julius-Kühn-Archiv 2014, 443, 422–430. [Google Scholar]
  2. Lord, J.S.; Lazzeri, L.; Atkinson, H.J.; Urwin, P.E. Biofumigation for Control of Pale Potato Cyst Nematodes: Activity of Brassica Leaf Extracts and Green Manures on Globodera pallida in Vitro and in Soil. J. Agric. Food Chem. 2011, 59, 7882–7890. [Google Scholar] [CrossRef] [PubMed]
  3. Aronsson, H.; Hansen, E.M.; Thomsen, I.K.; Liu, J.; Ogaard, A.F.; Känkänen, H.; Ulén, B. The ability of cover crops to reduce nitrogen and phosphorus losses from arable land in southern Scandinavia and Finland. J. Soil Water Conserv. 2016, 71, 41–55. [Google Scholar] [CrossRef] [Green Version]
  4. Couëdel, A.; Alletto, L.; Tribouillois, H.; Justes, É. Cover crop crucifer-legume mixtures provide effective nitrate catch crop and nitrogen green manure ecosystem services. Agric. Ecosyst. Environ. 2018, 254, 50–59. [Google Scholar] [CrossRef]
  5. Nivelle, E.; Verzeaux, J.; Habbib, H.; Kuzyakov, Y.; Decocq, G.; Roger, D.; Lacoux, J.; Duclercq, J.; Spicher, F.; Nava-Saucedo, J.-E.; et al. Functional response of soil microbial communities to tillage, cover crops and nitrogen fertilization. Appl. Soil Ecol. 2016, 108, 147–155. [Google Scholar] [CrossRef]
  6. Keogh, B.; McGrath, T.; Grant, J. The effect of sowing date and nitrogen on the dry-matter yield and nitrogen content of forage rape (Brassica napus L.) and stubble turnips (Brassica rapa L.) in Ireland. Grass Forage Sci. 2012, 67, 2–12. [Google Scholar] [CrossRef]
  7. Tribouillois, H.; Fort, F.; Cruz, P.; Charles, R.; Flores, O.; Garnier, E.; Justes, E. A Functional Characterisation of a Wide Range of Cover Crop Species: Growth and Nitrogen Acquisition Rates, Leaf Traits and Ecological Strategies. PLoS ONE 2015, 10, e0122156. [Google Scholar] [CrossRef]
  8. Teixeira, E.; Johnstone, P.; Chakwizira, E.; De Ruiter, J.; Malcolm, B.; Shaw, N.; Zyskowski, R.; Khaembah, E.; Sharp, J.; Meenken, E.; et al. Sources of variability in the effectiveness of winter cover crops for mitigating N leaching. Agric. Ecosyst. Environ. 2016, 220, 226–235. [Google Scholar] [CrossRef]
  9. Cottney, P.; Williams, P.N.; Black, L.E.; Cottney, P.; Williams, P.N.; Black, L.; White, E. The Perception and Use of Cover Crops within the Island of Ireland. Ann. Appl. Biol. 2021. [Google Scholar] [CrossRef]
  10. AHDB. Nutrient Management Guide (RB209). In Agriculture & Horticulture Development Board; AHDB: Warwickshire, UK, 2017. [Google Scholar]
  11. Frost, J.P.; Bailey, J.S.; Stevens, R.J. Making Best on-Farm Use of Plant Nutrients in Livestock Manures. In 78th Annual Report; Agricultural Research Insititute Northern Ireland (ARINI): Hillsborough, Northern Ireland, UK, 2004. [Google Scholar]
  12. Cottney, P.; Black, L.; White, E.; Williams, P.N. The Correct Cover Crop Species Integrated with Slurry Can Increase Biomass, Quality and Nitrogen Cycling to Positively Affect Yields in a Subsequent Spring Barley Rotation. Agronomy 2020, 10, 1760. [Google Scholar] [CrossRef]
  13. Parkin, T.B.; Kaspar, T.C.; Singer, J.W. Cover crop effects on the fate of N following soil application of swine manure. Plant Soil 2006, 289, 141–152. [Google Scholar] [CrossRef]
  14. Thilakarathna, M.S.; Serran, S.; Lauzon, J.; Janovicek, K.; Deen, B. Management of Manure Nitrogen Using Cover Crops. Agron. J. 2015, 107, 1595–1607. [Google Scholar] [CrossRef] [Green Version]
  15. Everett, L.A.; Wilson, M.L.; Pepin, R.J.; A Coulter, J. Winter Rye Cover Crop with Liquid Manure Injection Reduces Spring Soil Nitrate but Not Maize Yield. Agron. 2019, 9, 852. [Google Scholar] [CrossRef] [Green Version]
  16. Miguez, F.E.; Bollero, G.A. Review of Corn Yield Response under Winter Cover Cropping Systems Using Meta-Analytic Methods. Crop Sci. 2005, 45, 2318–2329. [Google Scholar] [CrossRef] [Green Version]
  17. Abdalla, M.; Hastings, A.; Cheng, K.; Yue, Q.; Chadwick, D.; Espenberg, M.; Truu, J.; Rees, R.M.; Smith, P. A critical review of the impacts of cover crops on nitrogen leaching, net greenhouse gas balance and crop productivity. Glob. Chang. Biol. 2019, 25, 2530–2543. [Google Scholar] [CrossRef] [Green Version]
  18. Giacomini, S.J.; Recous, S.; Mary, B.; Aita, C. Simulating the effects of N availability, straw particle size and location in soil on C and N mineralization. Plant Soil 2007, 301, 289–301. [Google Scholar] [CrossRef]
  19. Tripolskaja, L.; Šidlauskas, G. The influence of catch crops for green manure and straw on the infiltration of atmospheric precipitation and nitrogen leaching. Zemdirb. Agric. 2010, 97, 83–92. [Google Scholar]
  20. Janušauskaitė, D.; Arlauskienė, A.; Maikštėnienė, S. Soil mineral nitrogen and microbial parameters as influenced by catch crops and straw management. Zemdirb. Agric. 2013, 100, 9–18. [Google Scholar] [CrossRef] [Green Version]
  21. Zandt, D.I.T.; Fritz, C.; Wichern, F. In the land of plenty: Catch crops trigger nitrogen uptake by soil microorganisms. Plant Soil 2017, 423, 1–14. [Google Scholar]
  22. Kuzyakov, Y.; Xu, X. Competition between roots and microorganisms for nitrogen: Mechanisms and ecological relevance. New Phytol. 2013, 198, 656–669. [Google Scholar] [CrossRef]
  23. Nevins, C.J.; Nakatsu, C.; Armstrong, S. Characterization of microbial community response to cover crop residue decomposition. Soil Biol. Biochem. 2018, 127, 39–49. [Google Scholar] [CrossRef]
  24. Kramberger, B.; Gselman, A.; Janzekovic, M.; Kaligarič, M.; Bracko, B. Effects of cover crops on soil mineral nitrogen and on the yield and nitrogen content of maize. Eur. J. Agron. 2009, 31, 103–109. [Google Scholar] [CrossRef]
  25. Kaye, J.P.; Finney, D.; White, C.; Bradley, B.; Schipanski, M.; Alonso-Ayuso, M.; Hunter, M.; Burgess, M.; Mejia, C. Managing nitrogen through cover crop species selection in the U.S. mid-Atlantic. PLoS ONE 2019, 14, e0215448. [Google Scholar] [CrossRef]
  26. Tonitto, C.; David, M.; Drinkwater, L.E. Replacing bare fallows with cover crops in fertilizer-intensive cropping systems: A meta-analysis of crop yield and N dynamics. Agric. Ecosyst. Environ. 2006, 112, 58–72. [Google Scholar] [CrossRef]
  27. Samarappuli, D.; Johnson, B.L.; Kandel, H.; Berti, M.T. Biomass yield and nitrogen content of annual energy/forage crops preceded by cover crops. Field Crop. Res. 2014, 167, 31–39. [Google Scholar] [CrossRef]
  28. White, C.M.; Dupont, S.T.; Hautau, M.; Hartman, D.; Finney, D.M.; Bradley, B.; Lachance, J.C.; Kaye, J.P. Managing the trade off between nitrogen supply and retention with cover crop mixtures. Agric. Ecosyst. Environ. 2017, 237, 121–133. [Google Scholar] [CrossRef] [Green Version]
  29. Kremen, A.; Weil, R. Nitrogen mineralization from brassica cover crops. In Cover Crops for Soil Health and Sustainable Farming; University of Maryland: College Park, MD, USA, 2006; p. 115. [Google Scholar]
  30. Justes, E.; Mary, B.; Nicolardot, B. Quantifying and modelling C and N mineralization kinetics of catch crop residues in soil: Parameterization of the residue decomposition module of STICS model for mature and non mature residues. Plant Soil 2009, 325, 171–185. [Google Scholar] [CrossRef]
  31. Silgram, M.; Harrison, R. The Mineralisation of Nitrogen in Cover Crops: A Review; Department of Environment and Rural Affairs: London, UK, 1998.
  32. Melkonian, J.; Poffenbarger, H.J.; Mirsky, S.B.; Ryan, M.R.; Moebius-Clune, B.N. Estimating Nitrogen Mineralization from Cover Crop Mixtures Using the Precision Nitrogen Management Model. Agron. J. 2017, 109, 1944–1959. [Google Scholar] [CrossRef] [Green Version]
  33. Mead, R.; Curnow, R.N.; Hasted, A. (Eds.) Statistical Methods. In Agriculture and Experimental Biology, 3rd ed.; Texts in Statistical Science 2003; Chapman & Hall/CRC: Boca Raton, FL, USA, 2003. [Google Scholar]
  34. VSN International. Genstat for Windows, 18th ed.; VSN International: Hemel Hempstead, UK, 2017. [Google Scholar]
  35. White, E.M.; Wilson, F.E.A.; Kettlewell, P.S.; Sklyvester-Bradley, R.; Watson, C. Nitrogen nutrition of wheat at three contrasting sites in the UK. Asp. Appl. Biol. 1997, 50, 241–247. [Google Scholar]
  36. Li, C.-X.; Ma, S.-C.; Shao, Y.; Ma, S.-T.; Zhang, L.-L. Effects of long-term organic fertilization on soil microbiologic characteristics, yield and sustainable production of winter wheat. J. Integr. Agric. 2018, 17, 210–219. [Google Scholar] [CrossRef] [Green Version]
  37. Glendining, M.; Powlson, D. The Effect of Long-term Applications of Inorganic Nitrogen Fertilizer on Soil Organic Nitrogen. Adv. Soil Org. Matter Res. 2003, 127, 329–338. [Google Scholar]
  38. Guntiñas, M.E.; Leirós, M.C.; Trasarcepeda, C.; Gil-Sotres, F. Effects of moisture and temperature on net soil nitrogen mineralization: A laboratory study. Eur. J. Soil Biol. 2012, 48, 73–80. [Google Scholar] [CrossRef]
  39. De Neve, S.; Hofman, G. Quantifying soil water effects on nitrogen mineralization from soil organic matter and from fresh crop residues. Biol. Fertil. Soils 2002, 35, 379–386. [Google Scholar] [CrossRef]
  40. DAERA. EU Farm Structure Survey 2016 Northern Ireland. In CAP Policy, Economics and Statistics Division; Department of Agriculture, Environment and Rural Affairs Belfast: Belfast, Northern Ireland, UK, 2016. [Google Scholar]
  41. White, C.M.; Finney, D.M.; Kemanian, A.R.; Kaye, J.P. A Model-Data Fusion Approach for Predicting Cover Crop Nitrogen Supply to Corn. Agron. J. 2016, 108, 2527–2540. [Google Scholar] [CrossRef] [Green Version]
  42. Seman-Varner, R.; Varco, J.; O’Rourke, M. Nitrogen Benefits of Winter Cover Crop and Fall-Applied Poultry Litter to Corn. Agron. J. 2017, 109, 2881–2888. [Google Scholar] [CrossRef]
  43. Salmerón, M.; Isla, R.; Cavero, J. Effect of winter cover crop species and planting methods on maize yield and N availability under irrigated Mediterranean conditions. Field Crop. Res. 2011, 123, 89–99. [Google Scholar] [CrossRef] [Green Version]
Figure 1. Grain yield from rate of nitrogen, timing and application of slurry (t/ha). Error bars represent standard error of the mean (SEM). Different letters denote statistical differences between treatments determined through Fisher’s protected least significant difference (LSD) (0.05). Grain yields are shown at 15% moisture content (M.C).
Agronomy 11 00232 g001
Figure 2. Average grain N percentage from fertiliser rate, timing and application of slurry (%). Error bars represent standard error of the mean (SEM). Different letters denote statistical differences between treatments determined by Fisher’s protected LSD (0.05).
Agronomy 11 00232 g002
Figure 3. Specfic weight and thousand grain weight (TGW) with different rates and timings of nitrogen (kg/ha). Bars represent specific weight (kg/hl) which is kg/100 Litres. Symbols represent thousand grain weight (g) shown on the right Y-axis. Error bars represent standard error of the mean (SEM). Different letters denote statistical differences between treatments determined by Fisher’s protected LSD (0.05).
Agronomy 11 00232 g003
Figure 4. Total N offtake including grain and straw (kg/ha). Error bars represent standard error of the mean (SEM). Different letters show statistical differences between treatments determined by Fisher’s protected LSD (0.05).
Agronomy 11 00232 g004
Figure 5. 2016/2017 straw damage assessed pre-harvest. * Total damage = sum of leaning, lodging, brackling and neckling. Error bars represent standard error of the mean (SEM). Means which share different letters are significantly (p < 0.05) different to each other determined by Fishers’s Protected LSD (0.05).
Agronomy 11 00232 g005
Table 1. Soil test (15 cm) prior to spring barley establishment.
Year SitepHPhosphorus
(P)
Potassium
(K)
Magnesium
(Mg)
Sulphur
(S)
TN #TC +SandSiltClay
mg/L Soil *mg/L Soilmg/L Soilmg/L Soil%%%%%
2016/17Site 15.9395.02052149.30.4914.042.836.720.5
2017/18Site 26.7230.52059341.90.3553.649.432.717.9
* Olsen P. # Total nitrogen. + Total carbon.
Table 2. Nutrient uptake of the stubble turnip cover crop (kg/ha).
Year Plant Fraction Mean YieldPhosphorus (P)Potassium (K)Calcium (Ca)Magnesium
(N)
Sulphur (S)NC:N
Ratio
t/ha%%%%%%
2016/17Stem2.120.64.11.90.30.63.5-
Root1.940.54.80.70.20.31.9-
2017/18Stem3.430.54.81.30.10.63.412.2
Root1.070.54.30.90.30.62.916.4
Nutrient uptake (kg/ha)
Total 2017Stem11.886.240.86.511.773.9
Root8.992.913.83.26.137.3
Sum20.8179.154.59.717.8111.2
Total 2018Stem18.7165.443.85.122.1118.0
Root5.546.310.02.76.731.5
Sum24.2211.753.87.828.8149.5
Table 3. Experimental design and layout in 2016/17.
Block 1Block 2
BACDBDAC
DACBADBC
DABCCBAD
DBACABCD
Slurry was randomised in columns, whilst fertiliser treatment was randomised across rows
A = 0 kg N/ha
(0)
B = 70 kg N/ha Early (70 E)C = 70 kg N/ha Late
(70 L)
D = 70 E + 70 L kg N/ha
(70 E + 70 L)
Red font Slurry
Normal fontNil slurry
Table 4. Split-split plot design implemented in 2017/18.
TreatmentBlock 1Block 2
Sub plot 70 E
+
70 E
+
70 E
+
70 E
+
70 E
+
70 E
+
0
+
0
+
Sub-sub plot 70 L0070 L70 L0070 L
0
+
0
+
0
+
0
+
0
+
0
+
70 E
+
70 E
+
70 L070 L0070 L070 L
Whole plot = Slurry, Sub plot = 70 kg N/ha applied early (70 E) or 0 kg N/ha (0), Sub-sub plots = 70 kg N/ha applied late (70 L) or 0 kg N/ha (0)
Red fontSlurry
Normal fontNil slurry
Table 5. REML analysis of 2016/17 spring barley grain and straw yields (t/ha).
Grain Yield (t/ha)Straw Yield (t/ha)
ParameterF-ValueSEM *LSD #F-ValueSEMLSD
Slurry 0.040.1580.4560.670.0530.152
Nitrogen 0.030.1380.2580.460.0540.199
Slurry × Nitrogen 0.170.1380.583<0.010.0520.291
* Standard error of the mean (SEM). # Least significant difference (LSD).
Table 6. ANOVA analysis of 2017/18 spring barley grain and straw yields (t/ha).
Grain Yield t/ha—15% MCStraw Yield t/ha—15% MC
Treatment F-ValueSEM *LSD #F-ValueSEMLSD
Slurry 0.290.1933.4650.180.1132.031
Early N (70 E)0.390.171.070<0.010.020.12
Slurry × Early N (70E) 0.340.1090.427<0.050.0390.153
Late N (70 L)<0.050.2611.322<0.050.1151.793
Slurry × Late N (70 L)0.490.2211.610.120.121.361
140 0.280.2070.8530.310.0440.155
Slurry × 140 (70 E + 70 L) 0.530.3031.1660.230.1271.002
* Standard error of the mean (SEM). # Least significant difference (LSD).
Table 7. Straw yields (t/ha) for both 2016/17 and 2017/18.
2016/172017/18
Treatment 070 E70 L70 E + 70 LAverage070 E70 L70 E + 70 LAverage
No Slurry2.42.42.42.62.52.202.302.512.642.41
Slurry2.62.32.62.22.41.562.091.802.051.88
Average 2.52.42.52.42.451.882.192.162.352.14
Table 8. REML analysis of 2016/17 grain quality parameters.
TreatmentGrain N%Specific Weight (kg/hl)TGW (g)
F-ValueSEM *LSD #F-ValueSEMLSDF-ValueSEMLSD
Slurry <0.010.0650.0870.030.6700.8860.110.7802.934
Nitrogen <0.0010.0650.123<0.0010.6761.253<0.010.7822.516
Slurry × Nitrogen 0.260.0660.1890.960.6701.9650.500.7615.201
* Standard error of the mean (SEM). # Least significant difference (LSD).
Table 9. Analysis of variance of 2017/18 grain quality parameters.
Grain N%Specific Weight (kg/hl)TGW (g)
Treatment F-ValueSEM *LSD #F-valueSEMLSDF-ValueSEMLSD
Slurry 0.230.0581.0480.190.030.480.780.8915.92
Early N (70 E)<0.0010.0030.0170.100.130.800.160.432.64
Slurry × Early N (70 E)0.030.0220.0870.610.351.370.460.321.27
Late N (70 L)0.100.0581.0380.400.130.760.930.998.44
Slurry × Late N (70 L)0.330.0620.6610.880.351.370.530.9410.28
140 (70 E + 70 L)0.090.0220.0870.740.371.360.900.542.09
Slurry × 140 (70 E + 70 L)0.360.0660.5050.980.511.920.091.096.14
* Standard error of the mean (SEM). # Least significant difference (LSD).
Table 10. 2016/17 REML analysis total N offtake (kg/ha).
Parameter F-ValueSEM *LSD #
Slurry 0.943.6710.82
Nitrogen<0.0013.6514.92
Slurry × Nitrogen0.163.4621.59
* Standard error of the mean (SEM). # Least significant difference (LSD).
Table 11. 2017/18 F-values for total N offtake at 0% DM (kg/ha).
Treatment F-ValueSEM *LSD #
Slurry <0.050.6511.68
Early N (70 E) 0.082.5715.65
Slurry × Early N (70 E) 0.352.389.36
Late N (70 L)<0.052.6514.56
Slurry × Late N (70 L)0.552.479.28
140 (70 E + 70 L)0.513.5112.71
Slurry × 140 (70E + 70 L)0.734.2914.71
* Standard error of the mean (SEM). # Least significant difference (LSD).
Table 12. 2016/17 REML analysis F-values of spring barley damage pre-harvest.
Treatment LeaningLodgingBracklingNeckingTotal Damage
Slurry 0.67<0.050.820.470.09
Nitrogen0.40<0.0010.150.50<0.001
Slurry × Nitrogen0.340.310.600.850.55
Table 13. Apparent N recovery efficiency in the stubble turnips and in the spring barley.
Stubble Turnips
N (kg/ha)2016–172017–18
Total N applied as slurry to the cover crop106261
Total N recovered by the cover crop 111149
Apparent efficiency of recovery of N by the cover crop (%)10557
Spring barley
Total N applied as slurry prior to spring barley 137147
Total N recovered by spring barley with 0 inorganic N
Without slurry11798
With slurry122127
Total N applied from slurry 243408
Apparent efficiency of recovery of N by the 0 N barley crop (%)
Without slurry11038
With slurry (pre-spring barley)5031
Publisher’s Note: MDPI stays neutral with regard to jurisdictional claims in published maps and institutional affiliations.

