Article

Effect of Rice Planting on Nitrous Oxide (N2O) Emission under Different Levels of Nitrogen Fertilization

1
Institute of Agriculture and Life Sciences, Gyeongsang National University, Jinju 660-701, Korea
2
Division of Applied Life Science (BK 21+ Program), Gyeongsang National University, Jinju 660-701, Korea
3
Department of Botanical and Environmental Sciences, Kohat University of Science and Technology, Kohat 26000, Pakistan
4
University Forests of Seoul National University, Seoul 08826, Korea
*
Authors to whom correspondence should be addressed.
Agronomy 2021, 11(2), 217; https://doi.org/10.3390/agronomy11020217
Submission received: 9 December 2020 / Revised: 21 January 2021 / Accepted: 22 January 2021 / Published: 24 January 2021
(This article belongs to the Section Agricultural Biosystem and Biological Engineering)

Abstract

:
Nitrogen (N) fertilization is one of the most effective practices to increase productivity, and has therefore had a fast global increase. Consequently, the effects of the application of N fertilizer on emissions of N2O have been widely studied, but the effect of rice planting on N2O emission was not adequately quantified. To evaluate the effect of rice cultivation on N2O emissions, different levels of N were applied in a typical temperate rice field, and the N2O fluxes were compared in rice-planted and non-planted soils. Seasonal N2O fluxes responded differently with respect to N fertilization in the two different soil conditions. In non-planted soils, seasonal N2O fluxes ranged within 0.31–0.34 kg N2O ha−1 under 0 kg N ha−1 fertilization, and significantly increased by increasing N fertilization rates, with an average rate of 0.0024 kg N2O kg−1 N for 3 years. In rice-planted soils, seasonal N2O fluxes were also increased by N fertilization but showed large negative N2O fluxes, irrespective of the N fertilization level. This study confirms that the rice reacted as a reducer of N2O emissions, not an emission source, in paddy fields, suggesting that N2O fluxes should be estimated by the static chamber planted with rice to obtain a more precise field environment. The differences of N2O fluxes between the rice-planted and non-planted soils might have been caused by the rice plant’s rhizospheric activities, which may have influenced the N2O consumption potential in the rice plants’ rhizosphere. The N2O consumption potential was significantly increased with increasing N fertilization rates and was highly correlated with rice biomass yields. Therefore, the decrease in N2O fluxes by N fertilization in rice-planted soils might have been caused by a decreasing denitrification potential in paddy soils.

1. Introduction

Nitrous oxide is a long-lived trace gas in the atmosphere and has a 298 times higher global warming potential (GWP) than equivalent amount of carbon dioxide (CO2) [1]. Additionally, N2O has become the most important substance contributing to ozone (O3) layer depletion after chlorofluorocarbons [2]. The atmospheric concentration of N2O has significantly increased from 270 ppbv at the pre-industrial era to 322.5 ppbv in the year 2009, with an average increase of 0.77 ppbv year−1 for the period 2000–2009 [3], mainly due to agricultural activity.
In agricultural fields, the N2O emissions are mainly produced by the chemical and organic N inputs [1]. Globally, agricultural sectors emitted almost 60% of the total anthropogenic N2O emissions [4,5]. The N2O emissions are predicted to increase nearly 35–60% by the end of 2030 to meet the increasing global food demand [5].
Soils react as both a source and a sink of N2O gas [6], but the source activity largely dominates the sink one on the global scale. It is known that biological nitrification and denitrification in soils cover around 70% of global N2O emissions [6,7]. In particular, arable soils are estimated to produce approximately 2.8 Tg N2O-N year−1, which accounts for approximately 60% of total anthropogenic N2O emissions [4,5]. Amongst agricultural practices, N fertilizer utilization is the most important activity related to direct or indirect N2O emissions [8,9,10].
Rice is the most important staple food crop for over 3 billion people in the world [11]. Global rice consumption is projected to increase from 450 million tons in 2011 to about 490 million tons in 2020 and to around 650 million tons by 2050 [12]. Intensive farming practice with high fertilization is widely adopted to increase crop productivity, and therefore, the dependence on fertilizers has continually increased in the rice cropping industry [13,14]. However, the increase of N fertilizer application can stimulate greenhouse gas (GHG) emissions significantly, in particular N2O. Thus, the effect of N fertilizer application on N2O gas emission could be an important issue to find a soil management strategy to reduce the impact of its greenhouse gas emissions in agricultural fields.
Static chamber methods have been most commonly adapted for determining N2O fluxes from agricultural fields. Plants inside chambers can create unique challenges and then influence N2O emission characteristics significantly [15,16]. However, N2O fluxes were measured under different planting conditions inside chambers. For example, many N2O fluxes were developed using planted chambers, in particular in small biomass cropping fields (i.e., lawn, grass, etc.) [17,18], but a large number of N2O fluxes were also measured using plant-excluded chambers, in big biomass plant cultivated fields like tomato, sunflower and rice [19,20,21]. Thus, the unified installation protocol of static chambers should be developed to reflect the field environment more precisely. In general, placing an opaque chamber cover over plants can reduce N2O fluxes by blocking radiation and leading stomatal closure [22]. The magnitude of any reduced N2O flux will depend on the plant species, the amount of biomass enclosed by the chamber, inorganic N forms in the soil and their amounts. If plants are enclosed in transparent chambers, there is clearly a conflict between the need to insulate the chamber to limit air temperature changes and a need to maintain solar radiation for plant functions.
To determine the effect of planted rice on N2O fluxes, different levels of N fertilizer (urea) were added in a temperate rice cropping field, and N2O emissions were characterized in soils with and without rice plants during the three-year rice cultivation period.

2. Materials and Methods

2.1. Preparation of Experimental Field for Rice Transplanting

Rice cropping studies were conducted at an agronomy field in Gyeongsang National University (35°06′ N and 128°07′ E), Jinju, Gyeongnam-province, South Korea, for 3 years (2014–2016). The selected soil was classified with the Pyeongtaeg series (fine-silty, mixed, mesic, Typic haplaquent with somewhat poor drainage). The soil before the test had moderately acidic pH (5.6 ± 0.2, 1:5 with H2O), low fertility with 8.9 ± 0.6 g C kg−1 of organic matter, 0.65 ± 0.08 g N kg−1 of total nitrogen and 73 ± 4.2 mg P2O5 kg−1 of available phosphorus.
The study field was installed with 12 plots, and each plot was designed with 100 m2 of size. Depending on the recommended fertilization levels (N–P–K = 90–19.6–47.3 kg ha−1) for rice cropping in Korea [23], four different levels (0, 45, 90 and 180 kg N ha−1) of urea were applied with three replications and laid out with a randomized block design. However, the same doses of P and K were added in all different treatments. Fertilization was applied by rice growing stages such as basal fertilizer (1 day before transplanting, 50% of N, 100% of P, 70% of K), tillering fertilizer (14 days after transplanting, 20% of N), and panicle fertilizer (42 days after transplanting, 30% of N and K), respectively. The buffer zone (0.5 m width) was installed using a concrete barrier between each experimental site to prevent nutrient mixing effects.
Twenty-one-day-old seedlings (3–4 plants per hill) of rice (Sindongjin-byeo cultivar, Japonica) were transplanted by hand with a spacing of 15 cm × 30 cm in the end of May for each year. Irrigation water was automatically controlled with 5–7 cm of depth during the rice growing season and drained a month before harvesting. Rice was harvested manually in the mid of October, and its yield properties (gran and straw) were investigated by the Rural Development Administration (RDA) [24].

2.2. Gas Sample Correcting and Analysis

Nitrous oxide fluxes were estimated using a static-chamber method [25]. To evaluate the N2O emission rates from the rice planted and without rice plant soils, six pairs of static chambers were fixed in each plot. In order to determine the N2O fluxes in the rice-planted soils, three pairs of the transparent acrylic chamber (W. 62 cm × L. 62 cm × H. 112 cm) were installed in each plot after rice transplanting. The chambers accommodated eight rice plant hills inside each chamber. On the other hand, only three pairs of chambers were kept without plants to measure the N2O fluxes from the bare soils. The chambers were equipped with a circulating fan to mix gases completely and a thermometer to determine the inner temperature during the sampling period. The flow of irrigated water was permitted through two holes at the chamber bottom. The chambers were only closed during the gas sampling period and always kept open during cropping season. The true height of each chamber was measured at every gas sample correction, since the air volume inside chamber might be different depending on the depth of the inner chamber in the soil and on the level of water flooding.
The gas samples were collected at 0, 15, 30 and 45 min after chamber close using 25 mL gastight syringes. To get the mean N2O emission fluxes, gas samples were collected three times a day (8:30–9:00, 12:30–13:00 and 16:30–17:00). The sampled gases were promptly transferred into 20 mL vacuumed glass vials.
The N2O gas concentrations were quantified using a gas chromatograph (GC−2010; Shimadzu) with an electron capture detector (ECD) and a Porapak NQ column (Q 80–100 mesh). The temperatures of the injector, detector and column were adjusted at 200, 300 and 35 °C, respectively. Hydrogen and helium gases were used as the burning and carrier gases, respectively.

2.3. Calculation of N2O Fluxes

Nitrous oxide fluxes were estimated with the following equation [26]:
R = ρ × (V/A) × (Δc/Δt) × (273/T)
where R: N2O emission rate (µg m−2 h−1), ρ: N2O gas density (1.977 mg cm−3) under a standardized state, V: volume of the closed chamber (m3), A: surface area of the chamber (m2), Δc/Δt: rate of N2O increase in the closed chamber (mg m−3 d−1), and T (absolute temperature): 273 + mean temperature (°C) in the chamber.
The seasonal N2O flux for the rice cropping period was integrated by the following equation [27]:
Seasonal N2O flux =Σin (Ri × Di)
where Ri: N2O emission rate (mg m−2 d−1) in the i-th sampling interval, Di: number of days in the i-th sampling interval, and n: gas sampling number.

2.4. Analysis of Air Temperature, Soil and Rice Yield Properties

The temperatures (soil and air) were automatically recorded by a thermometer installed at each place (air: 100–110 cm height from ground, soil: 5 cm depth in the soil) during cropping season. The Eh value (redox potential) of surface soils (5 cm depth) was monitored using the sensor PRN-41, from DKK-TOA Corporation, with the platinum Eh electrode (EP-201, Fujiwara, 24 cm) during gas sampling.
Rice yield properties were measured by the Korean standard methods at the maturing stage [24]. The root biomass was arithmetically estimated as 10% of the total aboveground biomass productivity [28].

2.5. Statistical Analysis

A two-way ANOVA was conducted with SAS package (version 9.3, SAS Institute) to compare rice yield properties among N application rates, experiment years and the interaction of these two factors. The mean values were compared with least significant difference (LSD) tests at the 0.05 level of probability. The response of the quadratic model was estimated using Sigma plot software. Linear regression and correlation analyses were conducted to evaluate relationships between response variables.

3. Results

3.1. Changes of Soil Temperature and Eh Value during Rice Cultivation

During the field investigations for 3 years, typical climate environments of the selected site were observed. Soil temperature was a little bit higher in 2016 than in other years. In 2016, the air and soil temperature were approximately 1.5 °C and 1.8 °C higher than in 2014–2015 (Figure 1).
The Eh values did not significantly differ among treatments throughout the three-year experiment period (Figure 1). The soil Eh values sharply dropped from over 100 mV in every experimental plot with flooding for rice cultivation. Within one to two weeks after rice transplanting, the Eh values dropped to less than −210 mV. This extremely reduced soil condition was maintained throughout the flooded rice cropping period, and the Eh values ranged from −210 to −250 mV in this period. After the drainage for harvesting, soil Eh values speedily increased.

3.2. Rice yield Properties

Rice yield and growth characteristics were similarly changed to the different levels of N application among the experimental years (Table 1). Rice total biomass and straw yield were significantly increased with increasing N fertilizer application, but rice grain yields were increased by a quadratic response. The maximum grain productivity might be attained at 110–120 kg N ha−1 of urea application with approximately 30% yield increase over no-N application (control treatment), and thereafter grain yields clearly decreased with N fertilization increases. The increased panicle number per hill mainly influenced the grain yield increase among rice yield components (Table 1).
Differing with the changes of grain productivity, rice root and straw biomass yields were clearly increased by the increase in the level of N fertilizer (Table 1). For instance, total biomass productivities were approximately 1200 kg ha1 in no-N application, and clearly increased by increasing the level of N fertilization (approximately 1600–1700 kg ha1 at 180 kg N ha−1), mainly due to an increase of rice straw biomass productivity. Comparing with the other parameters, straw biomass productivity was more substantially increased by N fertilizer application, occupied approximately 50% of the total biomass in the control and then increased proportionately to around 55–60% with 180 kg N ha1 of urea fertilization. The rice root biomass productivity showed a trend similar to that of the rice straw yield with increasing N fertilization.

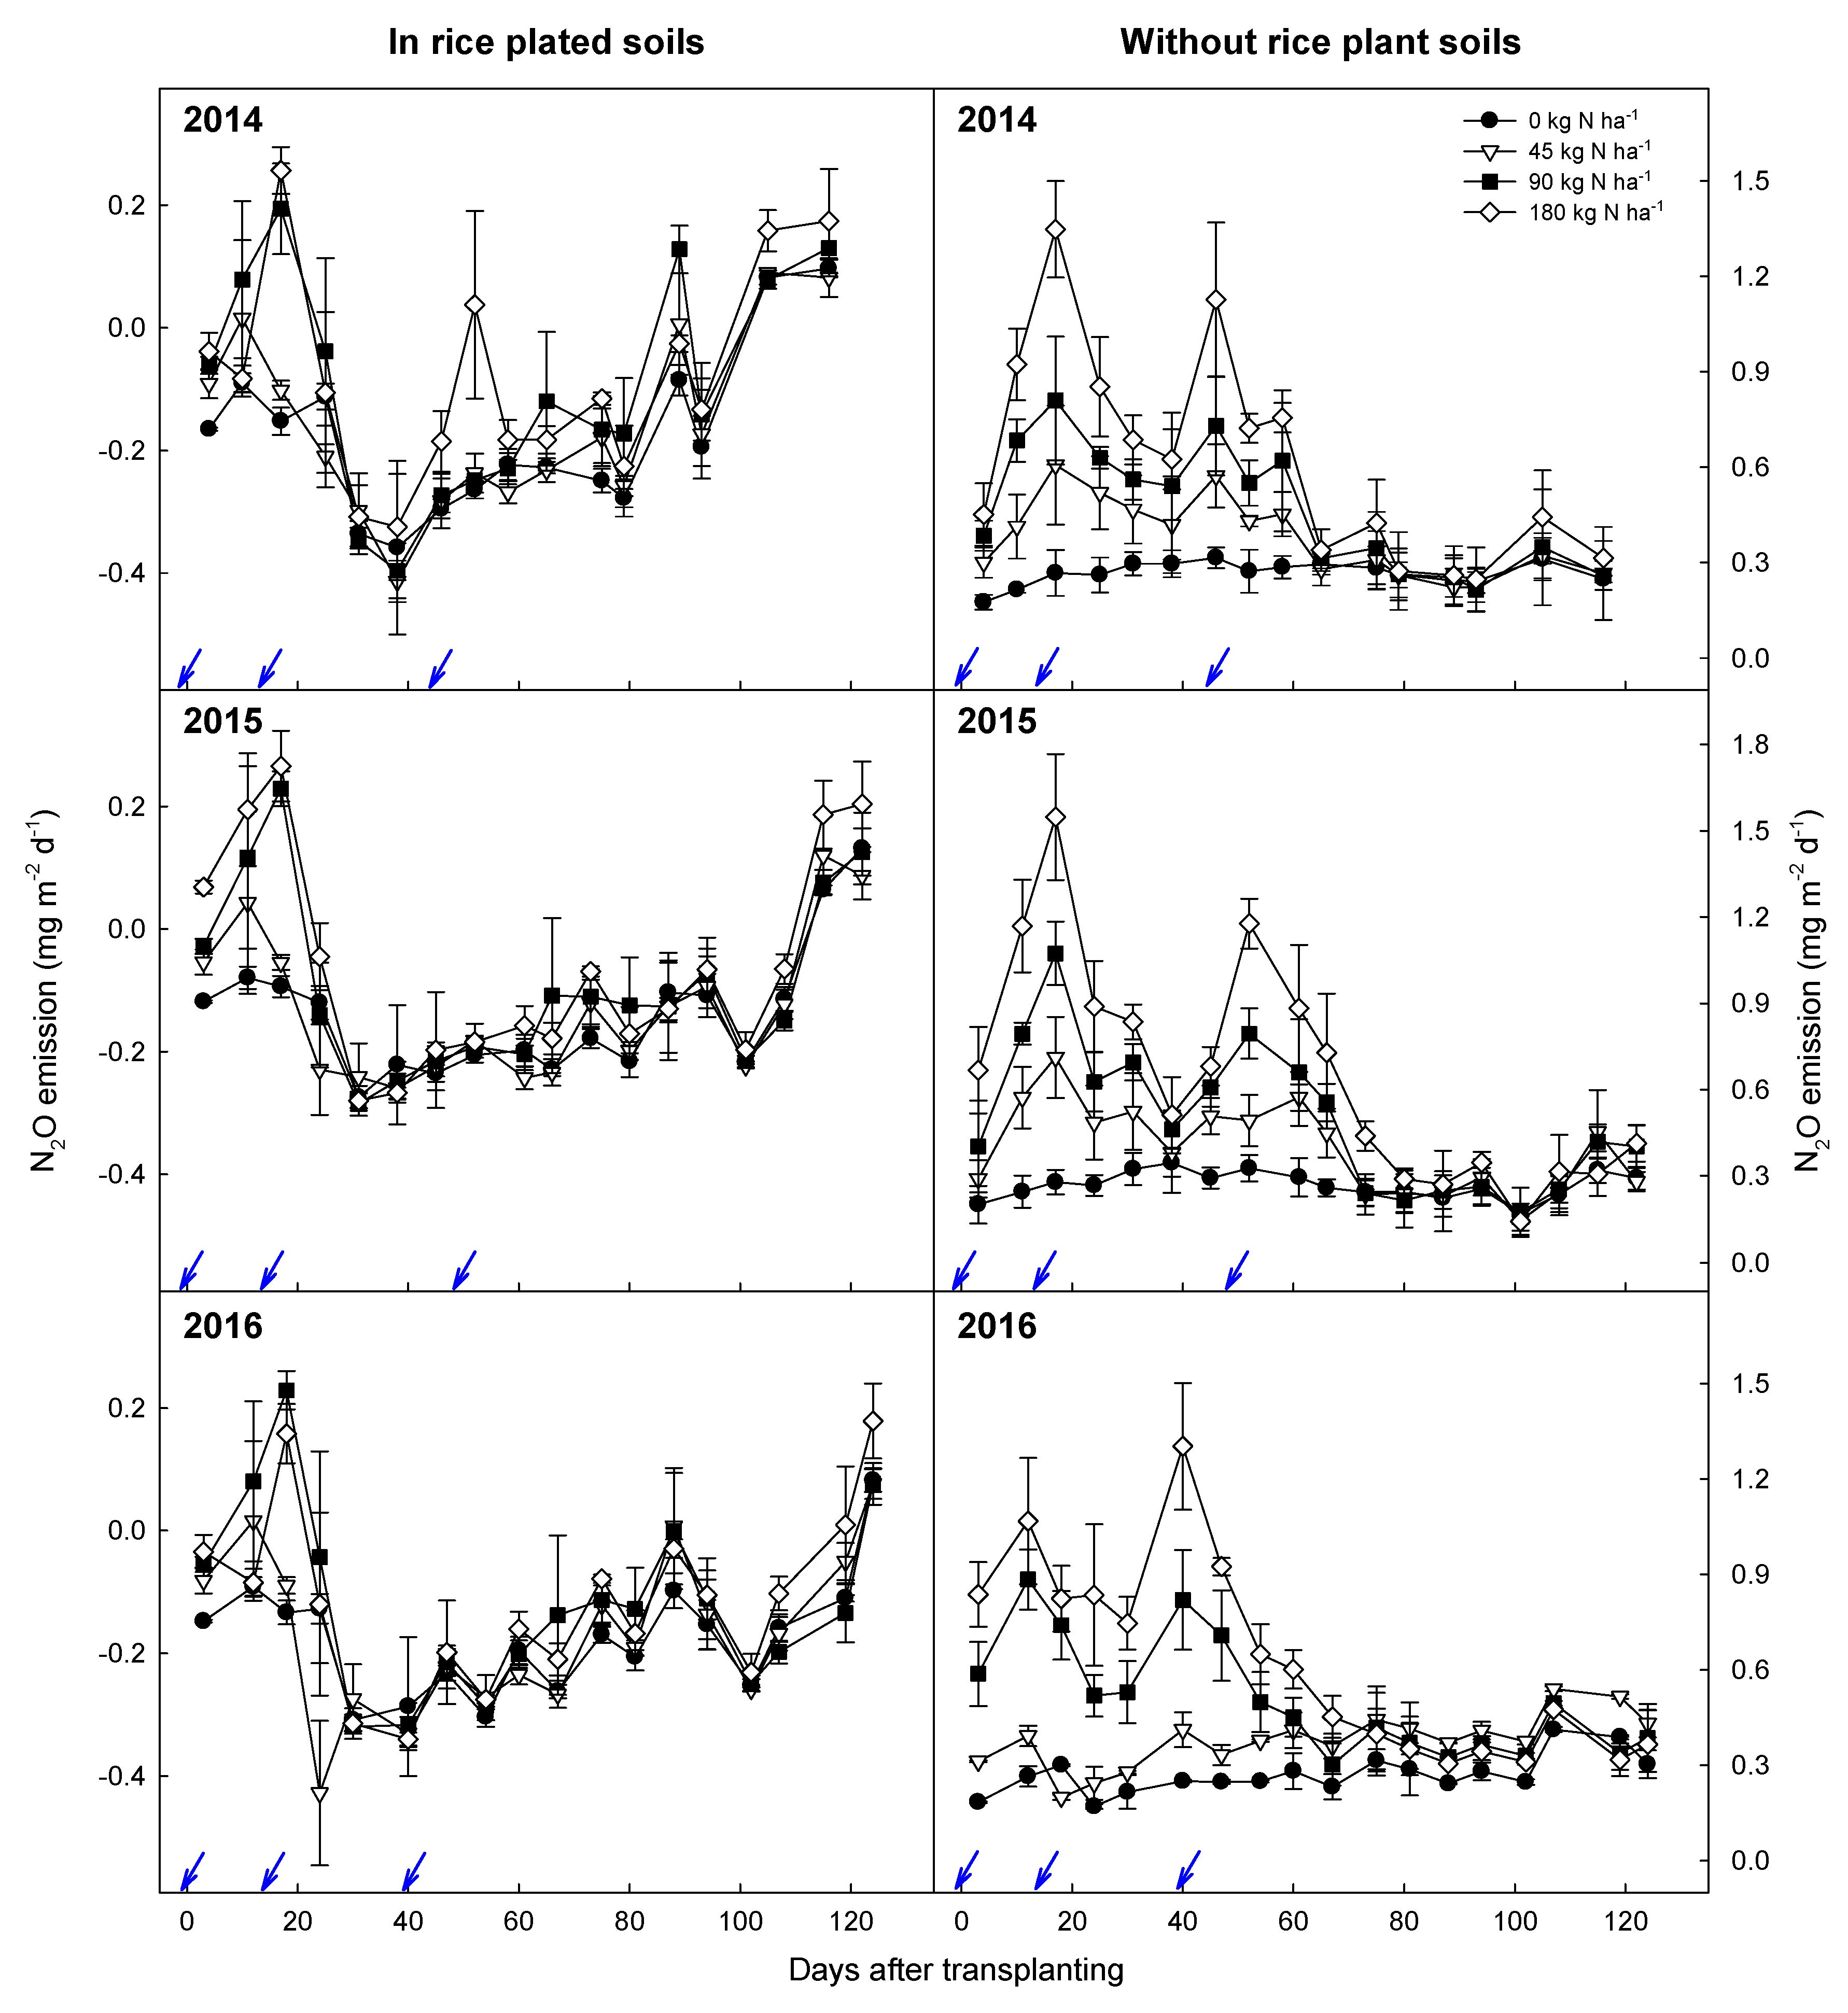
3.3. Changes of N2O Emission Rates

A distinct pattern of N2O flux was recorded for submerged paddy-field rice-planted soil and for non-planted soil (Figure 2). Irrespective of treatments and rice cropping years, N2O emission increased up to the initial 20 days after rice transplanting. However, N2O emission sharply decreased thereafter in rice-planted soils, and no real N2O flux was detected in those soils throughout the rice cropping (Figure 2). The positive N2O flux from rice-planted soils was recorded after 120 days of rice cultivation in these soils, i.e., after removing flooded water prior to rice harvesting.
In the case of non-planted soils, the flux of N2O emission up to 60 days was proportional to the rates of N application, and two peaks of N2O emission fluxes were recorded right after N fertilizer application during rice cultivation (Figure 2). The first peak of N2O emission was recorded within 15–20 days of rice cultivation, while the second peak was observed within 40–60 days after rice transplanting. The N2O emission peaks were significantly controlled by increasing levels of N fertilization. The highest peak was observed at 180 kg N ha−1 in all years. After 70–80 days of rice growth, N2O emission was not significantly different among the treatments.

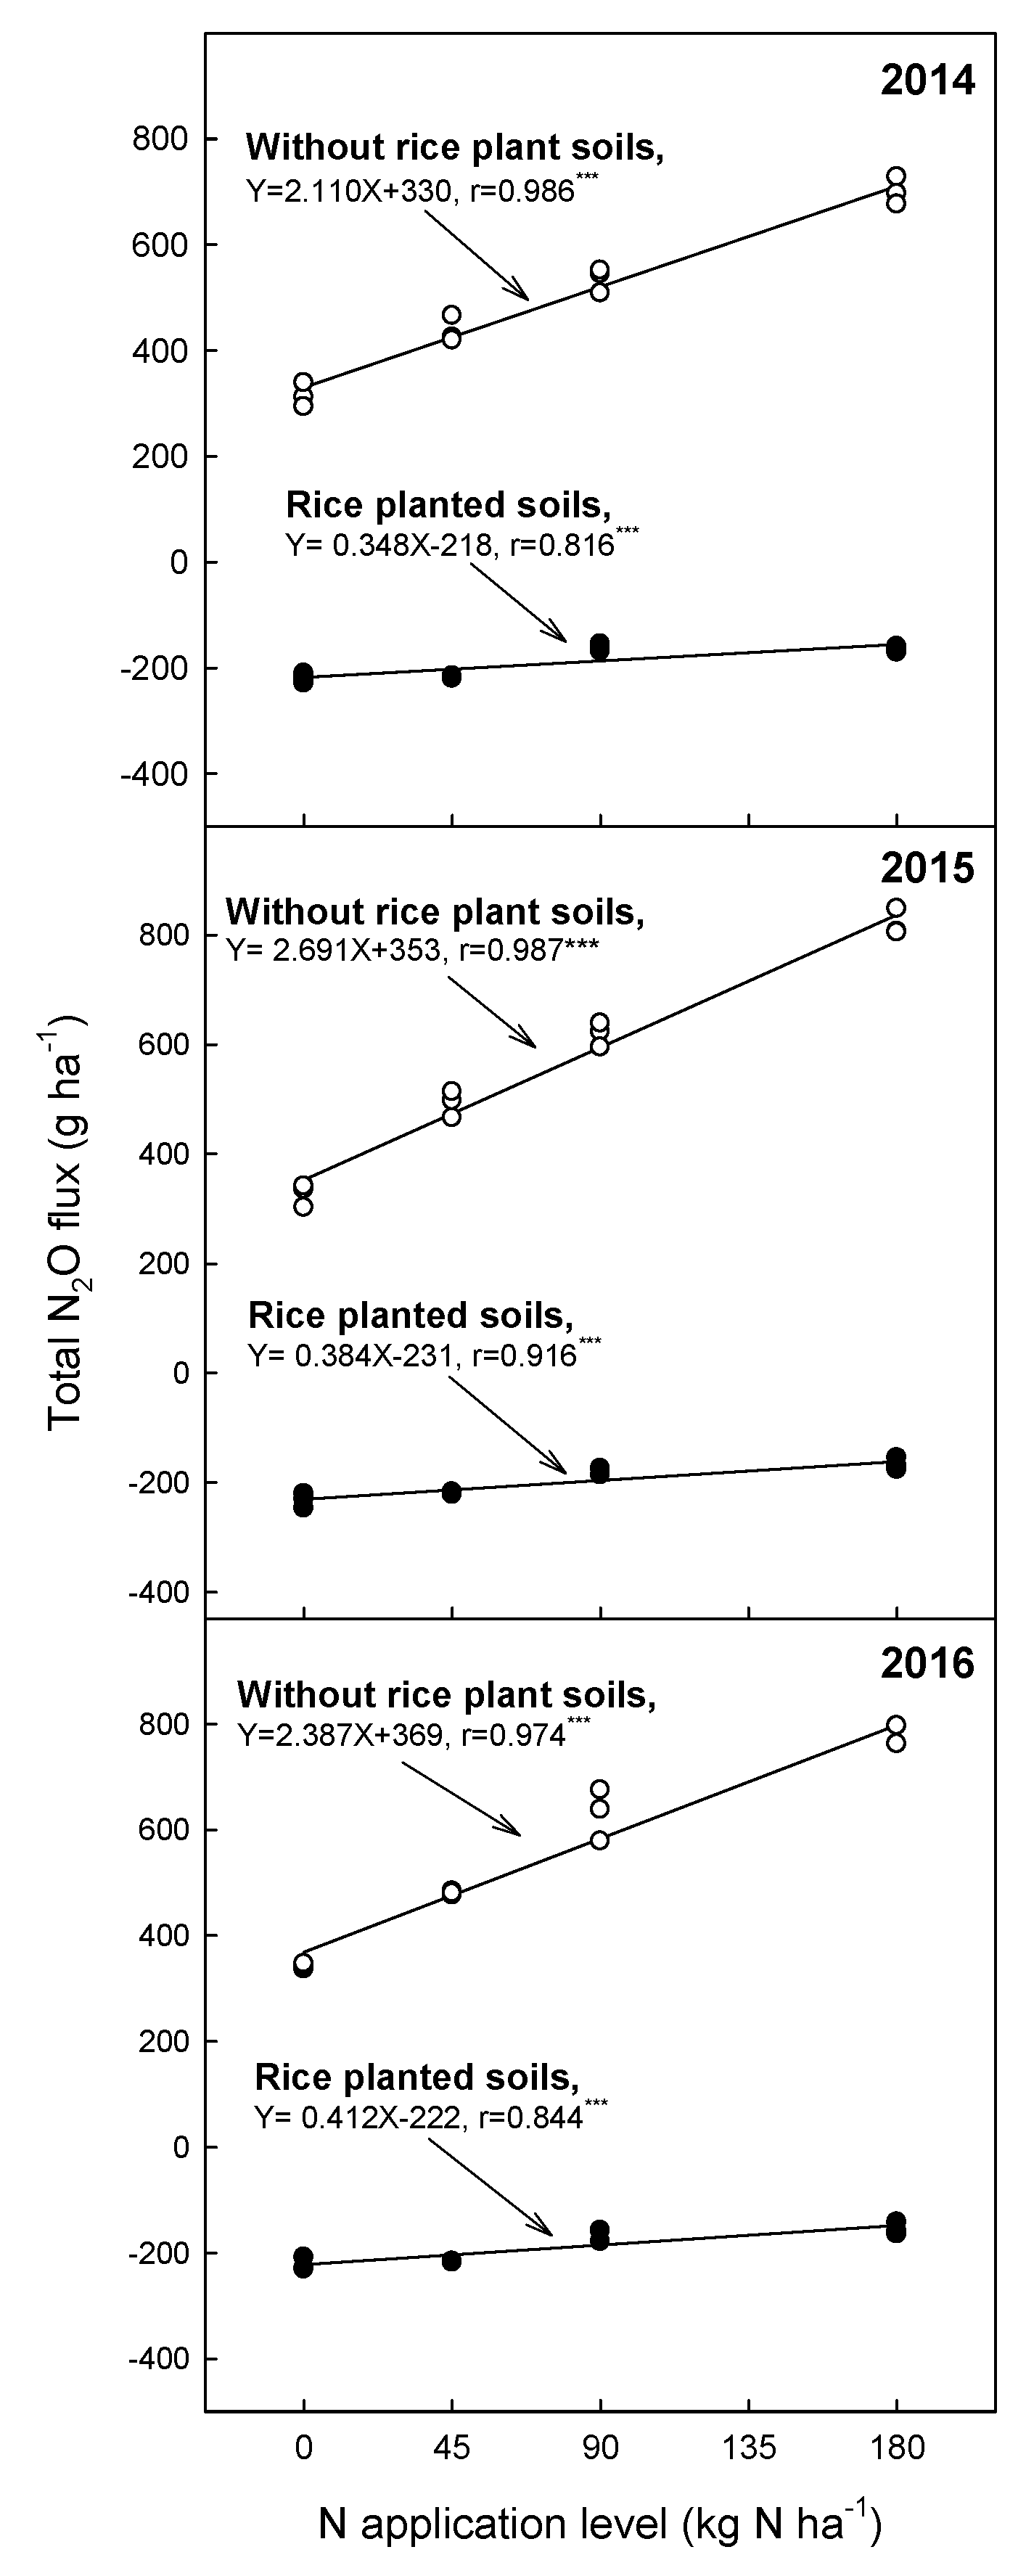
3.4. Changes of Seasonal N2O Fluxes

Seasonal N2O fluxes significantly varied depending on whether the N2O gas concentration was measured in rice-planted on non-planted soils (Figure 3). Seasonal N2O flux in rice-planted soils had shown negative values, suggesting that N2O may have been converted into other N forms. Though the numerical values of the negative N2O fluxes were increased with increasing N application rates, the study did not show any treatment-wise variation or seasonal N2O emission from the treatments, which varied from −233 to −155 g N2O ha−1.
However, the seasonal N2O flux showed large positive values in non-planted soils, and clearly increased with multiplicative N application (Figure 3). In the control treatment, the seasonal N2O flux differed at 315–342 g N2O ha−1 and proportionately increased with increasing N application up to 700–820 g N2O ha−1 at 180 kg N ha−1.
The N2O flux gaps between rice-planted and non-planted soils were significantly increased with increasing N application level. In 2014, the N2O flux gaps in the control (0 kg N ha−1) treatment amounted to 0.53 kg N2O ha−1, and to 0.86 kg N2O ha−1 in 200% (180 kg N ha−1) treatment. These trends were similar in all years, and decreasing N2O fluxes were highly correlated to rice biomass properties such as straw, root, tiller number and rice height (Table 2).

4. Discussion

Nitrous oxide is a gaseous intermediate in the reaction sequence of denitrification and a by-product of nitrification that leaks from microbial cells into the soil and atmosphere [29,30,31]. In these two pathways, N2O in aerobic upland soil is generally formed following nitrification, while denitrification is the dominant pathway under an anaerobic soil environment [32]. However, one of the main controlling factors in this reaction is the availability of soil N [33]. Irrespective of chamber installation conditions, seasonal N2O fluxes significantly increased with increasing N fertilizer application (Figure 3). The application of N fertilizer increased the concentration of nitrate (NO3-N), the precursor of N2O, in the soil (Figure S1) and then increased N2O emissions [4,34].
The static chamber method has been the most commonly used for measuring N2O fluxes from agricultural fields, since this technique is relatively inexpensive, versatile in the field and easy to adopt. However, the existence and non-existence of plants inside the chambers can change the air and soil environments inside the chamber, particularly soil inorganic N, and influence N2O fluxes significantly [15,16]. We confirmed a big difference of seasonal N2O fluxes between rice-planted and non-planted chambers under the same N fertilization levels (Figure 3). The seasonal N2O fluxes in the non-planted chambers showed positive values within 315–820 g N2O ha−1 under 0–180 kg N ha−1 of urea application, and were significantly increased by increasing N fertilization with the average rate of 2.11–2.69 g N2O kg−1 N for 3 years. These values were significantly lower than IPCC default values from the flooded rice paddy field (4.71g N2O kg−1 N) [35]. In comparison, the seasonal N2O fluxes in rice-planted chambers were proportionally increased by N application with the rate of 0.348–0.412 g N2O kg−1 N, but showed negative values within minus 155–233 g N2O ha−1 with 0–180 kg N ha−1 of urea application. Several studies also showed a similar result, i.e., a negative N2O flux value in the rice-planted chambers [36,37,38]. This means that the level of N2O flux was consumed during rice cultivation, and rice fields acted as a sink of N2O, not a source of N2O emission. Since the suppression of N2O flux occurred in the soil including rice plants, it could be hypothesized that the phenomenon happened in rice rhizosphere, and the roots of rice plants may have played an important role in the process. The application of N fertilizers improved plant physiology, i.e., it increased both the above-ground and root biomass of rice plants (Table 1) and the plants’ N uptake. The comparison revealed a significantly positive correlation between root biomass and reduction in N2O flux (Table 2). For further illustration, a three-dimensional (3D) scattered plot was generated by considering doses of N fertilization as the x-axis and the root biomass as the y-axis. The points representing the decrease in annual N2O flux followed a linear relation in the 3D plot (Figure 4).
It is well known that plants can significantly affect N2O fluxes from soils [15,16]. Therefore, planting conditions inside the chambers may clearly differentiate the N2O fluxes in soils. Plants assimilate huge amounts of N during the growing stage, reduce labile N concentration in soils and then suppress N2O emission [39]. Plant leaves could also emit N2O during N assimilation [16,40], but the relative significance of plant-derived N2O production is not well understood. The magnitude of any reduced N2O flux by planting will depend on plant species, the amount of biomass enclosed by the chamber, inorganic N forms in the soil and their amounts. Thus, researchers need to be aware of these issues when designing experiments specifically to look at the plants’ effects on N2O fluxes.
Rice has a bunched root system and air transmission through hollow aerenchyma to make the rhizosphere of rice plants partially aerobic [41]. We previously confirmed that the higher root biomass of different rice plants is responsible for increased aeration in their rhizosphere, and that, in turn, was attributed to the enhanced CH4 oxidation in the soil [42]. Therefore, it could be inferred that the increased root biomass of higher doses of N-treated rice plants was possibly increased by a more aerobic environment in their rhizosphere, which leads to more oxidation of N2O generated in the soil. Based on these observations, it could be concluded that an increased root biomass due to higher rates of N fertilization antagonistically influences N2O formation by enhancing the aeration in the rhizosphere of rice plants.

5. Conclusions

Nitrogen fertilization significantly increased N2O emissions in rice paddy soil during cropping season. Seasonal N2O fluxes responded differently to N fertilization in soils with and without planted rice. In non-planted soils, seasonal N2O fluxes showed positive values and were proportionally increased by increasing N fertilization, with an average rate of 2.11–2.69 g N2O kg−1 N. In rice-planted soils, seasonal N2O fluxes were significantly increased by N fertilization, with the rate of 0.348–0.412 g N2O kg−1 N, but showed negative values ranging from minus 155 to minus 233 g N2O ha−1 at 0–180 kg N ha−1 of urea application, indicating that rice cropping fields reacted as a N2O sink, and not as the source. Therefore, N2O fluxes should be measured using the rice planted static chamber to obtain a more exact agricultural field environment. The difference in N2O fluxes between rice-planted and non-planted soils might have been caused by rice rhizospheric activities, resulting in an increase of the N2O consumption potentials of the rice plants’ rhizosphere. This N2O consumption potential clearly increased with the increase of the level of N fertilizer application, and positively correlated with root, straw and total biomass productivities. The decrease of N2O fluxes at high levels of N fertilization in rice-planted soils might be caused by the decreasing denitrification potential in paddy fields, but further study is needed to figure out the specific mechanism.

Supplementary Materials

The following are available online at https://www.mdpi.com/2073-4395/11/2/217/s1, Figure S1: Changes in NO3-N concentration in rice-planted and non-planted soils under different levels of N fertilizer application.

Author Contributions

Conceptualization, G.W.K.; methodology, G.W.K.; investigation, G.W.K. and M.I.K.; writing—original draft preparation, G.W.K. and M.I.K.; writing—review and editing, S.-J.L.; supervision, P.J.K. All authors have read and agreed to the published version of the manuscript.

Funding

This research was funded by Ministry of Education, grant number NRF-2015R1A6A1A03031413 and NRF-2020H1D3A1A04081088.

Institutional Review Board Statement

Not applicable.

Informed Consent Statement

Not applicable.

Data Availability Statement

Not applicable.

Acknowledgments

This work was supported by Basis Science Research Program through the National Research Foundation of Korea (NRF), funded by the Ministry of Education (NRF- 2020H1D3A1A04081088).

Conflicts of Interest

The authors declare no conflict of interest.

References

  1. IPCC. Climate Change 2007: Mitigation of Climate Change—Contribution of Working Group III to the Fourth Assessment Report of the Intergovernmental Panel on Climate Change; Cambridge University Press: Cambridge, UK, 2007. [Google Scholar]
  2. Ravishankara, A.; Daniel, J.S.; Portmann, R.W. Nitrous oxide (N2O): The dominant ozone-depleting substance emitted in the 21st century. Science 2009, 326, 123–125. [Google Scholar] [CrossRef] [PubMed] [Green Version]
  3. World Meteorological Organization. Current extreme weather events. In Weather Extremes in a Changing Climate: Hindsight on Foresight; World Meteorological Organization: Geneva, Switzerland, 2010; Available online: http://www.wmo.int/pages/mediacentre/news/extremeweathersequence_2010_en.html (accessed on 5 October 2011).
  4. Bouwman, A.; Boumans, L.; Batjes, N. Emissions of N2O and NO from fertilized fields: Summary of available measurement data. Glob. Biogeochem. Cycles 2002, 16, 6-1–6-13. [Google Scholar] [CrossRef]
  5. Smith, P.; Martino, Z.; Cai, D. Agriculture. In Climate Change 2007: Mitigation; IPCC: Geneve, Switzerland, 2007. [Google Scholar]
  6. Syakila, A.; Kroeze, C. The global nitrous oxide budget revisited. Greenh. Gas Meas. Manag. 2011, 1, 17–26. [Google Scholar] [CrossRef]
  7. Sutton, M.A.; Nemitz, E.; Erisman, J.W.; Beier, C.; Bahl, K.B.; Cellier, P.; de Vries, W.; Cotrufo, F.; Skiba, U.; di Marco, C.; et al. Challenges in quantifying biosphere–atmosphere exchange of nitrogen species. Environ. Pollut. 2007, 150, 125–139. [Google Scholar] [CrossRef] [PubMed] [Green Version]
  8. Nayak, D.; Babu, Y.J.; Datta, A.; Adhya, T. Methane oxidation in an intensively cropped tropical rice field soil under long-term application of organic and mineral fertilizers. J. Environ. Qual. 2007, 36, 1577–1584. [Google Scholar] [CrossRef]
  9. Stehfest, E.; Bouwman, L. N2O and NO emission from agricultural fields and soils under natural vegetation: Summarizing available measurement data and modeling of global annual emissions. Nutr. Cycl. Agroecosyst. 2006, 74, 207–228. [Google Scholar] [CrossRef]
  10. Venterea, R.T.; Bijesh, M.; Dolan, M.S. Fertilizer source and tillage effects on yield-scaled nitrous oxide emissions in a corn cropping system. J. Environ. Qual. 2011, 40, 1521–1531. [Google Scholar] [CrossRef] [Green Version]
  11. Birla, D.S.; Malik, K.; Sainger, M.; Chaudhary, D.; Jaiwal, R.; Jaiwal, P.K. Progress and challenges in improving the nutritional quality of rice (Oryza sativa L.). Crit. Rev. Food Sci. Nutr. 2017, 57, 2455–2481. [Google Scholar] [CrossRef]
  12. Rejesus, R.M.; Mohanty, S.; Balagtas, J.V. Forecasting global rice consumption, Department of Agricultural and Resource Economics, North Carolina State University. Crit. Rev. Food Sci. Nutr. 2012, 57, 2455–2481. [Google Scholar]
  13. Mosier, A.R.; Bleken, M.A.; Chaiwanakupt, P.; Ellis, E.C.; Freney, J.R.; Howarth, R.B.; Matson, P.A.; Minami, K.; Naylor, R.; Weeks, K.N.; et al. Policy implications of human-accelerated nitrogen cycling. In The Nitrogen Cycle at Regional to Global Scales; Springer: Berlin/Heidelberg, Germany, 2002; pp. 477–516. [Google Scholar]
  14. Dobermann, A.; Cassman, K.G. Cereal area and nitrogen use efficiency are drivers of future nitrogen fertilizer consumption. Sci. China Ser. C Life Sci. 2005, 48, 745–758. [Google Scholar]
  15. Jørgensen, C.J.; Struwe, S.; Elberling, B. Temporal trends in N2O flux dynamics in a Danish wetland–effects of plant-mediated gas transport of N2O and O2 following changes in water level and soil mineral-N availability. Glob. Chang. Biol. 2012, 18, 210–222. [Google Scholar] [CrossRef]
  16. Yu, K.; Chen, G. Nitrous Oxide Emissions from Terrestrial Plants: Observations, Mechanisms and Implications. In Nitrous Oxide Emissions Research Progress; Nova Science Publishers: Hauppauge, NY, USA, 2009; pp. 85–104. [Google Scholar]
  17. de Klein, C.A.; Barton, L.; Sherlock, R.R.; Li, Z.; Littlejohn, R.P. Estimating a nitrous oxide emission factor for animal urine from some New Zealand pastoral soils. Soil Res. 2003, 41, 381–399. [Google Scholar] [CrossRef]
  18. Luo, J.; Lindsey, S.; Ledgard, S. Nitrous oxide emissions from animal urine application on a New Zealand pasture. Biol. Fertil. Soils 2008, 44, 463–470. [Google Scholar] [CrossRef]
  19. Kallenbach, C.M.; Rolston, D.E.; Horwath, W.R. Cover cropping affects soil N2O and CO2 emissions differently depending on type of irrigation. Agric. Ecosyst. Environ. 2010, 137, 251–260. [Google Scholar] [CrossRef]
  20. Peyrard, C.; Mary, B.; Perrin, P.; Véricel, G.; Gréhan, E.; Justes, E.; Léonard, J. N2O emissions of low input cropping systems as affected by legume and cover crops use. Agric. Ecosyst. Environ. 2016, 224, 145–156. [Google Scholar] [CrossRef]
  21. Zhang, A.; Cui, L.; Pan, G.; Li, L.; Hussain, Q.; Zhang, X.; Zheng, J.; Crowley, D. Effect of biochar amendment on yield and methane and nitrous oxide emissions from a rice paddy from Tai Lake plain, China. Agric. Ecosyst. Environ. 2010, 139, 469–475. [Google Scholar] [CrossRef]
  22. Hopkins, W.; Hüner, N. Acclimation to environmental stress. In Introduction to Plant Physiology; John Wiley and Sons: Hoboken, NJ, USA, 2009; pp. 241–260. [Google Scholar]
  23. RDA. Fertilization Standards to Crop Plants; National Institute of Agricultural Science and Technology, RDA: Suwon, Korea, 1999; p. 148. (In Korean) [Google Scholar]
  24. RDA. Standard Investigation Methods for Agriculture Experiment; National Institute of Agricultural Science and Technology, RDA: Suwon, Korea, 1995; p. 601. (In Korean) [Google Scholar]
  25. Rolston, D.E. Gas flux. In Methods of Soil Analysis, 2nd ed.; Klute, A., Ed.; ASA and SSSA: Dadisom, WI, USA, 1986; pp. 1103–1119. [Google Scholar]
  26. Lou, Y.; Li, Z.; Zhang, T.; Liang, Y. CO2 emissions from subtropical arable soils of China. Soil Biol. Biochem. 2004, 36, 1835–1842. [Google Scholar] [CrossRef]
  27. Singh, S.; Singh, J.; Kashyap, A. Methane flux from irrigated rice fields in relation to crop growth and N-fertilization. Soil Biol. Biochem. 1999, 31, 1219–1228. [Google Scholar] [CrossRef]
  28. Huang, Y.; Zhang, W.; Sun, W.; Zheng, X. Net primary production of Chinese croplands from 1950 to 1999. Ecol. Appl. 2007, 17, 692–701. [Google Scholar] [CrossRef]
  29. Butterbach-bahl, K.; Baggs, E.M.; Dannenmann, M.; Kiese, R.; Zechmeisterboltenstern, S. Nitrous oxide emissions from soils: How well do we understand the processes and their controls? Philos. Trans. R. Soc. 2013, 368, 91–97. [Google Scholar] [CrossRef]
  30. Ma, S.; Shan, J.; Yan, X.Y. N2O emissions dominated by fungi in an intensively managed vegetable field converted from wheat–rice rotation. Appl. Soil Ecol. 2017, 116, 23–29. [Google Scholar] [CrossRef]
  31. Zhang, J.B.; Müller, C.; Cai, Z.C. Heterotrophic nitrification of organic N and its contribution to nitrous oxide emissions in soils. Soil Biol. Biochem. 2015, 84, 199–209. [Google Scholar] [CrossRef]
  32. Sey, B.K.; Manceur, A.M.; Whalen, J.K.; Gregorich, E.G.; Rochette, P. Small-scale heterogeneity in carbon dioxide, nitrous oxide and methane production from aggregates of a cultivated sandy-loam soil. Soil Biol. Biochem. 2008, 40, 2468–2473. [Google Scholar] [CrossRef]
  33. Verchot, L.; Hutabarat, L.; Hairiah, K.; van Noordwijk, M. Nitrogen availability and soil N2O emissions following conversion of forests to coffee in southern Sumatra. Glob. Biogeochem. Cycles 2006, 20, GB4008. [Google Scholar] [CrossRef]
  34. Paul, E.A. Soil Microbiology, Ecology and Biochemistry; Academic Press: Cambridge, MA, USA, 2014. [Google Scholar]
  35. IPCC. Chapter 11.2: N2O emissions from managed soils, Intergovernmental Panel on Climate Change. In 2006 IPCC Guidelines for National Greenhouse Gas Inventories; IPCC: Geneve, Switzerland, 2006. [Google Scholar]
  36. Hou, A.; Chen, G.; Wang, Z.; Van Cleemput, O.; Patrick, W., Jr. Methane and nitrous oxide emissions from a rice field in relation to soil redox and microbiological processes. Soil Sci. 2000, 64, 2180–2186. [Google Scholar] [CrossRef]
  37. Wang, Y.; Hu, C.; Zhu, B.; Xiang, H.; He, X. Effects of wheat straw application on methane and nitrous oxide emissions from purplish paddy fields. Plant Cell Environ. 2010, 56, 16–22. [Google Scholar] [CrossRef] [Green Version]
  38. Yu, K.; Patrick, W.H. Redox window with minimum global warming potential contribution from rice soils. Soil Sci. Soc. Am. J. 2004, 68, 2086–2091. [Google Scholar] [CrossRef] [Green Version]
  39. Van Groenigen, J.; Velthof, G.; Oenema, O.; Van Groenigen, K.; Van Kessel, C. Towards an agronomic assessment of N2O emissions: A case study for arable crops. Eur. J. Soil Sci. 2010, 61, 903–913. [Google Scholar] [CrossRef]
  40. Smart, D.R.; Bloom, A.J. Wheat leaves emit nitrous oxide during nitrate assimilation. Proc. Natl. Acad. Sci. USA 2001, 98, 7875–7878. [Google Scholar] [CrossRef] [Green Version]
  41. Colmer, T.D. Long-distance transport of gases in plants: A perspective on internal aeration and radial oxygen loss from roots. Plant Cell Environ. 2003, 26, 17–36. [Google Scholar] [CrossRef] [Green Version]
  42. Gutierrez, J.; Atulba, S.L.; Kim, G.; Kim, P.J. Importance of rice root oxidation potential as a regulator of CH4 production under waterlogged conditions. Biol. Fertil. Soils 2014, 50, 861–868. [Google Scholar] [CrossRef]
Figure 1. Changes in air and soil temperatures and soil Eh values during the rice cultivation periods.
Agronomy 11 00217 g001
Figure 2. Changes in N2O emission rates in rice-planted and non-planted soils under different levels of N application (↙indicates N fertilizer application time).
Agronomy 11 00217 g002
Figure 3. Seasonal N2O fluxes from submerged rice paddy soil as affected by the rate of N application and the presence of plants. *** indicate significant difference at p < 0.001.
Agronomy 11 00217 g003
Figure 4. Relationship of the rates of N application and root biomass of rice plants with decreased N2O flux by rice plants during rice cultivation.
Agronomy 11 00217 g004
Table 1. The properties of rice growth and yield characteristics at the harvesting stage under different levels of nitrogen application.
YearN Levels
(kg N ha−1)
Yield
(Mg ha−1)
Straw
(Mg ha−1)
Root
(Mg ha−1)
Height
(cm)
Tiller Number
Per Hill
201404.60 ± 0.51 b a5.93 ± 0.19 c1.05 ± 0.05 c87 ± 0.9 d11 ± 0.3 c
455.21 ± 0.27 ab7.07 ± 0.14 b1.23 ± 0.03 b94 ± 0.6 c14 ± 1.2 b
905.90 ± 0.05 a8.26 ± 0.49 a1.42 ± 0.05 a105 ± 0.8 b14 ± 1.0 b
1805.41 ± 0.33 ab9.06 ± 0.31 a1.45 ± 0.01 a108 ± 0.6 a18 ± 0.4 a
201504.98 ± 0.23 b6.14 ± 0.18 c1.11 ± 0.03 c92 ± 0.6 c12 ± 0.7 b
455.42 ± 0.99 ab7.30 ± 0.12 b1.30 ± 0.10 b96 ± 0.9 b15 ± 1.0 ab
906.74 ± 0.24 a8.39 ± 0.26 b1.51 ± 0.05 a97 ± 0.9 b16 ± 16.1 a
1805.84 ± 0.39 ab9.32 ± 0.55 a1.52 ± 0.04 a104 ± 1.2 a17 ± 1.4 a
201605.31 ± 0.39 b6.32 ± 0.38 c1.16 ± 0.01 b95 ± 2.4 b11 ± 0.5 b
456.03 ± 0.43 ab7.66 ± 0.14 b1.37 ± 0.03 ab96 ± 2.0 b13 ± 2.9 ab
906.92 ± 1.12 a8.56 ± 0.45 b1.55 ± 0.09 a98 ± 2.7 b14 ± 2.9 ab
1806.32 ± 1.71 ab9.58 ± 0.42 a1.59 ± 0.20 a107 ± 1.1 a17 ± 0.42 a
Statistical analysis b
Year (A)***NS**NS
N application (B)**************
A × BNSNSNS***NS
a Mean values followed by different letters in the same column indicate a significance difference among treatments within a single year at p < 0.05. b NS means not significant F-values for p < 0.05, *, **, and *** indicate significant difference at p < 0.05, p < 0.01 and p < 0.001, respectively.
Table 2. Correlation between rice growth or yield properties and decreased N2O fluxes.
PropertiesYear
201420152016
Grain0.547 *0.4820.351
Straw0.899 ***0.946 ***0.984 ***
Root0.856 ***0.865 ***0.824 ***
Tiller number0.898 ***0.952 ***0.870 ***
Rice height0.937 ***0.850 ***0.787 **
*, **, and *** indicate significant difference at p < 0.05, p < 0.01 and p < 0.001, respectively.
Publisher’s Note: MDPI stays neutral with regard to jurisdictional claims in published maps and institutional affiliations.

