Article

Effect of Biochar and PGPR on the Growth and Nutrients Content of Einkorn Wheat (Triticum monococcum L.) and Post-Harvest Soil Properties

1
Department of Field Crops, Faculty of Agriculture, Siirt University, 56100 Siirt, Turkey
2
Department of Seed Science and Technology, Faculty of Agriculture, Bolu Abant Izzet Baysal University, 14030 Bolu, Turkey
3
Faculty of Agricultural Sciences and Technologies, Sivas University of Science and Technology, 58140 Sivas, Turkey
4
Department of Agronomy, Faculty of Agriculture, Kafrelsheikh University, Kafr Elsheikh 33516, Egypt
*
Author to whom correspondence should be addressed.
Agronomy 2021, 11(12), 2418; https://doi.org/10.3390/agronomy11122418
Submission received: 13 September 2021 / Revised: 19 November 2021 / Accepted: 23 November 2021 / Published: 27 November 2021

Abstract

:
Limited availability of nutrients to crops is a major agricultural concern. Deteriorated soil health and poor fertility status decrease the bioavailability of essential nutrients to the plants. Consequently, organic soil amendment biochar is gaining attention due to its potential benefits. Rhizobacterial inoculation, are also documented as an effective technology for mobilization of immobile nutrients in soil. However, limited literature is available on combined use of rhizobacteria and biochar. Therefore, this study was carried out to examine the changes in the nutrient content of einkorn wheat and the change in some soil properties during the application of plant growth-promoting rhizobacteria (PGPR) with biochar. Four doses of biochar (0, 2.5, 5, and 10%) were applied with and without PGPR in the study. Biochar increased the growth criteria such as plant fresh weight (PFW), plant dry weight (PDW), root fresh weight (RFW), root dry weight (RDW), number of tillers, germination rate (GR) and potassium (K), calcium (Ca), sodium (Na), iron (Fe), copper (Cu), zinc (Zn), manganese (Mn), and nickel (Ni) elements. While PGPR application increased soil pH, dry and fresh weight of root, R/S, K, Ca, Mg, Fe, and Ni contents, and it caused a decrease in PH, PFW, tillers, GR, P, Cu, and Zn values. Combined biochar applications and PGPR had a significant effect on the pH, RFW, R/S, P, Na, and Cu. In conclusion, the combination of biochar and PGPR applications has shown a positive effect in terms of soil properties, plant growth, and element contents of einkorn wheat.

1. Introduction

Soil organic matter depletion over time is one of the critical problems encountered in agricultural lands. Application of organic fertilizers would be the best option to overcome this issue. The applied barn manure, compost, or green manure decomposes very quickly and needs to be applied in every two years. In this case, the required amount of organic fertilizer cannot always be provided. Biochar (B), which can survive in the soil for many years after application depending on the soil conditions, appears as a good alternative [1]. It was first encountered in the Amazon basin. The use of biochar gained importance with the discovery of Terra Pretra, which is a dark colored, high carbon and organic matter content and a highly fertile soil [2]. It is thought that biochar obtained by physical and chemical differentiation of plant-based wastes at high temperatures can reduce the washing of nutrients and increase fertilizer use efficiency [3]. Since the carbon compounds in the produced biochar are resistant to decomposition, they therefore tend to stay in the soil for a long time [1].
Biochar has a highly porous structure and its macropores provide ventilation to the soil where it is applied, and it creates a living space for microorganisms [4]. Low amounts of chemical substances in biochar help plant growth by acting as hormones. At the same time, with its physical and chemical properties, biochar supports the growth of rhizobacteria and fungi that help plant growth [5]. As a result of biochar application in agricultural areas, organic carbon in the soil decomposes more slowly, increasing the total amount of organic matter in the soil. Consequently, it has been stated by many researchers that the application of different biochar materials may have a slowing effect on the global climate. In addition, it has been reported in many published studies that the application of biochar to the soil can reduce greenhouse gas like nitrous oxide (N2O) emission [6]. Biochars obtained from different materials used in the soil prevent the washing out of nutrients, increase the KDK, buffer soil pH, and increase the water-holding capacity of the soil [1,7,8,9]. The increase in soil pH with biochar application limits the mobility of heavy metals [10,11].
It has been reported that the effects of plant growth-promoting rhizobacteria (PGPRs) on the development of plants are generally in the form of encouraging the production of phytohormones, promoting the increase in enzymatic activities, increasing nutrient intake, and increasing other mechanisms [12]. They are also used as biological agents against diseases and pests by increasing plant systemic resistance [13]. Some researchers have also suggested that the aliphatic carbon compounds found in the humus of the soil are degradation products of extracellular polysaccharide, protein, and chitin, which are released or broken down from microbial cells, and hydrophobic long-chain fatty acids synthesized by microbial cells, and they have stated that these substances could persist in the soil for several hundred years without degradation [14]. Thus, it has been suggested that an active PGPR community can also contribute to long-term C accumulation [15]. PGPRs promote resistance to many plant diseases and increase yield significantly by bringing the phosphorus and nitrogen in the soil to the available form that the plant can take [16]. Previous studies have been conducted on the yield-increasing effect of root bacteria, which stimulate plant growth in many countries of the world, and it has been reported that they directly or indirectly enhance the growth of plants [17,18,19].
By considering the importance of biochar and PGPRs for the agricultural system, the present study aimed to determine the effects of increasing doses of biochar applications on the growth criteria of einkorn wheat grown in PGPR-infused and uninoculated environments and also on some physical properties of the soil and the biofortification of wheat.

2. Materials and Methods

2.1. Treatments and Experimental Design

This study was conducted in the climate room of the Abant İzzet Baysal University, Bolu Vocational High School. Einkorn wheat variety (Triticum monococcum L.) was obtained from Kastamonu province, İhsaniye district. Sowing was performed in pots filled with 2 kg soil. The study was planned in three replications according to the factorial trial design in random plots. Biochar doses, viz., BioC0 (0% biochar: control), BioC1 (2.5% biochar), BioC2 (5.0% biochar), BioC3 (10.0% biochar), and also commercial BM-Coton-Plus (PGPR, Bacillus subtilis and Paenibacillus azotofixans, 1 × 10⁷ cfu was used as treatments. Basic fertilizer application was not made. Each application was set up with three repetitions, and the seed was sown with at least 10 plants in each pot. The climate chamber was set to have 16 h daytime, 8 h a night, and 800 lux light intensity at 26 ± 1 °C. The plants were irrigated with pure water during the experiment, and the experiment was continued for 10 weeks. In the days after the experiment was established, germination rates were determined by taking the number of outlets in pots [20]. After the trial was completed, plant height (PH) was taken by measuring the top of the soil with a ruler; tillers (T)—by counting the number of side branches coming out of each root; root fresh (RFW) measurement—after washing the samples with normal water and distilled water, then weighing them on a precision balance (0.0001 g); dry weight (RDW) measurement—until the samples reach a constant weight at 65 °C after drying, they were weighed on a precision balance (0.0001 g); root length (RL) measurement—with a ruler from the root neck to the tip of the root. The above-ground part, cut from the plant fresh (PFW) root collar, was washed first with normal water and then with distilled water, and then weighed (0.0001 g) on a precision balance and dry weight (PDW) samples were dried in the drying cabinet at 65 °C until they reached a constant weight, then weighed on a precision balance. The weight (0.0001 g) was determined by weighing the biochar used in the experiment consisting of 60% sewage sludge and 40% municipal compost. After the pyrolysis process was performed at 400 °C for 30 min, the biochar obtained was ground and sieved through a <0.1 mm sieve. The analysis results of the soil and biochar used are given in Table 1.

2.2. Plant Sampling and Chemical Analyses

The plant samples taken at the end of the experiment were washed with pure water, dried in an oven at 65 °C until they reached a constant weight, and ground with a plant grinding mill. For nutrient analysis of ground plant samples, 0.5 g was weighed into porcelain crucibles, and ethyl alcohol containing 5% sulfuric acid was added. After the pre-combustion process, the temperature was gradually increased in the muffle furnace and burned at 500–520 °C. After incineration, the samples were brought to room temperature in a desiccator. Then, 4 mL of 3 N HCl was added to the porcelain crowns and heated on the hotplate. With the prepared extraction system, the samples were transferred to 50 mL flasks. After which, 4–5 drops of toluene was added to each sample by transferring them to plastic storage containers. All these processes were carried out according to Kacar [21], and the element readings were done on the ICP-OES instrument (Optima 2100 DV, PerkinElmer).

2.3. Soil Sampling and Chemical Analyses

After the experiment, the pH and salt analyses were determined in a 1:2 soil–water mixture, and organic matter analysis in soil samples was made with wet oxidation with potassium dichromate (K2Cr2O7), and lime analysis was determined by calcimetric method according to Kacar [22].

2.4. Statistical Analysis

Variance analyses of the experimental data were accomplished in a completely randomized block design using SAS [23] statistic program and significantly different means numbered according to Fisher’s least significant difference (LSD) test.

3. Results

The averages and variance analysis results of the effects of biochar and PGPR applications on soil properties, development criteria, macroelements, microelements, and heavy metal contents are shown in Table 2, Table 3, Table 4, Table 5 and Table 6. The important data for BiocharxPGPR (BxP) interaction are given in Figure 1, Figure 2, Figure 3, Figure 4, Figure 5 and Figure 6.
As it can be seen in Table 2, biochar (B) application had a significant effect on soil pH, salt, lime, and soil organic matter (SOM) contents at the 1% level. In comparison, PGPR applications only affected the pH at the 5% level. Only the effect of BxP interaction on soil pH was determined to be significant. Biochar applications had an effect of 5% and 1% on all growth parameters except the root length and tillering. PGPR applications had an effect of 5% and 1% on all growth parameters except the plant fresh weight and root length. While BxP interaction had an effect only on the root fresh weight and root–stem ratio at a level of 1%, it was found that it did not significantly affect the other growth parameters (Table 3 and Table 4).
As can be seen in Table 5, application of B affected K, Ca, Mg, and Na contents at the 5% and 1% level, while inoculation of PGPR affected P, K, Ca, and Mg contents at the 1% level. BxP interaction only affected phosphorus and sodium contents at the level of 5%. Biochar affected Fe, Cu, Zn, and Ni contents of Einkorneinkorn wheat at 1% level. Its effect on Mn and Pb contents was not determined.
It was determined that PGPR applications had a significant effect on Fe (1%), Cu (1%), Zn (5%), and Ni (1%) contents except for Mn and Pb. While the interaction of BxPhad an effect only on Cu content at the level of 5%, it was determined that it did not affect others (Table 6).
While the average pH of 7.35 was observed under BioC0 (0% biochar; control) condition, it decreased with the application of biochar and the minimum pH of 7.11 was determined in BioC3 (10% biochar) application. PGPR application remarkably increased the soil pH. While the average soil pH without PGPR was determined as 7.19, and with PGPR measured as 7.24 (Table 7). The changes observed in soil pH in BxP interactions occurred as a slight increase in pH with PGPR applications. The pH was determined as 7.26 in BioC0 without PGPR, and the value was 7.44 with PGPR. A decrease in soil pH was observed with the addition of biochar to the environment, but it was also determined that PGPR applications partially limited this decrease. Without PGPR(-), BioC1 (2.5% biochar) and BioC2 (5.0% biochar) showed the soil pH of 7.23 and 7.16, while with PGPR, the values were 7.25 and 7.18, respectively (Figure 1).
The application of biochar decreased the lime content in the soil. However, the highest lime content (18.95%) was recorded at BioC0 condition, and it decreased to 17.40% with BioC3 (10.0% Biochar) application. Biochar at 10% decreased the lime content by 8.18%. The application of PGPR did not cause a significant decrease in lime content. While non-PGPR (PGPR-) soils were determined as the application of BioC1, BioC2, and BioC3 without PGPR exhibited the lime content of 18.85, 17.59, and 17.29%, and with PGPR, the values were 19.26, 18.21, and 17.50%, respectively (Table 7).
The electrical conductivity (EC) of soil increased with increasing biochar levels. The minimum EC of 342 µS m−1 was recorded at BioC0, and the EC increased to 576, 785, and 933 µS m−1 in BioC1, BioC2, and BioC3, respectively. The EC increased by 68.4, 129.5, and 172.8% over control at BioC1, BioC2, and BioC3, respectively. Applying PGPR to growing media, a partial decrease in EC was observed especially in BioC0 and BioC1 treatments. The EC of control (BioC0) soil without PGPR was 383 µS m−1; it decreased to 302 µS m−1 with PGPR application. Similarly, the treatments BioC1 and BioC3 showed the EC of 633 and 917 µS m−1 without application of PGPR(-), whereas the EC values were 520 and 948 µS m−1 with the application PGPR(+) under the same treatment, respectively (Table 7).
Soil organic matter (SOM) content of soils increased with increasing biochar, while the average SOM content of BioC0 applications was 0.99%, it increased to 2.46, 3.80, and 7.48% in BioC1, BioC2, and BioC3 applications, respectively. These increases were respectively 148.5%, 283.8%, and 655.6% (Table 7).
It was determined that the plant height (PH) significantly decreased with biochar application compared to control (BioC0). However, the tallest plant of 52.50 cm was recorded in the control condition, and it decreased to 46.0 cm with BioC3 application. The rate of reduction was 14.1%. Similarly, PGPR significantly impacted the PH, and PGPR treated plants showed shorter plants (47.42 cm) than non-treated plants (50.33 cm). The average plant height decreased 6.1% due to the application of PGPR (Table 8).
Plant fresh weight (PFW), plant dry weight (PDW), root fresh weight (RFW), and root dry weight (RDW) increased with the increase in biochar applications to the growing medium. Control (BioC0) application was determined as 1.894 g, 0.291 g, 1.397 g, and 0.221 g, respectively. The highest values were determined as 2.403 g, 0.425 g, 1.904 g, and 0.293 g at 5% (BioC2) application, respectively. With the application of 10% biochar (BioC3), a decrease in these values was determined. While PGPR applications had an increasing effect on root fresh weight and dry weight, they caused a decrease in plant fresh weight. Non-PGPR applied plants PFW, PDW, RFW, and RDW were determined to be 2.220 g, 0.353 g, 1.324 g, and 0.177 g, respectively, while in plants with PGPR were determined to be 1.988 g, 0.357 g, 1.688 g, and 0.289 g, respectively (Table 8).
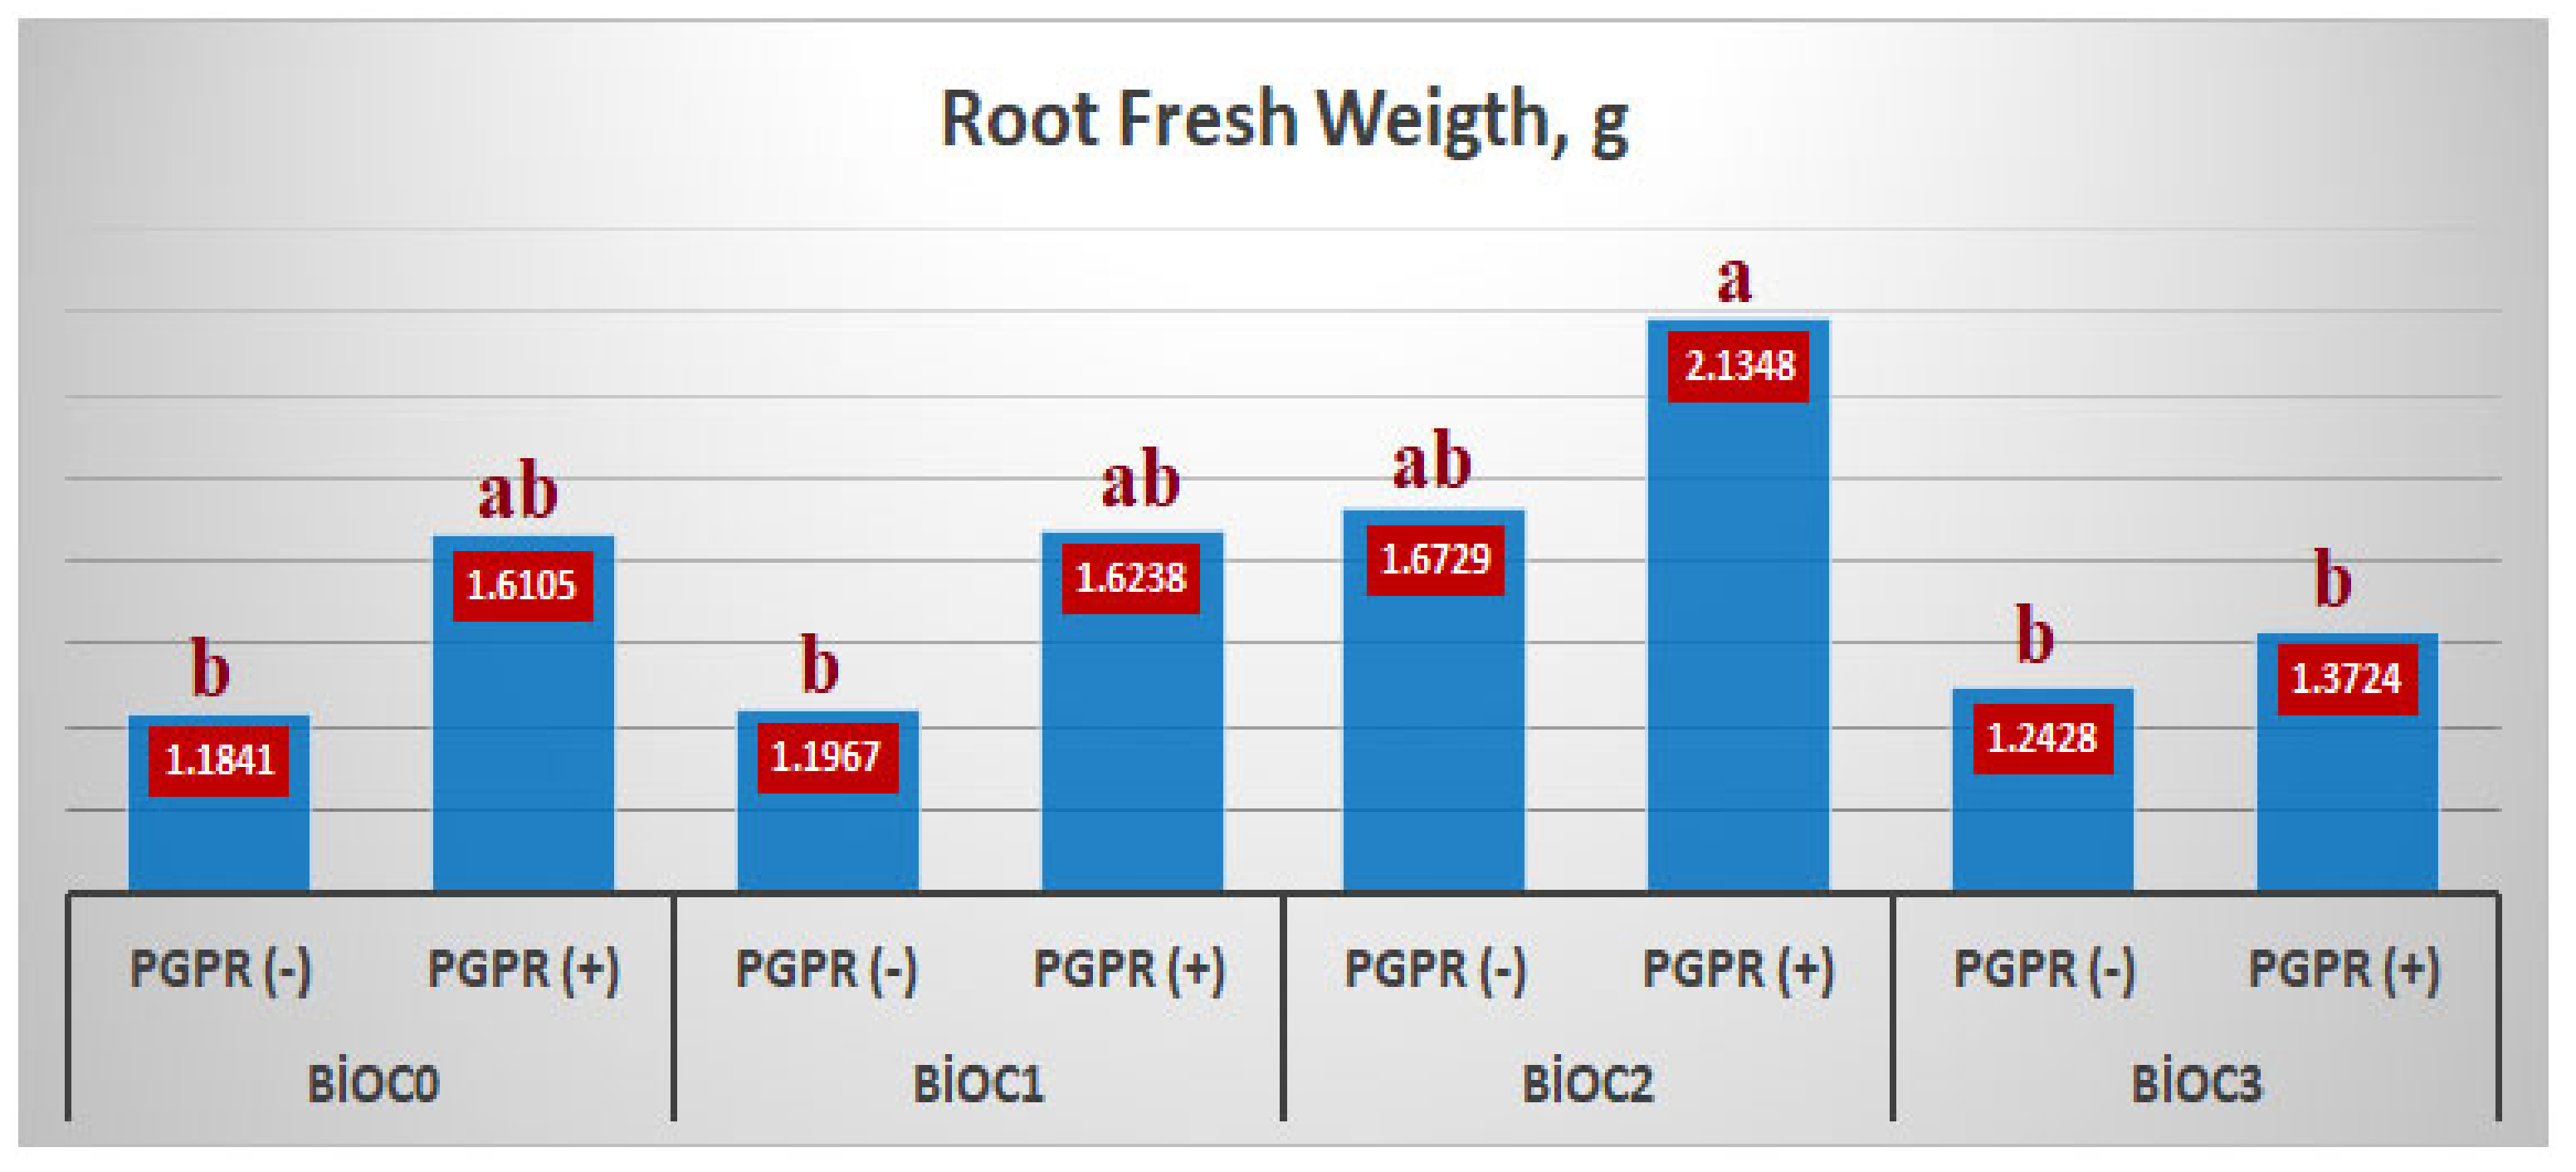
The effect of BxP interaction was significant only on RFW. Maximum root fresh weight was measured as 2.1348 g in the BioC2×PGPR(+) application. This increased by 32.6% compared to BioC0xPGPR(+) application and 80.3% compared to BioC0xPGPR(-) application. BioC3xPGPR(+) application caused a sharp decrease in RFW according to BioC0xPGPR(+), BioC1xPGPR(+), and BioC2xPGPR(+) applications (Figure 2).
As it can be seen in Table 8, tillering of Einkorneinkorn wheat has increased with biochar applications. The number of tillers was 2.69 number in BioC0, increased with biochar application doses and the highest value was determined as 4.32 number in BioC3 application. This increase was 60.6% (Table 8).
While the germination rate of Einkorneinkorn wheat was 3.27 days−1 in BioC0 application, it was determined as 4.04 days−1 in biochar BioC3 application; a 23.4% increase was achieved. PGPR applications decreased the germination rate. The germination rate was 3.74 days in plants without PGPR, and was determined as 3.58 days with PGPR applications (Table 8).
Root–shoot ratio (R/S) decreased with biochar application. R/S ratio of 78.3% in BioC0 decreased to 51.5% with BioC3 application. This decrease was 52%. The root–shoot ratio has increased with PGPR applications. The root–shoot ratio was determined as 54.3% in pots without PGPR and 80.9% in pots with PGPR applied. This increase was 48.9% (Table 8).
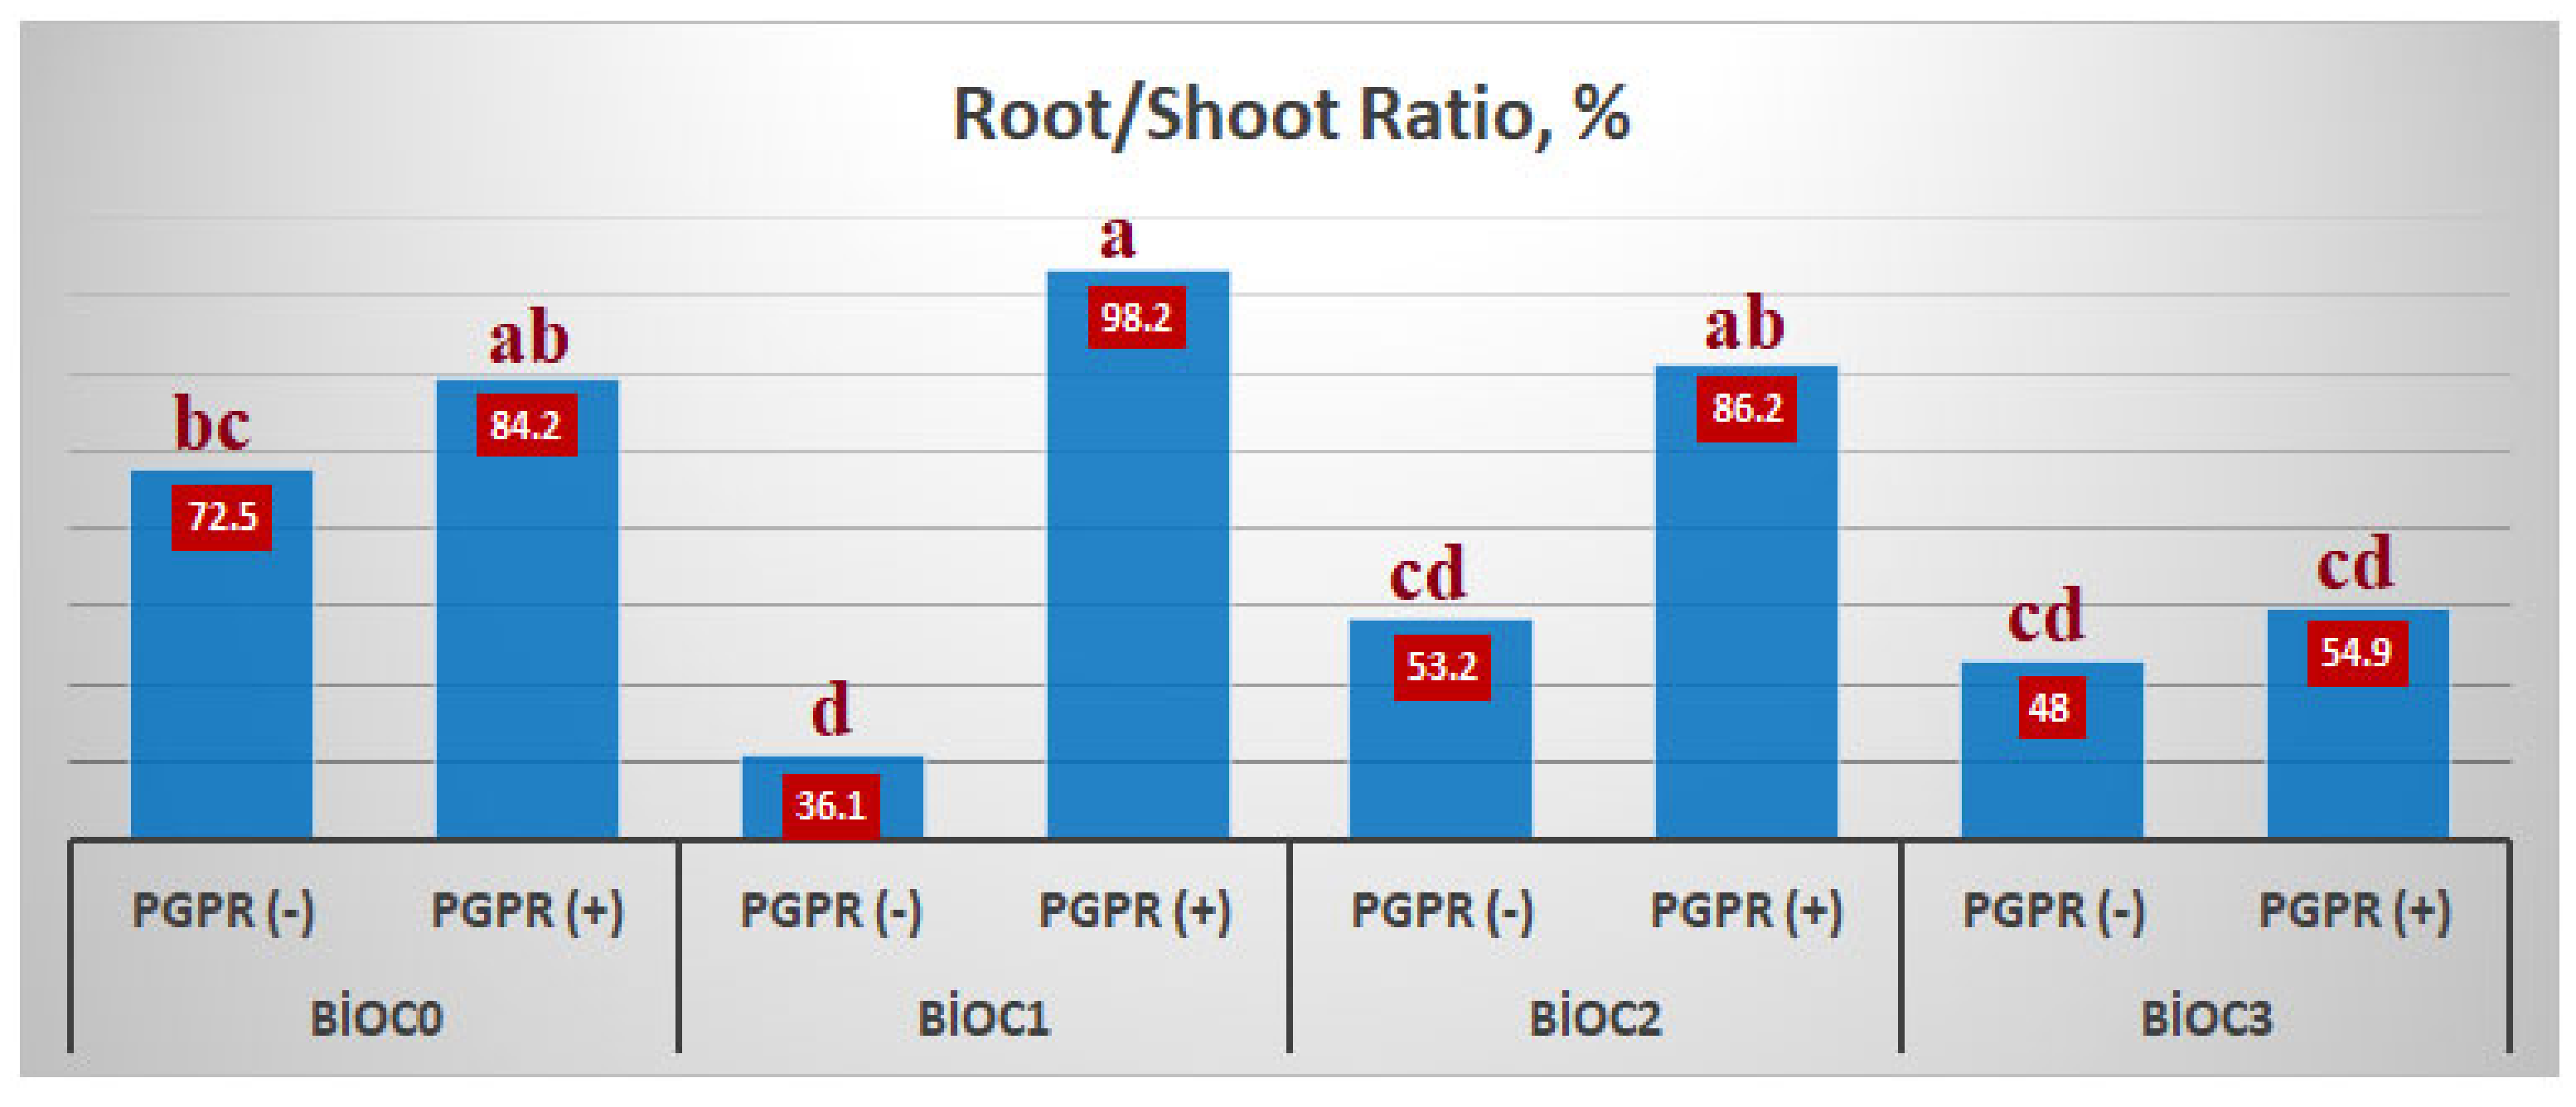
The BxP interaction was found to be statistically significant. The highest R/S ratio was determined in BioC2xPGPR(+) application, the lowest R/S ratio was determined in BioC1xPGPR(-) application, 98.2% and 36.1%, respectively (Figure 3).
Biochar applications on the macroelement contents of einkorn wheat caused an increase in K, Ca, and Na, but decreased P and Mg contents. The highest potassium and sodium contents were determined as 2.450%; 0.2489% in BioC3 application; 2.363% in BioC2 application in calcium; and 0.515% and 0.499% in BioC0 application for phosphorus and magnesium, respectively (Table 9).
While PGPR application increased potassium, calcium and magnesium contents of einkorn wheat, it decreased in P and Na. The K, Ca, P, Mg, and Na contents of the plants without PGPR were determined as 2.090%, 1.97%, 0.4930%, 0.4204%, and 0.2304%, respectively, while the plants treated with PGPR were 2.496%, 2.368%, 0.4452%, 0.4687%, and 0.2183%, respectively. (Table 9).
While increasing biochar applications increased einkorn wheat’s K, Ca, and Na contents, it decreased the P and Mg contents. The highest K and Na in einkorn wheat were determined as 2.450% and 0.2489% in BioC3 application, respectively, while it was determined as 2.363% in BioC3 application in Ca. The highest values of phosphorus and magnesium were determined as 0.499% and 0.515% in BioC0 application, respectively. Although PGPR applications increased einkorn wheat’s K, Ca, and Mg contents, it decreased the P and Na contents. Einkorn wheat K, Ca, and Mg contents reached the highest values with PGPR applications, 2.496%, 2.368%, and 0.468%, respectively. Einkorn wheat’s phosphorus and sodium contents gave the highest values in samples without PGPR, at 0.493% and 0.2304%, respectively (Table 9).
Although BxP interaction caused significant changes in potassium, calcium, and magnesium contents of einkorn wheat, it was not found statistically significant. BxP interaction had a significant effect only on einkorn wheat’s P and Na contents (Table 5).
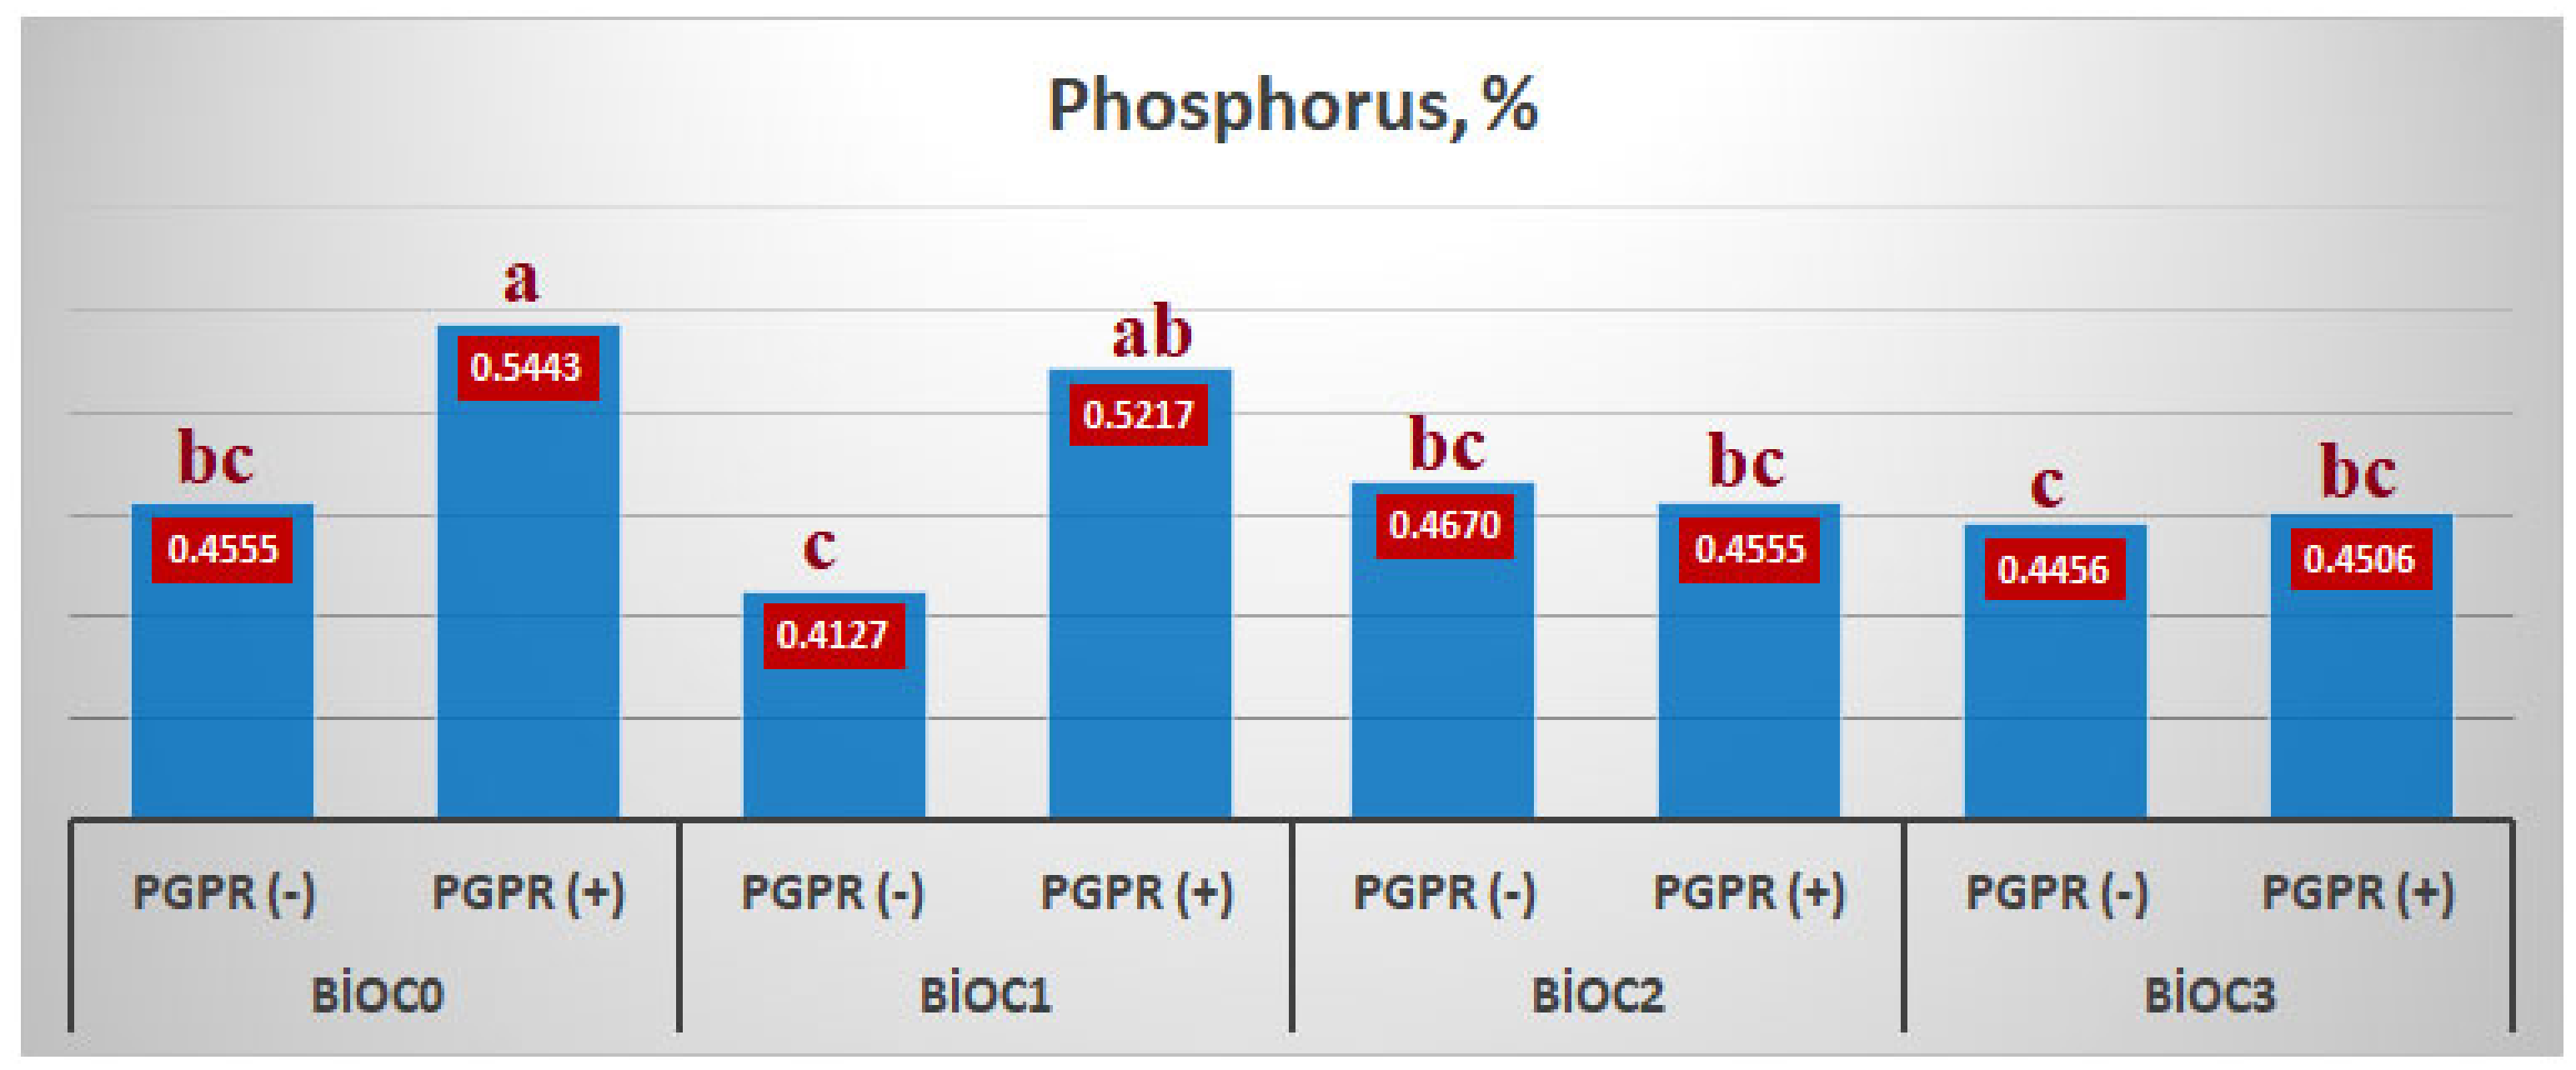
When the effect of BxP interaction on the phosphorus content of einkorn wheat was examined, the highest phosphorus content of einkorn wheat was obtained with BioC0xPGPR(+) application with 0.5443%. As the application of biochar increases, the effect of PGPRs on phosphorus uptake decreases. As shown in Figure 1, with the application of 2.5% biochar to the environment, the effect of PGPRs on phosphorus uptake was partially reduced. Whereas, when 5% and 10% biochar is applied to the environment, the effect of PGPRs has completely decreased (Figure 4).
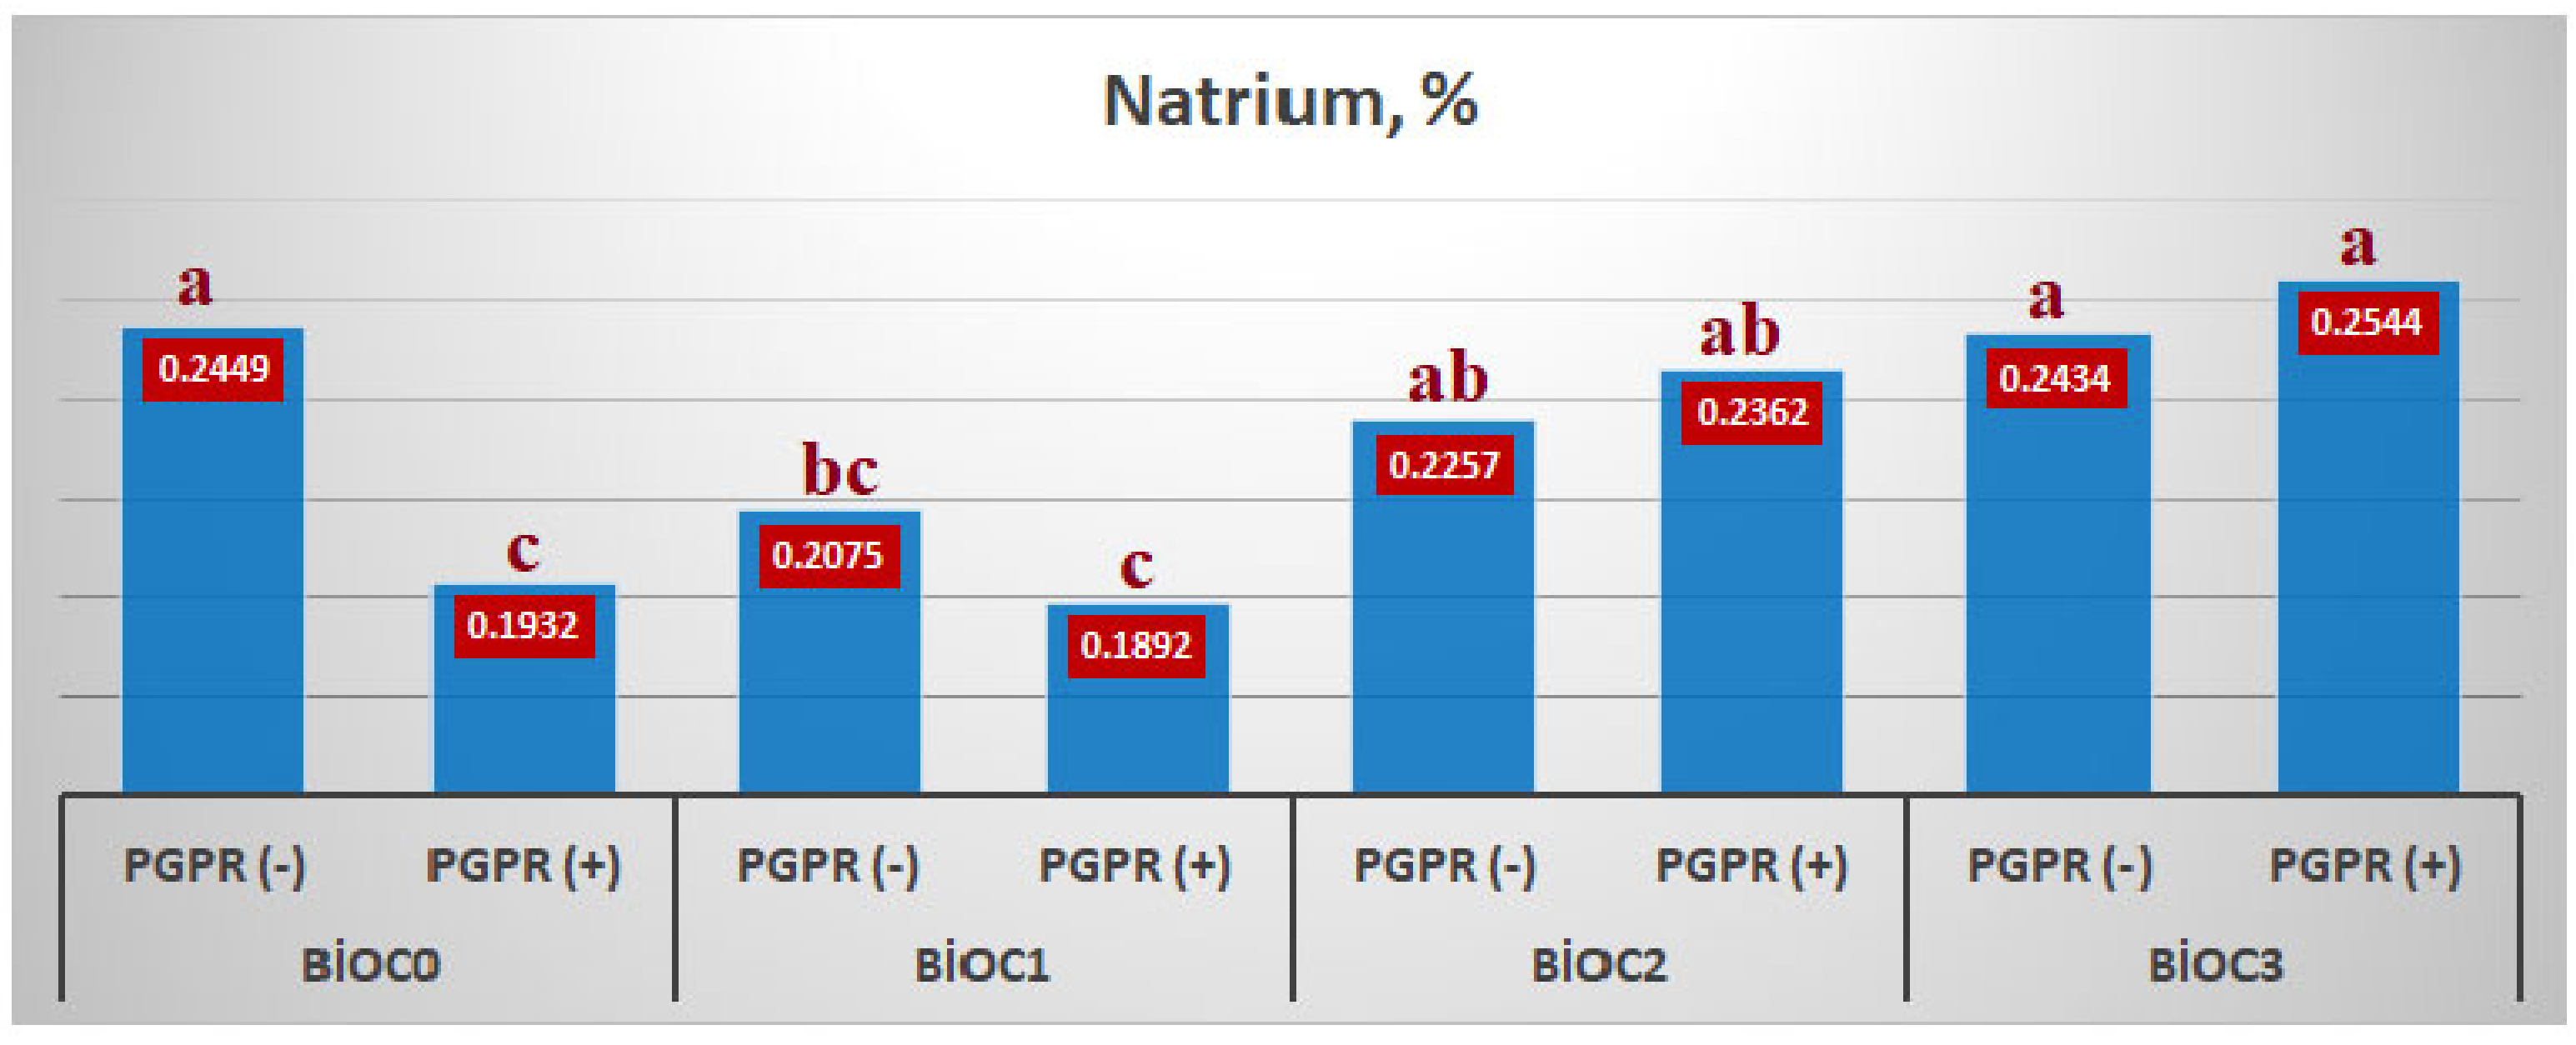
The effect of BxP interaction on the sodium content of einkorn wheat differed whether biochar was applied or not in the environment. In BioC0 and BioC1 applications, sodium intake decreased when PGPR was given to the growing medium, while when PGPR was inoculated in BioC2 and BioC3 applications, the sodium content of einkorn wheat increased. The lowest sodium content in BioC1xPGPR(+) application and the highest in BioC3xPGPR(+) application were determined as 0.1892% and 0.2544%, respectively (Figure 5).
As shown in Table 9, the Fe, Cu, Mn, and Zn contents of einkorn wheat increased with the increase in biochar applications in the growing medium. The highest Fe content of einkorn wheat was determined as 491 mg kg−1 in BioC2 application. BioC3 application in Cu, Zn, and Mn was determined as 20.62 mg kg−1, 240 mg kg−1, and 152 mg kg−1, respectively.
When PGPR was applied to einkorn wheat, the content of Fe and Mn increased, while Zn and Cu contents decreased. Fe and Mn content of einkorn wheat without PGPR was 338 mg kg−1 and 139 mg kg−1, respectively, while it increased to 441 mg kg−1 and 144 mg kg−1 with PGPR application. While zinc and copper contents were 198 mg kg−1 and 17.15 mg kg−1 in einkorn wheat samples without PGPR, it decreased to 178 mg kg−1 and 14.24 mg kg−1, respectively, in PGPR applied einkorn wheat (Table 9).
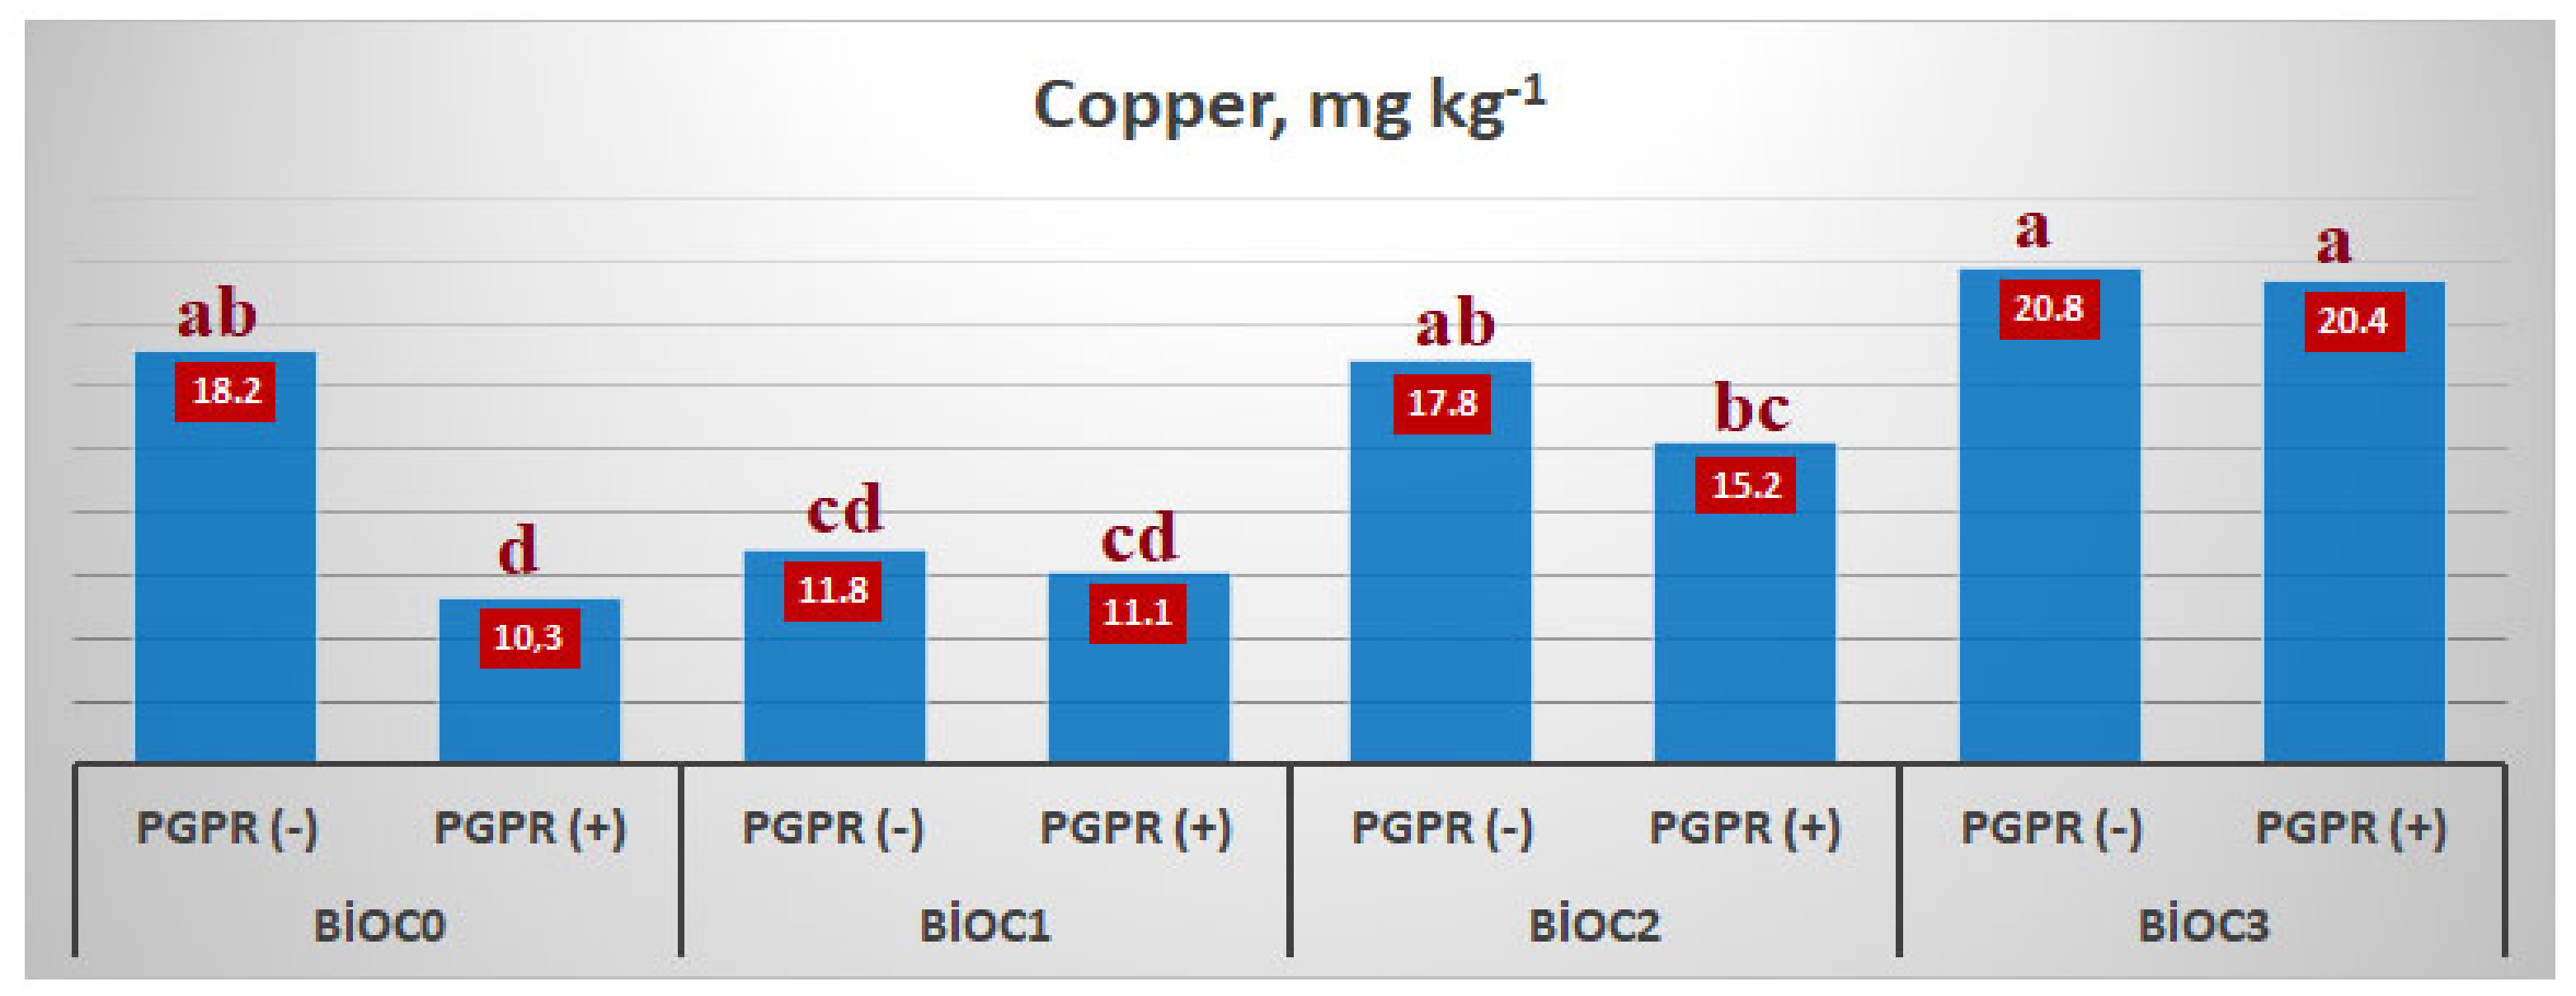
The interaction of BxP only had a significant effect on copper content (Table 6). The inoculation of einkorn wheat with PGPR caused a decrease in the copper content (10.3 mg kg−1). The most significant reduction was detected in the BioC0 application. With the application of biochar to the growing medium, the decrease caused by PGPR was reduced. This was especially evident in BioC3 application (Figure 6).
Biochar applications caused an increase in the lead content of einkorn wheat. In control, the lead content application doses of 16.75 mg kg−1 increased and the highest value was obtained in BioC1 and BioC3 applications with 17.63 mg kg−1 and 17.47 mg kg−1. However, this increase was not found to be statistically significant. Similarly, although PGPR application caused an increase in lead content, it was determined that this increase was not statistically significant. (Table 6 and Table 9).
Nickel content increased with biochar application doses compared to control plants and the highest value was reached in BioC3 application. The nickel content which was 1.733 mg kg−1 in the control was determined as 2.033 mg kg−1, 2.218 mg kg−1, and 2.450 mg kg−1 in BioC1, BioC2, and BioC3 applications, respectively. It has been determined that the nickel content of the plant has increased with PGPR applications. The nickel content of 1.950 mg kg−1 in plants without PGPR was determined as 2.267 mg kg−1 in plants treated with PGPR (Table 9).

4. Discussion

The diversity of microorganisms is important for crop growing media, and it varies considerably. Very few species positively affect the plant growth or nutrient content, and the rest are either neutral or harmless [24]. Among these organisms, the beneficial ones for plants have been studied for many years [19,25]. The beneficial organisms, especially those that play a significant role as N-fixer, P-solubilizing. or IAA synthesizer, stand out from the others [26,27]. Bacillus subtilis and Paenibacillus azotofixans organisms used in our study stand out with their phosphate dissolving and nitrogen-fixing properties. Biochar differs from many carbon-sourced organic wastes that can stay in the soil for a long time [1]; it reduces the removal of nutrients from the root zone by washing, and has a high water-holding capacity [28]. It has been reported that biochar and PGPR applications cause significant changes in plant growth [15] and nutrient content [29]. In a study investigating the effect of biochar applications on PGPR activity, it was reported that biochar applications did not have any negative effects on PGPR [30,31].
During this study, a decrease in soil pH was observed with biochar applications, which was 3.4% (Table 7). Dai et al. [32] reported in their study that there was 0.5–1.0-unit improvement in soil pH with biochar applications. These improvements in soil pH are due to the oxygen-containing functional groups, carbonates, and silicates available in biochar [33]. It has been determined that there is a significant increase in soil salinity with the increase in the levels of biochar application. This increase in our study was 172.8% in biochar applied plot compared to control pots (Table 7). However, this increase remained well below the limit values (<4 dS m−1) reported for soil salinity.
Similarly, it has been reported that biochar applications increase soil EC, pH, Na, and K contents [34]. This situation is caused by cations such as K, Ca, Mg, and Na, which are contained in biochar at a high rate [35,36,37,38]. An increase in organic matter content of soils (655.6%) was observed with biochar application doses compared to the control soil (Table 7). Da Silvia et al. [39] reported a linear increase in soil organic carbon content with increasing levels of biochar. It is probably because biochar obtained due to pyrolysis has a high molecular stability to pyrogenic carbon and its oxidation is inhibited [40]. The half-life of oxidation-resistant carbon-containing materials is estimated to be between 50 and 100 years, depending on particle size and soil conditions [41].
It is reported that biochar applications with many plant species positively affect plant growth and yield traits [42,43,44]. Our study determined that the plant height decreased (12.38%) with the increase in biochar application. It has been determined that there is a decrease in plant height (5.78%) in PGPR application in the environment (Table 8). This is probably attributed to the limitation of growth due to increased ambient salinity (Figure 2). Similarly, Hamzah and Shuhaimi [45] reported decreased plant height with increasing biochar application in their study. The plant’s fresh and dry weights increased up to 5% biochar application and after that decreased. According to the control, BioC2 application increased 26.9% and 45.9% in the fresh and dry weights of the plant, respectively. In the case of PGPR application to the environment, the plant fresh weight was lower with the application of PGPR; on the contrary, the plant dry weight increased slightly with the application of PGPR. The highest plant dry weight was obtained in BioC2xPGPR(+) application and increased by 61.4% compared to the control (BioC0xPGPR(-)) (Figure 4). This is especially because PGPRs produce IAA that provides the nutrient content in plants [46,47,48,49,50]. Zafar-ul-Hye et al. [51] reported in their study that combined application of PGPR and biochar showed the highest values of grain, stalk, and biological yield.
The fresh and dry roots were increased up to the BioC2 dose, while a decrease was determined in the BioC3 dose. The increase in root fresh and dry weights obtained in 10% application dose of biochar compared to the control was 36.2 and 11.3%, respectively. It was determined that the root fresh and dry weight of PGPR applications increased by 27.5 and 63.4%, respectively, compared to the plants without PGPR (Table 8). The highest values of the root fresh and dry weight were obtained in BioC2xPGPR(+), and the increases obtained compared to the control were determined as 80.3% and 112.3%, respectively (Figure 4). Mohawesh et al. [52] and Hashmi et al. [53] reported that biochar increases the fresh and dry weight of both the plant and the root up to a certain dose and decreases in the subsequent doses. It is due to the positive effect of biochar applications on the soil [54] and the improvements in the plant’s nutrient intake [55]. In a study, it has been reported that biochar and PGPR together significantly increase the grain and stem yield of rice [56].
Tillers and germination ratio significantly increased due to the application of biochar. The highest values of tillers and germination ratio were recorded at BioC3 treatment. R/S ratio decreased with biochar applications and changed by 52.0% compared to control. While PGPR applications caused a decrease in tillers and germination ratio, they caused an increase in the R/S ratio. PGPR applications encouraged root growth (48.9%) compared to plants without PGPR. This was confirmed by the increase in root fresh and dry weights (Table 8). Lakitan et al. [57] and Thavanesan and Seran [58] reported that biochar positively affected tillering and other efficiency criteria. Studies have reported that PGPR applications have an enhancing effect on tillering [47,59]. It was determined that the root–stem ratio of the plant decreased with the application of biochar. Biochar application encouraged the body ratio more. The most significant reduction compared to the control was obtained in BioC3 application with 52.0%. These results showed us that biochar applications are effective on root and supra-root accents, but they encourage a more radical accent development. Similar results have been reported by Olmo et al. [60], da Silva et al. [61] and Zhu et al. [62]. Plants treated with PGPR had a higher root–stem ratio than those without PGPR. In terms of root–stem ratio, a difference of 48.9% was determined between plants not applied PGPR and plants treated with PGPR (Table 8). This is because PGPRs stimulate phytohormone and secondary metabolite production in the plant and increase nutrient intake [63,64,65,66].
The 10% BioC3 increased the K and Na contents of macroelements by 19.1% and 13.6%, respectively, compared to the control, while it caused a decrease in Ca, P, and Mg contents by 12.4%, 13.5%, and 25.9%, respectively (Table 9). Biochar application increases the growth of plants, cell morphology, production of hormones such as jasmonic acid, auxin, and stoconin, and increases the production of secondary metabolites [67]. It affects the physiology of plants [61]. The encouragement may have caused it. In addition, biochar applications are expected to increase the soluble sugar content of the root and leaf [62], and as a result of the soluble sugar content being associated with photosynthesis, more plant growth and development is achieved [68].
Compared to plants that did not apply PGPR, the K, Ca, and Mg contents of plants treated with PGPR were increased by 19.4, 19.9, and 11.4%, respectively, while the P and Na contents decreased by 10.8 and 5.6%, respectively. When the effect of BxP interaction is examined, the highest Na and P contents (0.254 and 0.544%, respectively) were recorded at BioC3xPGPR(+) and BioC0xPGPR(+) application. However, compared to the control, the Na and P contents increased by 3.9 and 19.5%, respectively (Table 9; Figure 5 and Figure 6). In general, PGPR applications have been reported to increase the amount of other nutrients, especially N and P, in the plant [47,60,69,70,71]. Our study determined that PGPR applications caused a decrease in P and Na contents in the biochar applied environment. This situation is probably related to the high surface and intrinsic load area that biochar slowly releases essential nutrients [72,73,74]. It is thought that the loss of O-alkyl carbon in biochars obtained at high temperatures is low, and as a result, it is due to the accumulation of aromatic carbons that provide high P sorption [75]. At the end of our study, it is thought that the increase in K and Ca content of plant samples is due to the increase in the extractable macroelement content of soils with biochar applications [76]. The decrease in Mg content may be due to plant roots’ low Mg uptake ability and the competition of Mg+ with K+ and NH4+ during passive absorption [77]. It has been reported that increases in N, P, and K contents have been achieved in studies where biochar and PGPR applications are performed together [51,56].
Iron (Fe) and zinc (Zn) contents increased with biochar applications compared to control. Although some decrease was observed in the Fe content at 10% application dose of biochar, it was determined that the Fe content was above the control group applications. Although copper (Cu) and manganese (Mn) contents showed a decrease in the BioC1 application dose compared to the control, it increased BioC2 and BioC3 compared to the control. The highest values were determined at the BioC3 application dose and an increase of 44.7 and 4.1% was obtained, respectively, compared to the control (Table 9). It has been reported that biochar applications have an effect in the form of an increase or decrease in the microelement content of the plant [78]. Increasing intake of some elements due to biochar applications and decreasing some of them are related to the surface chemistry of the applied biochar [76]. Biochar’s high CEC and various functional groups (OH−, C–H, –C=O, and C=C) may reduce the bioavailability of metalloids to plants with certain nutrients [76,79,80]. With this feature of biochar, it can be used in the treatment of wastewater [81] and for the protection of the environment and the remediation of soils [79].
While PGPR applications increased Fe and Mn content, they caused a decrease in Zn and Cu content. The Fe and Mn contents increased by 30.5 and 3.6%, respectively, and the Zn and Cu contents decreased by 11.2 and 20.4%, respectively (Table 9). PGPRs provide plants with greater nutrient uptake and disease resistance by producing compounds that stimulate plant growth, alter plant root morphology, and increase root surface area [82,83,84,85]. PGPRs provide acidification of the environment by increasing the amount of CO2 in the root area as well as increasing the availability of nutrients by secreting some organic acids [86]. As a matter of fact, PGPR applications have been reported to increase the nutrient content of the plant [87,88,89].
When the effect of BxP interaction on microelement contents was examined, it was determined that it only had a significant effect on the Cu content. The lowest Cu content was generally determined in BioC0xPGPR(+) applications. The highest value in Cu was determined in BioC3xPGPR(-) applications, and it increased by 101.9% compared to BioC0xPGPR(+) applications (Figure 6).
Siderophore production of the plant increases with PGPR application and thus, the uptake of some microelements especially increases Fe content [90,91]. In our study, a decrease in copper content was observed with the application of PGPR. Similarly, Win et al. [92] reported that biochar and PGPR application decreased the S, Mn, and Zn contents in rice genotypes and increased the Fe content. This could be due to the increased salinity of the growing medium and the use of Cu in the environment for their own needs, and thus compete with the plant.
Apart from the essential elements for plant development, some elements are also called useful elements, one of which is nickel [77]. It was determined that the increase observed in nickel (Ni) content with biochar applications was statistically significant. Compared to control (1.733 mg kg−1) plants, the highest Ni content (2.450 mg kg−1) was obtained in BioC3 application and an increase of 41.4% was obtained compared to the control. A significant decrease in the pH of the soil with the application of biochar (Table 7) may have caused to increase in the Ni content in wheat. Hameeda et al. [93] reported an increase in the Ni content of the plant with the application of biochar in their study. Contrary to these findings, it has been reported that Ni uptake is reduced with biochar applications, both in Ni-contaminated environments and in environments without Ni contamination [94].
Lead (Pb) is an element that is highly toxic to living things. This element has a destructive effect on plant growth, root elongation, seed germination, cell division, and transpiration [95,96,97,98]. Although biochar application increased lead content compared to control, this increase was not found to be statistically significant. A 4.3% increase was obtained in BioC3 (17.470 mg kg−1) application compared to control (16.750 mg kg−1) (Table 9). The decrease in the intake of some heavy metals due to biochar applications is associated with the change in the physicochemical properties of the soil with the surface chemistry and biochar applications [2,99,100].
Similarly, Sayyadıan et al. [101] reported that biochar application from different origins decreased the extractable Ni, Pb, and Cd contents of the soil and consequently decreased the Ni, Pb, and Cd contents of both root and root parts of maize [102]. They also reported that biochar application to the environment contaminated with Pb, Cd, and Cr caused a decrease in the Cd, Pb, and Cr contents of both the soil and the corn plant. In our study, the increase in Pb content, albeit insignificantly, may be due to the decrease in soil pH with the application of biochar (Table 7).
Root organisms promoting plant growth are used in the phytoremediation of heavy metals to improve the yield and nutrient content of plants [9,103]. PGPR application caused an increase in both Pb and Ni content compared to plants where PGPR was not applied. Among these elements, only the increase in Ni content was found to be statistically significant (Table 6). PGPR applications increased Ni and Ni content by 1.9 and 16.3%, respectively. Ma et al. [104] reported that PGPB applications cause an increase in the Ni content of the plant. Again, Gullap et al. [105] reported that PGPR application increase the heavy metal content of both soil and plants. Generally, the bioavailability of heavy metals decreased with the increase in soil pH with biochar application [106,107]. Similarly, Zigang et al. [108] reported that biochar and Bacillus thuringiensis HC-2 applications reduced the Cd and Pb uptake by increasing soil pH.

5. Conclusions

Our study indicates that application of PGPR leads to an increase in soil pH, RFW, RDWdry, and fresh weight of root, R/S, K, Ca, Mg, Fe, and Ni contents, while it caused a reduction in PHPH, PFW, tillers, GR, P, Cu, and Zn values. Accordingly, the applications of biochar and PGPR in combination had a significant influence on the pH, RFW, R/S, P, Na, and Cu. As a result, it is indicated for future research implementations as the application of biochar and PGPR in combination achieved a positive effect in terms of soil properties, plant growth, and element contents of einkorn wheat.

Author Contributions

Conceptualization, F.S., F.Ç. and M.A.N.; methodology, F.S. and F.Ç.; formal analysis, A.E.S.; data curation, F.S.; writing—original draft preparation, F.Ç., F.S., M.A.N.; writing—review and editing, A.E.S. and M.A.N.; funding acquisition, F.Ç., F.S. All authors have read and agreed to the published version of the manuscript.

Funding

This research was supported by University of Bolu Abant Izzet Baysal, Scientific research projects [BAP—2017.10.04.1259].

Institutional Review Board Statement

Not applicable.

Informed Consent Statement

Not applicable.

Data Availability Statement

Data is contained within the article.

Conflicts of Interest

The authors declare no conflict of interest.

References

  1. Lehmann, J.; Joseph, S. Biochar for Environmental Management: Science, Technology and Implementation, 2nd ed.; Routledge: London, UK, 2015; p. 976. [Google Scholar] [CrossRef]
  2. Verheijen, F.; Jeffery, S.; Bastos, A.C.; van der Velde, M.; Diafas, I. Biochar Application to Soils: A Critical Scientific Review of Effects on Soil Properties, Processes and Functions; EUR 24099 EN; Office for the Official Publications of the European Communities: Luxembourg, 2010; Available online: http://publications.jrc.ec.europa.eu/repository/bitstream/JRC55799/jrc_biochar_soils.pdf (accessed on 12 March 2021).
  3. Hardie, M.A.; Oliver, G.; Clothier, B.E.; Bound, S.A.; Green, S.A.; Close, D.C. Effect of biochar on nutrient leaching in a young apple orchard. J. Environ. Qual. 2015, 44, 1273–1282. [Google Scholar] [CrossRef] [PubMed]
  4. Atkinson, C.J.; Fitzgerald, J.D.; Hipss, N.A. Potential mechanisms for achieving agricultural benefits from biochar application to temperate soils: A review. Plant Soil. 2010, 337, 1–18. [Google Scholar] [CrossRef]
  5. Graber, E.R.; Harel, Y.M.; Kolton, M.; Cytryn, E.; Silber, A.; David, D.R.; Tsechansky, L.; Borenshtein, M.; Elad, Y. Biochar impact on development and productivity of pepper and tomato grown in fertigated soilless media. Plant Soil. 2010, 337, 481–496. [Google Scholar] [CrossRef]
  6. Abagandura, G.O.; Chintala, R.; Sandhu, S.S.; Kumar, S.; Schumacher, T.E. Effects of biochar and manure applications on soil carbon dioxide, methane, and nitrous oxide fluxes from two different soils. J. Environ. Qual. 2019, 48, 1664–1674. [Google Scholar] [CrossRef]
  7. Jeffery, S.; Verheijen, F.G.A.; Van der Velde, M.; Bastos, A.C. A quantitative review of the effects of biochar application to soils on crop productivity using meta-analysis. Agric. Ecosyst. Environ. 2011, 144, 175–187. [Google Scholar] [CrossRef]
  8. Kolb, S.E.; Fermanich, K.J.; Dornbush, M.E. Effect of charcoal quantity on microbial biomass and activity in temperate soils. Soil. Sci. Soc. Am. J. 2009, 73, 1173–1181. [Google Scholar] [CrossRef] [Green Version]
  9. Sönmez, F.; Çığ, F. Determination of effects of ıncreasing dose biochar and vermicompost applications on nutrient content in wheat and soil. KSU. J. Agric. Nat. 2019, 22, 526–536. [Google Scholar] [CrossRef]
  10. Peng, X.; Ye, L.L.; Wang, C.H.; Zhou, H.; Sun, B. Temperature- and duration-dependent rice straw-derived biochar: Characteristics and its effects on soil properties of an Ultisol in southern China. Soil Tillage Res. 2011, 112, 159–166. [Google Scholar] [CrossRef]
  11. Dong, X.; Lena, Q.M.; Li, Y. Characteristics and mechanisms of hexavalent chromium removal by biochar from sugar beet tailing. J. Hazard. Mater. 2011, 190, 909–915. [Google Scholar] [CrossRef]
  12. Dobbelaere, S.; Croonborghs, A.; Thys, A.; Ptacek, D.; Okon, Y.; Vanderleyden, J. Effect of inoculation with wild type Azospirillum brasilense and A. irakense strains on development and nitrogen uptake of spring wheat and grain maize. Biol. Fertil. Soils. 2003, 36, 284–297. [Google Scholar] [CrossRef]
  13. Ramamoorthy, V.; Viswanathan, R.; Raguchander, T.; Prakasam, V.; Samiyappan, R. Induction of systemic resistance by plant growth promoting rhizobacteria in crop plants against pests and diseases. Crop Prot. 2001, 20, 1–11. [Google Scholar] [CrossRef]
  14. Kleber, M.; Sollins, P.; Sutton, R. A conceptual model of organo-mineral interactions in soils: Self-assembly of organic molecular fragments into zonal structures on mineral surfaces. Biogeochemistry 2007, 85, 9–24. [Google Scholar] [CrossRef]
  15. Shanta, N.A. Biochar and PGPR as Methods for Low-Input Management of Bioenergy Grasses. Ph.D. Thesis, McGill University, Montreal, QC, Canada, 2012. [Google Scholar]
  16. Weller, D.M. Biological control of soilborne plant pathogens in the rhizosphere with bacteria. Annu. Rev. Phytopathol. 1988, 26, 379–407. [Google Scholar] [CrossRef]
  17. Ahmed, N.; Ahsen, S.; Ali, M.A.; Hussain, M.B.; Hussain, S.B.; Rasheed, M.K.; Butt, B.; Irshad, I.; Danish, S. Rhizobacteria and silicon synergy modulates the growth, nutrition and yield of mungbean under saline soil. Pak. J. Bot. 2020, 52, 9–15. [Google Scholar] [CrossRef]
  18. EL Sabagh, A.; Islam, M.S.; Skalicky, M.; Raza, M.A.; Singh, K.; Hossain, M.A.; Hossain, A.; Mahboob, W.; Iqbal, M.A.; Ratnasekera, D.; et al. Adaptation and Management Strategies of Wheat (Triticum aestivum L.) Against Salinity Stress to Increase Yield and Quality. Front. Agron. 2021, 3, 43. [Google Scholar] [CrossRef]
  19. Majid, M.; Ali, M.; Shahzad, K.; Ahmad, F.; Ikram, R.M.; Ishtiaq, M.; Alaraidh, I.A.; Al-hashimi, A.; Ali, H.M.; Zarei, T.; et al. Mitigation of Osmotic Stress in Cotton for the Improvement in Growth and Yield through Inoculation of Rhizobacteria and Phosphate Solubilizing Bacteria Coated Diammonium Phosphate. Sustainability 2020, 12, 10456. [Google Scholar] [CrossRef]
  20. Ellis, R.H.; Roberts, E.H. Towards a rational basis for testing seed quality. In Seed Production; Butterwooths: London, UK, 1980. [Google Scholar]
  21. Kacar, B. Plant nutrition practice guide. In Application Guide; Ankara University Faculty of Agriculture Publications: Ankara, Turkey, 1984; p. 214. [Google Scholar]
  22. Kacar, B. Chemical Analysis of Plant and Soil: III. Soil Analysis; Publication No. 3; A.Ü. Agriculture Foundation: Ankara, Turkey, 1994. [Google Scholar]
  23. SAS. SAS/STAT User’s Guide (6.03). Cary; SAS Institute Inc.: New York, NY, USA, 1988. [Google Scholar]
  24. Ijaz, M.; Tahir, M.; Shahid, M.; Ul-Allah, S.; Sattar, A.; Sher, A.; Mahmood, K.; Hussain, M. Combined application of biochar and PGPR consortia for sustainable production of wheat under semiarid conditions with a reduced dose of synthetic fertilizer. Braz. J. Microbiol. 2019, 50, 449–458. [Google Scholar] [CrossRef] [PubMed]
  25. Compant, S.; Duffy, B.; Nowak, J.; Clement, C.; Barka, E.A. Use of plant growth-promoting bacteria for biocontrol of plant diseases: Principles, mechanisms of action, and future prospects. Appl. Environ. Microbiol. 2005, 71, 4951–4959. [Google Scholar] [CrossRef] [PubMed] [Green Version]
  26. Glick, B.R. The enhancement of plant growth by free-living bacteria. Can. J. Microbiol. 1995, 41, 109–117. [Google Scholar] [CrossRef]
  27. Satyaprakash, M.; Nikitha, T.; Reddi, E.U.B.; Sadhana, B.; Vani, S.S. Phosphorous and phosphate solubilising bacteria and their role in plant nutrition. Int. J. Curr. Microbiol. Appl. Sci. 2017, 6, 2133–2144. [Google Scholar] [CrossRef]
  28. Major, J.; Steiner, C.; Downie, A.; Lehmann, J. Biochar effects on nutrient leaching. In Biochar for Environmental Management: Science and Technology, 1st ed.; Lehmann, J., Joseph, S., Eds.; Earthscan: London, UK, 2009; pp. 271–288. [Google Scholar]
  29. Fazal, A.; Bano, A. Role of plant growth-promoting rhizobacteria (PGPR), biochar, and chemical fertilizer under salinity stress. Commun. Soil Sci. Plant Anal. 2016, 47, 985–1993. [Google Scholar] [CrossRef]
  30. Quilliam, R.S.; DeLuca, T.H.; Jones, D.L. Biochar application reduces nodulation but increases nitrogenase activity in clover. Plant Soil. 2013, 366, 83–92. [Google Scholar] [CrossRef]
  31. Hale, L.E. Biochar and Plant Growth Promoting Rhizobacteria as Soil Amendments. Ph.D. Thesis, California University, Riverside, CA, USA, 2014. [Google Scholar]
  32. Dai, Z.; Wang, Y.; Muhammad, N.; Yu, X.; Xiao, K.; Meng, J.; Liu, X.; Xu, J.; Brookes, P.C. The Effects and mechanisms of soil acidity changes, following ıncorporation of biochars in three soils differing in ınitial pH. Soil Sci. Soc. Am. J. 2014, 78, 1606–1614. [Google Scholar] [CrossRef]
  33. Ren-yong, S.; Jiu-yu, L.; Ni, N.; Ren-kou, X. Understanding the biochar’s role in ameliorating soil acidity. J. Integr. Agric. 2019, 18, 508–1517. [Google Scholar] [CrossRef]
  34. Fernandes, J.D.; Chaves, L.H.G.; Mendes, J.S.; Chaves, I.B.; Tito, G.A. Alterations in soil salinity with the use of different biochar doses. Rev. Fac. Cienc. Agrar. 2019, 42, 89–98. [Google Scholar] [CrossRef]
  35. Silber, A.; Levkovitch, I.; Graber, E. pH-dependent mineral release and surface properties of cornstraw biochar: Agronomic implications. Environ. Sci. Technol. 2010, 44, 9318–9323. [Google Scholar] [CrossRef] [PubMed]
  36. Lashari, M.S.; Liu, Y.; Li, L.; Pan, W.; Fu, J.; Pan, G.; Zheng, J.; Zheng, J.; Zhang, X.; Yu, X. Effects of amendment of biochar-manure compost in conjunction with pyroligneous solution on soil quality and wheat yield of a salt-stressed cropland from Central China Great Plain. Field Crops Res. 2013, 144, 113–118. [Google Scholar] [CrossRef]
  37. Sappor, D.K.; Osei, B.A.; Ahmed, M.R. Reclaiming sodium affected soil: The potential of organic amendments. Int. J. Plant Soil Sci. 2017, 16, 1–11. [Google Scholar] [CrossRef] [Green Version]
  38. Cheng, H.; Jones, D.L.; Hill, P.; Bastami, M.S.; Tu, C.L. Influence of biochar produced from different pyrolysis temperature on nutrient retention and leaching. Arch. Agron. Soil Sci. 2018, 64, 850–859. [Google Scholar] [CrossRef]
  39. Da Silva, I.C.B.; Basílio, J.J.N.; Fernandes, L.A.; Colen, F.; Sampaio, R.A.; Frazão, L.A. Biochar from different residues on soil properties and common bean production. Sci. Agric. 2017, 74, 378–382. [Google Scholar] [CrossRef] [Green Version]
  40. Petter, F.A.; Madari, B.E.; Carneiro, M.A.C.; Marimon, B.H.; Carvalho, M.T.M.; Pacheco, L.P. Soil fertility and agronomic response of rice to biochar application in the Brazilian savannah. Pesqui. Agropecu. Bras. 2012, 47, 699–706. [Google Scholar] [CrossRef] [Green Version]
  41. Bird, M.I.; Moyo, C.; Veenendaal, E.M.; Lloyd, J.; Frost, P. Stability of elemental carbon in savanna soil. Glob. Biogeochem. Cycles. 1999, 13, 923–932. [Google Scholar] [CrossRef]
  42. Lehmann, J.; da Silva, J.P., Jr.; Steiner, C.; Nehls, T.; Zech, W.; Glaser, B. Nutrient availability and leaching in an archaeological Anthrosol and a Ferralsol of the Central Amazon basin: Fertilizer, manure and charcoal amendments. Plant Soil. 2003, 249, 343–357. [Google Scholar] [CrossRef]
  43. Chan, K.; Van Zwieten, Y.L.; Meszaros, I.; Downie, A.; Joseph, S. Agronomic values of green waste biochar as a soil amendment. Aust. J. Soil Res. 2007, 45, 629–634. [Google Scholar] [CrossRef]
  44. Yılangaı, R.M.; Manu, S.A.; Pıneau, W.; Maılumo, S.S.; Okeke-Agulu, K.I. The effect of biochar and crop veil on growth and yield of tomato (Lycopersicum esculentus Mill) in Jos, North central Nigeria. Curr. Agric. Res. 2014, 2, 37–42. [Google Scholar] [CrossRef]
  45. Hamzah, Z.; Shuhaimi, S.N.A. Biochar: Effects on crop growth. IOP Conf. Ser. Earth Environ. Sci. 2018, 215, 012011. [Google Scholar] [CrossRef]
  46. Zafar-Ul-Hye, M.; Shahjahan, A.; Danish, S.; Abid, M.; Qayyum, M.F. Mitigation of cadmium toxicity induced stress in wheat by ACC-deaminase containing PGPR isolated from cadmium polluted wheat rhizosphere. Pak. J. Bot. 2018, 50, 1727–1734. [Google Scholar]
  47. Danish, S.; Tahir, F.A.; Rasheed, M.K.; Ahmad, N.; Ali, M.A.; Kiran, S.; Younis, U.; Irshad, I.; Butt, B. Effect of foliar application of Fe and banana peel waste biochar on growth, chlorophyll content and accessory pigments synthesis in spinach under chromium (IV) toxicity. Open Agric. 2019, 4, 381–390. [Google Scholar] [CrossRef]
  48. Danish, S.; Zafar-ul-Hye, M. Combined role of ACC deaminase producing bacteria and biochar on cereals productivity under drought. Phyton 2020, 89, 217–227. [Google Scholar] [CrossRef]
  49. Wahid, F.; Fahad, S.; Danish, S.; Adnan, M.; Yue, Z.; Saud, S.; Siddiqui, M.H.; Brtnicky, M.; Hammerschmiedt, T.; Datta, R. Sustainable management with mycorrhizae and phosphate solubilizing bacteria for enhanced phosphorus uptake in calcareous soils. Agriculture 2020, 10, 334. [Google Scholar] [CrossRef]
  50. Zafar-ul-Hye, M.; Zahra, M.B.; Danish, S.; Abbas, M.; Rehim, A.; Akbar, M.N.; Iftikhar, A.; Gul, M.; Nazir, I.; Abid, M.; et al. Multi-strain inoculation with pgpr producing acc deaminase is more effective than single-strain inoculation to improve wheat (Triticum aestivum) growth and yield. Phyton 2020, 89, 405–413. [Google Scholar] [CrossRef]
  51. Zafar-ul-Hye, M.; Danish, S.; Abbas, M.; Ahmad, M.; Munir, T.M. ACC deaminase producing PGPR bacillus amyloliquefaciens and agrobacterium fabrum along with biochar ımprove wheat productivity under drought stress. Agronomy 2019, 9, 343. [Google Scholar] [CrossRef] [Green Version]
  52. Mohawesh, O.; Coolong, T.; Aliedeh, M.; Qaraleh, S. Greenhouse evaluation of biochar to enhance soil properties and plant growth performance under arid environment. Bulg. J. Agric. Sci. 2018, 24, 1012–1019. [Google Scholar]
  53. Hashmi, S.; Younis, U.; Danish, S.; Munir, T.M. Pongamia pinnata L. leaves biochar ıncreased growth and pigments syntheses in Pisum Sativum L. exposed to nutritional stress. Agriculture 2019, 9, 153. [Google Scholar] [CrossRef] [Green Version]
  54. De la Rosa, J.; Paneque, M.M.; Hilber, I.; Blum, F.; Knicker, H.E.; Bucheli, T.D. Assessment of polycyclic aromatic hydrocarbons in biochar and biochar-amended agricultural soil from southern spain. J. Soils Sediments 2016, 16, 557–565. [Google Scholar] [CrossRef] [Green Version]
  55. Biederman, L.A.; Harpole, W.S. Biochar and its effects on plant productivity and nutrient cycling: A meta-analysis. Glob. Chang. Biol. Bioenergy 2013, 5, 202–214. [Google Scholar] [CrossRef]
  56. Singh, A.; ASingh, P.; Singh, S.K.; Rai, S.; Kumar, D. Impact of addition of biochar along with pgpr on rice yield, availability of nutrients and their uptake in alluvial soil. J. Pure Appl. Microbiol. 2016, 10, 2181–2188. [Google Scholar]
  57. Lakitan, B.; Alberto, A.; Lindiana, L.; Kartika, K.; Herlinda, S.; Kurnianingsih, A. The benefits of biochar on rice growth and yield in tropical riparian wetland, South Sumatra, Indonesia. Chiang Mai Univ. J. Nat. Sci. 2018, 17, 111–126. [Google Scholar] [CrossRef]
  58. Thavanesan, S.; Seran, T.H. Effect of rice straw and husk biochar on vegetative growth and yield attributes of Oryza sativa L. Int. J. Crop Sci. 2018, 4, 49–56. [Google Scholar] [CrossRef]
  59. Purwanto, P.; Agustono, T.; Mujiono; Widiatmoko, T.; Widjonarko, B.R. The effect of plant growth promotion rhizobacteria ınoculation to agronomic traits of aromatic rice (Oryza sativa CV. Inpago Unsoed 1). IOP Conf. Ser. Earth Environ. Sci. 2019, 255, 012023. [Google Scholar] [CrossRef]
  60. Olmo, M.; Villar, R.; Salazar, P.; Alburquerque, J.A. Changes in soil nutrient availability explain biochar’s impact on wheat root development. Plant Soil. 2016, 399, 333–343. [Google Scholar] [CrossRef]
  61. Da Silva, I.C.B.; Fernandes, L.A.; Colen, F.; Sampaio, R.A. Growth and production of common bean fertilized with biochar. Cienc. Rural. 2017, 47, 1–8. [Google Scholar] [CrossRef] [Green Version]
  62. Zhu, Q.; Kong, L.; Xie, F.; Zhang, H.; Wang, H.; Ao, X. Effects of biochar on seedling root growth of soybeans. Chil. J. Agric. Res. 2018, 78, 549–558. [Google Scholar] [CrossRef] [Green Version]
  63. Spaepen, S.; Vanderleyden, J.; Remans, R. Indole3-acetic acid in microbial and microorganism-plant signaling. FEMS Microbiol. Rev. 2007, 31, 425–448. [Google Scholar] [CrossRef] [Green Version]
  64. Dodd, I.C.; Zinovkina, N.Y.; Safronova, V.I.; Belimov, A.A. Rhizobacterial mediation of plant hormone status. Ann. Appl. Biol. 2010, 157, 361–379. [Google Scholar] [CrossRef]
  65. Overvoorde, P.; Fukaki, H.; Beeckman, T. Auxin control of root development. Cold Spring Harb. Perspect. Biol. 2011, 2, a001537. [Google Scholar] [CrossRef] [PubMed] [Green Version]
  66. Vacheron, J.; Desbrosses, G.; Bouffaud, M.; Touraine, B.; Moënne-Loccoz, Y.; Muller, D.; Legendre, L.; Wisniewski-Dyé, F.; Prigent-Combaret, C. Plant growth-promoting rhizobacteria and root system functioning. Front. Plant Sci. 2013, 4, 1–20. [Google Scholar] [CrossRef] [Green Version]
  67. Viger, M.; Hancock, R.D.; Miglietta, F. More plant growth but less plant defence? First global gene expression data for plants grown in soil amended with biochar. Glob. Chang. Biol. Bioenergy 2015, 7, 658–672. [Google Scholar] [CrossRef]
  68. Gibson, S.I. Plant sugar-response pathways: Part of a complex regulatory web. Plant Physiol. 2000, 124, 1532–1539. [Google Scholar] [CrossRef] [PubMed] [Green Version]
  69. Rodriguez, H.; Fraga, R. Phosphate solubilizing bacteria and their role in plant growth promotion. Biotechnol. Adv. 1999, 17, 319–333. [Google Scholar] [CrossRef]
  70. Sheng, X.F.; He, L.Y. Solubilization of potassium-bearing minerals by a wild-type strain of Bacillus edaphicus and its mutants and increased potassium uptake by wheat. Can. J. Microbiol. 2006, 52, 66–72. [Google Scholar] [CrossRef]
  71. Hariprasad, P.; Niranjana, S.R. Isolation and characterization of phosphate solubilizing rhizobacteria to improve plant health of tomato. Plant Soil. 2009, 316, 13–24. [Google Scholar] [CrossRef]
  72. Laird, D.; Fleming, P.; Wang, B.Q.; Horton, R.; Karlen, D. Biochar impact on nutrient leaching from a Midwestern agricultural soil. Geoderma 2010, 158, 436–442. [Google Scholar] [CrossRef] [Green Version]
  73. Knowles, O.A.; Robinson, B.H.; Contangelo, A.; Clucas, L. Biochar for the mitigation of nitrate leaching from soil amended with biosolids. Sci. Total Environ. 2011, 409, 3206–3210. [Google Scholar] [CrossRef] [PubMed]
  74. Spokas, K.A.; Novak, J.M.; Venterea, R.T. Biochar’s role as an alternative N-fertilizer: Ammonia capture. Plant Soil 2012, 350, 35–42. [Google Scholar] [CrossRef]
  75. Ngatia, L.W.; Hsieh, Y.P.; Nemours, D.; Fu, R.; Taylor, R.W. Potential phosphorus eutrophication mitigation strategy: Biochar carbon composition, thermal stability and pH influence phosphorus sorption. Chemosphere 2017, 180, 201–211. [Google Scholar] [CrossRef] [PubMed] [Green Version]
  76. Kizito, S.; Luo, H.; Lu, J.; Bah, H.; Dong, R.; Wu, S. Role of nutrient-enriched biochar as a soil amendment during maize growth: Exploring practical alternatives to recycle agricultural residuals and to reduce chemical fertilizer demand. Sustainability 2019, 11, 3211. [Google Scholar] [CrossRef] [Green Version]
  77. Güneş, A.; Alpaslan, M.; İnal, A. Plant Nutrition and Fertilization, 3rd ed.; Ankara University Faculty of Agriculture Publications: Ankara, Turkey, 2013; p. 579. [Google Scholar]
  78. Alburquerque, J.A.; Salazar, P.; Barrón, V.; Torrent, J.; del Campillo, M.C.; Gallardo, A.; Villar, R. Enhanced wheat yield by biochar addition under different mineral fertilization levels. Agron. Sustain. Dev. 2013, 33, 475–484. [Google Scholar] [CrossRef] [Green Version]
  79. Beesley, L.; Moreno-Jimenez, E.; Gomez-Eyles, J.L.; Harris, E.; Robinson, B.; Sizmur, T. A review of biochars’ potential role in the remediation, revegetation and restoration of contaminated soils. Environ. Pollut. 2011, 159, 3269–3282. [Google Scholar] [CrossRef]
  80. Zama, E.F.; Zhu, Y.G.; Reid, B.J.; Sun, G.X. The role of biochar properties in influencing the sorption and desorption of Pb(II), Cd(II) and As(III) in aqueous solution. J. Clean. Prod. 2017, 148, 127–136. [Google Scholar] [CrossRef] [Green Version]
  81. Mohan, D.; Pittman, C.U., Jr. Arsenic removal from water/wastewater using adsorbents—A critical review. J. Hazard. Mater. 2007, 142, 1–53. [Google Scholar] [CrossRef] [PubMed]
  82. Glick, B.R. Bacteria with ACC deaminase can promote plant growth and help to feed the world. Microbiol. Res. 2014, 169, 30–39. [Google Scholar] [CrossRef] [PubMed]
  83. Arshad, M.; Frankenberger, W.T., Jr. Plant growth-regulating substances in the rhizosphere. Microbial production and functions. Adv. Agron. 1998, 62, 46–151. [Google Scholar] [CrossRef]
  84. Zahir, Z.A.; Muhammad, A.; Frankenberger, W.T. Plant growth promoting rhizobacteria: Applications and perspectives in agriculture. Adv. Agron. 2004, 81, 97–168. [Google Scholar] [CrossRef]
  85. Kumar, S.D.; Lavanya, N.; Muthumeena, B.; Raguchander, T.; Suresh, S.; Samiyappan, R. Pseudomonas fluorences enhances resistance and natural enemy population in rice plants against leaf folder pest. J. Appl. Entomol. 2008, 132, 469–479. [Google Scholar] [CrossRef]
  86. İpek, M.; Eşitken, A. The actions of PGPR on micronutrient availability in soil and plant under calcareous soil conditions: An evaluation over Fe nutrition. In Plant-Microbe Interactions in Agro-Ecological Perspectives; Singh, D., Singh, H., Prabha., R., Eds.; Springer: Singapore, 2017; pp. 81–100. [Google Scholar] [CrossRef]
  87. Vermaa, J.P.; Yadav, J.; Tiwari, K.N.; Kumar, A. Effect of indigenous Mesorhizobium spp. and plant growth promoting rhizobacteria on yields and nutrients uptake of chickpea (Cicer arietinum L.) under sustainable agriculture. Ecol. Eng. 2013, 51, 282–286. [Google Scholar] [CrossRef]
  88. Kumar, A.; Maurya, B.R.; Raghuwanshi, R. Isolation and characterization of PGPR and their effect on growth, yield and nutrient content in wheat (Triticum aestivum L). Biocatal. Agric. Biotechnol. 2013, 3, 121–128. [Google Scholar] [CrossRef]
  89. Arıkan, Ş.; Pırlak, L. Effects of plant growth promoting rhizobacteria (PGPR) on growth, yield and fruit quality of sour cherry (Prunus cerasus L.). Erwerbs-Obstbau 2016, 58, 221–226. [Google Scholar] [CrossRef]
  90. Schippers, B. Biological control of pathogens with rhizobacteria. Philos. Trans. R. Soc. Lond. B Biol. Sci. 1988, 318, 283–293. [Google Scholar] [CrossRef]
  91. Ghavami, N.; Alikhani, H.A.; Pourbabaee, A.A.; Besharati, H. Study the effects of siderophoreproducing bacteria on zinc and phosphorous nutrition of Canola and Maize plants. Commun. Soil Sci. Plant Anal. 2016, 47, 1517–1527. [Google Scholar] [CrossRef]
  92. Win, K.T.; Okazaki, K.; Ookawa, T.; Yokoyama, T.; Ohwaki, Y. Influence of rice-husk biochar and Bacillus pumilus strain TUAT-1 on yield, biomass production, and nutrient uptake in two forage rice genotypes. PLoS ONE 2019, 14, 220–236. [Google Scholar] [CrossRef] [PubMed] [Green Version]
  93. Hameeda, S.G.; Bano, G.; Manzoor, M.; Chandio, T.A.; Awan, A.A. Biochar and manure influences tomato fruit yield, heavy metal accumulation and concentration of soil nutrients under wastewater irrigation in arid climatic conditions. Cogent Food Agric. 2019, 5, 1. [Google Scholar] [CrossRef]
  94. Younis, U.; Athar, M.; Malik, S.A.; Raza Shah, M.H.; Mahmood, S. Biochar impact on physiological and biochemical attributes of spinach Spinacia oleracea (L.) in nickel contaminated soil. Glob. J. Environ. Sci. Manag. 2015, 1, 245–254. [Google Scholar] [CrossRef]
  95. Krzeslowska, M.; Lenartowska, M.; Mellerowicz, E.J.; Samardakiewicz, S.; Wozny, A. Pectinous cell wall thickenings formation–a response of moss protonemata cells to lead. Environ. Exp. Bot. 2009, 65, 119–131. [Google Scholar] [CrossRef]
  96. Gupta. D.; Huang, H.; Yang, X.; Razafindrabe, B.; Inouhe, M. The detoxification of lead in Sedum alfredii H. is not related to phytochelatins but the glutathione. J. Hazard. Mater. 2010, 177, 437–444. [Google Scholar] [CrossRef]
  97. Maestri, E.; Marmiroli, M.; Visioli, G.; Marmiroli, N. Metal tolerance and hyperaccumulation: Costs and trade-offs between traits and environment. Environ. Exp. Bot. 2010, 68, 1–13. [Google Scholar] [CrossRef]
  98. Pourrut, B.; Shahid, M.; Dumat, C.; Winterton, P.; Pinelli, E. Lead uptake, toxicity, and detoxification in plants. Rev. Environ. Contam. Toxicol. 2011, 213, 113136. [Google Scholar] [CrossRef] [Green Version]
  99. Park, J.H.; Choppala, G.H.; Bolan, N.S.; Chung, J.W.; Chuasavathi, T. Biochar reduces the bioavailability and phytotoxicity of heavy metals. Plant Soil 2011, 348, 439–451. [Google Scholar] [CrossRef]
  100. Younis, U.; Rahi, A.A.; Danish, S.; Ali, M.A.; Ahmed, N.; Datta, R.; Fahad, S.; Holatko, J.; Hammerschmiedt, T.; Brtnicky, M.; et al. Fourier Transform Infrared Spectroscopy vibrational bands study of Spinacia oleracea and Trigonella corniculata under biochar amendment in naturally contaminated soil. PLoS ONE 2021, 16, e0253390. [Google Scholar] [CrossRef]
  101. Sayyadian, K.; Moezzi, A.; Gholami, A.; Panahpour, E.; Mohsenifar, K. Effect of biochar on cadmium, nickel and lead uptake and translocation in maize irrigated with heavy metal contaminated water. Appl. Ecol. Environ. Res. 2019, 17, 969–982. [Google Scholar] [CrossRef]
  102. Khalid, A.A.; Ahmeda, B.; Brodie, G. Effect of biochar on Pb, Cd and Cr availability and maize growth in artificial contaminated soil. Ann. Agric. Sci. 2019, 64, 95–102. [Google Scholar] [CrossRef]
  103. Awad, M.; Liu, Z.; Skalicky, M.; Dessoky, E.S.; Brestic, M.; Mbarki, S.; Rastogi, A.; EL Sabagh, A. Fractionation of Heavy Metals in Multi-Contaminated Soil Treated with Biochar Using the Sequential Extraction Procedure. Biomolecules 2021, 11, 448. [Google Scholar] [CrossRef] [PubMed]
  104. Ma, Y.; Rajkumar, M.; Freitas, H. Improvement of plant growth and nickel uptake by nickel resistant-plant-growth promoting bacteria. J. Hazard. Mater. 2009, 166, 1154–1161. [Google Scholar] [CrossRef] [PubMed] [Green Version]
  105. Gullap, M.K.; Dascı, M.; Erkovan, H.İ.; Koç, A.; Turan, M. Plant growth-promoting rhizobacteria (PGPR) and phosphorus fertilizer-assisted phytoextraction of toxic heavy metals from contaminated soils. Commun. Soil. Sci. Plant Anal. 2014, 45, 2593–2606. [Google Scholar] [CrossRef]
  106. Violante, A.; Cozzolino, V.; Perelomov, L.; Caporale, A.; Pigna, M. Mobility and bioavailability of heavy metals and metalloids in soil environments. J. Soil Sci. Plant Nutr. 2010, 10, 268–292. [Google Scholar] [CrossRef] [Green Version]
  107. Khan, Z.; Rahman, M.H.u.; Haider, G.; Amir, R.; Ikram, R.M.; Ahmad, S.; Schofield, H.K.; Riaz, B.; Iqbal, R.; Fahad, S.; et al. Chemical and Biological Enhancement Effects of Biochar on Wheat Growth and Yield under Arid Field Conditions. Sustainability 2021, 13, 5890. [Google Scholar] [CrossRef]
  108. Zigang, L.; Wang, P.; Yue, X.; Wang, J.; Ren, B.; Qu, L.; Han, H. Effects of Bacillus thuringiensis HC-2 combined with biochar on the growth and Cd and Pb accumulation of radish in a heavy metal-contaminated farmland under field conditions. Int. J. Environ. Res. Public Health 2019, 16, 3676. [Google Scholar] [CrossRef] [Green Version]
Figure 1. Effect of BxP interaction on soil pH: PGPR(+): Inoculation; PGPR(-): Non-inoculation; BioC0: 0% biochar; BioC1: 2.5% biochar; BioC2: 5% biochar; BioC3: 10% biochar; pH LSD(0.05): 0.08. Means followed by different letters are statistically different from each other according to Duncan’s Multiple Range test at p ≤ 0.05.
Agronomy 11 02418 g001
Figure 2. Effect of BxP interaction on root fresh weight (RFW): PGPR(+): Inoculation; PGPR(-): Non-inoculation; BioC0: 0% biochar; BioC1: 2.5% biochar; BioC2: 5% biochar; BioC3: 10% biochar; RFW LSD(0.05): 0.64. Means followed by different letters are statistically different from each other according to Duncan’s Multiple Range test at p ≤ 0.05.
Agronomy 11 02418 g002
Figure 3. Effect of BxP interaction on root–shoot ratio (R/S): PGPR(+); PGPR(+):Inoculation; PGPR(-):Non-inoculation; BioC0: 0% biochar; BioC1: 2.5% biochar; BioC2: 5% biochar; BioC3: 10% biochar; R/S LSD(0.05): 0.233. Means followed by different letters are statistically different from each other according to Duncan’s Multiple Range test at p ≤ 0.05.
Agronomy 11 02418 g003
Figure 4. Effect of BxP interaction on phosphorus content of einkorn wheat: PGPR(+): Inoculation; PGPR(-): Non-inoculation; BioC0: 0% biochar; BioC1: 2.5% biochar; BioC2: 5% biochar; BioC3: 10% biochar; Phosphorus LSD(0.05): 0.0657. Means followed by different letters are statistically different from each other according to Duncan’s Multiple Range test at p ≤ 0.05.
Agronomy 11 02418 g004
Figure 5. Effect of BxP interaction on natrium content of einkorn wheat: PGPR(+): Inoculation; PGPR(-): Non-inoculation; BioC0: 0% biochar; BioC1: 2.5% biochar; BioC2: 5% biochar; BioC3: 10% biochar; Natrium LSD(0.05):0.0304. Means followed by different letters are statistically different from each other according to Duncan’s Multiple Range test at p ≤ 0.05.
Agronomy 11 02418 g005
Figure 6. Effect of BxP interaction on copper content of einkorn wheat: PGPR(+): Inoculation; PGPR(-): Non-inoculation; BioC0: 0% biochar; BioC1: 2.5% biochar; BioC2: 5% biochar; BioC3: 10% biochar; Copper LSD(0.05): 3.99. Means followed by different letters are statistically different from each other according to Duncan’s Multiple Range test at p ≤ 0.05.
Agronomy 11 02418 g006
Table 1. Physical and chemical analysis results of soil and biochar used in the experiment.
pHText.ECLimeOMNK Ca PFe Mn Zn Cu
dS m−1%mg kg−1
Soil 7.34Loamy0.3419.010.870.0430.1863.755.716.022.440.3611.2
Biochar 9.30-0.69-31.71.7000.03015.802.26401325817
Table 2. Variance analysis table for the effects of biochar and PGPR applications on some properties of the trial soil.
VarianceDfpHSalinity Lime Organic Matter
MSFMSFMSFMSF
B30.063724.01 **396,18242.75 **3.9416.34 **46.415171.99 **
P10.01505.65 *13,5851.47 ns0.3650.59 ns0.3121.15 ns
BxP30.01174.39 *59250.63 ns0.2070.33 ns0.1240.45 ns
Hata 160.0026 9266 0.621 0.270
*, **, 5%, 1%; ns, non-significant; B: Biochar; P: PGPR.
Table 3. Variance analysis table for the effects of biochar and PGPR applications on the development criteria of Siyez wheat.
VarianceDfPH PFW PDW RL RFW RDW
MSFMSFMSFMSFMSFMSF
B343.3757.88 **0.017910.59 **4.14814.91 **6.5001.45 ns0.01419.11 **0.3034.69 *
P151.0429.28 **0.00010.02 ns1.4655.26 *2.6670.59 ns0.075148.35 **0.3262.05 *
BxP30.4860.08 ns0.00331.97 ns0.4391.57 ns8.7781.96 ns0.01278.21 **0.0250.38 ns
Error165.500 0.0016 0.278 4.458 0.0016 0.064
*, **, 5%, 1%; ns, non-significant; B: Biochar; P: PGPR; PH: Plant Height; PFW: Plant Fresh Weight; PDW: Plant Dry Weight; RL: Root Length; RFW: Root Fresh Weight; RDW: Root Dry Weight.
Table 4. Variance analysis table for the effects of biochar (B) and PGPR (P) applications on tillering, germination rate and root–stem ratio of Siyez wheat.
VarianceDfTillering Germination Rate Root/Stem
MSFMSFMSF
B30.43333.18 ns0.735126.62 **0.07514.26 *
P10.79385.83 *0.16345.91 *0.485427.49 **
BxP30.03390.25 ns0.02470.89 ns0.09495.38 **
Error160.1363 0.0276 0.0176
*, **, 5%, 1%; ns, non-significant; B: Biochar; P: PGPR.
Table 5. Variance analysis table for the effects of biochar (B) and PGPR (P) applications on phosphorus (P), potassium (K), calcium (Ca), magnesium (Mg), and sodium (Na) nutrient contents of Siyez wheat.
VarianceDfPKCaMgNa
MSFMSFMSFMSFMSF
B32910262.02 ns0.18335.13 *0.3937.87 **3,047,83339.01 **270,1548.74 **
P113718609.51 **0.989827.71 **0.92818.59 **1,404,08417.97 **87,8462.84 ns
BxP35388133.73 *0.04151.16 ns0.0270.55 ns198,5972.54 ns132,3734.29 *
Hata 16144222 0.0357 0.050 78,120 30,887
*, **, 5%, 1%; ns, non-significant; B: Biochar; P: PGPR.
Table 6. Variance analysis table for the effects of biochar and PGPR applications on iron (Fe), manganese (Mn), zinc (Zn) and copper (Cu) nutrients, and lead (Pb) and nickel (Ni) heavy metal contents of Siyez wheat.
VarianceDfFeCuZnMnPbNi
MSFMSFMSFMSFMSFMSF
B3355959.98 **90.18816.96 **1262245.60 **721.382.57 ns0.95150.29 ns0.54948.56 **
P16298617.65 **5.7509.55 **22828.24 *155.040.55 ns0.63380.19 ns0.60179.37 **
BxP332190.90 ns17.9453.38 *1670.60 ns55.710.20 ns2.21600.67 ns0.15061.88 ns
Error 163568 5.316 277 279.96 3.3008 0.0642
*, **, 5%, 1%; ns, non-significant; B: Biochar; P: PGPR.
Table 7. Averages of the effects of biochar and PGPR applications on some properties of the cultivation media and Duncan multiple comparison test results.
Treatments pHECLimeSOM
µS cm−1%
Biochar (%)
BioC07.35 a342 d18.95 a0.99 d
BioC17.23 b576 c17.90 b2.46 c
BioC27.17 c785 b19.06 a3.80 b
BioC37.11 d933 a17.40 b7.48 a
LSD (p < 0.05)0.061180.960.64
PGPR
PGPR(-)7.19 b68318.203.80
PGPR(+)7.24 a63618.453.57
LSD (p < 0.05)0.04830.680.45
BioC0: 0% biochar; BioC1: 2.5% biochar; BioC2: 5% biochar; BioC3: 10% biochar; PGPR(+): Inoculation; PGPR(-): non-inoculation; SOM: Soil Organic Matter. Means followed by different letters are statistically different from each other according to Duncan’s Multiple Range test at p ≤ 0.05.
Table 8. Averages of the effects of Biochar and PGPR applications on development criteria and Duncan multiple comparison test results.
Treatments PH RL PFW PDW RFW RDW TGRR/S
cmg, plant−1Number%
Biochar (%)
BioC052.5 a21.33 1.8940 b0.2908 c1.3973 b0.2213 bc2.69 b3.27 c78.3 a
BioC148.5 b18.831.9740 b0.3546 b1.4002 b0.2339 b3.07 b3.48 b67.2 ab
BioC248.5 b19.832.4028 a0.4245 a1.9038 a0.2962 a4.28 a3.85 a69.7 a
BioC346.0 b19.672.1431 ab0.3518 b1.3112 b0.1787 c4.32 a4.04 a51.5 b
LSD (p < 0.05)2.872.580.31120.05030.45190.04820.650.2016.3
PGPR
PGPR (-) 50.33 a20.252.2202 a0.3529 1.3241 b0.1766 b3.84 a3.74 a54.3 b
PGPR (+)47.42 b19.581.9868 b0.3565 1.6879 a0.2885 a3.34 b3.58 b80.9 a
LSD (p < 0.05)2.031.830.22000.03560.31950.03410.4601411.5
BioC0: 0% biochar; BioC1: 2.5% biochar; BioC2: 5% biochar; BioC3: 10% biochar; PGPR(+): Inoculation; PGPR(-): non-inoculation; PH: Plant Height; RL: Root Length; PFW: Plant Fresh Weight; PDW: Plant Dry Weight; RFW, Root Fresh Weight; RDW: Root Dry Weight; T: Tillering; GR: Germination Rate; R/S: Root–Shoot ratio. Means followed by different letters are statistically different from each other according to Duncan’s Multiple Range test at p ≤ 0.05.
Table 9. Averages of the effects of biochar and PGPR applications on macronutrients, micronutrients, and heavy metal contents and Duncan multiple comparison test results.
TreatmentsKCaPMgNaFeCuZnMnPbNi
%mg kg−1
Biochar (%)
BioC02.057 b2.77 a0.499 a0.515 a0.2191 bc310 c14.25 bc133 d146 ab16.751.733 c
BioC12.268 ab1.833 b0.467 ab0.362 c0.1984 c357 bc11.43 c172 c127 b17.632.033 bc
BioC22.379 a2.363 a0.461 ab0.492 a0.2309 ab491 a16.48 b207 b139 ab17.072.217 ab
BioC32.450 a2.114 a0.441 b0.409 b0.2489 a400 b20.62 a240 a152 a17.472.450 a
LSD (p < 0.05)0.2310.2730.0460.0340.0215732.8220202.220.310
PGPR
PGPR(-)2.090 b1.975 b0.493 a0.420 b0.2304338 b17.15 a198 a13917.071.950 b
PGPR(+)2.496 a2.368 a0.445 b0.468 a0.2183441 a14.24 b178 b14417.392.267 a
LSD (p < 0.05)0.1630.1930.0330.0240.0152521.9914141.570.219
BioC0:0% biochar; BioC1: 2.5% biochar; BioC2: 5% biochar; BioC3: 10% biochar; PGPR(+): Inoculation; PGPR(-): non-inoculation. Means followed by different letters are statistically different from each other according to Duncan’s Multiple Range test at p ≤ 0.05.
Publisher’s Note: MDPI stays neutral with regard to jurisdictional claims in published maps and institutional affiliations.

