
Regulation of Phosphorus and Zinc Uptake in Relation to Arbuscular Mycorrhizal Fungi for Better Maize Growth


 , ,
, ,  ,
, 
 and
and 
Abstract
:1. Introduction
- Direct uptake via the root epidermis, or
- Use of fungal structures (arbuscules) made by AMF [37].
2. Materials and Methods
2.1. Experimental Site
2.2. Soil Collection and Analysis
2.3. Pot Preparation and Treatments
2.4. Measurement of Physiological Traits
2.4.1. Chlorophyll Contents
2.4.2. Gaseous Exchange Traits
2.4.3. Total Soluble Protein
2.5. Morphological Characteristics
2.6. Quantification of AMF Colonization
2.7. Measurement of Nutrient Contents in Plant and Soil
2.8. Statistical Analysis
3. Results
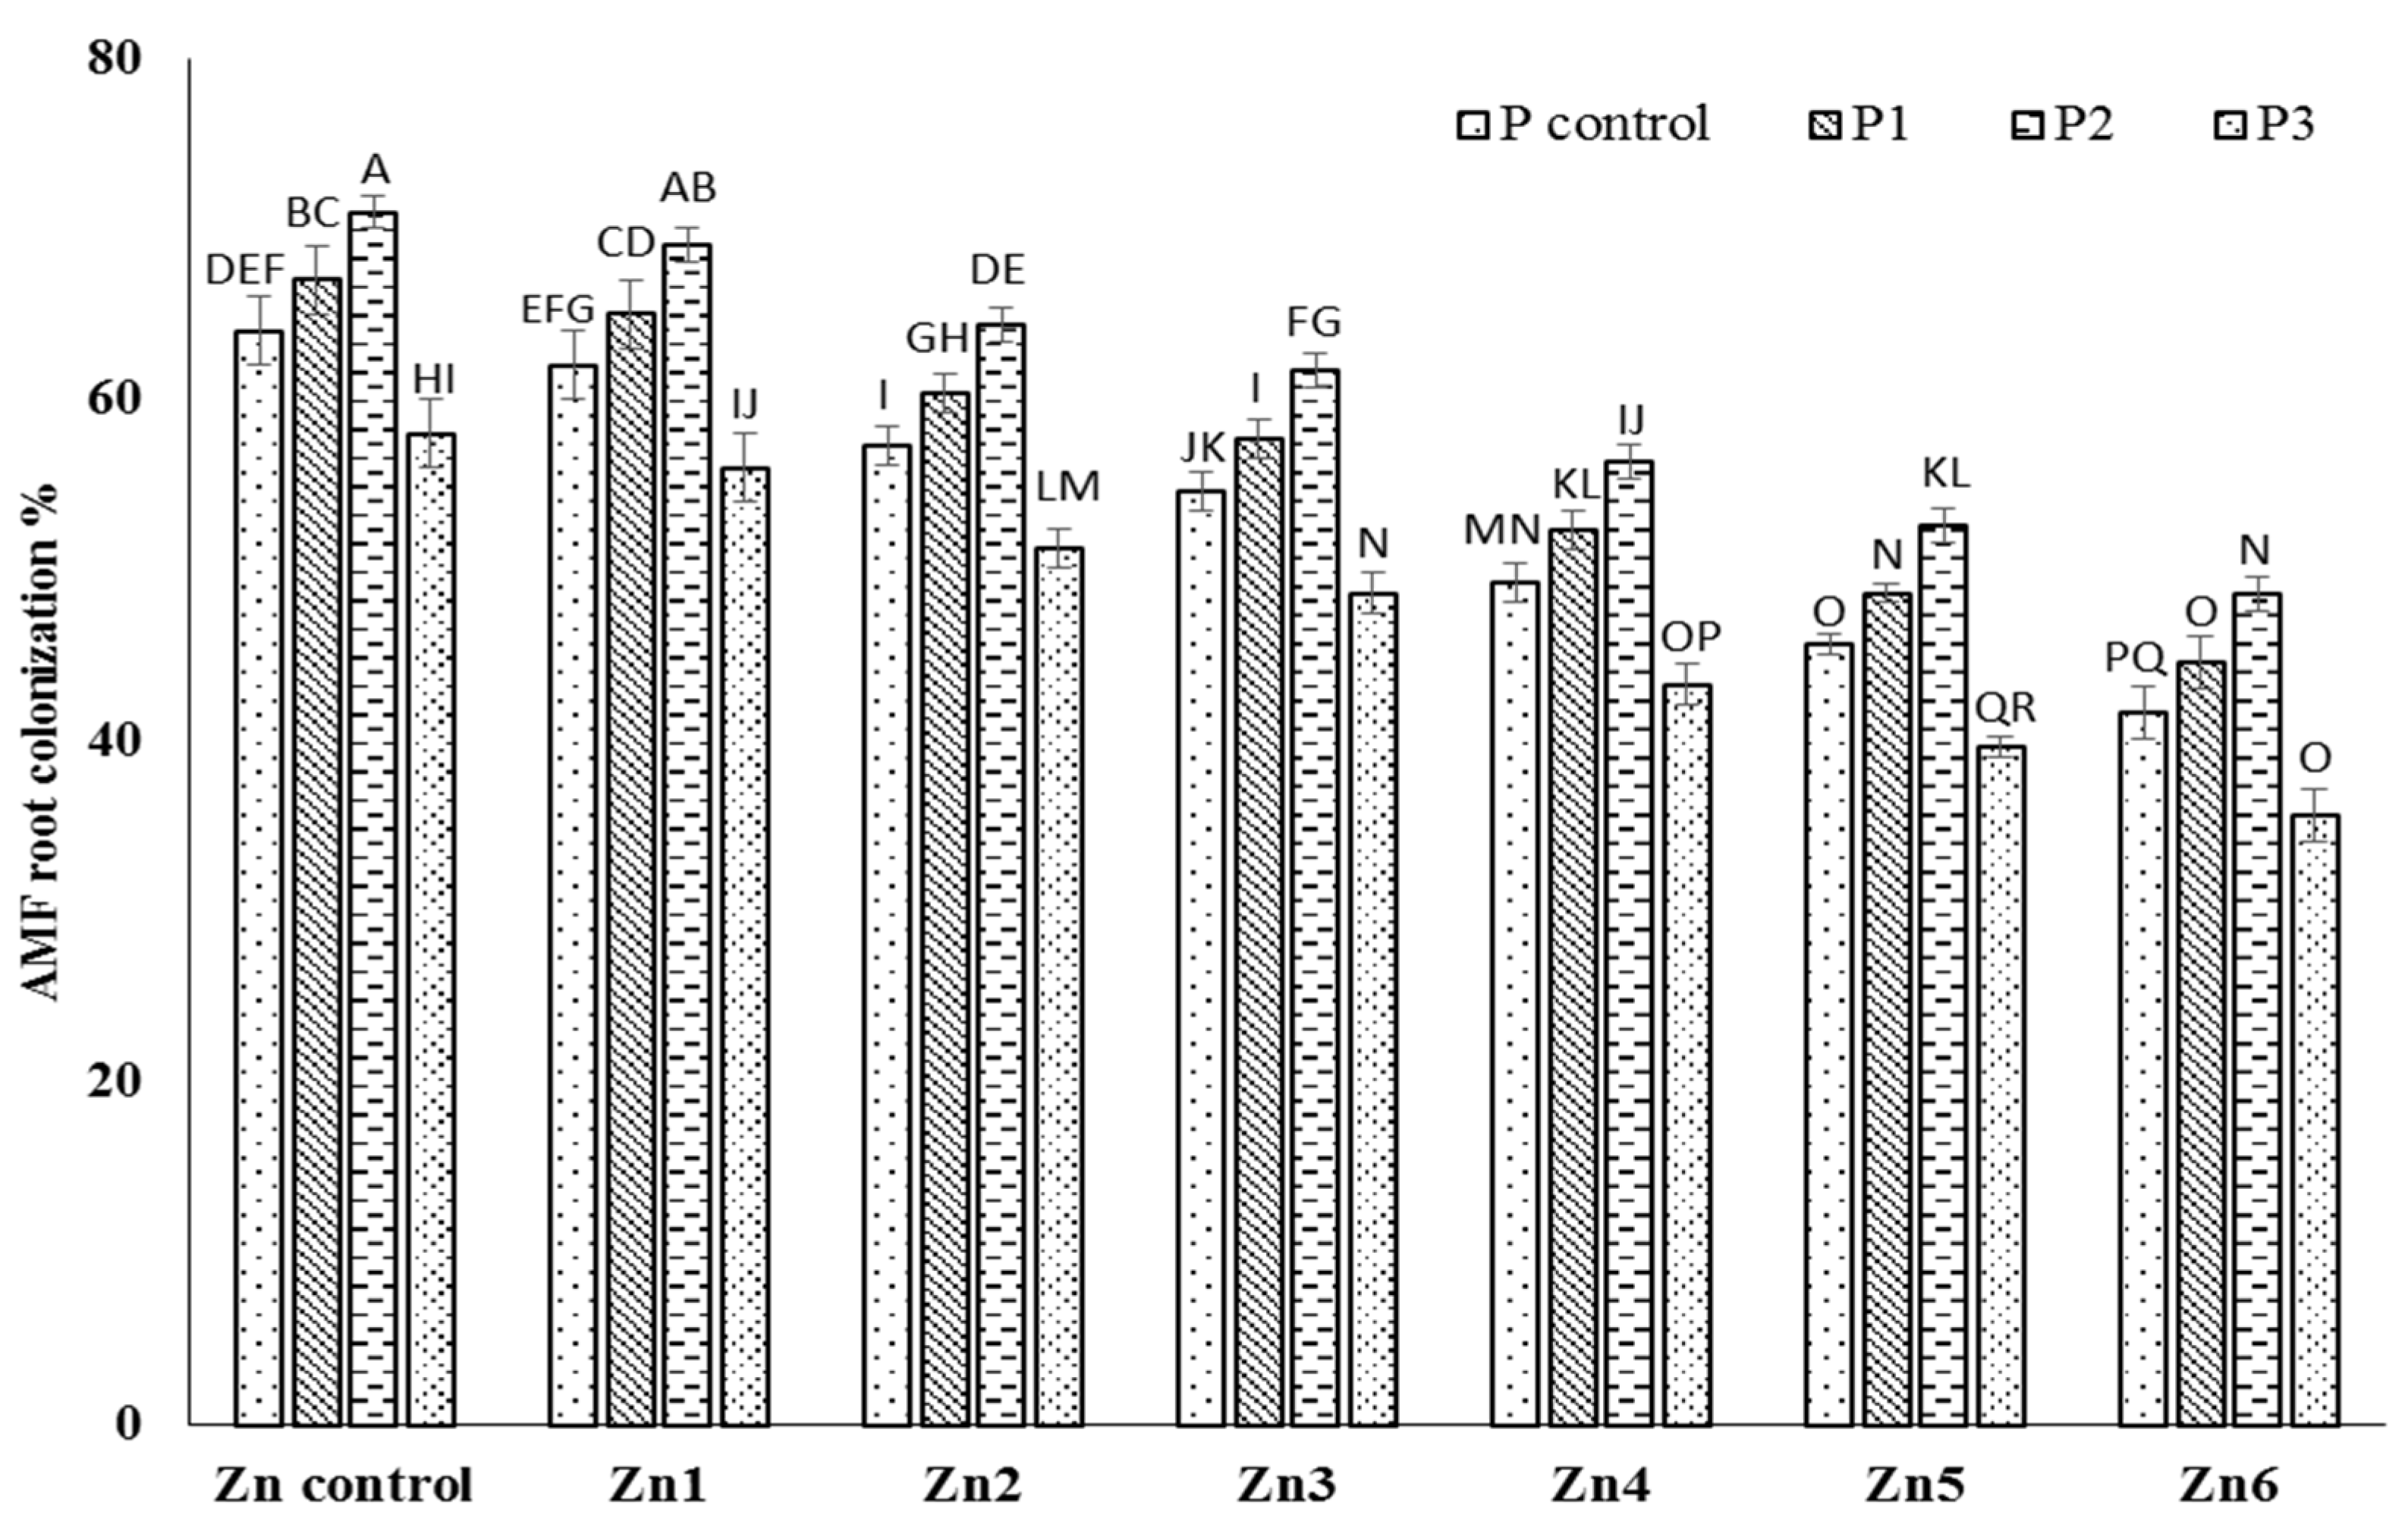
3.1. Mycorrhizal Colonization
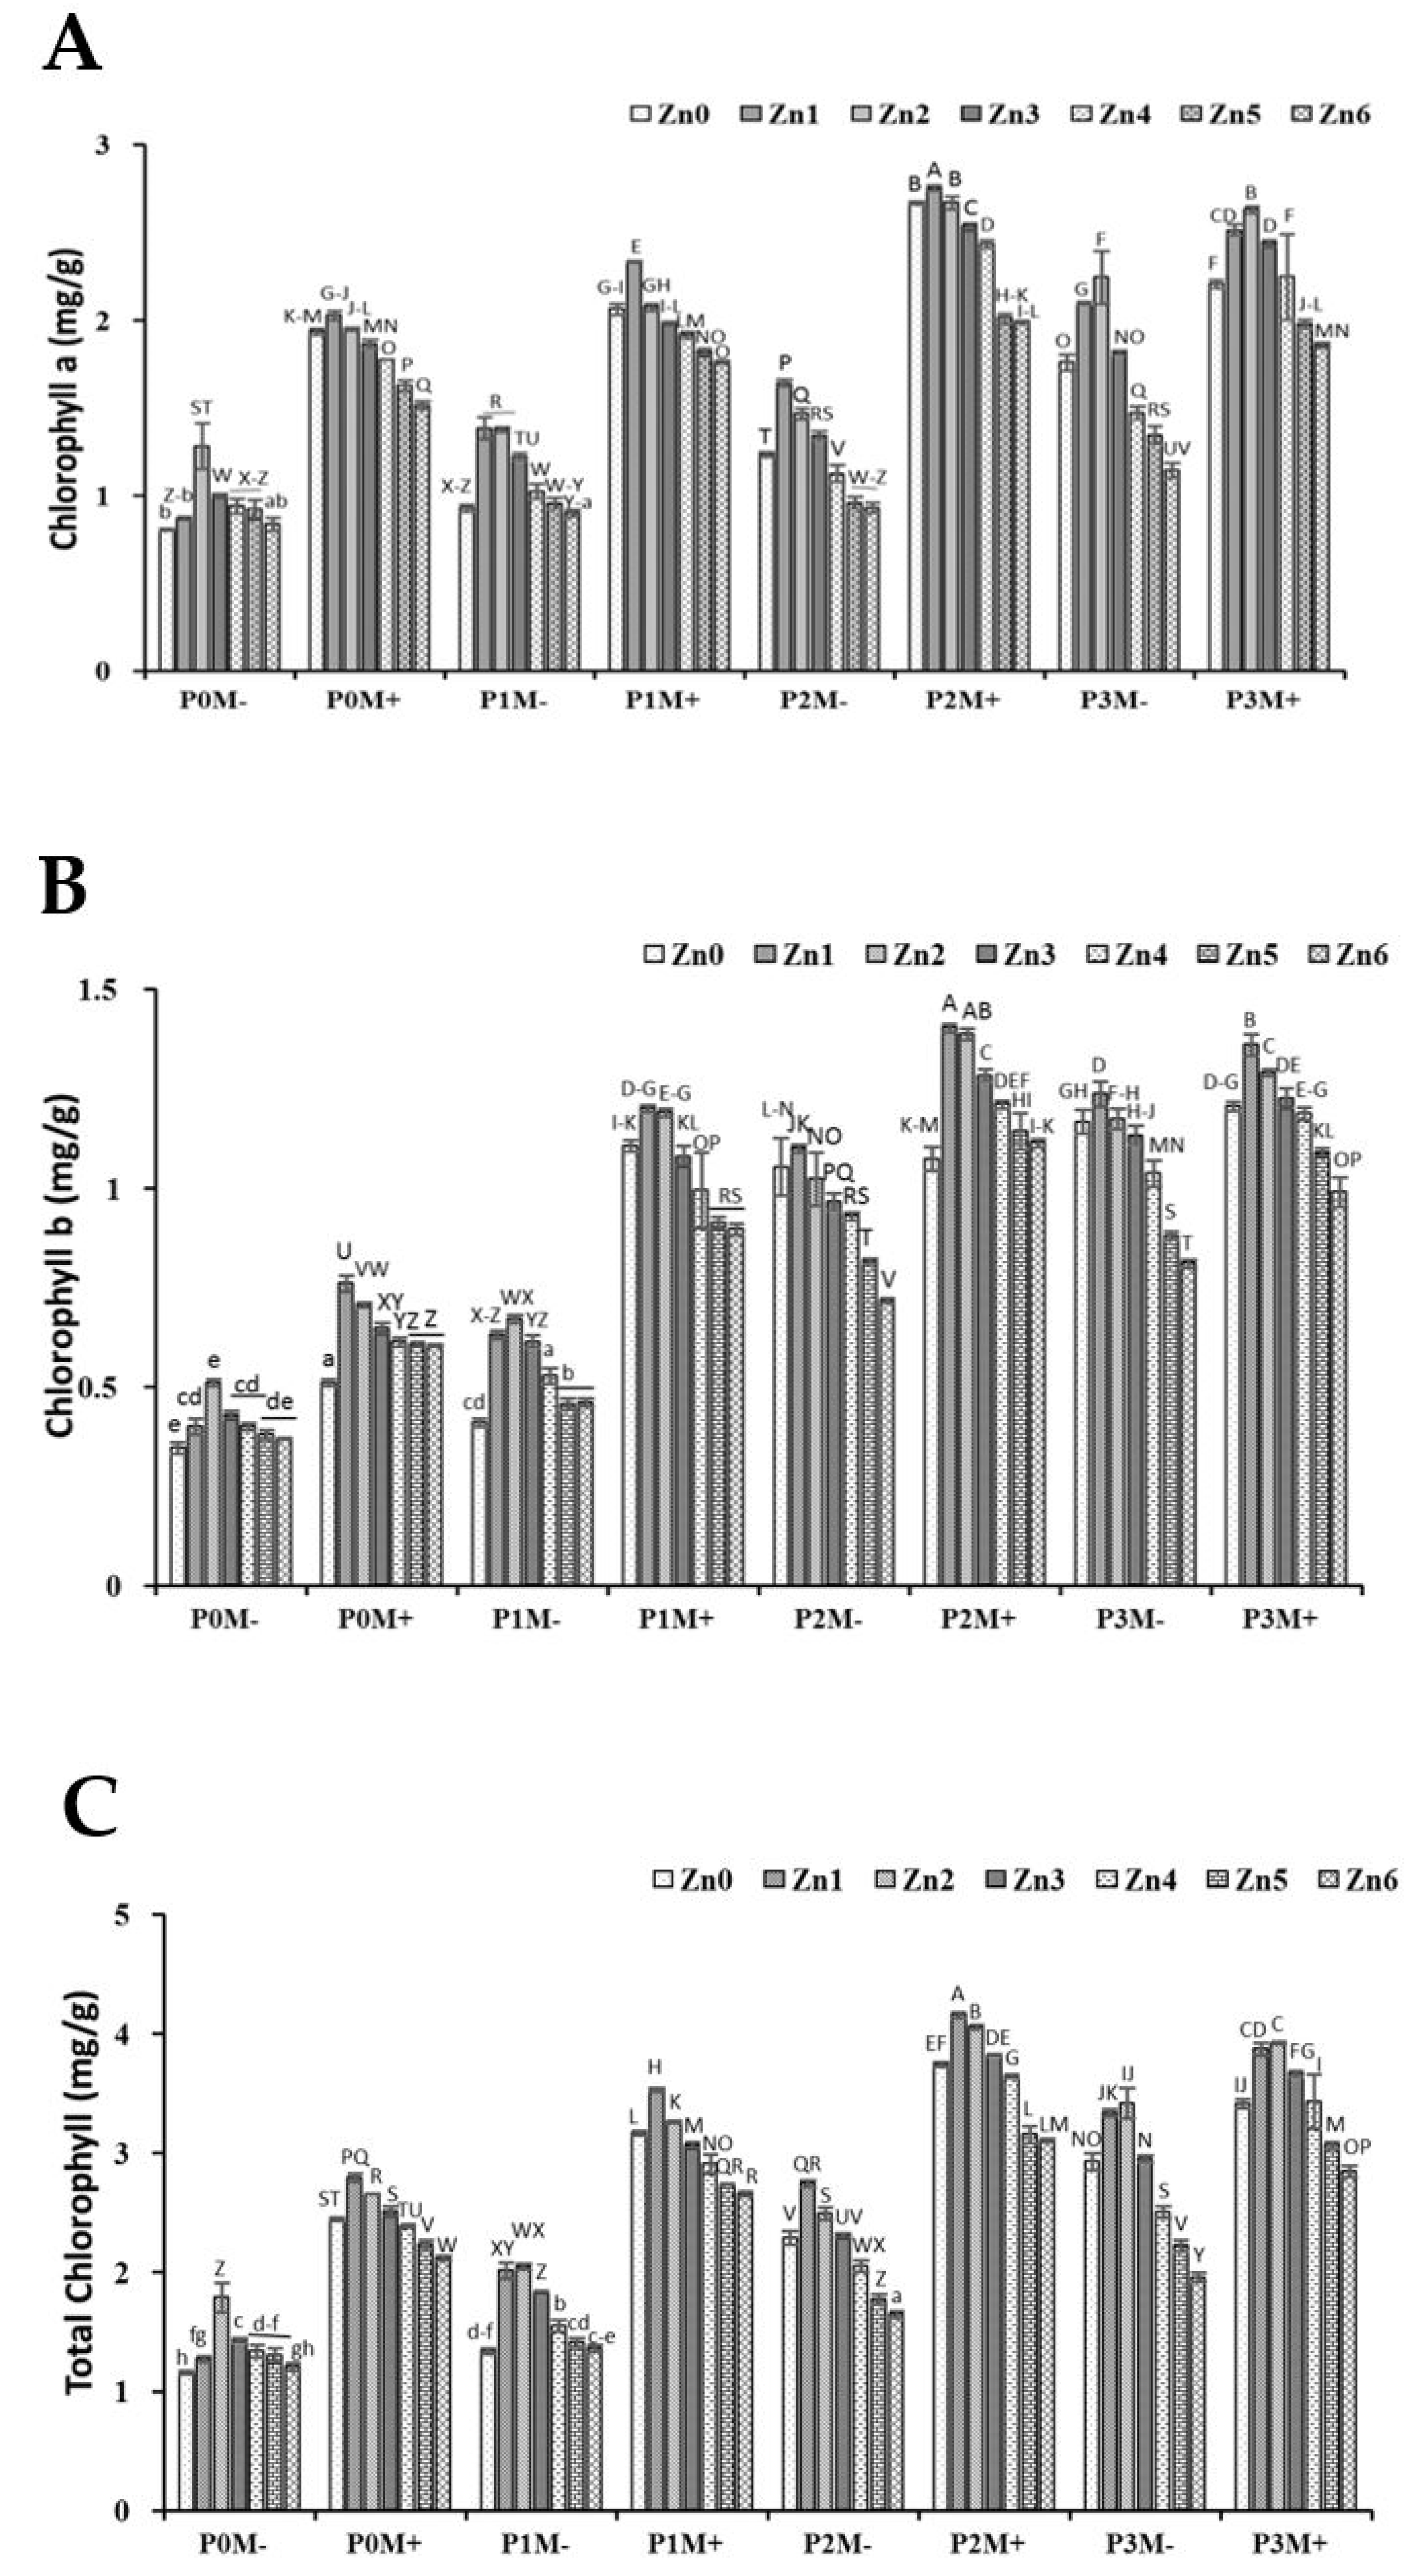
3.2. Chlorophyll Contents
3.3. Total Soluble Protein
3.4. Morphological Attributes
3.5. Gaseous Exchange Traits
3.6. Nutrient Contents in Plants and Soil
4. Discussion
5. Conclusions
Author Contributions
Funding
Data Availability Statement
Conflicts of Interest
References
- Mousavi, S.R.; Galavi, M.; Rezaei, M. Importance for Crop Production—A Review. Int. J. Agron. Plant Prod. 2013, 4, 64–68. [Google Scholar]
- Rafiullah, R.; Tariq, M.; Khan, F.; Shah, A.; Fahad, S.; Wahid, F.; Ali, J.; Adnan, M.; Ahmad, M.; Irfan, M.; et al. Effect of micronutrients foliar supplementation on the production and eminence of plum. Qual. Assur. Saf. Crop. Foods 2020, 12, 32–40. [Google Scholar] [CrossRef]
- Ullah, A.; Ali, M.; Shahzad, K.; Ahmad, F.; Iqbal, S.; Rahman, M.H.U.; Ahmad, S.; Iqbal, M.M.; Danish, S.; Fahad, S.; et al. Impact of Seed Dressing and Soil Application of Potassium Humate on Cotton Plants Productivity and Fiber Quality. Plants 2020, 9, 1444. [Google Scholar] [CrossRef] [PubMed]
- Rafiullah, R.; Khan, M.J.; Muhammad, D.; Fahad, S.; Adnan, M.; Wahid, F.; Alamri, S.; Khan, F.; Dawar, K.M.; Irshad, I.; et al. Phosphorus Nutrient Management through Synchronization of Application Methods and Rates in Wheat and Maize Crops. Plants 2020, 9, 1389. [Google Scholar] [CrossRef] [PubMed]
- Alloway, B.J. Zinc-the Vital Micronutrient for Healthy, High-Value Crops; International Zinc Association: Brussels, Belgium, 2001. [Google Scholar]
- Yosefi, K.; Galavi, M.; Ramrodi, M.; Mousavi, S.R. Effect of bio-phosphate and chemical phosphorus fertilizer accompanied with micronutrient foliar application on growth, yield and yield components of maize (Single Cross 704). Aust. J. Crop Sci. 2011, 5, 175–180. [Google Scholar]
- Tahir, F.A.; Ahamad, N.; Rasheed, M.K.; Danish, S. Effect of various application rate of zinc fertilizer with and without fruit waste biochar on the growth and Zn uptake in maize. Int. J. Biosci. 2018, 13, 159–166. [Google Scholar] [CrossRef]
- Saboor, A.; Ali, M.; Ahmed, N.; Skalicky, M.; Danish, S.; Fahad, S.; Hassan, F.; Hassan, M.; Brestic, M.; EL Sabagh, A.; et al. Biofertilizer-Based Zinc Application Enhances Maize Growth, Gas Exchange Attributes, and Yield in Zinc-Deficient Soil. Agriculture 2021, 11, 310. [Google Scholar] [CrossRef]
- Bibi, F.; Saleem, I.; Ehsan, S.; Jamil, S.; Ullah, H.; Mubashir, M.; Kiran, S.; Ahmad, I.; Irshad, I.; Saleem, M.; et al. Effect of various application rates of phosphorus combined with different zinc rates and time of zinc application on phytic acid concentration and zinc bioavailability in wheat. Agric. Nat. Resour. 2020, 54, 265–272. [Google Scholar] [CrossRef]
- Saboor, A.; Ali, M.A.; Danish, S.; Ahmed, N.; Fahad, S.; Datta, R.; Ansari, M.J.; Nasif, O.; Rahman, M.H.U.; Glick, B.R. Effect of arbuscular mycorrhizal fungi on the physiological functioning of maize under zinc-deficient soils. Sci. Rep. 2021, 11, 18468. [Google Scholar] [CrossRef]
- Ali, S.; Khan, A.R.; Mairaj, G.; Arif, M.; Fida, M.; Bibi, S. Assessment of different crop nutrient management practices for yield improvement. Aust. J. Crop Sci. 2008, 2, 150–157. [Google Scholar]
- Singh, P.; Shukla, A.K.; Behera, S.K.; Tiwari, P.K. Zinc Application Enhances Superoxide Dismutase and Carbonic Anhydrase Activities in Zinc-Efficient and Zinc-Inefficient Wheat Genotypes. J. Soil Sci. Plant Nutr. 2019, 19, 477–487. [Google Scholar] [CrossRef]
- Marschner, H. Mineral Nutrition of Higher Plants, 2nd ed.; Academic Press: Cambridge, MA, USA, 1995. [Google Scholar]
- Grahan, R.D.; Ross, M.W.; Howarth, E.B. Addressing micronutrient nutrition through enhancing the nutritional quality of staple foods: Principles, perspectives and knowledge. Adv. Agron. 2001, 70, 77–142. [Google Scholar]
- Cakmak, I. Zinc deficiency in wheat in Turkey. In Micronutrient Deficiencies in Global Crop Production; Alloway, B.J., Ed.; Springer: Dordrecht, The Netherlands, 2008; pp. 181–200. ISBN 9781402068607. [Google Scholar]
- Rafique, E.; Rashid, A.; Ryan, J.; Bhatti, A.U. Zinc Deficiency in Rainfed Wheat in Pakistan: Magnitude, Spatial Variability, Management, and Plant Analysis Diagnostic Norms. Commun. Soil Sci. Plant Anal. 2006, 37, 181–197. [Google Scholar] [CrossRef]
- Iratkar, A.G.; Giri, J.D.; Kadam, M.M.; Giri, J.N.; Dabhade, M.B. Distribution of DTPA extractable micronutrients and their relationship with soil properties in soil of Parsori watershed of Nagpur district of Maharashtra. Asian J. Soil Sci. 2014, 9, 297–299. [Google Scholar]
- Alloway, B.J. Soil factors associated with zinc deficiency in crops and humans. Proc. Environ. Geochem. Health 2009, 31, 537–548. [Google Scholar] [CrossRef] [PubMed]
- Hopkins, B.G.; Horneck, D.A.; MacGuidwin, A.E. Improving phosphorus use efficiency through potato rhizosphere modification and extension. Am. J. Potato Res. 2014, 91, 161–174. [Google Scholar] [CrossRef]
- Shafi, M.I.; Adnan, M.; Fahad, S.; Wahid, F.; Khan, A.; Yue, Z.; Danish, S.; Zafar-ul-Hye, M.; Brtnicky, M.; Datta, R. Application of Single Superphosphate with Humic Acid Improves the Growth, Yield and Phosphorus Uptake of Wheat (Triticum aestivum L.) in Calcareous Soil. Agronomy 2020, 10, 1224. [Google Scholar] [CrossRef]
- Rahi, A.A.; Anjum, M.A.; Iqbal Mirza, J.; Ahmad Ali, S.; Marfo, T.D.; Fahad, S.; Danish, S.; Datta, R. Yield Enhancement and Better Micronutrients Uptake in Tomato Fruit through Potassium Humate Combined with Micronutrients Mixture. Agriculture 2021, 11, 357. [Google Scholar] [CrossRef]
- Bibi, F.; Saleem, I.; Javid, S.; Ehsan, S.; Danish, S.; Ahmad, I. Phosphorus release kinetics of applied phosphate is influenced by time and organic sources in clay loam and sandy clay loam soils. Soil Environ. 2018, 37, 136–142. [Google Scholar] [CrossRef]
- Adnan, M.; Fahad, S.; Zamin, M.; Shah, S.; Mian, I.A.; Danish, S.; Zafar-Ul-Hye, M.; Battaglia, M.L.; Naz, R.M.M.; Saeed, B.; et al. Coupling Phosphate-Solubilizing Bacteria with Phosphorus Supplements Improve Maize Phosphorus Acquisition and Growth under Lime Induced Salinity Stress. Plants 2020, 9, 900. [Google Scholar] [CrossRef]
- Danish, S.; Younis, U.; Akhtar, N.; Ameer, A.; Ijaz, M.; Nasreen, S.; Huma, F.; Sharif, S.; Ehsanullah, M. Phosphorus solubilizing bacteria and rice straw biochar consequence on maize pigments synthesis. Int. J. Biosci. 2015, 5, 31–39. [Google Scholar] [CrossRef]
- Hopkins, B.; Ellsworth, J. Phosphorus availability with alkaline/calcareous soil. In Proceedings of the Western Nutrient Management Conference, Salt Lake City, UT, USA, 3–4 March 2005; pp. 88–93. [Google Scholar]
- Singh, J.P.; Karamanos, R.E.; Stewart, J.W.B. Phosphorus-induced Zinc Deficiency in Wheat on Residual Phosphorus Plots 1. Agron. J. 1986, 78, 668–675. [Google Scholar] [CrossRef]
- Watts-Williams, S.J.; Cavagnaro, T.R. Arbuscular mycorrhizas modify tomato responses to soil zinc and phosphorus addition. Biol. Fertil. Soils 2012, 48, 285–294. [Google Scholar] [CrossRef]
- Danish, S.; Tahir, F.A.; Rasheed, M.K.; Ahmad, N.; Ali, M.A.; Kiran, S.; Younis, U.; Irshad, I.; Butt, B. Effect of foliar application of Fe and banana peel waste biochar on growth, chlorophyll content and accessory pigments synthesis in spinach under chromium (IV) toxicity. Open Agric. 2019, 4, 381–390. [Google Scholar] [CrossRef]
- Wahid, F.; Fahad, S.; Danish, S.; Adnan, M.; Yue, Z.; Saud, S.; Siddiqui, M.H.; Brtnicky, M.; Hammerschmiedt, T.; Datta, R. Sustainable Management with Mycorrhizae and Phosphate Solubilizing Bacteria for Enhanced Phosphorus Uptake in Calcareous Soils. Agriculture 2020, 10, 334. [Google Scholar] [CrossRef]
- Ahmed, N.; Ahsen, S.; Ali, M.A.; Hussain, M.B.; Hussain, S.B.; Rasheed, M.K.; Butt, B.; Irshad, I.; Danish, S. Rhizobacteria and silicon synergy modulates the growth, nutrition and yield of mungbean under saline soil. Pak. J. Bot. 2020, 52, 9–15. [Google Scholar] [CrossRef]
- Danish, S.; Zafar-Ul-Hye, M. Combined Role of ACC Deaminase Producing Bacteria and Biochar on Cereals Productivity under Drought. Phyton 2020, 89, 217–227. [Google Scholar] [CrossRef]
- Zafar-Ul-Hye, M.; Zahra, M.B.; Danish, S.; Abbas, M.; Rehim, A.; Akbar, M.N.; Iftikhar, A.; Gul, M.; Nazir, I.; Abid, M.; et al. Multi-strain Inoculation with PGPR Producing ACC Deaminase is More Effective Than Single-strain Inoculation to Improve Wheat (Triticum aestivum) Growth and Yield. Phyton Int. J. Exp. Bot. 2020, 89, 405–413. [Google Scholar] [CrossRef]
- Zhu, X.-C.; Song, F.-B.; Xu, H.-W. Arbuscular mycorrhizae improves low temperature stress in maize via alterations in host water status and photosynthesis. Plant Soil 2010, 331, 129–137. [Google Scholar] [CrossRef]
- Smith, S.E.; Read, D. Growth and carbon economy of arbuscular mycorrhizal symbionts. In Mycorrhizal Symbiosis; Smith, S.E., Read, D., Eds.; Academic Press Inc.: Cambridge, MA, USA; Elsevier: Cambridge, MA, USA, 2008; pp. 117–144. [Google Scholar]
- Watts-Williams, S.J.; Cavagnaro, T. Arbuscular mycorrhizal fungi increase grain zinc concentration and modify the expression of root ZIP transporter genes in a modern barley (Hordeum vulgare) cultivar. Plant Sci. 2018, 274, 163–170. [Google Scholar] [CrossRef] [PubMed]
- Watts-Williams, S.J.; Patti, A.F.; Cavagnaro, T.R. Arbuscular mycorrhizas are beneficial under both deficient and toxic soil zinc conditions. Plant Soil 2013, 371, 299–312. [Google Scholar] [CrossRef]
- Smith, S.E.; Smith, F.A.; Jakobsen, I. Mycorrhizal Fungi Can Dominate Phosphate Supply to Plants Irrespective of Growth Responses. Plant Physiol. 2003, 133, 16–20. [Google Scholar] [CrossRef] [Green Version]
- Bieleski, R.L. Phosphate Pools, Phosphate Transport, and Phosphate Availability. Annu. Rev. Plant Physiol. 1973, 24, 225–252. [Google Scholar] [CrossRef]
- Christie, P.; Li, X.; Chen, B. Arbuscular mycorrhiza can depress translocation of zinc to shoots of host plants in soils moderately polluted with zinc. Plant Soil 2004, 261, 209–217. [Google Scholar] [CrossRef] [Green Version]
- Rhoades, J.D. Salinity: Electrical conductivity and total dissolved solids. In Methods of Soil Analysis, Part 3, Chemical Methods; Sparks, D.L., Page, A.L., Helmke, P.A., Loeppert, R.H., Soltanpour, P.N., Tabatabai, M.A., Johnston, C.T., Sumner, M.E., Eds.; Soil Science Society of America: Madison, WI, USA, 1996; Volume 5, pp. 417–435. [Google Scholar]
- Page, A.L.; Miller, R.H.; Keeny, D.R. Soil pH and lime requirement. In Methods of Soil Analysis; American Society of Agronomy: Madison, WI, USA, 1982; pp. 199–208. [Google Scholar]
- Olsen, S.R.; Sommers, L.E. Phosphorus. In Method of Soil Analysis, Agron. No. 9, Part 2: Chemical and Microbiological Properties; Page, A.L., Ed.; American Society of Agronomy: Madison, WI, USA, 1982; pp. 403–430. [Google Scholar]
- Pratt, P.F. Potassium. In Methods of Soil Analysis: Part 2 Chemical and Microbiological Properties, 9.2; Norman, A.G., Ed.; John & Wiley & Sons, Ltd.: Hoboken, NJ, USA, 1965; pp. 1022–1030. [Google Scholar]
- Nelson, D.W.; Sommers, L.E. Total carbon, organic carbon, and organic matter. In Methods of Soil Analysis: Part 2 Chemical and Microbiological Properties; Page, A.L., Ed.; American Society of Agronomy, Crop Science Society of America, and Soil Science Society of America: Madison, WI, USA, 1982; pp. 539–579. [Google Scholar]
- Bremner, J.M.; Mulvaney, C.S. Nitrogen–total. In Methods of Soil Analysis. Part 2. Chemical and Microbiological Properties; Page, A.L., Miller, R.H., Keeney, D.R., Eds.; American Society of Agronomy, Soil Science Society of America, Madison: Madison, WI, USA, 1982; pp. 595–624. [Google Scholar]
- Chen, B.; Li, X.; Tao, H.; Christie, P.; Wong, M. The role of arbuscular mycorrhiza in zinc uptake by red clover growing in a calcareous soil spiked with various quantities of zinc. Chemosphere 2003, 50, 839–846. [Google Scholar] [CrossRef]
- Amanullah; Almas, L.K.; Shah, P. Timing and Rate of Nitrogen Application Influence Profitability of Maize Planted at Low and High Densities in Northwest Pakistan. Agron. J. 2010, 102, 575–579. [Google Scholar] [CrossRef]
- Arnon, D.I. Copper enzymes in isolated chloroplasts. Polyphenoloxidase in Beta vulgaris. Plant Physiol. 1949, 24, 1. [Google Scholar] [CrossRef] [Green Version]
- Bradford, M.M. A rapid and sensitive method for the quantitation of microgram quantities of protein utilizing the principle of protein-dye binding. Anal. Biochem. 1976, 72, 248–254. [Google Scholar] [CrossRef]
- Phillips, J.M.; Hayman, D.S. Improved procedures for clearing roots and staining parasitic and vesicular-arbuscular mycorrhizal fungi for rapid assessment of infection. Trans. Br. Mycol. Soc. 1970, 55, 158–161. [Google Scholar] [CrossRef]
- Ohno, T.; Zibilske, L.M. Determination of Low Concentrations of Phosphorus in Soil Extracts Using Malachite Green. Soil Sci. Soc. Am. J. 1991, 55, 892–895. [Google Scholar] [CrossRef]
- Lindsay, W.L.; Norvell, W.A. Development of a DTPA soil test for zinc, iron, manganese, and copper. Soil Sci. Soc. Am. J. 1978, 42, 421–428. [Google Scholar] [CrossRef]
- Kuo, S. Phosphorus. In Methods of Soil Analysis Part 3: Chemical Methods; Sparks, D.L., Page, A.L., Helmke, P.A., Loeppert, R.H., Soltanpour, P.N., Tabatabai, M.A., Johnston, C.T., Sumner, M.E., Eds.; John & Wiley & Sons, Ltd.: Madison, WI, USA, 1996; pp. 869–919. [Google Scholar]
- Steel, R.G.D.; Torrie, J.H. Principles and procedures of dtatistics. A biometrical approach, 3rd ed.; McGraw Hill Book Company Inc.: New York, NY, USA, 1996; pp. 334–381. [Google Scholar] [CrossRef]
- Zhang, W.; Chen, X.-X.; Liu, Y.-M.; Liu, D.-Y.; Chen, X.-P.; Zou, C.-Q. Zinc uptake by roots and accumulation in maize plants as affected by phosphorus application and arbuscular mycorrhizal colonization. Plant Soil 2017, 413, 59–71. [Google Scholar] [CrossRef]
- Zhang, W.; Liu, D.; Liu, Y.; Cui, Z.; Chen, X.; Zou, C. Zinc uptake and accumulation in winter wheat relative to changes in root morphology and mycorrhizal colonization following varying phosphorus application on calcareous soil. Field Crops Res. 2016, 197, 74–82. [Google Scholar] [CrossRef]
- Coccina, A.; Cavagnaro, T.R.; Pellegrino, E.; Ercoli, L.; McLaughlin, M.J.; Watts-Williams, S.J. The mycorrhizal pathway of zinc uptake contributes to zinc accumulation in barley and wheat grain. BMC Plant Biol. 2019, 19, 133. [Google Scholar] [CrossRef] [Green Version]
- Tinker, P.B.; Nye, P. Solute transport in the soil near root surfaces. In Solute Movement in the Rhizosphere; Tinker, P.B., Nye, P., Eds.; Oxford University Press: New York, NY, USA, 2000. [Google Scholar] [CrossRef]
- Ortas, I. Under filed conditions, mycorrhizal inoculum effectiveness depends on plant species and phosphorus nutrition. J. Plant Nutr. 2019, 42, 2349–2362. [Google Scholar] [CrossRef]
- Toler, H.D.; Morton, J.B.; Cumming, J.R. Growth and metal accumulation of mycorrhizal sorghum exposed to elevated copper and zinc. Water, Air, and Soil Pollut. 2005, 164, 155–172. [Google Scholar] [CrossRef]
- Baslam, M.; Esteban, R.; Garcia-Plazaola, J.I.; Goicoechea, N. Effectiveness of arbuscular mycorrhizal fungi (AMF) for inducing the accumulation of major carotenoids, chlorophylls and tocopherol in green and red leaf lettuces. Appl. Microbiol. Biotechnol. 2013, 97, 3119–3128. [Google Scholar] [CrossRef]
- Raklami, A.; El Gharmali, A.; Rahou, Y.A.; Oufdou, K.; Meddich, A. Compost and mycorrhizae application as a technique to alleviate Cd and Zn stress in Medicago sativa. Int. J. Phytoremediat. 2021, 23, 190–201. [Google Scholar] [CrossRef]
- Babaeian, M.; Piri, I.; Tavassoli, A.; Esmaeilian, Y.; Gholami, H. Effect of water stress and micronutrients (Fe, Zn and Mn) on chlorophyll fluorescence, leaf chlorophyll content and sunflower nutrient uptake in Sistan region. Afr. J. Agric. Res. 2011, 6, 3526–3531. [Google Scholar]
- Kaur, S.; Kumar, P. Ameliorative effect of trichoderma, rhizobium and mycorrhiza on internodal length, leaf area and total soluble protein in mung bean (Vigna radiata [L.] R. Wilazek) under drought stress. J. Pharmacogn. Phytochem. 2020, 9, 971–977. [Google Scholar]
- Nguyen, T.D.; Cavagnaro, T.R.; Watts-Williams, S.J. The effects of soil phosphorus and zinc availability on plant responses to mycorrhizal fungi: A physiological and molecular assessment. Sci. Rep. 2019, 9, 14880. [Google Scholar] [CrossRef] [PubMed]
- Subramanian, K.S.; Bharathi, C.; Jegan, A. Response of maize to mycorrhizal colonization at varying levels of zinc and phosphorus. Biol. Fertil. Soils 2008, 45, 133–144. [Google Scholar] [CrossRef]
- Nafady, N.A.; Elgharably, A. Mycorrhizal symbiosis and phosphorus fertilization effects on Zea mays growth and heavy metals uptake. Int. J. Phytoremediat. 2018, 20, 869–875. [Google Scholar] [CrossRef] [PubMed]
- Cavagnaro, T.R.; Dickson, S.; Smith, F.A. Arbuscular mycorrhizas modify plant responses to soil zinc addition. Plant Soil 2010, 329, 307–313. [Google Scholar] [CrossRef]
- Watts-Williams, S.J.; Tyerman, S.; Cavagnaro, T. The dual benefit of arbuscular mycorrhizal fungi under soil zinc deficiency and toxicity: Linking plant physiology and gene expression. Plant Soil 2017, 420, 375–388. [Google Scholar] [CrossRef]


| Zn Level | Control (P0) | P1 | P2 | P3 | ||||
|---|---|---|---|---|---|---|---|---|
| (mg/kg) | M+ | M− | M+ | M− | M+ | M− | M+ | M− |
| Zn 0 | Z0P0M1 | Z0P0M0 | Z0P1M1 | Z0P1M0 | Z0P2M+ | Z0P2M− | Z0P3M+ | Z0P3M− |
| Zn 20 | Z1P0M1 | Z1P0M0 | Z1P1M1 | Z1P1M0 | Z1P2M+ | Z1P2M− | Z1P3M+ | Z1P3M− |
| Zn 40 | Z2P0M1 | Z2P0M0 | Z2P1M1 | Z2P1M0 | Z2P2M+ | Z2P2M− | Z2P3M+ | Z2P3M− |
| Zn 60 | Z3P0M1 | Z3P0M0 | Z3P1M1 | Z3P1M0 | Z3P2M+ | Z3P2M− | Z3P3M+ | Z3P3M− |
| Zn 80 | Z4P0M1 | Z4P0M0 | Z4P1M1 | Z4P1M0 | Z4P2M+ | Z4P2M− | Z4P3M+ | Z4P3M− |
| Zn 100 | Z5P0M1 | Z5P0M0 | Z5P1M1 | Z5P1M0 | Z5P2M+ | Z5P2M− | Z5P3M+ | Z5P3M− |
| Zn 120 | Z6P0M1 | Z6P0M0 | Z6P1M1 | Z6P1M0 | Z6P2M+ | Z6P2M− | Z6P3M+ | Z6P3M− |
| Factors | AMF | Gs | A | E | Stem Girth | Plant Height | Fresh Weight | Shoot P | Root P | Shoot Zn | Root Zn | Chl a | Chl b | Total Chl | TSP |
|---|---|---|---|---|---|---|---|---|---|---|---|---|---|---|---|
| Mycorrhiza | *** | ** | *** | *** | *** | *** | *** | *** | *** | *** | *** | *** | *** | *** | *** |
| Phosphorous | *** | *** | *** | *** | *** | *** | *** | *** | *** | *** | *** | *** | *** | *** | *** |
| Zinc | *** | *** | *** | *** | *** | *** | *** | *** | *** | *** | *** | *** | *** | *** | *** |
| M × P | ** | *** | *** | *** | *** | *** | *** | *** | *** | *** | *** | *** | *** | *** | *** |
| M × Zn | *** | *** | *** | ** | *** | *** | *** | *** | *** | *** | *** | *** | *** | *** | *** |
| P × Zn | ns | *** | *** | *** | *** | *** | *** | *** | *** | *** | *** | *** | *** | *** | *** |
| M × P × Zn | ns | *** | *** | *** | *** | *** | *** | *** | *** | *** | *** | *** | *** | *** | *** |
| Zn (mg/kg) | Plant Height (cm) | |||||||
|---|---|---|---|---|---|---|---|---|
| P control | P1 | P2 | P3 | |||||
| NM | AM | NM | AM | NM | AM | NM | AM | |
| Zn control | 62.3 ± 1.5 W–Y | 75 ± 1 W–Y | 62.5 ± 0.5 W–Y | 76.6 ± 0.6 E–G | 64.6 ± 0.6 U–X | 76.3±1.1 F,G | 66.6 ± 1.5 R–U | 76.3 ± 5.8 F,G |
| Zn20 | 63.3 ± 1.1 V–Y | 76.6 ± 1.5 E–G | 65.8 ± 1 S–V | 84.3 ± 0.6 B | 70.6 ± 1.1 M–P | 88.3±2 A | 75 ± 0.7 G–L | 74.3 ± 3 G–J |
| Zn40 | 64.3 ± 3.5 U–X | 75.3 ± 3 G–I | 68.5 ± 1.3 P–S | 82.8 ± 0.3 B,C | 72 ± 4 L–O | 83.6±0.6 B,C | 75.3 ± 1.5 G–I | 72.6 ± 1.1 I–N |
| Zn60 | 65 ± 2 T–W | 75 ± 1 G–K | 64.5 ± 0.8 U–X | 79 ± 1 D–E | 70.6 ± 1.1 M–P | 83.3±1.5 B,C | 72.5 ± 1.5 J–N | 72.3 ± 2.5 K–N |
| Zn80 | 63 ± 1 W–Y | 74 ± 0 G–L | 62.8 ± 3 W–Y | 75.6 ± 0.7 G,H | 70.3 ± 1.5 N–Q | 81.4±1.2 C,D | 70.6 ± 1.1 M–P | 67.6 ± 1.5 M–P |
| Zn100 | 62.3 ± 1.1 W–Y | 72.8 ± 0.7 I–N | 62 ± 0 X,Y | 73.3 ± 1.5 H–M | 68 ± 0 P–S | 79.3±0.6 D,E | 69.3 ± 0.6 O–R | 71.6 ± 2.5 L–O |
| Zn120 | 59 ± 2.6 Z | 72 ± 1.15 K–N | 61 ± 1 Y,Z | 72 ± 0.29 L–O | 64 ± 1 U–X | 76.3±0.6 F,G | 66 ± 0 S–V | 70.3 ± 0.6 N–Q |
| Zn (mg/kg) | Stem Diameter (cm) | |||||||
|---|---|---|---|---|---|---|---|---|
| P control | P1 | P2 | P3 | |||||
| NM | AM | NM | AM | NM | AM | NM | AM | |
| Zn control | 2.01 ± 0.03 Z–c | 2.35 ± 0.05 J–N | 2.06 ± 0.03 W–a | 2.39 ± 0.01 H–K | 2.21 ± 0.05 V–Y | 2.40 ± 0.02 G–J | 2.28 ± 0.1 N–P | 2.04 ± 0.05 X–b |
| Zn20 | 2.2 ± 0.08 Q–U | 2.4 ± 0.04 G–I | 2.31 ± 0.03 K–O | 2.57 ± 0.02 D,E | 2.36 ± 0.02 I–M | 3.26 ± 0.04 A | 2.4 ± 0.01 G–J | 2.4 ± 0.05 G–J |
| Zn40 | 2.3 ± 0.05 L–P | 2.47 ± 0.25 F,G | 2.3 ± 0.01 L–P | 2.52 ± 0.02 E,F | 2.4 ± 0.02 G–J | 3.06 ± 0.05 B | 2.4 ± 0.01 G–J | 2.26 ± 0.11 O–R |
| Zn60 | 2.1 ± 0.05 V–Y | 2.29 ± 0.01 M–P | 2.25 ± 0.05 O–R | 2.45 ± 0.01 F–H | 2.3 ± 0.05 L–P | 2.89 ± 0 C | 2.38 ± 0 H–L | 2.27 ± 0.02 N–Q |
| Zn80 | 2.08 ± 0.07 V–Z | 2.2 ± 0 P–T | 2.12 ± 0.02 U–X | 2.4 ± 0.01 G–I | 2.23 ± 0.02 P–S | 2.63 ± 0.02 D | 2.3 ± 0.02 K–O | 2.15 ± 0.05 S–V |
| Zn100 | 1.98 ± 0.02 b,c | 2.18 ± 0 R–U | 2 ± 0.05 Y–b | 2.3 ± 0.02 K–P | 2.12 ± 0.02 U–X | 2.5 ± 0.02 E,F | 2.19 ± 0 Q–U | 2.03 ± 0.05 Y–b |
| Zn120 | 1.7 ± 0.05 e | 2 ± 0 a–c | 1.82 ± 0.16 d | 2.14 ± 0.04 T–W | 1.95 ± 0.05 c | 2.3 ± 0.01 L–P | 2.01 ± 0.02 Z–c | 1.96 ± 0.02 b,c |
| Zn (mg/kg) | Fresh Weight (kg) | |||||||
|---|---|---|---|---|---|---|---|---|
| P control | P1 | P2 | P3 | |||||
| NM | AM | NM | AM | NM | AM | NM | AM | |
| Zn control | 0.07 ± 0.001 Z,a | 0.14 ± 0.01 P,Q | 0.09 ± 0.003 X,Y | 0.16 ± 0.003 L–N | 0.11 ± 0.005 U–W | 0.26 ± 0.1 E,F | 0.18 ± 0.003 P,Q | 0.23 ± 0.02 H |
| Zn20 | 0.08 ± 0.003 Y,Z | 0.21 ± 0.005 I | 0.11 ± 0.005 U–W | 0.24 ± 0.02 G,H | 0.12 ± 0.0 S–V | 0.32 ± 0.02 A | 0.196 ± 0.002 N–P | 0.3 ± 0.007 A |
| Zn40 | 0.11 ± 0.002 T–W | 0.18 ± 0.001 J,K | 0.13 ± 0.001 Q–S | 0.22 ± 0.01 I | 0.14 ± 0.002 O–Q | 0.3 ± 0.01 B | 0.22 ± 0.003 J,K | 0.28 ± 0.005 C,D |
| Zn60 | 0.10 ± 0.002 K,L | 0.17 ± 0.008 R–U | 0.12 ± 0.002 J | 0.19 ± 0.005 Q–T | 0.13 ± 0.001 B,C | 0.29 ± 0.003 B,C | 0.21 ± 0.001 K–M | 0.27 ± 0.002 C,D |
| Zn80 | 0.09 ± 0.003 X,Y | 0.15 ± 0.006 WX | 0.10 ± 0.003 L–N | 0.16 ± 0.01 R–U | 0.12 ± 0.003 D,E | 0.27 ± 0.002 D,E | 0.19 ± 0.002 N–P | 0.25 ± 0.02 F,G |
| Zn100 | 0.04 ± 0.009 b | 0.12 ± 0.007 Z,a | 0.07 ± 0.001 Q–S | 0.13 ± 0.005 W,X | 0.10 ± 0.003 Q,R | 0.19 ± 0.01 Q,R | 0.17 ± 0.01 Q–S | 0.17 ± 0.01 R–V |
| Zn120 | 0.03 ± 0.001 b | 0.10±0.001 a | 0.06 ± 0.001 U–W | 0.11 ± 0.005 X,Y | 0.09 ± 0.001 T–W | 0.17 ± 0.01 T–W | 0.14 ± 0.01 W,X | 0.16 ± 0.01 V–X |
| P Application Rates | Zn Application Rates | Photosynthesis Rate | Transpiration Rate | Stomatal Conductance | |||
|---|---|---|---|---|---|---|---|
| P (kg/ac) | Zn (mg/kg) | NM | AM | NM | AM | NM | AM |
| P control | Zn control | 1.03 ± 0.06 d | 2.5 ± 0.1 a | 0.92 ± 0.06 b–d | 1.19 ± 0.11 XY | 0.021 ± 0.00 S–W | 0.04±0.01 M–O |
| Zn 20 mg/kg | 2.23 ± 0.05 ab | 7.53 ± 0.20 LM | 1.33 ± 0.05 UV | 1.47 ± 0.04 ST | 0.030 ± 0.001 O–S | 0.55 ± 0.008 I–K | |
| Zn 40 mg/kg | 3.4 ± 0.1 Y | 6.83 ± 0.20 OP | 1.10 ± 0.01 YZ | 1.33 ± 0.01 UV | 0.015 ± 0.001 U–Y | 0.019 ± 0.001 T–X | |
| Zn 60 mg/kg | 1.96 ± 0.05 b | 5.24 ± 0.05 RS | 0.98 ± 0.01 a–c | 1.13 ± 0.04 X–Z | 0.012 ± 0.001 W–Z | 0.016 ± 0.001 U–Y | |
| Zn 80 mg/kg | 1.53 ± 0.05 c | 4.92 ± 0.02 S–U | 0.92 ± 0 b–d | 1.13 ± 0.01 ab | 0.093 ± 0.005 DE | 0.014 ± 0.001 U–Y | |
| Zn 100 mg/kg | 0.99 ± 0.01 d | 3.3 ± 0.1 YZ | 0.88 ± 0.01 cd | 0.99 ± 0.17 bc | 0.071 ± 0.001 G | 0.012 ± 0.001 W–Z | |
| Zn 120 mg/kg | 0.24 ± 0.03 e | 2.53 ± 0.11 a | 0.71 ± 0.01 e | 0.96 ± 0.030 d | 0.010 ± 0.001 X–Z | 0.010 ± 0 X–Z | |
| P1 | Zn control | 3.55 ± 0.12 XY | 4.63 ± 0.07 UV | 1.38 ± 0.01 TU | 1.52 ± 0.03 S | 0.04 ± 0.001 LM | 0.06 ± 0.01 H–J |
| Zn 20 mg/kg | 4.6 ± 0.1 UV | 6.75 ± 0.05 OP | 1.52 ± 0.10 S | 1.88 ± 0.03 Q | 0.063 ± 0.003 G–I | 0.084 ± 0.001 EF | |
| Zn 40 mg/kg | 4.24 ± 0.05 VW | 5.46 ± 0.11 R | 1.48 ± 0.01 ST | 1.72 ± 0.01 R | 0.017 ± 0.001 T–Y | 0.023 ± 0.001 Q–U | |
| Zn 60 mg/kg | 3.9 ± 0.1 WX | 5.10 ± 0.16 R–T | 1.32 ± 0.07 U–W | 1.42 ± 0.03 S–U | 0.011 ± 0 W–Z | 0.013 ± 0.002 V–Z | |
| Zn 80 mg/kg | 3.16 ± 0.15 TU | 4.72 ± 0.05 YZ | 1.22 ± 0.03 WX | 1.34 ± 0.01 U | 0.06 ± 0 G–I | 0.009 ± 0.001 YZ | |
| Zn 100 mg/kg | 2.96 ± 0.05 Z | 4.26 ± 0.15 VW | 1.16 ± 0.04 X–Z | 1.23 ± 0.01 V–X | 0.051 ± 0.002 JK | 0.008 ± 0 YZ | |
| Zn 120 mg/kg | 1.83 ± 0.15 bc | 3.16 ± 0.05 YZ | 1.06 ± 0.05 Za | 1.09 ± 0.01 YZ | 0.032 ± 0.003 M–R | 0.003 ± 0.001 Z | |
| P2 | Zn control | 9.8 ± 0.52 I | 11.20 ± 0.80 G | 2.66 ± 0.16 IJ | 2.81 ± 0.10 GH | 0.071 ± 0.001 G | 0.1 ± 0 D |
| Zn 20 mg/kg | 17.13 ± 0.11 C | 21.49 ± 0.429 A | 3.22 ± 0.08 C | 3.72 ± 0.07 A | 0.12 ± 0.01 C | 0.163 ± 0.02 A | |
| Zn 40 mg/kg | 12.2 ± 0.25 F | 18.23 ± 1 B | 3.06 ± 0.20 DE | 3.5 ± 0.09 B | 0.090 ± 0.001 D–F | 0.146 ± 0.02 A | |
| Zn 60 mg/kg | 8.3 ± 0.1 K | 10.4 ± 0.51 H | 2.98 ± 0.02 EF | 3.21 ± 0.06 C | 0.065 ± 0.004 GH | 0.083 ± 0.005 F | |
| Zn 80 mg/kg | 7.49 ± 0.45 LM | 8.86 ± 0.05 J | 2.85 ± 0.03 G | 3.15 ± 0.04 CD | 0056 ± 0.004 H–K | 0.063 ± 0.005 G–I | |
| Zn 100 mg/kg | 6.6 ± 0.1 OP | 7.26 ± 0.11 MN | 2.3 ± 0.13 N | 2.65 ± 0.05 IJ | 0.033 ± 0.002 M–P | 0.04 ± 0.002 M–O | |
| Zn 120 mg/kg | 4.94 ± 0.22 S–U | 5.96 ± 0.15 Q | 1.85 ± 0.06 Q | 2.22 ± 0.07 O | 0.022 ± 0.001 R–V | 0.033 ± 0.006 M-Q | |
| P3 | Zn control | 8.90 ± 0.10 J | 10.2 ± 0.1 HI | 2.54 ± 0.05 KL | 2.74 ± 0.02 HI | 0.041 ± 0.001 LM | 0.06 ± 0.003 H–J |
| Zn 20 mg/kg | 14.3 ± 0.20 E | 18.2 ± 0.1 B | 2.68 ± 0.09 I | 2.98 ± 0.01 EF | 0.051 ± 0.001 JK | 0.073 ± 0.003 G | |
| Zn 40 mg/kg | 10.3 ± 0.43 H | 15 ± 0.05 D | 2.72 ± 0.030 HI | 2.88 ± 0.01 FG | 0.040 ± 0.001 L–N | 0.05 ± 0.01 KL | |
| Zn 60 mg/kg | 7.33 ± 0.32 L–N | 8.33 ± 0.32 K | 2.44 ± 0.005 LM | 3.08 ± 0.07 DE | 0.035 ± 0.005 M–P | 0.040 ± 0.004 LM | |
| Zn 80 mg/kg | 6.5 ± 0.1 P | 7.7 ± 0.17 L | 2.38 ± 0.01 MN | 2.88 ± 0.01 FG | 0.030 ± 0.002 N–S | 0.037 ± 0.006 M–O | |
| Zn 100 mg/kg | 5.4 ± 0.26 R | 6.94 ± 0.06 NO | 2.04 ± 0.05 P | 2.56 ± 0.04 JK | 0.026 ± 0.002 P–T | 0.032 ± 0.003 M–R | |
| Zn 120 mg/kg | 3.16 ± 0.15 YZ | 5.26 ± 0.30 RS | 1.86 ± 0.02 Q | 2.06 ± 0.15 P | 0.012 ± 0.002 W–Z | 0.021 ± 0.001 S–W | |
| Zn (mg/kg) | Shoot P (mg/kg) | |||||||
|---|---|---|---|---|---|---|---|---|
| Pcontrol | P1 | P2 | P3 | |||||
| NM | AM | NM | AM | NM | AM | NM | AM | |
| Zn control | 543.2 ± 2.7 w | 981 ± 1 q | 1851 ± 5.2 i | 2107 ± 6 b | 4093 ± 6 U | 6120 ± 5 C | 5130 ± 10 H | 4213 ± 15 Q,R |
| Zn20 | 620.4 ± 0.5 u | 1356 ± 47 k | 2015.3 ± 4.5 f | 2259 ± 10 Y | 4114.8 ± 7.2 S | 6277 ± 2.7 A | 5419 ± 9 G | 4422 ± 2.5 N |
| Zn40 | 734.4 ± 4.9 r | 1273 ± 24 l | 2136 ± 3.6 a | 2173 ± 6.6 Z | 4197.6 ± 2.5 R | 6149 ± 11 B | 5549 ± 6 F | 4326 ± 15 O |
| Zn60 | 708.4 ± 7.1 s | 1213 ± 5.7 m | 2083 ± 8.8 c | 2136 ± 2.8 a | 4073.3 ± 9.4 T | 5816 ± 11 D | 5321 ± 11.5 H | 4264 ± 2.5 P |
| Zn80 | 643.3 ± 7.6 t | 1042 ± 7.5 o | 2008 ± 7.3 f,g | 2062 ± 0.0 d | 3965 ± 13.2 V | 5631 ± 10 E | 5263 ± 3.2 I | 4222 ± 7.5 Q |
| Zn100 | 590.9 ± 9.3 v | 1005 ± 6 p | 1972 ± 9.1 h | 2036 ± 10 e | 3932 ± 7.5 W | 5241 ± 27 J | 5193 ± 11.2 K | 4109 ± 10 S,T |
| Zn120 | 543.4 ± 3 w | 1139 ± 9.2 n | 1853.8 ± 5.4 j | 1994 ± 7.8 g | 3803 ± 6.5 X | 4511 ± 8.5 M | 5027 ± 4.9 L | 3980 ± 7.7 V |
| Root P (mg/kg) | ||||||||
| Zn control | 663.3 ± 8.3 t | 1636 ± 9.4 k | 1587 ± 6.5 l | 2632 ± 17.5 R | 2918 ± 17.5 N | 4762 ± 3 B | 3920 ± 20 K | 2729 ± 14 P,Q |
| Zn20 | 696.6 ± 6.1 s | 1806 ± 5.8 h | 1880 ± 16 g | 2746 ± 3.6 P | 2985 ± 3.6 M | 4788 ± 2.6 A | 4214 ± 2.6 G | 2807 ± 6 O |
| Zn40 | 810.6 ± 3.7 o | 1722 ± 2.5 i | 2240 ± 6.1 Y | 2518 ± 6.6 U | 2820 ± 6.6 O | 4614 ± 5.2 C | 4144 ± 5.2 H | 2717 ± 12 Q |
| Zn60 | 780.3 ± 2.5 p | 1645 ± 5.5 j | 2212 ± 2.6 Z | 2440 ± 1 W | 2615 ± 1 S | 4545 ± 9.8 D | 4004 ± 9.8 I | 2640 ± 7 R |
| Zn80 | 761.1 ± 4.5 q | 1643 ± 4.5 j,k | 2167 ± 12 b | 2188 ± 1.5 a | 2441 ± 1.5 W | 4477 ± 21 E | 3961 ± 7.8 J | 2540 ± 20 T |
| Zn100 | 747 ± 5 q,r | 1519 ± 3.2 m | 2104 ± 4.5 d | 1981 ± 4 f | 2355 ± 4 X | 4409 ± 8.3 F | 3908 ± 8.3 K | 2474 ± 9 V |
| Zn120 | 734 ± 0.5 r | 1487 ± 6.5 n | 2038 ± 25 e | 1877 ± 11 g | 2131 ± 11.3 c | 4206 ± 3.2 G | 3811 ± 9.2 L | 2254 ± 30 Y |
| Zn (mg/kg) | Shoot Zn (mg/kg) | |||||||
|---|---|---|---|---|---|---|---|---|
| P control | P1 | P2 | P3 | |||||
| NM | AM | NM | AM | NM | AM | NM | AM | |
| Zn control | 24.9 ± 1.1 d,e | 30.5 ± 1.5 b,c,d | 21.9 ± 0.4 e,f | 20.3 ± 0.6 e,f,g | 18.1 ± 0.1 f,g | 30.5 ± 1.8 b,c,d | 15.5 ± 0.4 g | 14.2 ± 0.7 g |
| Zn20 | 34.9 ± 1.7 Z,a,b | 42 ± 0.2 X,Y | 31.4 ± 0.5 X,Y | 34.9 ± 0.2 Z,a,b | 28 ± 1.4 c,d | 41.1 ± 1 X,Y | 25.1 ± 2.3 d,e | 38.2 ± 0.5 Y,Z,a |
| Zn40 | 46.1 ± 1 W,X | 49.2 ± 1.7 W | 43.1 ± 0.8 X,Y | 45.7 ± 0.6 W,X | 38.7 ± 3.3 Y,Z,a | 45 ± 0.2 W,X | 33.4 ± 0.5 a,b,c | 40.2 ± 0.6 X,Y,Z |
| Zn60 | 78.4 ± 1.5 S | 62.3 ± 0.8 U | 70.5 ± 2.7 T | 59.16 ± 0.7 U,V | 64.4 ± 4.8 U | 55.4 ± 2.2 V | 60.2 ± 3 U,V | 49.2 ± 1 W |
| Zn80 | 140.7 ± 5.1 L | 126.9 ± 1.1 M,N | 123.7 ± 1.5 N | 115.9 ± 3.6 O | 103.6 ± 2.6 P | 89.4 ± 2.1 Q,R | 92.2 ± 0.9 Q | 84 ± 2.3 R,S |
| Zn100 | 244.1 ± 1 C | 200.8 ± 3.1 F | 211.4 ± 5.6 E | 175.7 ± 5.5 H | 197 ± 7.8 F | 159.3 ± 2.3 I | 182.9 ± 6.3 G | 130.8 ± 2.8 M |
| Zn120 | 320.1 ± 10 A | 243.6 ± 10.7 C | 256 ± 5 B | 197.4 ± 7.7 F | 220.8 ± 10.5 D | 167.6 ± 2.5 J | 198.5 ± 3.7 F | 149.1 ± 3.7 K |
| Root Zn (mg/kg) | ||||||||
| Zn control | 46.03 ± 4.8 d,e,f | 55.3 ± 1.5 b–f | 42.8 ± 8.4 e,f | 50.5 ± 3.3 d,e,f | 43.1 ± 7.8 e,f | 53.1 ± 6 c–f | 49.5 ± 1.9 d,e,f | 41.3 ± 4.6 f |
| Zn20 | 76.8 ± 1.5 a–d | 83.9 ± 0.9 Z,a | 67.9 ± 4.2 a–e | 82.4 ± 4.8 Z,a | 69.8 ± 1.7 a–d | 80.5 ± 5.9 Z–c | 71.2 ± 1 a–d | 77.6 ± 8.7 a,b,c |
| Zn40 | 131.3 ± 2.9 X,Y | 140.4 ± 1.4 X | 123.3 ± 4.5 X,Y | 126.9 ± 7 X,Y | 140.6 ± 4.3 X | 120.9 ± 8.5 X,Y | 130.3 ± 3.8 X,Y | 106.2 ± 9.1 Y,Z |
| Zn60 | 620.5 ± 16.8 S | 570.2 ± 37 T | 610.7 ± 12.6 S | 519.5 ± 13.8 U | 527.7 ± 6.2 U | 489.6 ± 14.7 V | 534.4 ± 8 U | 420.9 ± 10.2 W |
| Zn80 | 1044.3 ± 28 J | 721.2 ± 29.7 PQ | 929.3 ± 7.2 L | 702.3 ± 15.4 Q,R | 879 ± 9.6 M | 685.3 ± 6.8 R | 756.5 ± 4.9 O | 611.8 ± 10.4 S |
| Zn100 | 1542.9 ± 56 E | 921.3 ± 26.8 L | 1442 ± 9.3 F | 888.5 ± 11.2 M | 1314.3 ± 12 G | 810.7 ± 10.7 N | 1281 ± 9.6 H | 729.3 ± 23 P |
| Zn120 | 1879.9 ± 22.7 A | 1099.9 ± 30.7 I | 1802.6 ± 20.5 B | 1040.9 ± 31.8 J | 1620.3 ± 4.5 C | 979.6 ± 15.3 K | 1580.3 ± 13.4 D | 932.1 ± 26.7 L |
Publisher’s Note: MDPI stays neutral with regard to jurisdictional claims in published maps and institutional affiliations. |
© 2021 by the authors. Licensee MDPI, Basel, Switzerland. This article is an open access article distributed under the terms and conditions of the Creative Commons Attribution (CC BY) license (https://creativecommons.org/licenses/by/4.0/).
Share and Cite
Saboor, A.; Ali, M.A.; Husain, S.; Tahir, M.S.; Irfan, M.; Bilal, M.; Baig, K.S.; Datta, R.; Ahmed, N.; Danish, S.; et al. Regulation of Phosphorus and Zinc Uptake in Relation to Arbuscular Mycorrhizal Fungi for Better Maize Growth. Agronomy 2021, 11, 2322. https://doi.org/10.3390/agronomy11112322
Saboor A, Ali MA, Husain S, Tahir MS, Irfan M, Bilal M, Baig KS, Datta R, Ahmed N, Danish S, et al. Regulation of Phosphorus and Zinc Uptake in Relation to Arbuscular Mycorrhizal Fungi for Better Maize Growth. Agronomy. 2021; 11(11):2322. https://doi.org/10.3390/agronomy11112322
Chicago/Turabian StyleSaboor, Abdul, Muhammad Arif Ali, Shabir Husain, Muhammad Saeed Tahir, Muhammad Irfan, Muhammad Bilal, Khurram Shehzad Baig, Rahul Datta, Niaz Ahmed, Subhan Danish, and et al. 2021. "Regulation of Phosphorus and Zinc Uptake in Relation to Arbuscular Mycorrhizal Fungi for Better Maize Growth" Agronomy 11, no. 11: 2322. https://doi.org/10.3390/agronomy11112322
APA StyleSaboor, A., Ali, M. A., Husain, S., Tahir, M. S., Irfan, M., Bilal, M., Baig, K. S., Datta, R., Ahmed, N., Danish, S., & Glick, B. R. (2021). Regulation of Phosphorus and Zinc Uptake in Relation to Arbuscular Mycorrhizal Fungi for Better Maize Growth. Agronomy, 11(11), 2322. https://doi.org/10.3390/agronomy11112322