Next Article in Journal
Chemical Components and Biological Activities of Essential Oils of Mentha × piperita L. from Field-Grown and Field-Acclimated after In Vitro Propagation Plants
Previous Article in Journal
Response of Pear Trees’ (Pyrus bretschneideri ‘Sinkiangensis’) Fine Roots to a Soil Water Regime of Regulated Deficit Irrigation
Previous Article in Special Issue
Potato Tuber Shape Phenotyping Using RGB Imaging
 
 
Order Article Reprints
Article

Kompetitive Allele Specific PCR (KASP) Markers for Potato: An Effective Tool for Increased Genetic Gains

International Potato Center, Avenida La Molina 1895, Lima 15026, Peru
*
Authors to whom correspondence should be addressed.
Agronomy 2021, 11(11), 2315; https://doi.org/10.3390/agronomy11112315
Received: 1 October 2021 / Revised: 4 November 2021 / Accepted: 12 November 2021 / Published: 16 November 2021
(This article belongs to the Special Issue Phenomic and Genomic Tools for the Enhancement of Vegetable Crops)

Abstract

:
Potato virus Y (PVY) and Phytophthora infestans (Mont.) de Bary that causes potato late blight (LB), pose serious constraints to cultivated potatoes due to significant yield reduction, and phenotyping for resistance remains challenging. Breeding operations for vegetatively propagated crops can lead to genotype mislabeling that, in turn, reduces genetic gains. Low-density and low-cost molecular marker assessment for phenotype prediction and quality control is a viable option for breeding programs. Here, we report on the development of kompetitive allele specific PCR (KASP) markers for LB and PVY resistance, and for routine quality control assessment of different breeding populations. Two KASP markers for LB resistance and two for PVY Ryadg were validated with an estimated assay power that ranged between 0.65 and 0.88. The developed QC KASP markers demonstrated the capability of discriminating tetraploid calls in breeding materials, including full-sibs and half-sibs. Routine implementation of the developed markers in a breeding program would assist with better allocation of resources and enable precise characterization of breeding material, thereby leading to increased genetic gains.

1. Introduction

Vegetatively propagated, cultivated potato (Solanum tuberosum L.) is an autotetraploid crop (2n = 4x = 48), which leads to high levels of genetic heterogeneity and increases the complexity of genomic studies and breeding [1]. Phenotypic evaluations of several disease-related traits are challenging, costly, and depend heavily on the environmental conditions in test sites.
Tetraploid potato recurrent selection, as applied at the International Potato Center (CIP) breeding programs, consists of creating variability from parents with known breeding values and selecting for traits of interest (including disease resistance, yield, tuber quality traits, and environmental adaptation) through various selection stages [2]. Hence, heterozygous individuals are multiplied and tested through several stages in different environmental conditions depending on the breeding stage, with the aim of identifying parents for the next recurrent selection cycle, advanced clones for material sharing, and promising clones for variety release. Therefore, clones evaluated in advanced and multi-environment trials are expected to be no different from those in early observational trials. Tubers from field trials are generally not used as seeds to prevent the spread of viral diseases; therefore, tuber multiplication is conducted in parallel with field trials, and tuber seeds of the breeding populations are maintained in controlled environments. However, this process can increase the odds of genotype mislabeling and sampling errors occurring throughout the breeding cycle and across environments in the same breeding stage. Such mistakes lead to a waste of time and resources in addition to a reduction in achieved genetic gains because of low selection accuracy during the breeding cycle. Therefore, quality control (QC) analysis is essential to ensure the traceability and identification of clones at key stages during the breeding process (e.g., identity control and hybrid purity), during conservation in the germplasm bank, and when sharing breeding materials. QC analysis refers to the process of identifying the mistakes or errors in the quality of breeding lines, germplasm accession, variety, or any other products throughout the breeding pipeline [3].
The oomycete Phytophthora infestans (Mont.) de Bary, which causes potato late blight (LB), and potato virus Y (PVY), a member of the genus Potyvirus, are two of the most important potato pathogens worldwide and, if not controlled, can damage entire plants and cause yield reductions of up to 80% [4,5,6]. The incidence of these two diseases has increased due to several factors, including climate variations, inadequate crop management, the strain and pressure of the pathogen, and the use of nonresistant varieties [7,8,9]. Resistance to late blight and PVY is controlled by several genes, and the development of molecular markers [10,11] has resulted in accelerated breeding cycles and a reduction in operational costs. Recently, the use of molecular markers for selecting resistant clones has attracted more interest from breeders and producers. The varietal resistance approach is of utmost importance for smallholder farmers and the environment, given the lack of information on the pathogen, the stringent crop management requirements (e.g., clean seeds and crop rotation), and the cost and unsustainable nature of chemical control [12,13,14].
Ryadg, Rysto, and Rychc were identified as PVY strain nonspecific resistance (R) genes derived from S. tuberosum subsp. andigena, S. stoloniferum, and S. chacoense, respectively. These genes confer an extreme resistance phenotype to all PVY strains. Several markers linked with various Ry genes and allele-dosage assays have been developed and validated for identifying multiplex Ry progenitors and breeding lines with resistance to PVY. The sequence-characterized amplified region (SCAR) marker RYSC3 has been developed for Ryadg on chromosome 11 [15]. Further, linked amplified fragment length polymorphism (AFLP) markers (M5, M6, M17, M33, M35, and M45) and one restriction fragment length polymorphism (RFLP) marker (GP259) were identified in different segregating populations [16]. RYSC3, M6, and M45 DNA markers flanking the Ryadg gene were multiplexed and validated on the CIP germplasm and breeding stocks [17]. YES3-3A and YES3-3B for Rysto were mapped on chromosome 12 [18], and sequence-tagged site markers have been developed and validated on cultivars and breeding clones and segregating populations [19]. The introgression of Ry genes into potato germplasm has enabled the identification and selection of potato clones with extreme resistance against PVY, thereby reducing the cost and improving the accuracy of screening for resistant material [20,21,22].
LB resistance in potato is controlled by several R genes originating from wild potato species, for example, S. demissum, S. stoloniferum, S. albornozii, S. trifidum, and the cultivated S. tuberosum groups Andigena and Phureja [23,24,25]. Research efforts to identify several R genes were reviewed in [26] and several molecular markers have been developed for characterizing breeding material. While single R gene resistance can be rapidly overcome by pathogen evolution, the presence of several R genes could possibly favor quantitative late blight resistance in potato [27]. The development of molecular markers has recently enabled stacking such resistance genes into elite backgrounds and pre-breeding lines in tetraploid potato [28,29] and accelerated their introgression into breeding lines.
The development of molecular markers for applied potato breeding is evolving rapidly [30] with the availability of a potato reference genome [31,32,33,34] and the development of recent sequencing technologies. Thus, the cost/efficiency ratio for the same number of datapoints and the laboratory workload, flexibility, data quality, and bioinformatics required to characterize the breeding material [35] are the key factors to consider when planning long-term and effective use of low-density markers.
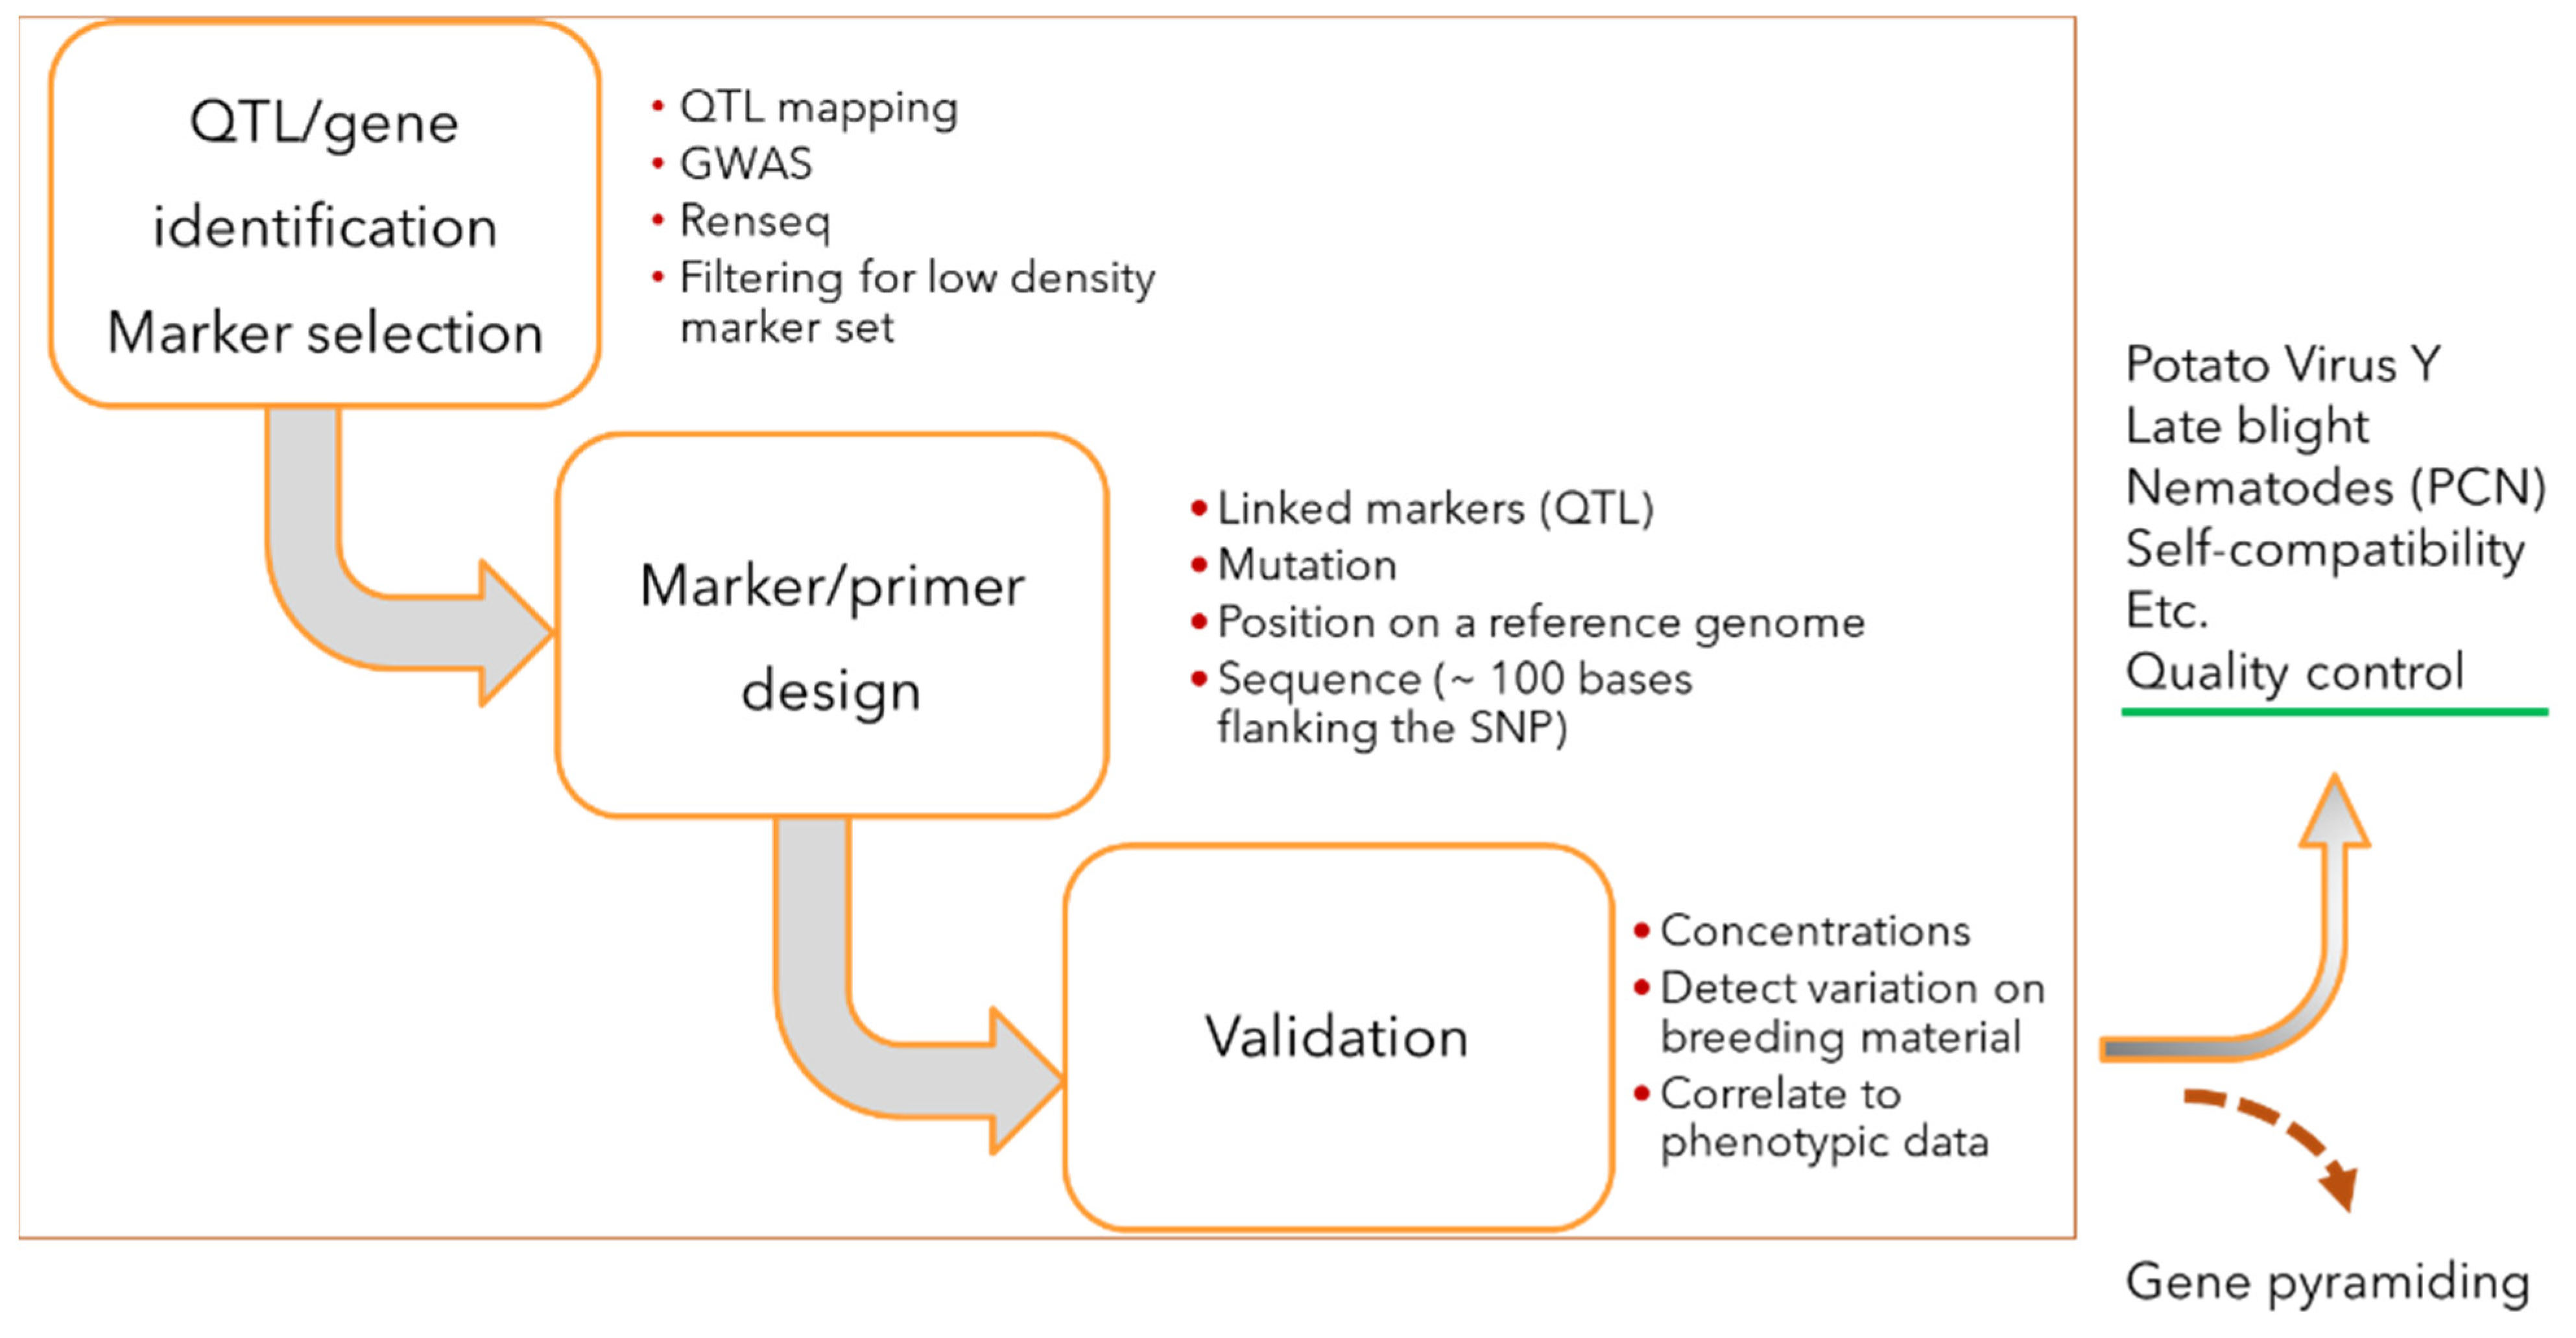
Kompetitive allele specific polymerase chain reaction (KASP) is a simplified fluorescence-based methodology for single nucleotide polymorphism (SNP) or insertion/deletion (indel) genotyping assays in which the DNA sample is amplified using a thermal cycler and allele-specific primers [36,37] (www.biosearchtech.com, accessed on 10 September 2021). KASP markers enable bi-allelic scoring at a specific locus and offer extremely high levels of robustness and precision at a relatively low cost. Whether the loci are identified from association analysis, resistance gene enrichment sequencing, or simple selection from SNP markers, KASP markers can be developed provided the flanking bases/sequences are available (Figure 1). The required process and bioinformatics needed to develop KASP markers and to analyze the output data are less demanding as compared with the previously developed trait markers for potato [11,20]. Further advantages over gel-based assays, such as SCAR or single sequence repeat (SSR), include significantly faster analysis and lower cost and workload since the separation through a gel matrix is not needed. KASP markers were developed from previous efforts on PVY, Ryadg [17], Rysto [19], and late blight [38,39].
Developed KASP markers are now routinely used in the CIP breeding programs for characterizing breeding material with respect to these important diseases affecting potato cultivation. Due to their discriminatory ability, SNP markers are ideal for developing low-cost QC KASP marker sets. Discrimination of breeding material is possible using a relatively small set of appropriately selected SNP markers. Our objective is to report on the development and use of KASP markers for LB and Ryadg resistance and QC analysis for CIP breeding programs.

2. Materials and Methods

2.1. Trait KASP Marker Development

The M6 marker allele sequences representing resistant and susceptible alleles, previously described by [17], were aligned for SNP identification to develop markers linked to the Ryadg gene. In total, 9 SNP or indels were selected for KASP marker design, and the amplification results were compared with a high-resolution melting (HRM) assay using probe M6P2 [17] on a quality evaluation set of 72 tetraploid potato genotypes from the CIP breeding program. The late blight markers were selected from previous association studies using genotyping by sequencing (GBS) [38] or SolCAP [39] markers, and the KASP results were compared with the original marker scores using a set of 73 and 78 tetraploid potato clones from the CIP breeding program, respectively. Validated SNP markers in the late blight resistance locus on chromosome 9 and in the Ryadg M6 resistance locus on chromosome 11 were converted into KASP markers by LGC, BioSearch Technologies (https://www.biosearchtech.com/, accessed on 10 September 2021) and analyzed by Intertek® (https://www.intertek.com/agriculture/agritech/, accessed on 21 July 2020).

2.2. Assay Verification and Routine Analysis

Assay verification was conducted using a set of 78 advanced tetraploid clones (S1) from the CIP breeding program with known resistance to PVY [40] and late blight [41]. The potato clones originated from the CIP breeding populations A (1 clone), B3 (7 clones), BW (3 clones), and LTVR (67 clones) (Supplementary Table S1 and S2). A detailed description of the CIP potato breeding populations is available in [38]. Assay verification of the PVY markers, snpST0052 and snpST00073, was conducted by comparing the 78 available PVY resistance phenotypes, for which results of enzyme-linked immunosorbent assay (ELISA) tests have previously been recorded as part of the breeding program, with their corresponding genotypes. Clones were classified into five categories: extremely resistant, resistant, hypersensitive, susceptible, and highly susceptible. For the verification calculations, the three first phenotypic categories are treated as resistant to PVY and the two last categories are considered to be susceptible. There were three possible categories for the markers snpST0052 and snpST0073: AA, AG, and GG, where A and G are the dominant favorable alleles linked to the resistance phenotype for snpST0052 and snpST0073, respectively.
Assay verification was similarly conducted for the LB markers snpST0020 and snpST0023 by comparing resistance phenotypes recorded in Peru and their respective genotypes. The LB phenotypic data were available for all S1 samples. Clones were classified into seven categories: extremely resistant, highly resistant, resistant, moderately resistant, moderately susceptible, susceptible, and highly susceptible. For the verification calculations, the three first categories are considered to be resistant to late blight and the remaining categories are considered to be susceptible. There were three possible categories for each of the tested markers, i.e., snpST0020: CC, CA, and AA and snpST0023: TT, TG, and GG, where C and G are the favorable alleles linked to the resistance phenotype for snpST0020 and snpST0023, respectively.
The numbers of resistant and susceptible potato clones in S1 were counted in each marker category. The false positive (α), and false negative (β) rates, as well as the assay power (s), were determined as follows: α = FP/(FP + TN); β = FN/(FN + TP), and s = 1 − β, where FP is a false positive, FN is a false negative, TN is a true negative, and TP is a true positive.
Furthermore, samples of 59 clones from the late blight heat tolerant (LBHT) [42] and the LBHT × LTVR (LTVR = lowland tropics virus resistance) [2] breeding populations (S2) were tested using validated KASP makers for resistance to late blight and PVY (Table 1). The genotypic data of the 59 clones were compared with previously recorded LB phenotypic data from field trials in Oxapampa (high late blight pressure environment) between 2012 and 2018.

2.3. QC Marker Selection Pipeline

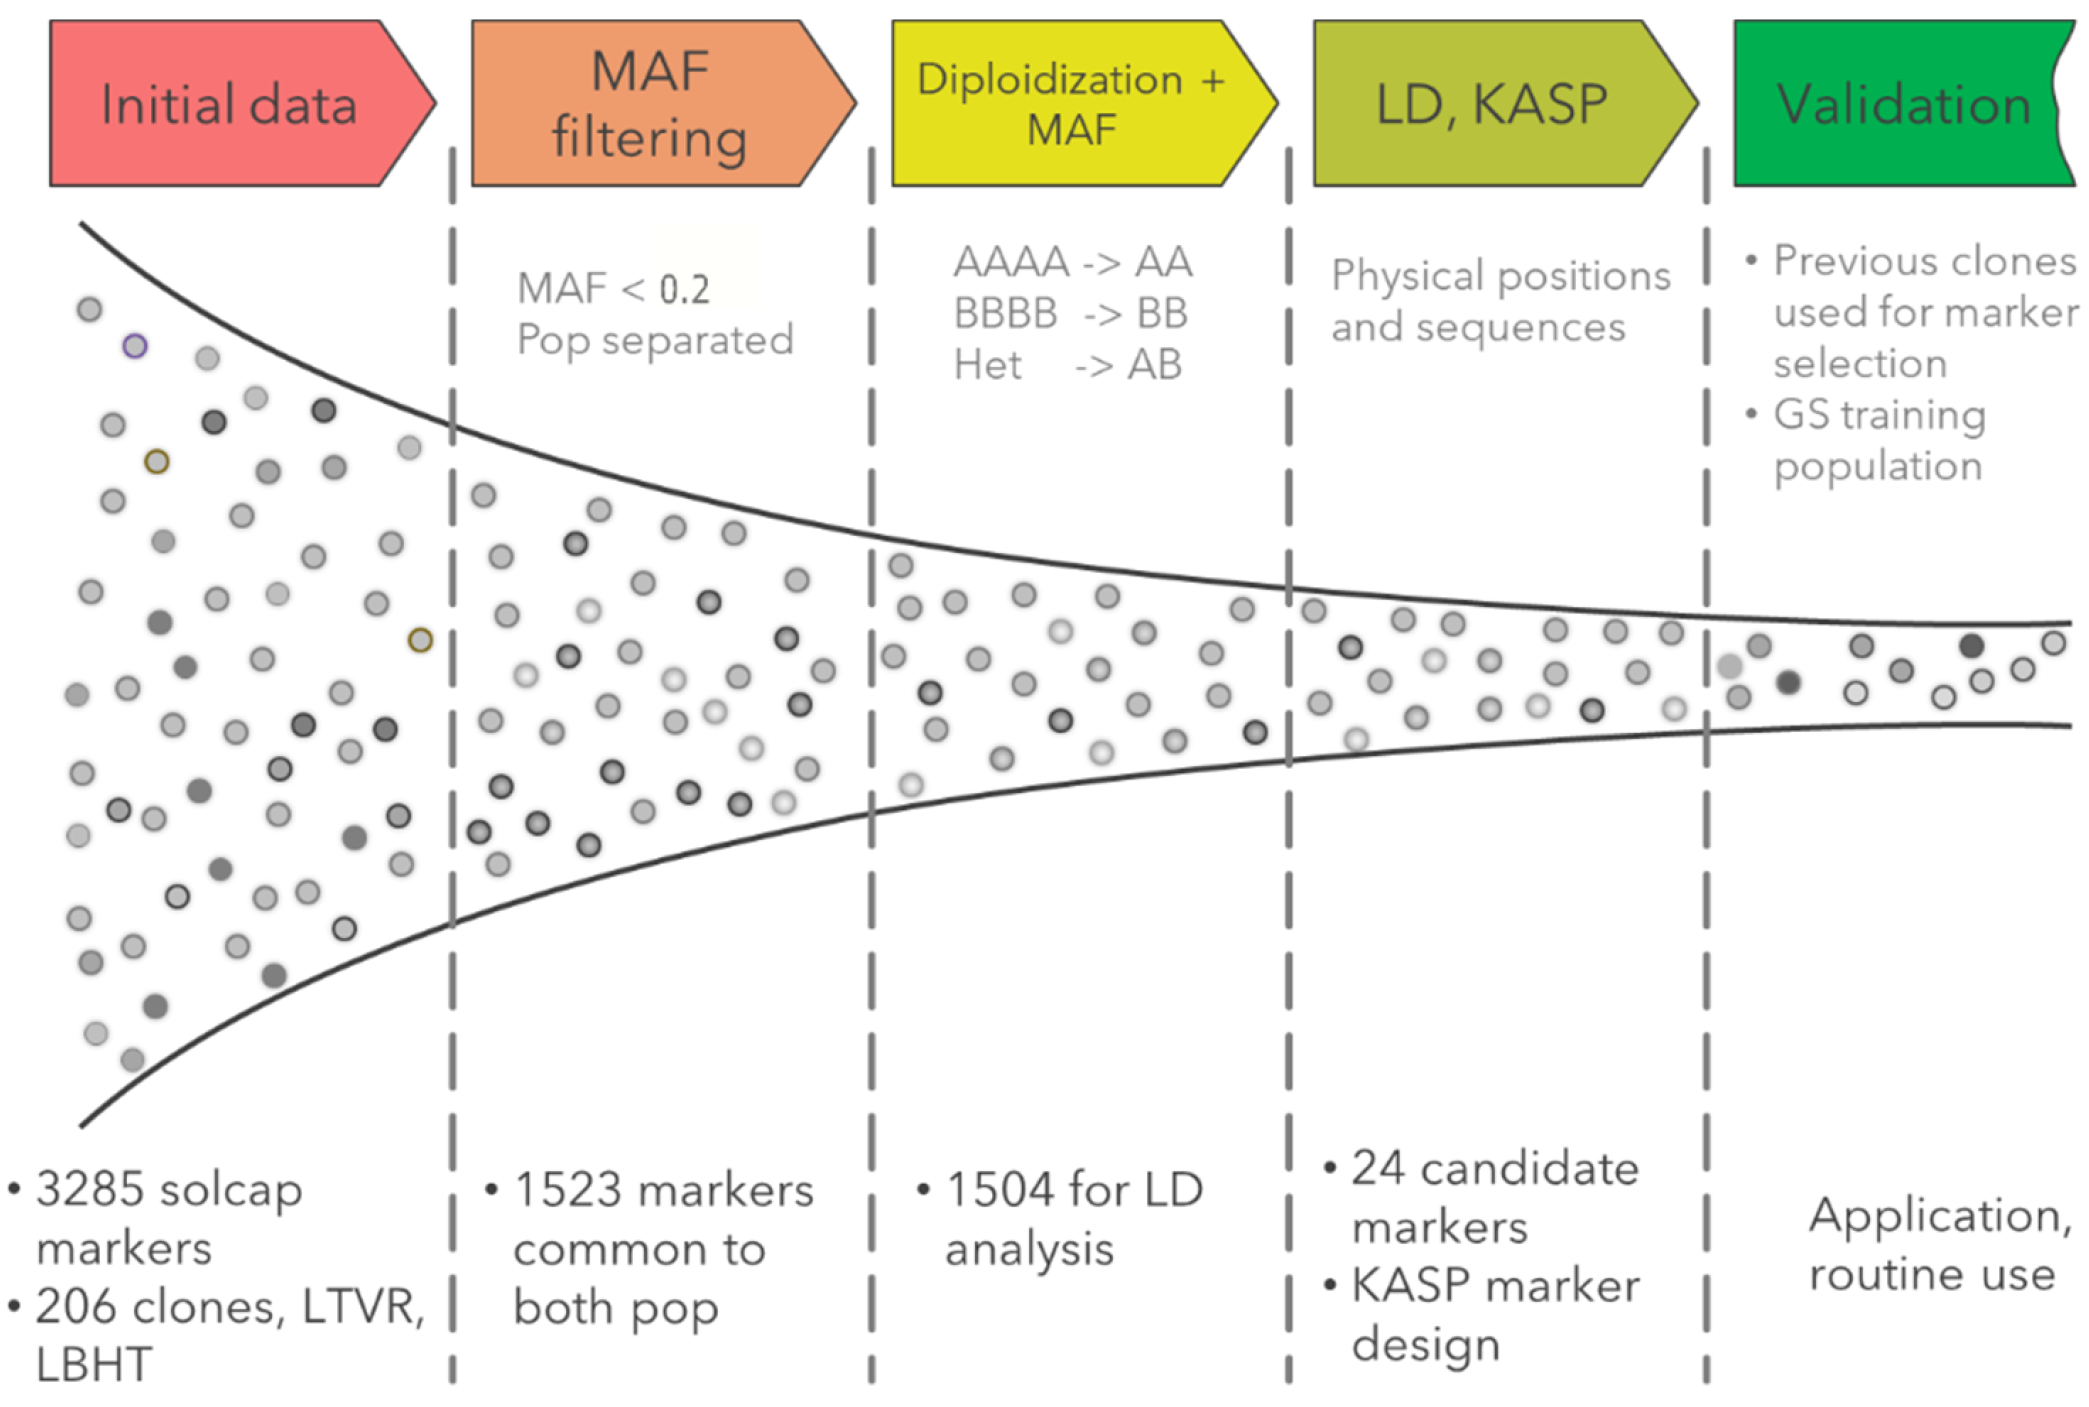
The 8303 SNP SolCAP Infinium array [43] was used to genotype 206 clones from two CIP breeding populations, i.e., B3 [44] and LTVR [2]. Marker selection from the 3285 markers with no missing data is summarized in Figure 2. Markers with a minor allele frequency (MAF) < 0.2 were separately removed from both populations, and only the 1523 markers in both populations were considered for further steps.
Low sequencing depth in next-generation sequencing methods can lead to an overestimation of homozygous calls and, therefore, to an underestimation of heterozygosity, in addition to genotyping errors and frequently missed data that, in turn, can lead to biases in subsequent population genetic analyses [3,45,46,47]. Therefore, for further analyses, the markers were reduced to their diploid form (AAAA = AA, BBBB = BB, heterozygous (AAAB, AABB, and ABBB) = AB) to reduce heterozygous dosage bias. Further MAF filtering was performed at the diploid level, with 19 markers with MAF < 0.2 removed. Physical positions and the allele variants (DM v03) of the 1504 remaining markers were retrieved from the SolCAP database (http://solanaceae.plantbiology.msu.edu/, accessed on 23 January 2020). The linkage disequilibrium (LD) between markers on each separate chromosome and for each population was separately computed using the R package “genetics” [48]. Finally, two markers on each chromosome that had the lowest median LD (either in both populations or in one population) and lay in different linkage blocks were selected for KASP SNP Genotyping (Intertek®). The 21 validated QC markers are available at the Excellence in Breeding webpage (https://excellenceinbreeding.org/module3/kasp, accessed on 26 September 2021).

2.4. Routine Analysis with QC KASP Markers

2.4.1. Study Design

QC marker assessment was conducted on a subset of the LBHT population (second cycle of recurrent selection). Samples from field trials were taken at two different stages of the breeding cycle. The preliminary trial consisted of about 2500 clones, selected from the greenhouse observational evaluation of the first clonal generation, and evaluated in Oxapampa in 2019. The intermediate trials with 500 clones selected from Oxapampa were planted, in 2020, at 3 locations, i.e., Huanuco, Huancayo, and Oxapampa, with two replications per location. A safeguard copy of all clones evaluated in the fields was maintained at the La Molina research station by the breeder; therefore, these genotypes are considered to be the reference for any breeding material identity verification.
The 114 clones sampled from the Huancayo intermediate trial (Hyo) were randomly selected from the 500 tested clones. Samples in Hyo (for a total of 224 samples) were taken from the first replication (r1, one single sample of 96 different clones) and the second replication (r2, 77 of the 96 r1 samples). Additionally, three samples (a, b, and c) of 17 clones were taken in 17 random plots of the first replication, in Hyo, to assess potential within plot variations. The 34 clones sampled from the Oxapampa preliminary trial were randomly selected from the 114 Hyo-sampled clones. As a reference for the 114 sampled clones in the field experiments, each of the 114 clones was sampled from the La Molina safeguard in 2020 (Table 2).
The samples were collected from young leaves and desiccated in silica gel before storage. Hence, the 376 samples were prepared at once for the 21 QC KASP marker assessment. The DNA extraction and marker analysis were performed by Intertek®.

2.4.2. QC Data Analysis

The snpST00174 marker was removed from the following analysis because it had a high number of missing genotypes (over 75%). Tetraploid allele dosage calling was performed from raw intensity data using the R [49] package fitTetra [50]. To evaluate the discriminatory effectiveness of the developed markers on the breeding material, dendrograms using diploid and tetraploid genotypes were generated from the 114 reference samples with neighbor joining for clustering [51]. Samples with more than 50% missing data (10 out of 20 markers) and markers with more than 30% missing data were filtered out and excluded from the QC analysis. For each clone, the genetic distance between test samples and the greenhouse reference samples was calculated using ape package [51]. Samples were considered to be different when their genetic difference from the reference was higher than the arbitrary 10% (~2 markers).

3. Results

3.1. Trait Markers for Late Blight and PVY Resistance

Selected Markers and KASP Assay Verification
The two KASP markers for PVY resistance, i.e., snpST0052 and snpST0073, show 100% concordance with the M6P2 HRM assay (Table 3). Interestingly, the snpST0050 marker that is diagnostic for the same SNP as M6P2 shows relatively lower concordance. The genotypic analysis of 78 clones in S1 with the PVY resistance markers snpST0052 and snpST0073 classified 62 clones as resistant and 16 clones as susceptible to PVY (Supplementary Table S1). The very low type I error and relatively high assay power (s = 0.83), based on the count of clones of S1 with the three different marker genotypes and their PVY resistance phenotypes (Table 4), suggest that the PVY markers snpST0052 and snpST0073 are excellent markers for MAS in CIP potato breeding programs. An SNP marker for Ryadg was recently developed and found to perform more accurately than all previously used Ry markers in an Australian potato breeding germplasm [52]. A direct comparison with our assay is not straightforward, since the false positive, false negative, and assay power were not reported. Although the SNP markers from M6 were not reported in [52], they yielded a strong assay power when validated with our material. Since M45 is physically closer to the Ry locus than M6, it can be expected to explain more phenotypic variation. It would be worthwhile evaluating the performance of the KASP markers based on SNP3279 on the CIP germplasm to assess its informativeness and possible use in the breeding program.
Eight of the eleven tested markers for late blight resistance showed over 90% concordance between the original marker score and the KASP marker score (Table 3). The two best markers, snpST0020 and snpST0023, were selected as markers for routine genotyping. The snpST0020 marker appears to be much better suited for the used gene pool compared with snpST0023. The assay efficiency for snpST0023 based on the number of potato clones with three different marker genotypes and their LB resistance phenotypes (Table 4) indicate the poor performance of this marker in the tested material. When used for different sets of breeding germplasm, the original markers that were converted into the KASP assay were found to be significantly associated with LB resistance. The snpST0023 marker, originally found when utilizing the B3 population [39], was represented by only seven samples in the validation panel (Supplementary Table S2), while the snpST0020 marker was discovered using a larger diversity panel that included both B3 and LTVR populations [38].

3.2. Markers Tested on Two Different Breeding Populations

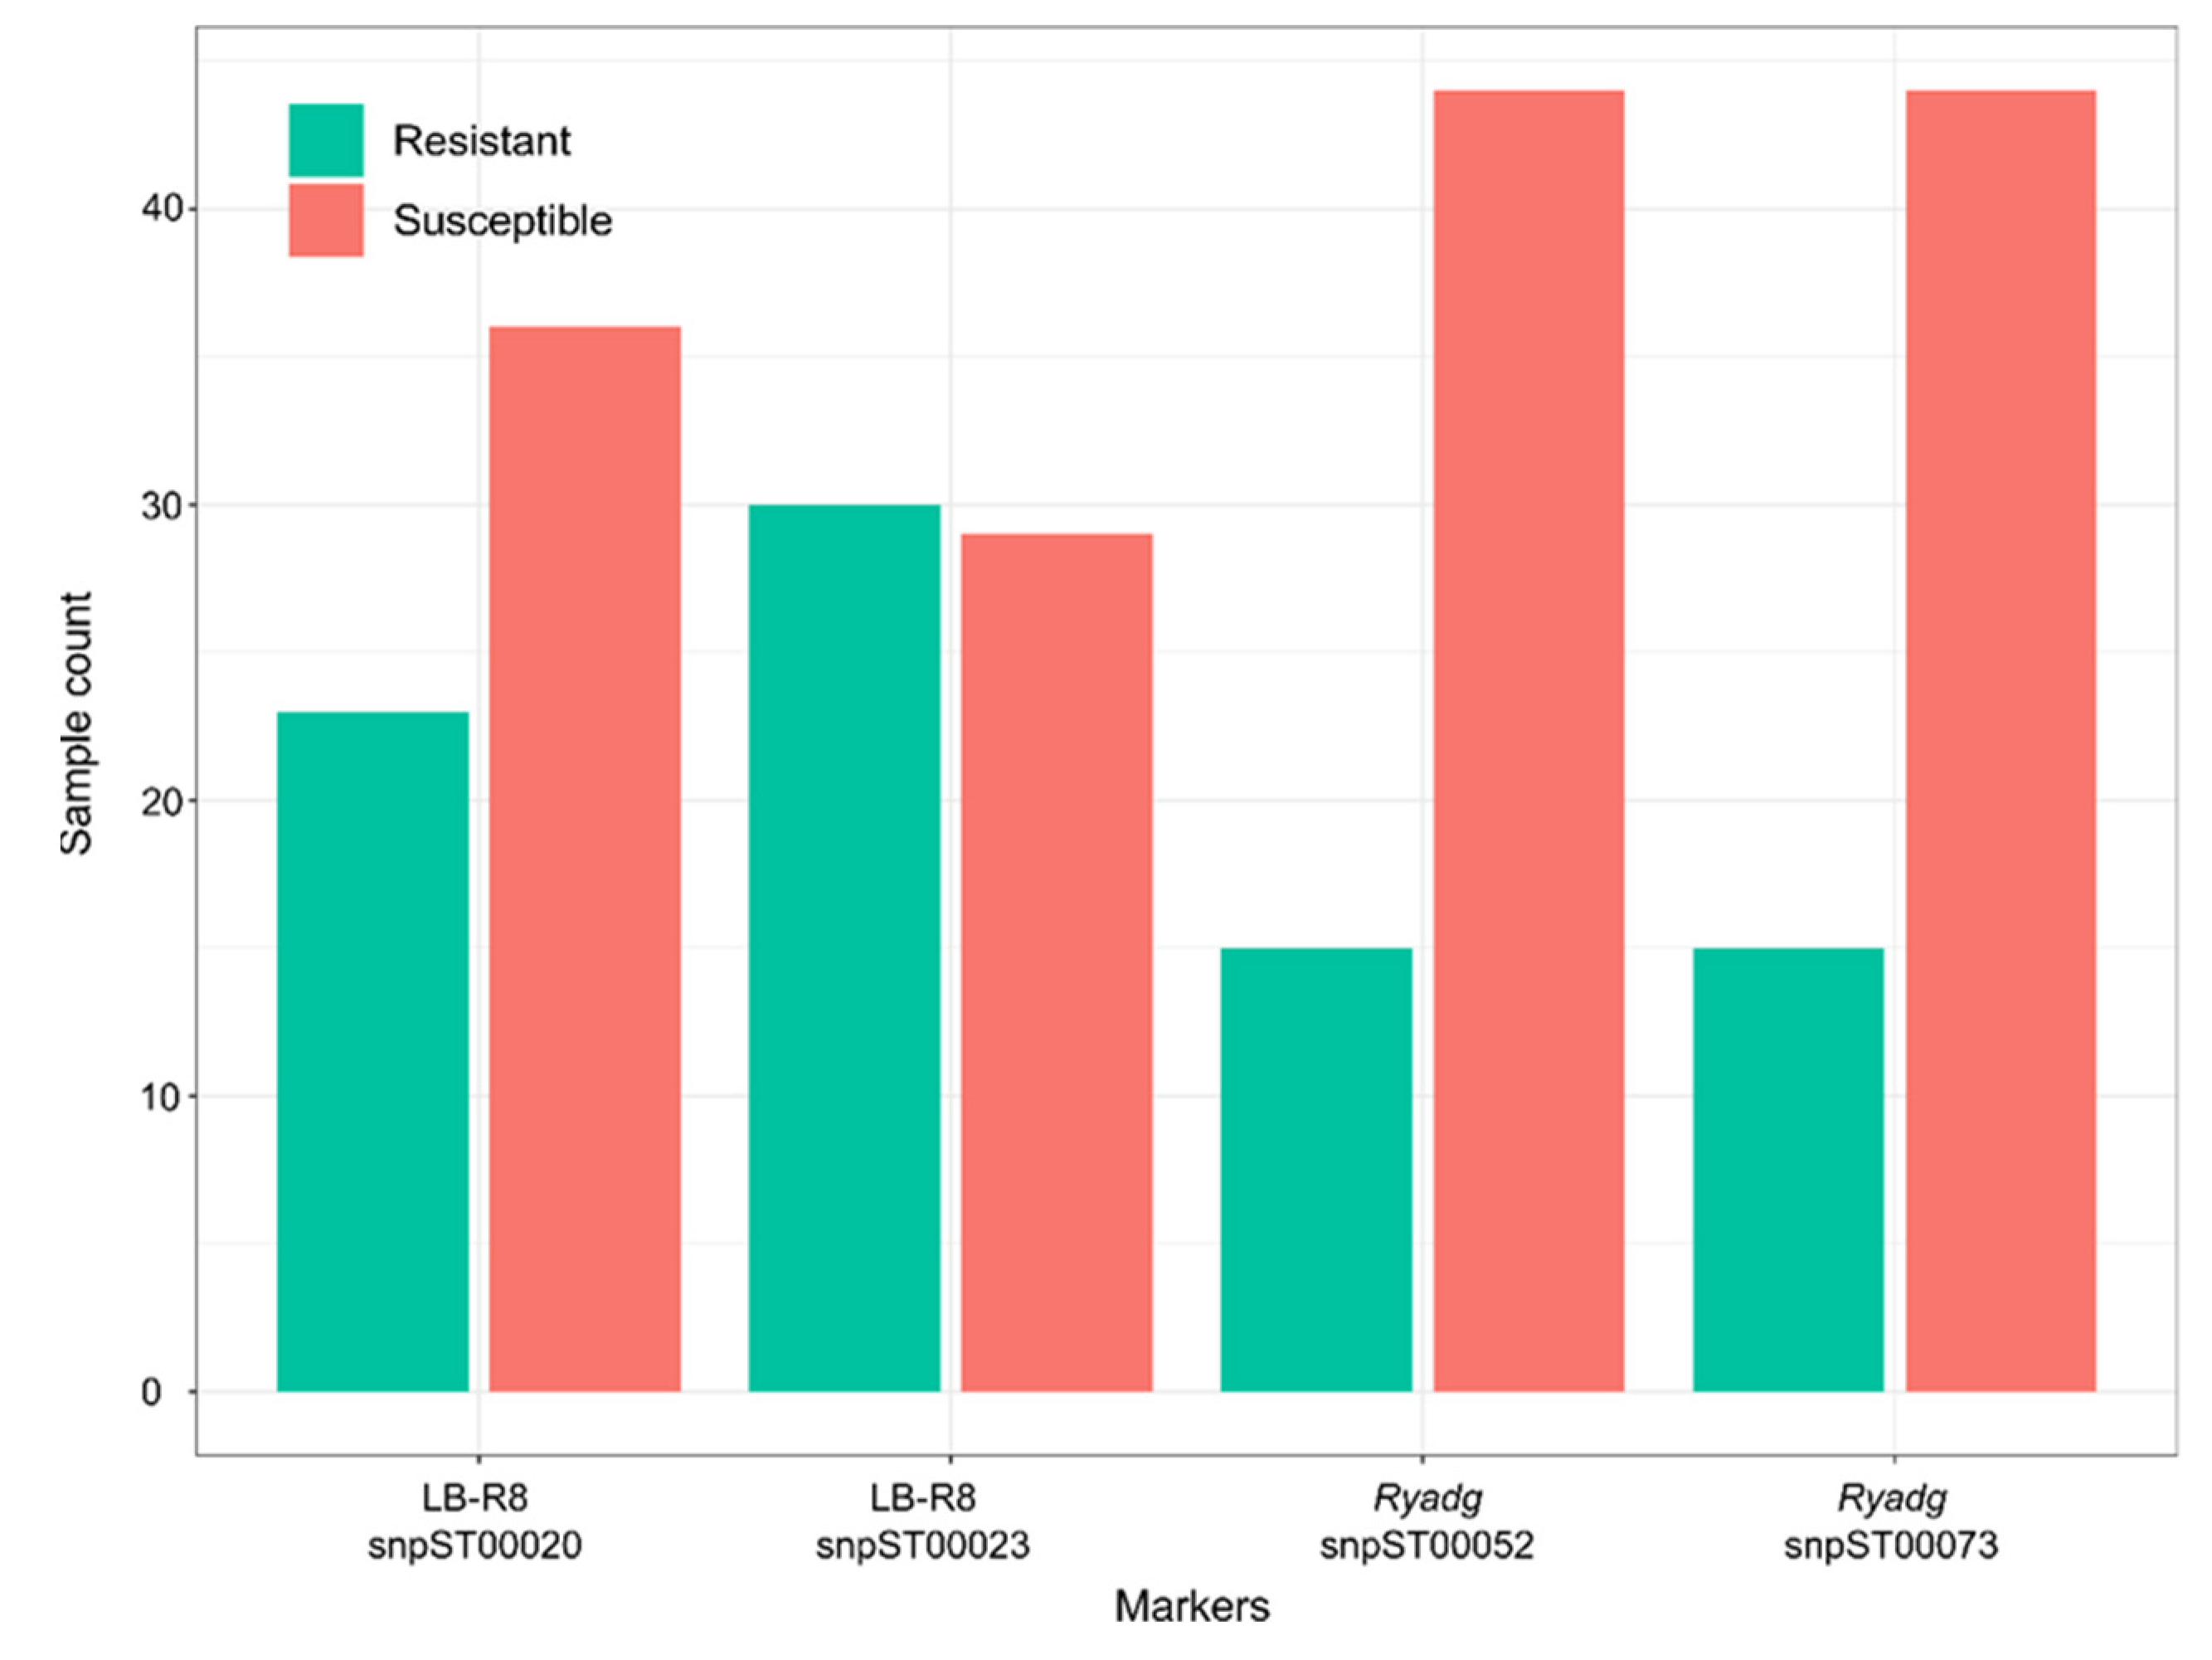
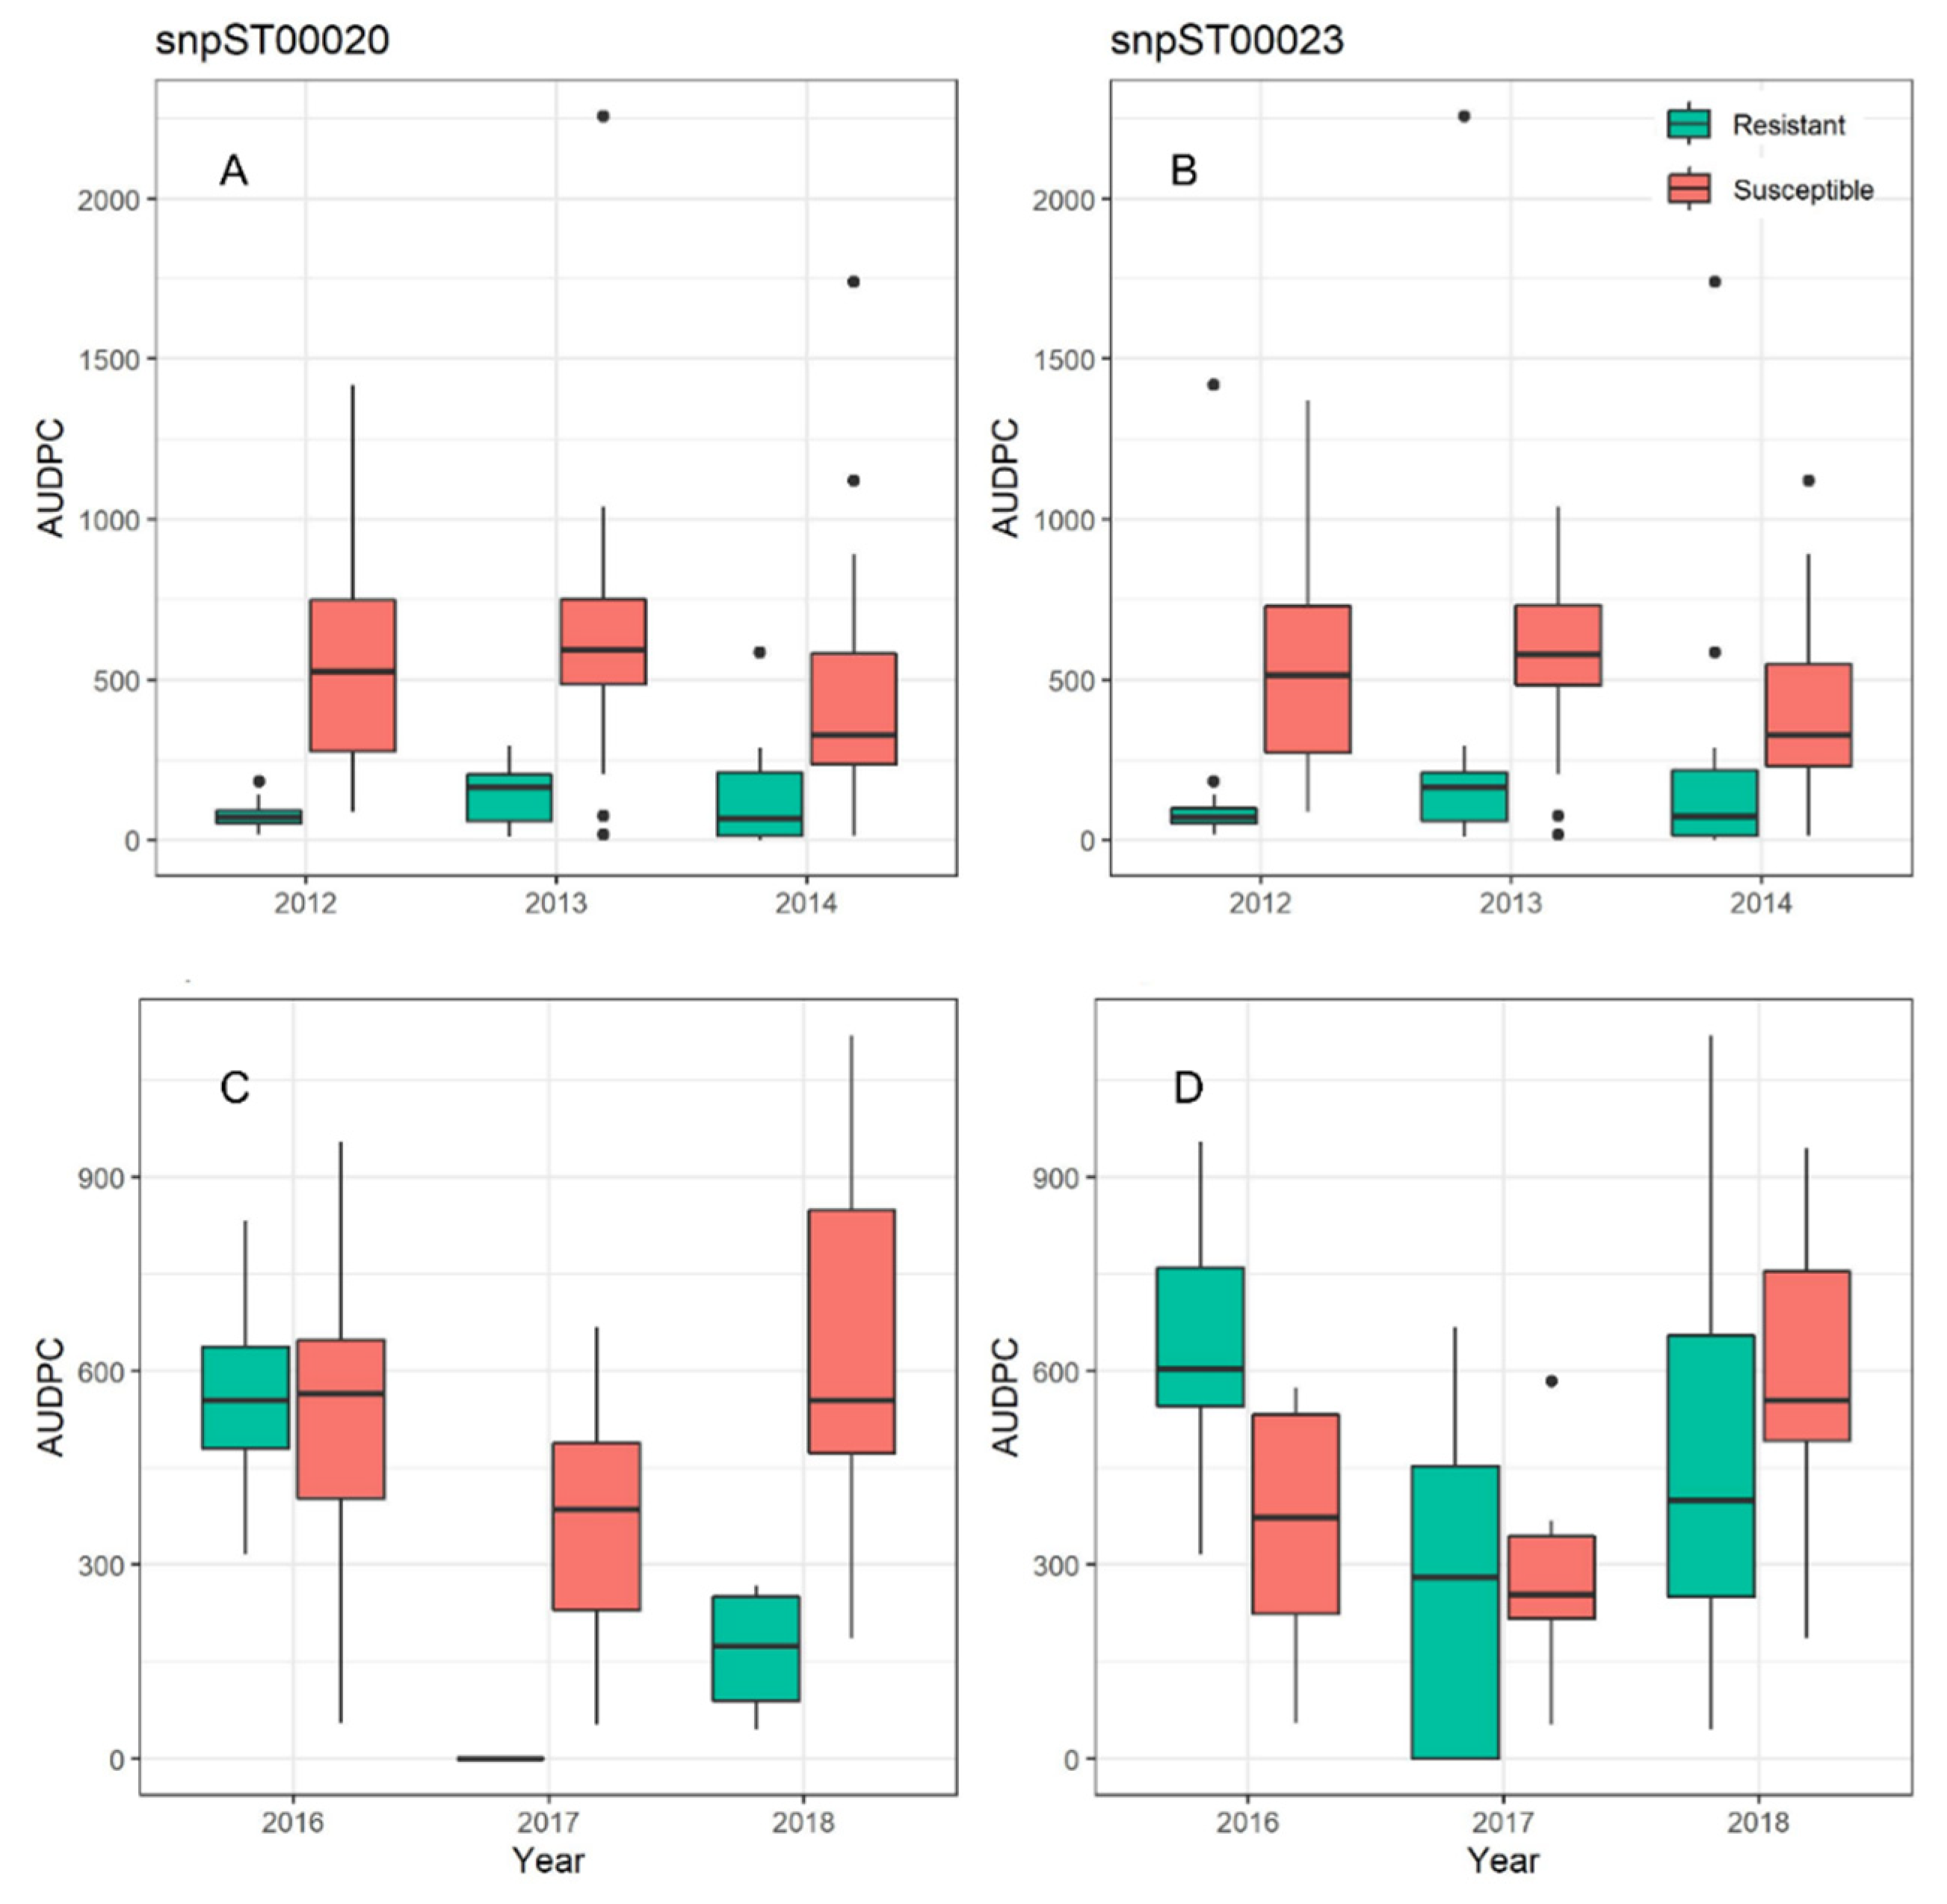
We found resistant clones to LB and PVY in both LBHT and LBHT × LTVR S2 samples (Figure 3). In both populations, 23 clones had the late blight resistance genotype with snpST0020 and snpST0023. Six of the seven genotypes with only the snpST0023 resistance allele were from the LBHT × LTVR population. Likewise, 15 of 59 clones showed resistance with both Ryadg markers. The poor correspondence between LB marker assessment and the phenotypes of the S2 samples from the LBHT × LTVR population (Figure 4) may be due to recombination between the markers and the resistance gene or bias when the phenotypic evaluation was conducted in the greenhouse.
These two LB markers have a physical distance of approximately 1 Mb in the potato DM_v6.1 reference genome, while the two Ryadg markers are separated by 106 bases along chromosome 11 (Table 1). The LB markers are tightly linked in the CIP B3 population, as they are always found together in the resistant genotypes (in S1 samples). In the LTVR population, however, there is recombination between the markers, and only snpST0020 is significantly associated with late blight resistance in this population. Screenhouse experiments are labor demanding and costly, and field evaluations heavily dependent on environmental conditions at the testing sites, which are often erratic [53,54]. These molecular markers will allow precise and cost-effective characterization of breeding material for PVY and late blight as compared with phenotypic evaluations. However, the genetic distance between the used markers and LB and PVY genes defines the accuracy of marker-assisted selection. The suitability of LB markers for each breeding population must be assessed, particularly when there is recombination between the two resistance alleles.

3.3. Tetraploid Calls Enhance QC Marker Efficiency

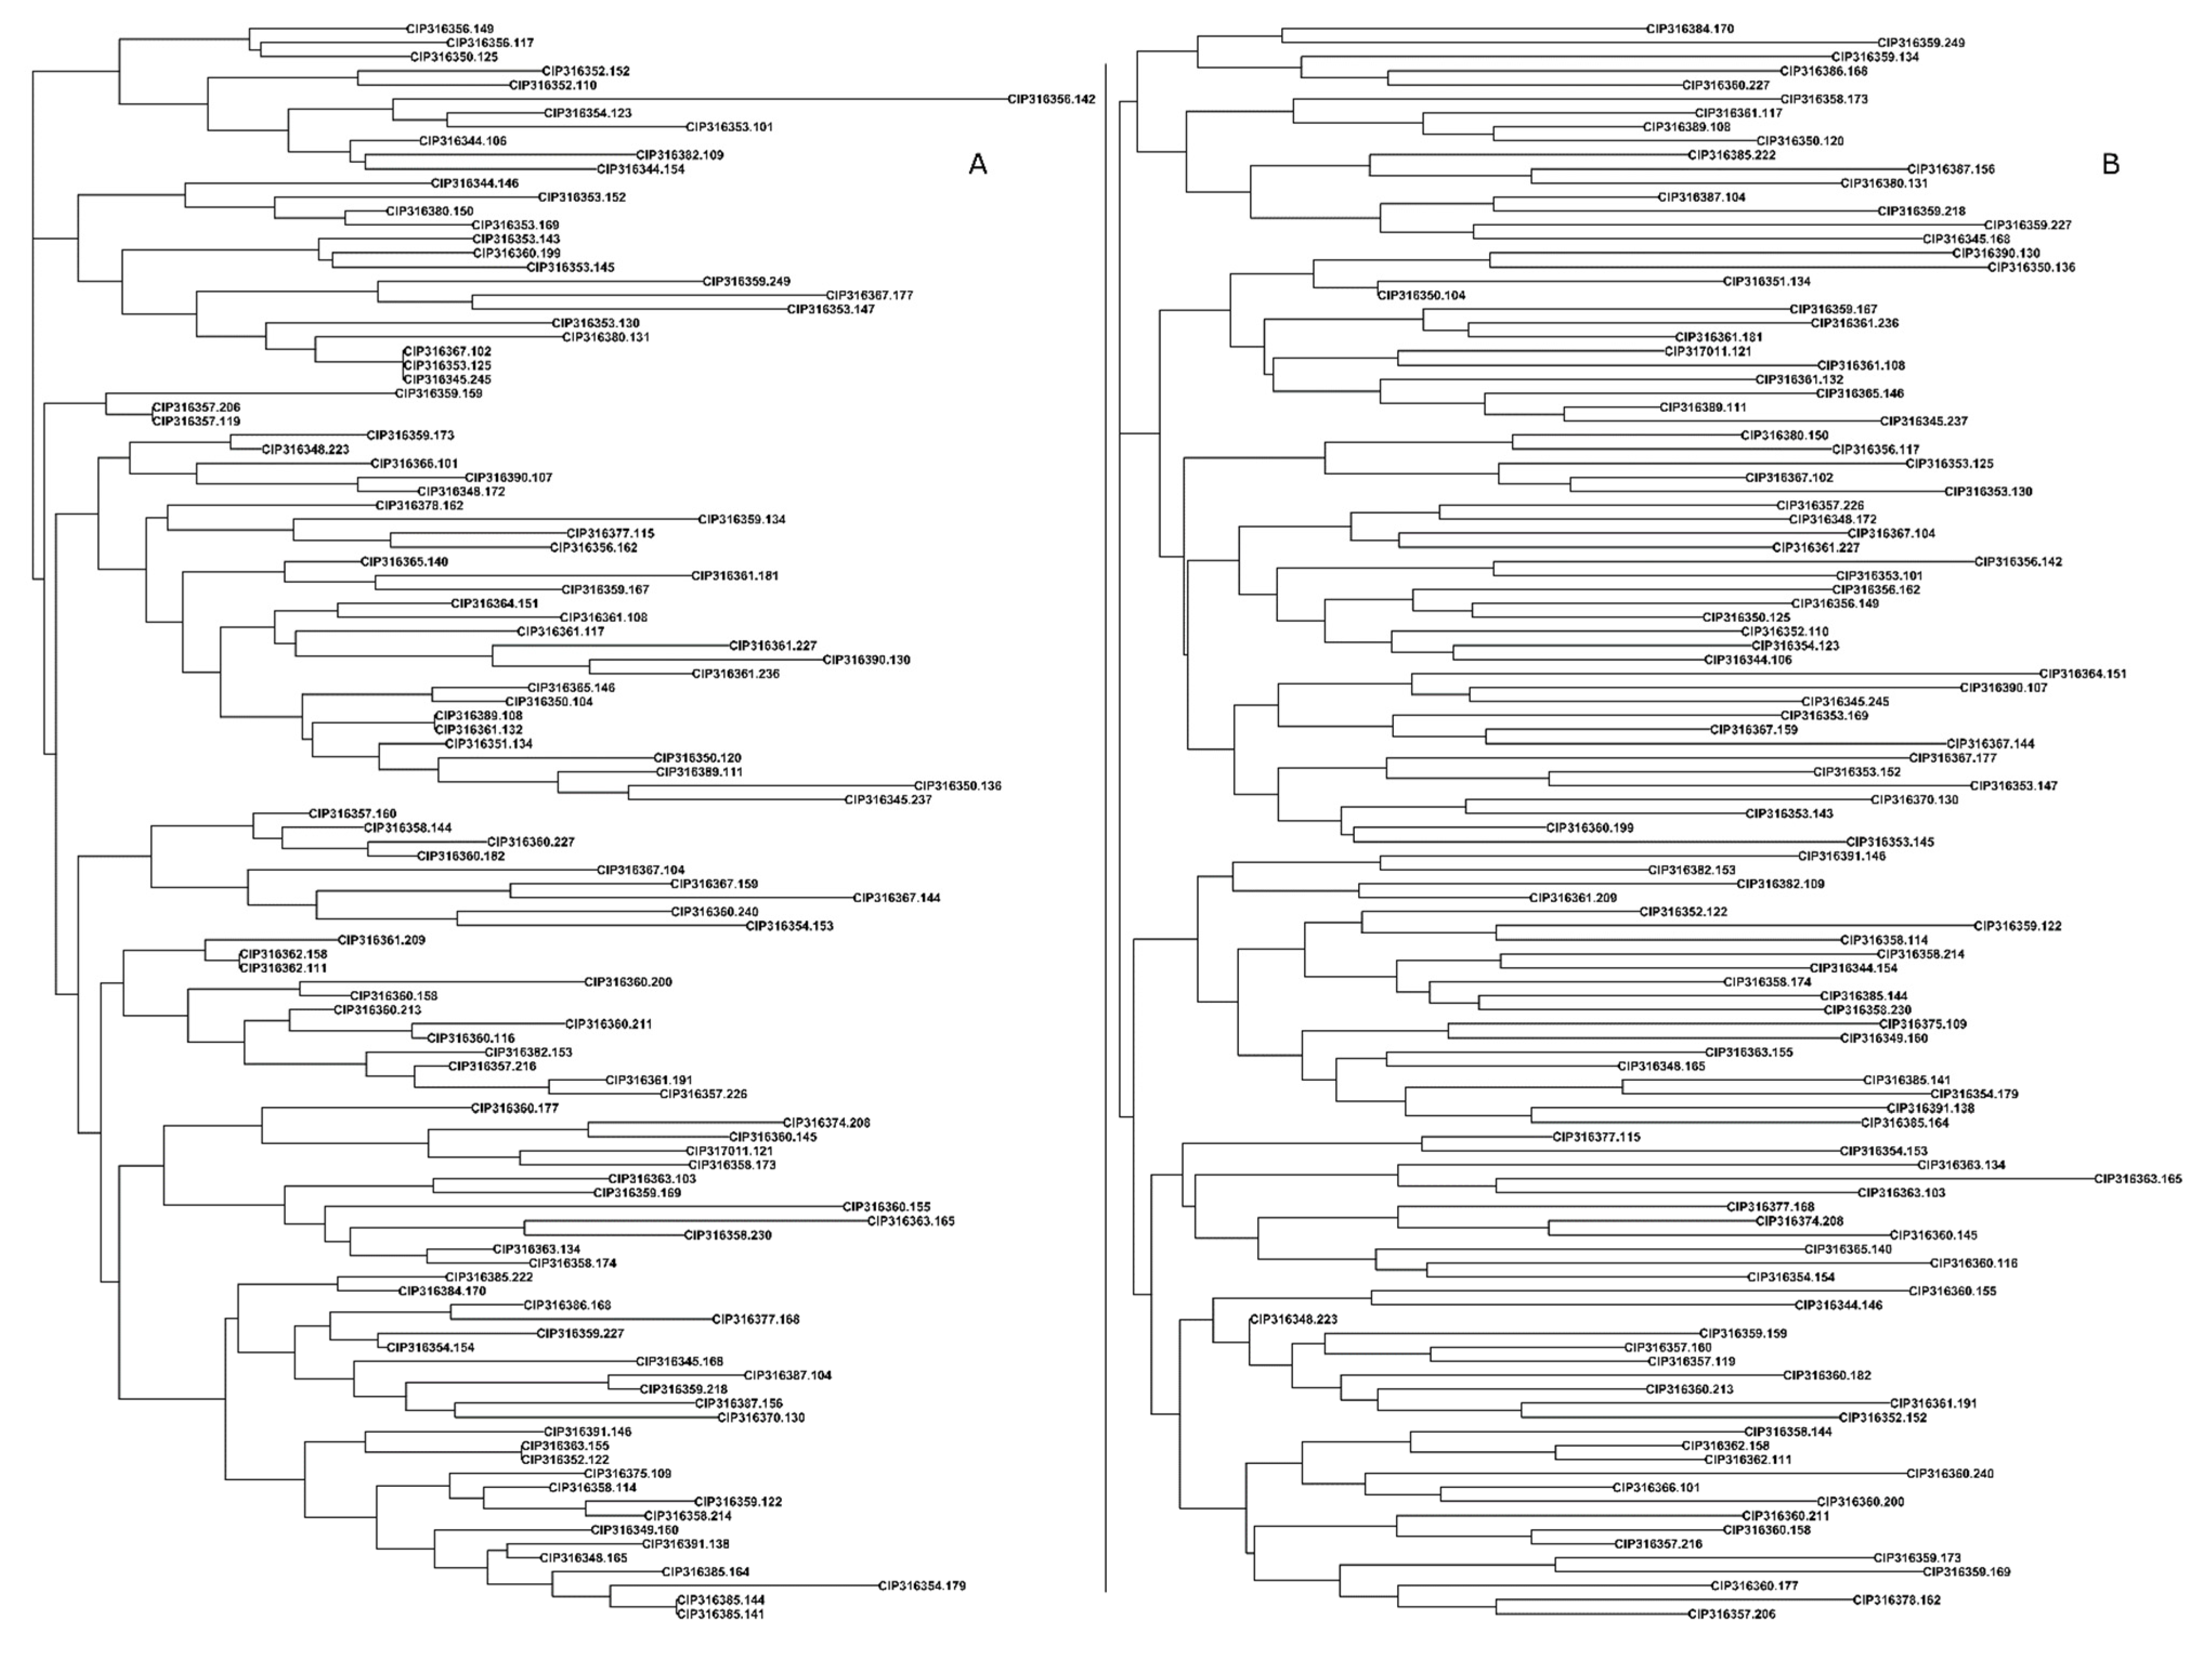
The phylogenic tree constructed using the diploid calls could not separate every two clones, whereas the tetraploid-based tree clearly differentiated all genotypes, including full-sibs and half-sibs (Figure 5). Although three markers could not be validated and another marker was removed due to missing data, by including the tetraploid allele dosage information for each marker–genotype combination, the levels of heterozygosity were increased. Therefore, three levels of heterozygosity could be obtained (simplex, duplex, and triplex), which allowed the separation of one-level diploid heterozygous samples. Further, half-sibs and full-sibs did not cluster together (Figure 5), indicating the good discrimination ability of the used markers, despite the relatively low number of used markers and the fact that one marker had been filtered out due to missing data. Therefore, such markers can be used for identity analysis and are expected to efficiently serve fingerprinting purposes. Although breeding at the polyploid level is complex [55,56], four alleles at each locus appear to be beneficial for QC analysis since few discriminatory markers are needed to efficiently separate the material. Lower amounts of data are generated, and fewer markers should contribute to a relatively lower QC genotyping cost (marker design and routine use) and datapoints per genotype (computation) as compared with diploid breeding material [57,58,59,60].

3.4. Discrepancy in Breeding Material Genetic Identity Revealed by QC Markers

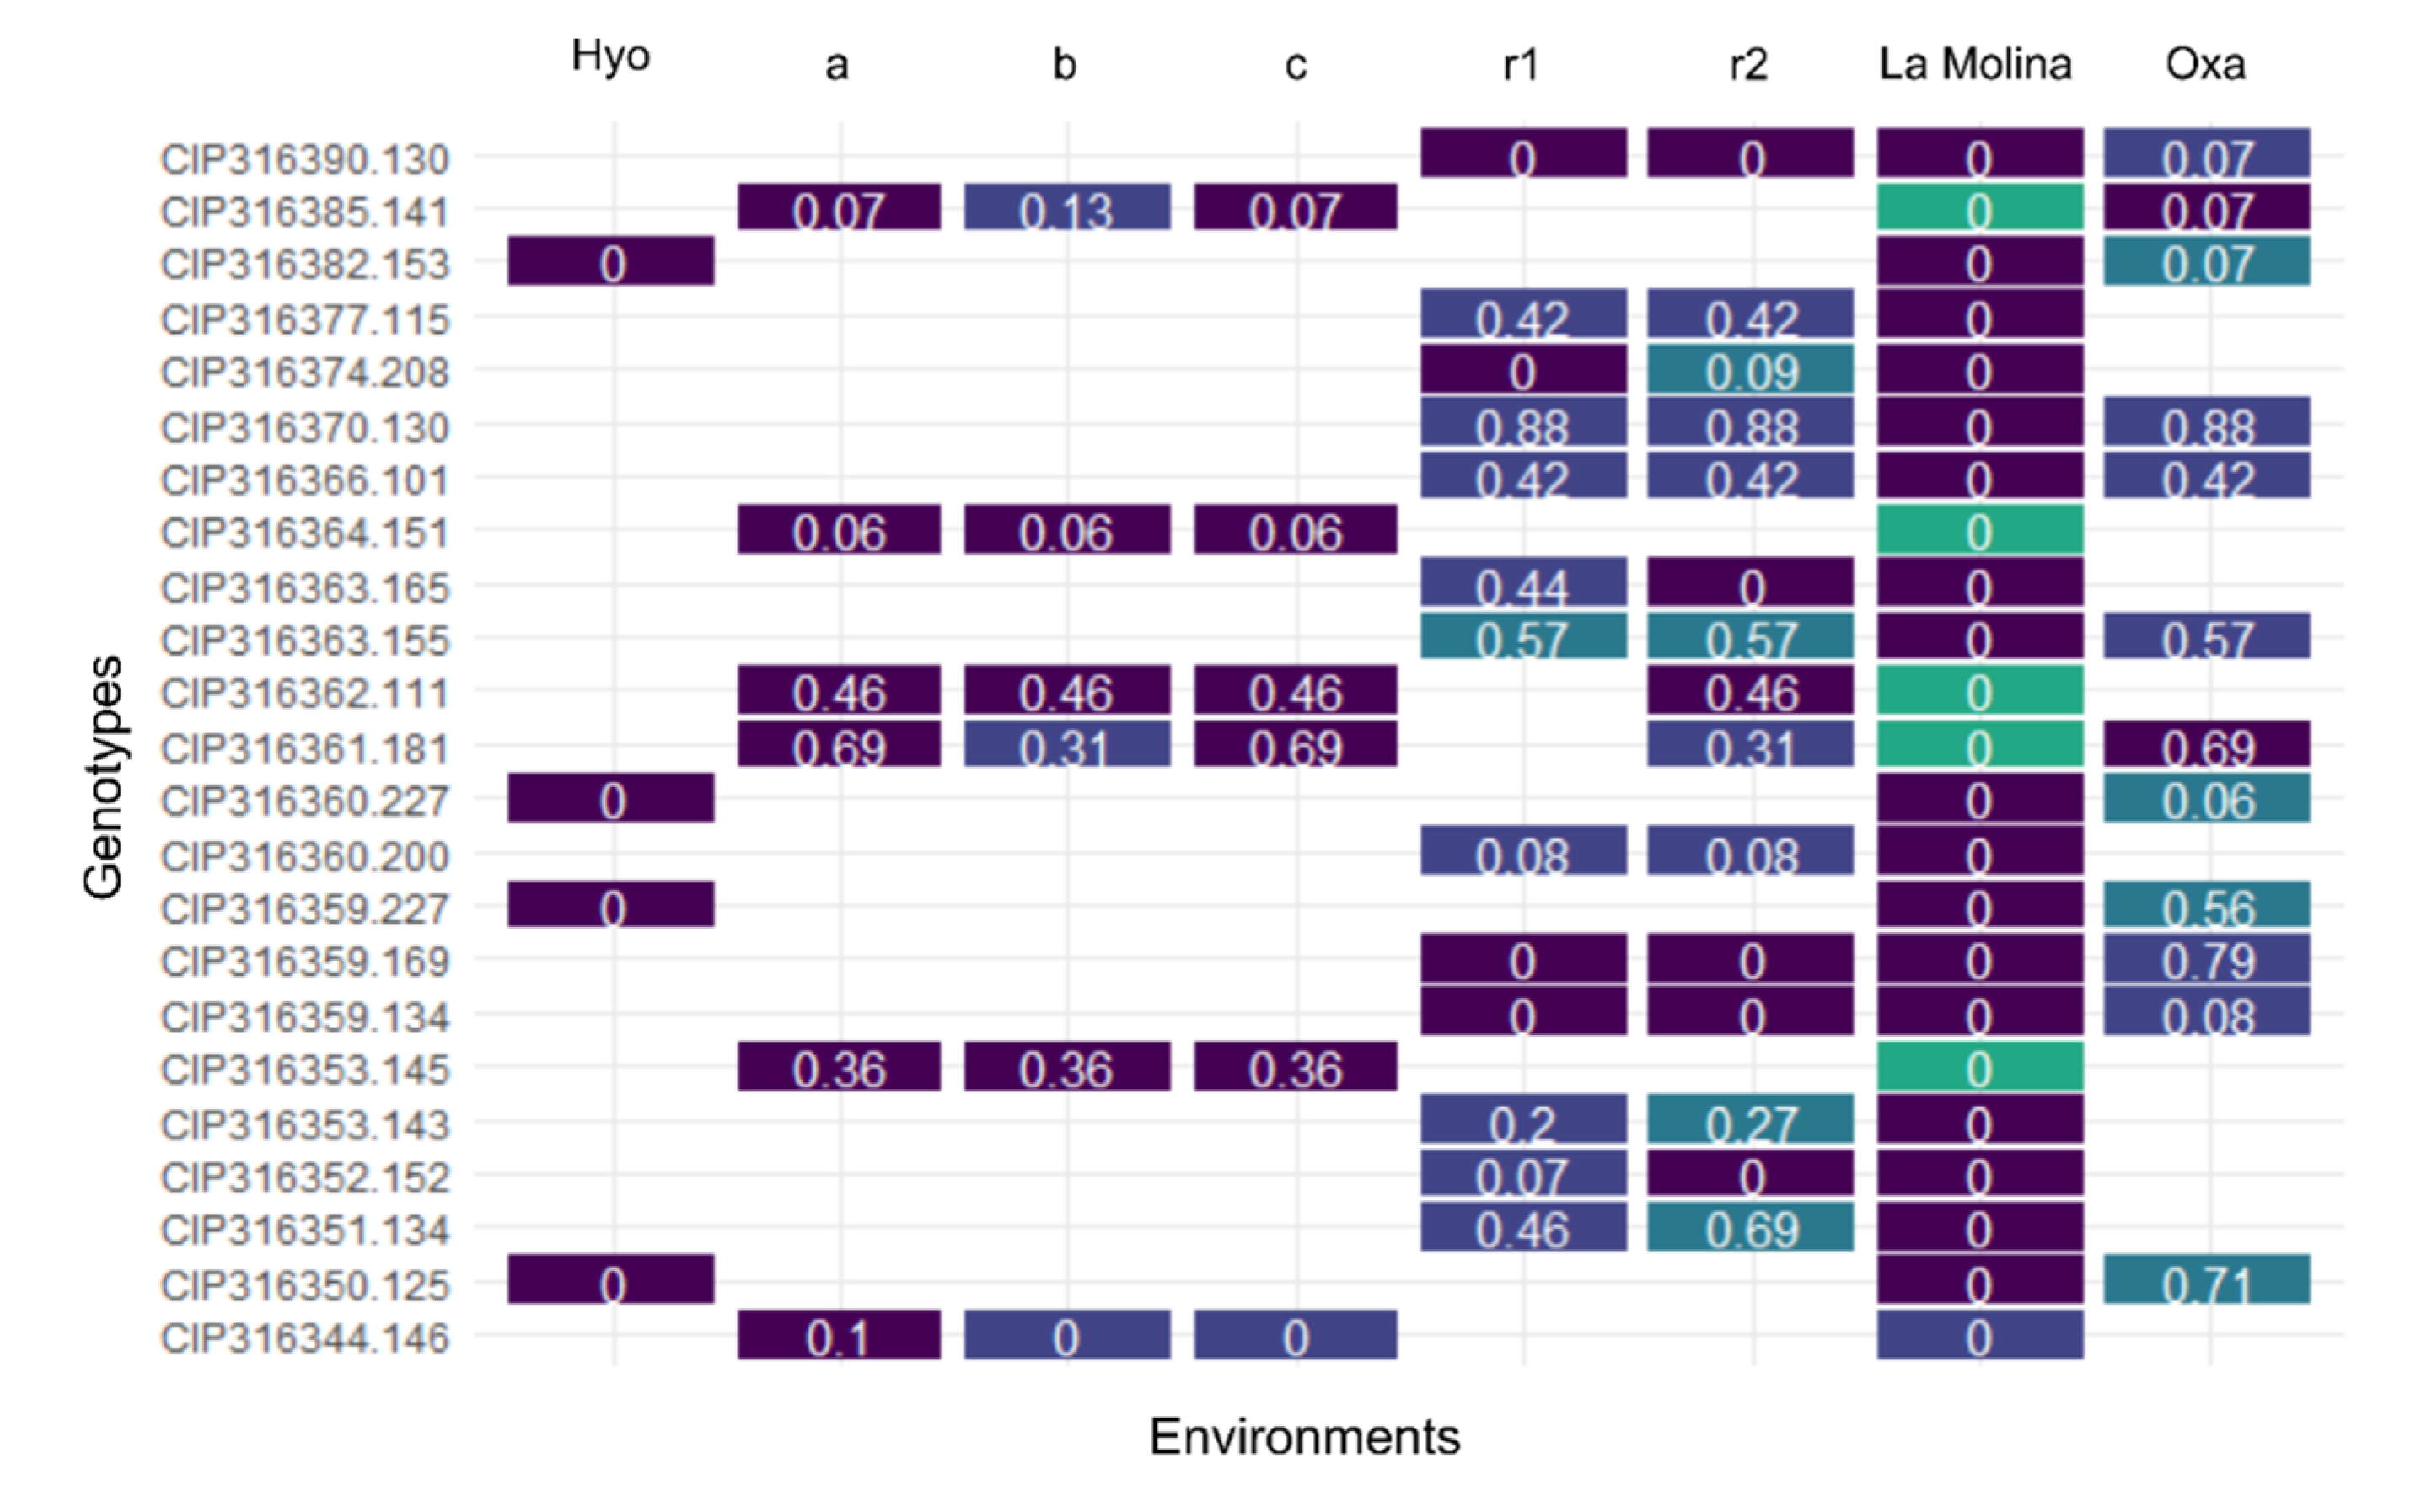
Considering the clones from the greenhouse as the reference genotypes, we found dissimilarities with clones from the preliminary and the intermediate trials as well as differences within the Huancayo intermediate trial (Figure 6). Among the 38 clones sampled in Oxapampa, 7 (18.4%) were different from the reference as compared with 25 of 224 samples (11.2%) in Huancayo. Within the Huancayo trial, seven sampled clones from the first replication were different from their respective greenhouse reference sample. There was intra-plot variation in 2 of the 17 plots where three samples were taken. Additionally, we found 2 dissimilarities with the 77 clones sampled in both replications of the Huancayo intermediate trail.
Mislabeled genotypes seem to occur with more frequency in breeding stages involving a large number of clones in the evaluation. Although mislabeled genotypes are common in vegetatively propagated crops and QC screening of all evaluated clones would increase operational costs, testing a subsample of the breeding material, if not all, at each stage of the breeding program and at the seed multiplication sites may be worthwhile for maximizing breeding outputs. The higher rate of mislabeled genotypes in the preliminary trial, as compared with the intermediate trial, could occur at any step, including seed multiplication, field operations, material sampling, and QC evaluation in the lab. Finding the problematic step or steps is an essential task for consistent selection and evaluation of breeding material throughout breeding cycles. Accurate clonal identity has important implications for the breeding progress since mislabeled clones can significantly affect the expected gains from breeding. Thus, the development of this QC marker set and its proper implementation in routine breeding programs is crucial and would be an effective strategy for reducing mislabeling and achieving targeted genetic gains. The threshold between the number of tested genotypes and the number of markers should be defined for each breeding program, taking into consideration genotyping costs and available implementation budget.

3.5. Routine Use of KASP Markers

SNP markers for late blight and PVY resistance, two important traits in potato, were successfully converted into KASP markers, which are amenable to application in a high throughput system. The dosage level for each marker can be computed, and selection of susceptible or simplex parents can be avoided to generate progenies with resistance to LB or PVY. More sources of resistance and markers for PVY and LB should be identified and introgressed into the breeding material, with the purpose of stacking several resistance genes with molecular-assisted selection. Identified resistance SNPs can be further incorporated in any targeted sequencing platform for more accurate genomic prediction.
The set of KASP markers tested and validated for quality control in the LBHT population may be suitable for the LTVR population. There is a need to define a QC analysis pipeline for routine use throughout the breeding cycle. Thousands of clones are tested in the early generations of a breeding program, and QC analysis may be a very costly activity. QC analysis on only a subset of a whole population will not reveal information about the untested clones. A mislabeled untested genotype can still be selected and, therefore, may show poor performance when the true tuber seeds (from multiplication plots) are used for subsequent field experiments. Although testing a subset of evaluated genotypes would be more efficient than not testing at all, for routine application, QC markers should be defined to include as many genotypes as possible. Systematic QC assessment of parental plants in crossing blocks, complemented by precocious crosses, is envisaged, though further analyses that test (and confirm) the abilities of the QC markers to assess parental purity in hybrids are needed.
Routine QC genotyping at all stages could be made possible by increasing genotyping budgets or reducing genotyping costs. Including QC markers in a targeted sequencing platform or selecting QC markers from such a platform and converting them into KASP markers could also reduce the long-term QC genotyping costs. When genotyping for genomic prediction in the early stages, the reference QC marker data would be generated from the targeted sequencing work, and KASP markers could be implemented in the QC test in the next stages. There must be maximal correspondence between these two marker-sets to allow a fair comparison. In any case, the KASP QC analysis could be a key molecular tool if applied at all stages of the breeding process that could contribute to more accurate selection of breeding products and, thus, increased genetic gains.
In the CIP potato breeding program, KASP marker assessment is outsourced and, thus, only minimal work is required for sample preparation. The turnaround time from sending the samples to Intertek® and receiving the genotyping results is approximately 14 days, which is more than sufficient to allow a decision based on the marker genotype before the next planting or crossing season. Therefore, the developed markers present great potential, and their implementation will be beneficial to breeding programs.

4. Conclusions

The KASP markers for Ryadg and late blight that were developed using different CIP breeding materials are valuable tools for a time-effective characterization of breeding material with a reduction in operational costs. Although further inclusion of identified loci into a targeted genotyping platform may increase prediction accuracy in a genomic selection program, testing more markers located in the putative gene regions on a specific germplasm is worthwhile. The selection accuracy can be increased with routine use of developed QC markers in the identity verification of evaluated clones or parental lines in crossing blocks. The trait and QC marker assessment can be directly implemented in breeding programs using the same germplasm base and seed multiplication fields as that of the CIP-developed varieties; for application in any other germplasm, the efficiency of developed markers should first be assessed.

Supplementary Materials

The following is available online at https://www.mdpi.com/article/10.3390/agronomy11112315/s1. Table S1: Quality evaluation of the PVY KASP markers compared with the original HRM assay. Table S2: Quality evaluation of the LB KASP markers compared with the original GBS or Solcap assay.

Author Contributions

Conceptualization, H.L.-K. and M.K.; methodology, H.L.-K. and M.K.; investigation: H.L.-K., M.K., and L.P.; validation, H.L.-K., L.P., and M.K.; formal analysis, H.L.-K., M.K., L.P., and M.D.; resources, L.P. and M.G.; writing—original draft preparation, M.K., H.L.-K., M.D., and L.P.; writing—review and editing, M.K. and H.L.-K.; visualization, M.K. and M.D.; funding acquisition, H.L.-K. All authors have read and agreed to the published version of the manuscript.

Funding

This research was funded from the CGIAR Research Program on Roots, Tubers, and Bananas (RTB), and USAID. The authors are thankful to the “Shared Industrial-Scale Low-Density SNP Genotyping for CGIAR and Partner Breeding Programs Serving SSA and SA” (High Throughput Genotyping—HTPG) BMGF funded project (OPP1130244) for genotyping support.

Acknowledgments

The authors would like to thank the cooperation of Petra van Roggen (Intertek), Eng Hwa Ng, Rajaguru Bohar, and Ana Luisa Garcia-Olivera of the Excellence in Breeding Module 3.

Conflicts of Interest

The authors declare no conflict of interest. The funders had no role in the design of the study; in the collection, analyses, or interpretation of data; in the writing of the manuscript, or in the decision to publish the results.

References

  1. Jansky, S.H.; Spooner, D.M. The Evolution of Potato Breeding. In Plant Breeding Reviews; Goldman, I., Ed.; John Wiley & Sons, Inc.: Hoboken, NJ, USA, 2018; Volume 41, pp. 169–214. [Google Scholar]
  2. Bonierbale, M.W.; Amoros, W.R.; Salas, E.; de Jong, W. Potato Breeding. In The Potato Crop; Hugo, C., Ortiz, O., Eds.; Springer International Publishing: Cham, Switzerland, 2020; pp. 163–217. [Google Scholar]
  3. Gemenet, D.C.; Kitavi, M.; David, M.; Ndege, D.; Ssali, R.T.; Swanckaert, J.; Makunde, G.; Yencho, G.C.; Gruneberg, W.; Carey, E.; et al. Development of diagnostic SNP markers for quality assurance and control in sweetpotato [Ipomoea batatas (L.) Lam.] breeding programs. PLoS ONE 2020, 15, e0232173. [Google Scholar] [CrossRef] [PubMed][Green Version]
  4. Lacomme, C.; Jacquot, E. General characteristics of Potato virus Y (PVY) and its impact on potato production: An overview. In Potato Virus Y: Biodiversity, Pathogenicity, Epidemiology and Management; Lacomme, C., Glais, L., Bellstedt, D., Dupuis, B., Karasev, A., Jacquot, E., Eds.; Springer International Publishing: Cham, Switzerland, 2017; ISBN 978-3-319-58858-2. [Google Scholar]
  5. Hooker, W. Compendium of Potato Diseases; Hooker, W., Ed.; American Phytopathological Society: St. Paul, MN, USA, 1981. [Google Scholar]
  6. Haverkort, A.J.; Struik, P.C.; Visser, R.G.F.; Jacobsen, E. Applied Biotechnology to Combat Late Blight in Potato Caused by Phytophthora Infestans. Potato Res. 2009, 52, 249–264. [Google Scholar] [CrossRef]
  7. Anderson, P.K.; Cunningham, A.A.; Patel, N.G.; Morales, F.J.; Epstein, P.R.; Daszak, P. Emerging infectious diseases of plants: Pathogen pollution, climate change and agrotechnology drivers. Trends Ecol. Evol. 2004, 19, 535–544. [Google Scholar] [CrossRef]
  8. Sastry, K.S.; Zitter, T.A. Ecology and Epidemiology of Virus and Viroid Diseases of Tropical Crops. In Plant Virus and Viroid Diseases in the Tropics; Springer: Dordrecht, The Netherlands, 2014. [Google Scholar]
  9. Fry, W.E.; Birch, P.; Judelson, H.S.; Grünwald, N.; Danies, G.; Everts, K.; Gevens, A.J.; Gugino, B.K.; Johnson, D.A.; Johnson, S.B.; et al. Five Reasons to Consider Phytophthora infestans a Reemerging Pathogen. Phytopathology 2015, 105, 966–981. [Google Scholar] [CrossRef] [PubMed][Green Version]
  10. Slater, A.T.; Cogan, N.O.I.; Hayes, B.; Schultz, L.; Dale, M.F.B.; Bryan, G.; Forster, J.W. Improving breeding efficiency in potato using molecular and quantitative genetics. Theor. Appl. Genet. 2014, 127, 2279–2292. [Google Scholar] [CrossRef] [PubMed]
  11. Ramakrishnan, A.P.; Ritland, C.E.; Sevillano, R.H.B.; Riseman, A. Review of Potato Molecular Markers to Enhance Trait Selection. Am. J. Potato Res. 2015, 92, 455–472. [Google Scholar] [CrossRef]
  12. Lal, M.; Sharma, S.; Yadav, S.; Kumar, S. Management of Late Blight of Potato. In Potato-From Incas to All Over the World; Yildiz, M., Ed.; IntechOpen: London, UK, 2018; pp. 83–106. ISBN 978-1-78923-255-4. [Google Scholar]
  13. Hannukkala, A.O.; Kaukoranta, T.; Lehtinen, A.; Rahkonen, A. Late-blight epidemics on potato in Finland, 1933?2002; increased and earlier occurrence of epidemics associated with climate change and lack of rotation. Plant Pathol. 2007, 56, 167–176. [Google Scholar] [CrossRef]
  14. Ortiz, O.; Winters, P.; Fano, H. La Percepción de los Agricultores sobre el Problema del Tizón Tardío o Rancha (Phytophthora infestans) su Manejo: Estudio de Casos en Cajamarca, Perú. Rev. Latinoam. Papa 2016, 11, 97–120. [Google Scholar] [CrossRef]
  15. Kasai, K.; Morikawa, Y.; A Sorri, V.; Valkonen, J.; Gebhardt, C.; Watanabe, K.N. Development of SCAR markers to the PVY resistance gene Ryadg based on a common feature of plant disease resistance genes. Genome 2000, 43, 1–8. [Google Scholar] [CrossRef]
  16. Brigneti, G.; Garcia-Mas, J.; Baulcombe, D.C. Molecular mapping of the potato virus Y resistance gene Rysto in potato. Theor. Appl. Genet. 1997, 94, 198–203. [Google Scholar] [CrossRef]
  17. Herrera, M.D.R.; Vidalon, L.J.; Montenegro, J.D.; Riccio, C.; Guzmán, F.; Bartolini, I.; Ghislain, M. Molecular and genetic characterization of the Ryadg locus on chromosome XI from Andigena potatoes conferring extreme resistance to potato virus Y. Theor. Appl. Genet. 2018, 131, 1925–1938. [Google Scholar] [CrossRef][Green Version]
  18. Song, Y.-S.; Schwarzfischer, A. Development of STS Markers for Selection of Extreme Resistance (Ry sto ) to PVY and Maternal Pedigree Analysis of Extremely Resistant Cultivars. Am. J. Potato Res. 2008, 85, 159–170. [Google Scholar] [CrossRef]
  19. Nie, X.; Sutherland, D.; Dickison, V.; Singh, M.; Murphy, A.M.; De Koeyer, D. Development and Validation of High-Resolution Melting Markers Derived from Rysto STS Markers for High-Throughput Marker-Assisted Selection of Potato Carrying Rysto. Phytopathology 2016, 106, 1366–1375. [Google Scholar] [CrossRef] [PubMed][Green Version]
  20. Fulladolsa, A.C.; Navarro, F.M.; Kota, R.; Severson, K.; Palta, J.P.; Charkowski, A.O. Application of Marker Assisted Selection for Potato Virus Y Resistance in the University of Wisconsin Potato Breeding Program. Am. J. Potato Res. 2015, 92, 444–450. [Google Scholar] [CrossRef]
  21. Ottoman, R.J.; Hane, D.C.; Brown, C.R.; Yilma, S.; James, S.R.; Mosley, A.R.; Crosslin, J.M.; Vales, M.I. Validation and Implementation of Marker-Assisted Selection (MAS) for PVY Resistance (Ry adg gene) in a Tetraploid Potato Breeding Program. Am. J. Potato Res. 2009, 86, 304–314. [Google Scholar] [CrossRef]
  22. Whitworth, J.L.; Novy, R.G.; Hall, D.G.; Crosslin, J.M.; Brown, C.R. Characterization of Broad Spectrum Potato Virus Y Resistance in a Solanum tuberosum ssp. andigena-Derived Population and Select Breeding Clones Using Molecular Markers, Grafting, and Field Inoculations. Am. J. Potato Res. 2009, 86, 286–296. [Google Scholar] [CrossRef]
  23. Bradshaw, J.E.; Bryan, G.J.; Ramsay, G. Genetic Resources (Including Wild and Cultivated Solanum Species) and Progress in their Utilisation in Potato Breeding. Potato Res. 2006, 49, 49–65. [Google Scholar] [CrossRef]
  24. Rodewald, J.; Trognitz, B. Solanumresistance genes againstPhytophthora infestansand their corresponding avirulence genes. Mol. Plant Pathol. 2013, 14, 740–757. [Google Scholar] [CrossRef] [PubMed]
  25. Karki, H.S.; Jansky, S.H.; Halterman, D.A. Screening of Wild Potatoes Identifies New Sources of Late Blight Resistance. Plant Dis. 2021, 105, 368–376. [Google Scholar] [CrossRef] [PubMed]
  26. Tiwari, J.K.; Siddappa, S.; Singh, B.P.; Kaushik, S.K.; Chakrabarti, S.K.; Bhardwaj, V.; Chandel, P. Molecular markers for late blight resistance breeding of potato: An update. Plant Breed. 2013, 132, 237–245. [Google Scholar] [CrossRef]
  27. Van Der Vossen, E.; Sikkema, A.; Hekkert, B.T.L.; Gros, J.; Stevens, P.; Muskens, M.; Wouters, D.; Pereira, A.; Stiekema, W.; Allefs, S. An ancientRgene from the wild potato speciesSolanum bulbocastanumconfers broad-spectrum resistance toPhytophthora infestansin cultivated potato and tomato. Plant J. 2003, 36, 867–882. [Google Scholar] [CrossRef]
  28. Stefańczyk, E.; Plich, J.; Janiszewska, M.; Smyda-Dajmund, P.; Sobkowiak, S.; Śliwka, J. Marker-assisted pyramiding of potato late blight resistance genes Rpi-rzc1 and Rpi-phu1 on di- and tetraploid levels. Mol. Breed. 2020, 40, 1–12. [Google Scholar] [CrossRef]
  29. Rakosy-Tican, E.; Thieme, R.; König, J.; Nachtigall, M.; Hammann, T.; Denes, T.-E.; Kruppa, K.; Molnár-Láng, M. Introgression of Two Broad-Spectrum Late Blight Resistance Genes, Rpi-Blb1 and Rpi-Blb3, From Solanum bulbocastanum Dun Plus Race-Specific R Genes Into Potato Pre-breeding Lines. Front. Plant Sci. 2020, 11, 699. [Google Scholar] [CrossRef]
  30. Ortiz, R. Genomic-Led Potato Breeding for Increasing Genetic Gains: Achievements and Outlook. Crop Breed. Genet. Genom. 2020, 2, e200010. [Google Scholar] [CrossRef]
  31. Junfeng The Potato Genome Sequencing Consortium Genome sequence and analysis of the tuber crop potato. Nat. Cell Biol. 2011, 475, 189–195. [CrossRef][Green Version]
  32. Sharma, S.K.; Bolser, D.; De Boer, J.; Sonderkaer, M.; Amoros, W.; Carboni, M.F.; D’Ambrosio, J.M.; De La Cruz, G.; Di Genova, A.; Douches, D.S.; et al. Construction of Reference Chromosome-Scale Pseudomolecules for Potato: Integrating the Potato Genome with Genetic and Physical Maps. G3 Genes Genomes Genet. 2013, 3, 2031–2047. [Google Scholar] [CrossRef][Green Version]
  33. Hardigan, M.A.; Crisovan, E.; Hamilton, J.; Kim, J.; Laimbeer, P.; Leisner, C.P.; Manrique-Carpintero, N.C.; Newton, L.; Pham, G.M.; Vaillancourt, B.; et al. Genome Reduction Uncovers a Large Dispensable Genome and Adaptive Role for Copy Number Variation in Asexually Propagated Solanum tuberosum. Plant Cell 2016, 28, 388–405. [Google Scholar] [CrossRef][Green Version]
  34. Pham, G.M.; Hamilton, J.P.; Wood, J.C.; Burke, J.T.; Zhao, H.; Vaillancourt, B.; Ou, S.; Jiang, J.; Buell, C.R. Construction of a chromosome-scale long-read reference genome assembly for potato. GigaScience 2020, 9, 9. [Google Scholar] [CrossRef] [PubMed]
  35. Rasheed, A.; Hao, Y.; Xia, X.; Khan, A.; Xu, Y.; Varshney, R.; He, Z. Crop Breeding Chips and Genotyping Platforms: Progress, Challenges, and Perspectives. Mol. Plant 2017, 10, 1047–1064. [Google Scholar] [CrossRef] [PubMed][Green Version]
  36. He, C.; Holme, J.; Anthony, J. SNP Genotyping: The KASP Assay. In Crop Breeding: Methods and Protocols, Methods in Molecular Biology; Springer: New York, NY, USA, 2014; Volume 1145, pp. 75–86. [Google Scholar]
  37. Semagn, K.; Babu, R.; Hearne, S.; Olsen, M. Single nucleotide polymorphism genotyping using Kompetitive Allele Specific PCR (KASP): Overview of the technology and its application in crop improvement. Mol. Breed. 2014, 33, 1–14. [Google Scholar] [CrossRef]
  38. Lindqvist-Kreuze, H.; De Boeck, B.; Unger, P.; Gemenet, D.; Li, X.; Pan, Z.; Sui, Q.; Qin, J.; Woldegjorgis, G.; Negash, K.; et al. Global multi-environment resistance QTL for foliar late blight resistance in tetraploid potato with tropical adaptation. G3 Genes Genomes Genet. 2021, 11, jkab251. [Google Scholar] [CrossRef]
  39. Lindqvist-Kreuze, H.; Gastelo, M.; Perez, W.; Forbes, G.A.; De Koeyer, D.; Bonierbale, M. Phenotypic Stability and Genome-Wide Association Study of Late Blight Resistance in Potato Genotypes Adapted to the Tropical Highlands. Phytopathology 2014, 104, 624–633. [Google Scholar] [CrossRef]
  40. Mihovilovich, E.; Aponte, M.; Bonierbale, M. Dataset for: Standard Evaluation Trial for Potato Virus Y 2018. Available online: https://doi.org/10.21223/P3/I0IRHA (accessed on 15 November 2018). [CrossRef]
  41. Mihovilovich, E.; Aponte, M.; Bonierbale, M.; Espinoza, J. Dataset for: Standard Evaluation Trial for Late Blight Resistance Documentation of CIP advanced Breeding Clones 2017. Available online: https://doi.org/10.21223/P3/ZYYGPX (accessed on 15 November 2018). [CrossRef]
  42. Gastelo, M.; Diaz, L.; Landeo, J.A.; Bonierbale, M. New elite potato clones with heat tolerance, late blight and virus resistance to address climate change. In Potato and Sweetpotato in Africa: Transforming the Value Chains for Food and Nutrition Security; Low, J., Nyongesa, M., Quinn, S., Parker, M., Eds.; CAB International: Wallingford, UK, 2015; pp. 133–154. ISBN 9781780644202. [Google Scholar]
  43. Felcher, K.J.; Coombs, J.J.; Massa, A.N.; Hansey, C.N.; Hamilton, J.; Veilleux, R.E.; Buell, C.R.; Douches, D.S. Integration of Two Diploid Potato Linkage Maps with the Potato Genome Sequence. PLoS ONE 2012, 7, e36347. [Google Scholar] [CrossRef][Green Version]
  44. Landeo, J. Breeding for horizontal resistance to late blight in potato free of R genes. In Control Integrado de las Principales Enfermedades Fungosas de la Papa; Seminario taller: Bellavista, Colombia, 1993; pp. 85–92. [Google Scholar]
  45. Fumagalli, M. Assessing the Effect of Sequencing Depth and Sample Size in Population Genetics Inferences. PLoS ONE 2013, 8, e79667. [Google Scholar] [CrossRef] [PubMed][Green Version]
  46. Crawford, J.E.; Lazzaro, B.P. Assessing the Accuracy and Power of Population Genetic Inference from Low-Pass Next-Generation Sequencing Data. Front. Genet. 2012, 3, 66. [Google Scholar] [CrossRef][Green Version]
  47. Maruki, T.; Lynch, M. Genotype Calling from Population-Genomic Sequencing Data. G3 Genes Genomes Genet. 2017, 7, 1393–1404. [Google Scholar] [CrossRef][Green Version]
  48. Warnes, G.; Gorjanc, G.; Leisch, F.; Man, M. Package Genetics-Population Genetics 2012. Available online: https://cran.r-project.org/web/packages/genetics/index.html (accessed on 15 December 2019).
  49. Team, R.C. A Language and Environment for Statistical Computing 2021. Available online: https://www.R-project.org/ (accessed on 5 June 2021).
  50. Voorrips, R.; Gort, G. fitTetra: FitTetra is an R Package for Assigning Tetraploid Genotype Scores 2013. Available online: https://cran.r-project.org/package=fitTetra (accessed on 21 January 2021).
  51. Paradis, E.; Schliep, K. ape 5.0: An environment for modern phylogenetics and evolutionary analyses in R. Bioinformatics 2018, 35, 526–528. [Google Scholar] [CrossRef] [PubMed]
  52. Caruana, B.; Rodoni, B.; Constable, F.; Slater, A.; Cogan, N. Genome Enhanced Marker Improvement for Potato Virus Y Disease Resistance in Potato. Agronomy 2021, 11, 832. [Google Scholar] [CrossRef]
  53. Forbes, G.; Perez, W.; Andrade-Piedra, J. Field Assessment of Resistance in Potato to Phytophthora infestans: International Cooperators Guide; International Potato Center: Lima, Peru, 2014. [Google Scholar]
  54. Gopal, J.; Singh, B.P. Screening potatoes for resistance to late blight (Phytophthora infestans) under field conditions. Potato Res. 2003, 46, 47–56. [Google Scholar] [CrossRef]
  55. Douches, D.S.; Maas, D.; Jastrzebski, K.; Chase, R.W. Assessment of Potato Breeding Progress in the USA over the Last Century. Crop. Sci. 1996, 36, 1544–1552. [Google Scholar] [CrossRef]
  56. Wricke, G.; Weber, E. Quantitative Genetics and Selection in Plant Breeding; Walter de Gruyter: Berlin, Germany, 1986; ISBN 978-3-11-007561-8. [Google Scholar]
  57. Semagn, K.; Beyene, Y.; Makumbi, D.; Mugo, S.; Prasanna, B.M.; Magorokosho, C.; Atlin, G. Quality control genotyping for assessment of genetic identity and purity in diverse tropical maize inbred lines. Theor. Appl. Genet. 2012, 125, 1487–1501. [Google Scholar] [CrossRef]
  58. Ertiro, B.T.; Ogugo, V.; Worku, M.; Das, B.; Olsen, M.; Labuschagne, M.; Semagn, K. Comparison of Kompetitive Allele Specific PCR (KASP) and genotyping by sequencing (GBS) for quality control analysis in maize. BMC Genom. 2015, 16, 1–12. [Google Scholar] [CrossRef] [PubMed][Green Version]
  59. Chen, J.; Zavala, C.; Ortega, N.; Petroli, C.; Franco, J.; Burgueño, J.; Costich, D.E.; Hearne, S.J. The Development of Quality Control Genotyping Approaches: A Case Study Using Elite Maize Lines. PLoS ONE 2016, 11, e0157236. [Google Scholar] [CrossRef] [PubMed]
  60. Ndjiondjop, M.N.; Semagn, K.; Zhang, J.; Gouda, A.C.; Kpeki, S.B.; Goungoulou, A.; Wambugu, P.; Drame, K.N.; Bimpong, I.K.; Zhao, D. Development of species diagnostic SNP markers for quality control genotyping in four rice (Oryza L.) species. Mol. Breed. 2018, 38, 1–13. [Google Scholar] [CrossRef] [PubMed][Green Version]
Figure 1. Workflow for KASP marker development and validation from association analysis or SNP marker selection. QTL, quantitative trait loci; GWAS, genome-wide association study; Concentrations, two different DNA concentrations (standard and diluted), whereby results from the two concentrations allow for the determination of the assay’s stability and, therefore, sensitivity to DNA concentration; SNP, single nucleotide polymorphism; PCN, potato cyst nematodes.
Agronomy 11 02315 g001
Figure 2. Selection pipeline of quality control markers. There were 3285 initial SolCAP markers that had no missing data. GS, genomic selection; KASP, kompetitive allele specific PCR; LBHT, late blight heat tolerance population; LD, linkage disequilibrium; LTVR, lowland tropics virus resistant population; MAF, minor allele frequency.
Agronomy 11 02315 g002
Figure 3. Count of resistant and susceptible samples (n = 58) in the LBHT population with the late blight and Ryadg KASP markers.
Agronomy 11 02315 g003
Figure 4. Boxplots of the phenotypic evaluation for late blight resistance of 59 clones of the LBHT (A,B), 43 clones, and the LBHT × LTVR (C,D), 16 clones, breeding populations, separated according to snpST0020 and snpST0023 genotypes. The phenotypic data were recorded from the field and screenhouse experiments for the LBHT and LBHT × LTVR, respectively (see Materials and Methods).
Agronomy 11 02315 g004
Figure 5. Neighbor joining tree constructed with 114 clones from La Molina greenhouse and 20 QC KASP markers with diploid (A) and tetraploid (B) calls. Elements before the dot sign represent the family identification.
Agronomy 11 02315 g005
Figure 6. Proportion of dissimilarity between samples of clones taken from Hyo and Oxapampa and their corresponding reference genotypes grown in the greenhouse at La Molina. Among 114 samples, only those with at least one difference as compared with the La Molina samples were represented. Different colors in the same row denote a somewhat genetic distance (see Materials and Methods) between samples of the same clone. Environments are the locations or any specification within the Huancayo location where the samples were taken. Hyo, Huancayo intermediate trial, samples were taken from the first replication alone; a, b, and c represent the three samples taken within random plots in the first replication of Hyo; r1 and r2 denote the two different replications in Hyo; Oxa, the Oxapampa preliminary trial.
Agronomy 11 02315 g006
Table 1. List of KASP markers validated for late blight R8-QTL and PVY Ryadg resistance, the allele variants, and their position in the DM_v6.1 potato genome assembly are indicated. Alleles in bold denote the favorable allele that confers resistance.
SNP IDIntertek IdGene/QTLReference SequenceChromosomePosition
S9_61261167snpST00020R8-QTLtgaaggtattcatttttctgatgaaatgcattcctggacttttcttcatc[a/c]tgtttgggcgctctttgtacaggacatgcattgctgttttctccccccca967380076
solcap_snp_c2_56418snpST00023R8-QTLggatactgtcgcaatggttgttgcaacggcaataactatgagtgctatag[t/g]tgctgttaattatggggagcaataaatatttgtaatggcaaagatgtaat966379267
M6F1R4_711snpST00052Ryadgaaacatgagctactcggggtcaccacttaacaaagattttagttagataa[g/a]gacagaatacaaaatccactaactatcacatttatcacggatgggttcca112499608
M6F1R4_817snpST00073Ryadgacgtgctaactagttagggattcaaattcaagattgtattaaacccggat[a/g]tacatatacagggaagctttaaccacacatgcaaggttcagatatcca112499502
Table 2. Counts of genotypes and samples used for the QC assessment; r1 and r2 denote the first and the second replication of the Huancayo intermediate trial, respectively.
La MolinaHuancayoOxapampaTotal
Total samples (number of clones)114 (114)224 (114)38 (38)376 (114)
r1 samples 96
r2 samples 77
r1 within plot samples 17
Table 3. Quality evaluation of the single nucleotide polymorphism (SNP) markers converted into the kompetitive allele specific PCR (KASP) system. Markers selected for breeding are indicated with an asterisk. SNP ID is the identification in the Intertek potato KASP marker system.
SNP IDMarker NameLocation Concordance
Late blight resistance
snpST0010GBS_S9_58779951Chr9: 5877995193%
snpST0012GBS_S9_59226671Chr9: 592266710%
snpST0013GBS_S9_59301204Chr9: 5930120492%
snpST0014GBS_S9_59997331Chr9: 5999733195%
snpST0015GBS_S9_60067335Chr9: 6006733595%
snpST0016GBS_S9_60225630Chr9: 6022563071%
snpST0017GBS_S9_60510506Chr9: 6051050690%
snpST0018GBS_S9_61095507Chr9: 6109550793%
snpST0019GBS_S9_61205320Chr9: 612053200%
snpST0020*GBS_S9_61261167Chr9: 6126116799%
snpST0023*solcap_snp_c2_56418Chr9: 6018293097%
PVY resistance
snpST0049M6F1R4_672Chr:11: 17082900%
snpST0050M6F1R4_679Chr:11: 170829750%
snpST0051M6F1R4_691Chr:11: 170830945%
snpST0052*M6F1R4_711Chr11: 1708329100%
snpST0053M6F1R4_732Chr11: 170835074%
snpST0054M6F1R4_739Chr11: 170835755%
snpST0071M6F1R4_797Chr11: 170841599%
snpST0072M6F1R4_798Chr11: 17084160%
snpST0073*M6F1R4_817Chr11: 1708435100%
† Position on the Solanum tuberosum group Phureja DM1-3 PGSC v4.03 pseudomolecules; ‡ % of concordance between original marker and KASP marker.
Table 4. Assay verification of the PVY Ryadg (snpST00052 and snpST00073) and late blight (snpST00020 and snpST00023) KASP markers tested on three samples of the CIP breeding program.
Marker IDTraitNumber of Clonesαβs
snpST00052PVY780.00.160.83
snpST00073PVY780.00.160.83
snpST00020Late blight730.020.130.88
snpST00023Late blight770.220.350.65
α, β, and s are false positive rate, false negative rate, and assay power, respectively.
Publisher’s Note: MDPI stays neutral with regard to jurisdictional claims in published maps and institutional affiliations.